Principles of Vibrations
42
Principles of Vibrations
Transcript of Principles of Vibrations

Principles of Vibrations

What is Vibration?
– Vibration is the motion of a body about a
reference position caused by a force
In simple terms vibration is :-
– ‘A response to some form of excitation’.
– The free movement of shaft in a journal
bearing will cause it to vibrate when a
‘forcing function’ is applied

Why do we care about vibration?
Increased Stresses on Machine Components
Risk of fatigue
Increased Load on Bearings Reduced bearing life.
Higher Forces on Mountings Loosening of foundation damage to supporting structure.
Wastage of Energy Economics
Noise Generation Produce discomfort

Vibration in Every Day Life
Vibration is an every day phenomenon, everyone
experience in his daily life.

Useful Vibration
– Vibration is not always destructive, but have some useful applications
and is produced intentionally sometimes.
• Heavy drill machines
• Concrete compactors
• Mobile phones
• Massagers
• Component feeders
• Ultrasonic cleaning baths

General Description-Vibration– There are many different parameters we can measure to help us
determine machinery health:
Voltage Current Power Flow TempPressure Torque Speed Viscosity Density
– None contains as much information as the vibration signature!!!
• Not only does it provide the severity of the problem but can also pointto the source of the problem
• ‘Vibration’ can be simply stated as ‘A response to some form ofexcitation’
• The ‘excitation’ is generally referred to as the ‘Forcing Function’• Vibration is the motion of a body about a reference position caused by
a force

General Description – Forcing Function
– When a forcing function is applied
to a shaft within a plain bearing the
free movement will cause the shaft
to vibrate within the bearing
• Here we are measuring actual shaft
movement
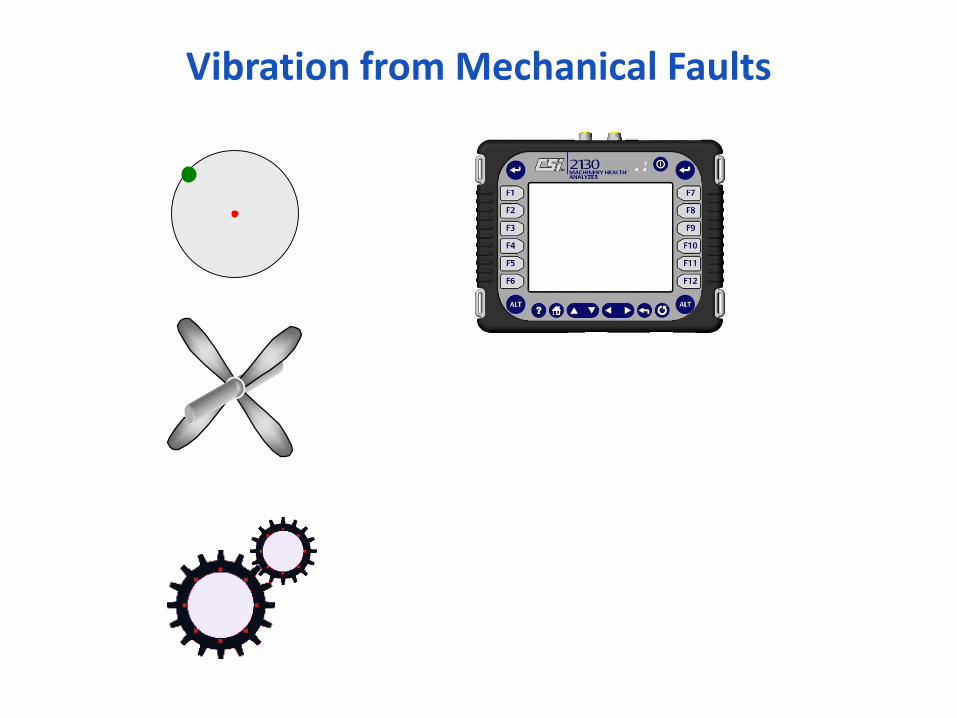
Vibration from Mechanical Faults

Vibration from Mechanical Faults

Vibration from Mechanical Faults

Vibration from Mechanical Faults

Vibration from Mechanical Faults

Vibration from Mechanical Faults

Vibration Characteristics
Amplitude How Much
Frequency How Often
Phase. When

Amplitude is the measure of magnitude of vibration:
Peak to Peak - the distance from the top of the positive peak to bottom of the negative peak.
Peak - the measurement from the zero line to the top of the positive peak.
Average (AVG) - 0.637 of peak.
Root Mean Square (RMS) - 0.707 of peak.
Vibration Amplitude

General Description – Measuring Response
– You can also look at vibration as the amount of ‘Time’ it takes tocomplete a particular cycle
• If we examine the motion of a forcing function on a fan blade ‘HeavySpot’ over a period of time a distinct signature will occur.
– This motion is called a sinewave.
• The horizontal axis ismeasuring Time
• The vertical axis is measuringAmplitude
– This is known as a ‘TimeWaveform’
• Amplitude versus Time

Time Waveforms
– Unfortunately there are multiple sources of forcing functions thatcan emit from a machine or component.
• Thus resulting in the time waveform becoming complex in nature
– The plot shown on theright is a complex timewaveform.
• Amplitude versus Time
– This is just one format(domain) for analysingvibration data.
– Data can also be analysedin a ‘Spectrum’ (AmplitudeVs Frequency) through aprocess known as the FFT
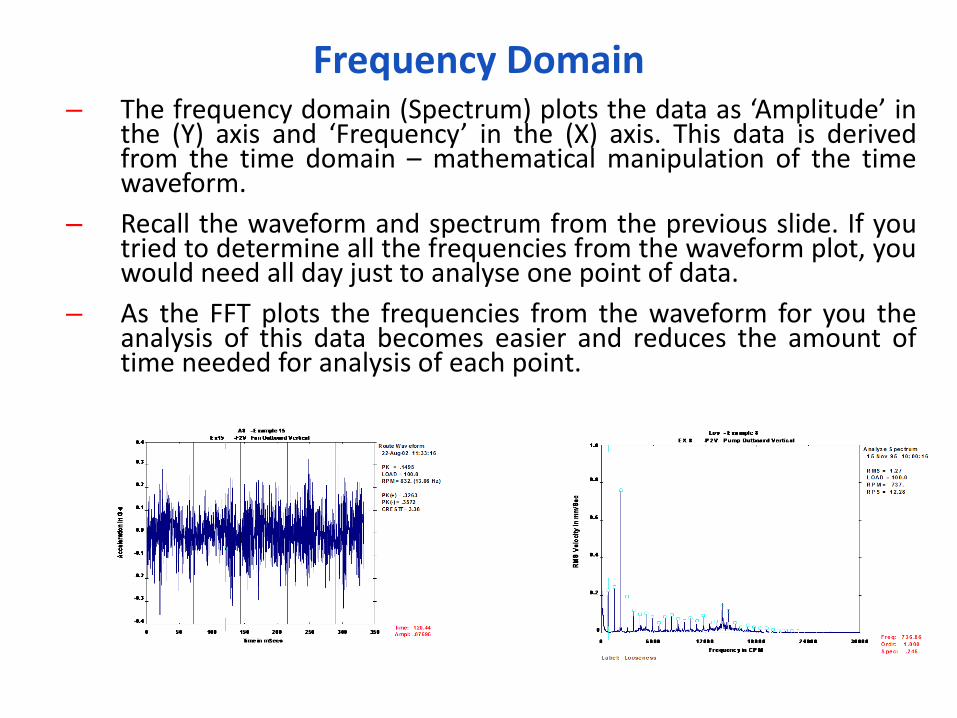
Frequency Domain– The frequency domain (Spectrum) plots the data as ‘Amplitude’ in
the (Y) axis and ‘Frequency’ in the (X) axis. This data is derivedfrom the time domain – mathematical manipulation of the timewaveform.
– Recall the waveform and spectrum from the previous slide. If youtried to determine all the frequencies from the waveform plot, youwould need all day just to analyse one point of data.
– As the FFT plots the frequencies from the waveform for you theanalysis of this data becomes easier and reduces the amount oftime needed for analysis of each point.

Fast Fourier Transform – FFT Process
– When a problem starts to develop within a rotating component itwill generate a vibration signature. This signature should becaptured in the time waveform
• Distinguishing that signature can be very difficult when looking at atime plot
– To understand the problem we need to understand the frequency
• ‘How often is it occurring?’
– The ‘FFT’ is a process that determines the frequency of a signalfrom a time waveform.
– The FFT is named after an 18th century mathematician named‘Jean Baptise Joseph Fourier’. He established:
• ‘Any periodic signal can be represented as a series of sines andcosines’.
• Meaning if you take a time waveform and mathematically calculatethe vibration frequency, it can be converted to a more familiar format

Vibration Spectrum
– Raw vibration signal is rarely sinusoidal and forms a complex
waveform.
– Total vibration signal is actually made up of smaller waveforms,
having varying frequencies
– Each of these individual waveform add up algebraically to one
another to generate total waveform.
– Vibration spectrum transforms the complex vibration signal in time-
domain in clearly defined spectral lines in frequency domain & this is
done by FFT.

Am
pli
tud
e
How the Vibration Spectrum is Created
Time
Am
plitu
de
Am
pli
tud
e

Fast Fourier Transform (FFT) Spectrum
– Fourier proved that any real world complex waveform can be
separated into simple sinusoidal waveform components
– As the sine waves are separated from combined waveform they
are converted into vertical peaks which have an amplitude & a
position along frequency axis.
– Frequency domain presentation of time waveform is called a
vibration spectrum or FFT spectrum.
22Frequency
1x 2X3X

Time(H) - Input
Working : Input : Input : FFT Analyzer
0 100m 200m 300m 400m
- 40
0
40
[s]
[m/s²] Time(H) - Input
Working : Input : Input : FFT Analyzer
0 100m 200m 300m 400m
- 40
0
40
[s]
[m/s²]
Autospectrum(H) - Input
Working : Input : Input : FFT Analyzer
0 400 800 1.2k 1.6k 2k
0
1
2
3
4
[Hz]
[m/s²] Autospectrum(H) - Input
Working : Input : Input : FFT Analyzer
0 400 800 1.2k 1.6k 2k
0
1
2
3
4
[Hz]
[m/s²]
Raw Signal (Amplitude vs. Time)
FFT (Amplitude vs. Frequency)
Fast Fourier Transform (FFT) spectrum (Contd.)
23

Overall Vibration
– Summation of all vibrations present in the spectrum
RSS = Root Sum Square Level (energy summation) in Spectrum.
n = Number of FFT lines of Resolution
Ai = Amplitude of each FFT line.
NBF = Noise Band Width 1.5 for Hanning Window
24
...5.1
1 2
3
2
2
2
11
2
AAAN
A
RBF
n
i
i
SS

Measuring Amplitude and Frequency
– You can measure amplitude from a time waveform as shown:
– The period ‘t’ is the time required for one revolution of the shaft in
this illustration, which equals one cycle of the waveform
• During this period, the amplitude of the waveform reaches a positive(+) peak, returns to rest, and reaches a negative (-) peak beforereturning to rest
-A
mp
litu
de
+
Time ‘t’
Peak to Peak
0 to Peak
RMS
Average

Measuring Amplitude and Frequency
• Severity of a vibration problem can be determined by the amplitude of the vibration.
• We can measure amplitude in one of three ways1. Displacement – measures the distance the shaft moves in relation
to a reference point.2. Velocity – measures the displacement of the shaft in relation to
time3. Acceleration – measures the change in velocity in relation to time
• The most common industrial applications are:1. Displacement - Microns - Peak to Peak value2. Velocity - mm/sec - RMS
3. Acceleration - G-s - Peak value
– G-s = 1 x force of gravity (G-force)
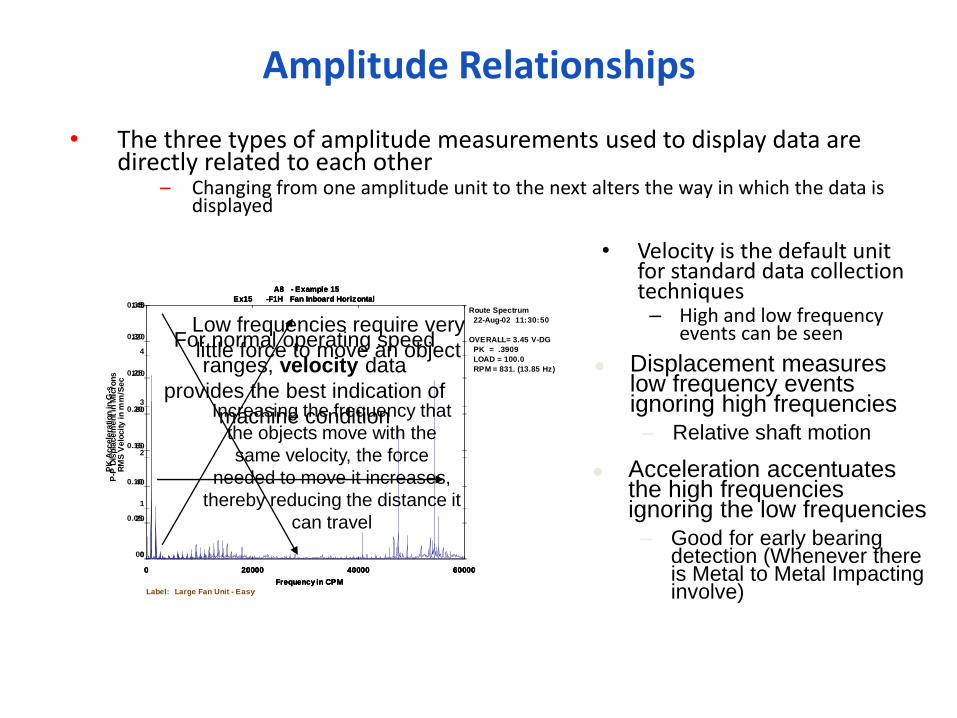
Amplitude Relationships
• The three types of amplitude measurements used to display data are directly related to each other
– Changing from one amplitude unit to the next alters the way in which the data is displayed
• Velocity is the default unit for standard data collection techniques
– High and low frequency events can be seen
A8 - Example 15
Ex15 -F1H Fan Inboard Horizontal
Label: Large Fan Unit - Easy
Route Spectrum
22-Aug-02 11:30:50
OVERALL= 3.45 V-DG
RMS = 3.44
LOAD = 100.0
RPM = 831. (13.85 Hz)
0 20000 40000 60000
0
1
2
3
4
5
Frequency in CPM
RM
S V
elo
city in m
m/S
ec
For normal operating speed
ranges, velocity data
provides the best indication of
machine condition
A8 - Example 15
Ex15 -F1H Fan Inboard Horizontal
Label: Large Fan Unit - Easy
Route Spectrum
22-Aug-02 11:30:50
OVERALL= 3.45 V-DG
P-P = 104.98
LOAD = 100.0
RPM = 831. (13.85 Hz)
0 20000 40000 60000
0
20
40
60
80
100
120
140
Frequency in CPM
P-P
Dis
pla
cem
ent in
Mic
rons
Low frequencies require very
little force to move an object
A8 - Example 15
Ex15 -F1H Fan Inboard Horizontal
Label: Large Fan Unit - Easy
Route Spectrum
22-Aug-02 11:30:50
OVERALL= 3.45 V-DG
PK = .3909
LOAD = 100.0
RPM = 831. (13.85 Hz)
0 20000 40000 60000
0
0.05
0.10
0.15
0.20
0.25
0.30
0.35
Frequency in CPM
PK
Accele
ration in G
-s
Increasing the frequency that
the objects move with the
same velocity, the force
needed to move it increases,
thereby reducing the distance it
can travel
Displacement measures low frequency events ignoring high frequencies
– Relative shaft motion
Acceleration accentuates the high frequencies ignoring the low frequencies
– Good for early bearing detection (Whenever there is Metal to Metal Impacting involve)

Upper Limit
Mean Position
Lower Limit
RMS
Peak Peak to Peak
Multiply Number →
BYTo Obtain ↓
PEAK –
PEAKPEAK RMS
PEAK-PEAK 1.000 2.000 2.828
PEAK 0.500 1.000 1.414
RMS 0.354 0.707 1.000
Vibration Amplitude (Contd.)
28

Displacement, Velocity & Acceleration Conversion Formulas
METRIC UNITS
V = DF/19,100 D = 19,100V/F
V = 93,640 A/F A = VF/93,640
A = DF2/1,790,000,000 D = 1,790,000,000A/F2
Where,
D = Peak-To-Peak Displacement (Mils Pk-Pk)
V = Peak Velocity (In/Sec-Pk)
A = Peak Acceleration (G’s-Pk)
F = Frequency (CPM)
29

Comparison between Displacement, Velocity and Acceleration
When To Use Displacement, Acceleration & Velocity
30
Velocity
LO
G A
MP
LIT
UD
E
LOG FREQUENCY (Hz)
1 10 1000 10000100

Frequency Units
• Frequency refers to how often something occurs:– How often a shaft rotates?– How often a rolling element hits a defected race?
• There are three ways to express frequency:1. CPM – Cycles Per Minute
– 1CPM = 1RPM2. Hz – Cycles Per Second
– CPM / 603. Orders – Multiples of Turning Speed
– Frequency/Turning Speed
• Consider a motor has a rotational speed of 1485RPM, in terms of frequency this equates to:
– 1485 CPM (1rpm = 1cpm)– 24.75 Hz (1485/60) (minutes to seconds)– 1 Orders (1 x revolution of the shaft)

Frequency Units
• Shown below is a table showing the
relationship between all three frequency
units with reference to the turning speed
Motor Turning Speed = 1500RPM
CPM 1500 2250 3000 6000 12000
Hz 25 37.5 50 100 200
Orders 1 1.5 2 4 8

Frequency Domain
• The vibration analyst can divide the frequency domain data into
three major areas of interest
1. Synchronous Equal to Ts or Harmonics of Ts2. Sub synchronous < 1 x Ts3. Non synchronous > 1 x Ts but not an integer
• Note ‘Ts’ is the turning speed or rotational frequency (RPM) of the
shaft at the position where you make the measurement
• Each defect that can materialise in the frequency domain can be
categorised into one of three types of energy listed above
– Knowing the type of energy within the data can help the analyst quickly eliminate 2/3rd of the fault types

Here the primary cursor is at 1
Order (1xTs). All the other cursors
are harmonics (exact multiples of
the primary cursor)
Harmonic Orders
• Harmonics are cursors that are exact multiples of the primary frequency
– They are used to locate other frequencies related to the primary cursor
• Therefore:
– When the primary cursors is located on 1Order all the harmonics will be synchronous
– Harmonic cursors can be used to show non-synchronous and sub-synchronous harmonics depending upon the energy of the primary frequency

Energy in the Spectrum

Synchronous Energy
• Synchronous energy - related to turning speed.
• All the other peaks are harmonics off, which means they are related to the first peak
• We can see from the spectrum that the first peak is at 1 Orders (which means it is 1 x turning speed)
Examples of synchronous energy:
1) Imbalance 2) Misalignment 3) Gearmesh
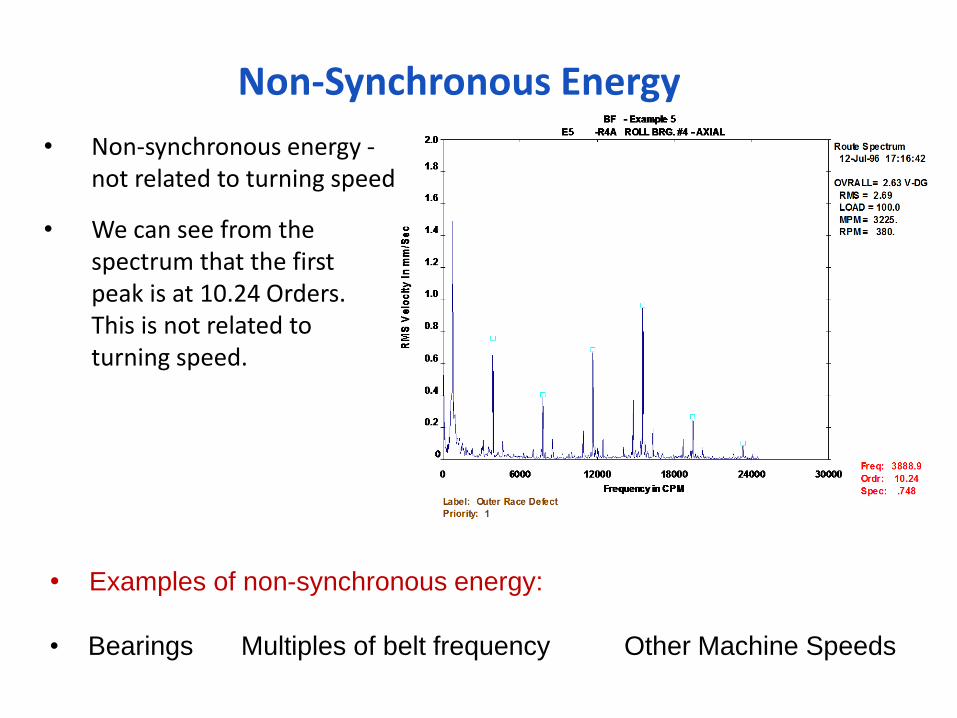
Non-Synchronous Energy
• Non-synchronous energy -not related to turning speed
• We can see from the spectrum that the first peak is at 10.24 Orders. This is not related to turning speed.
• Examples of non-synchronous energy:
• Bearings Multiples of belt frequency Other Machine Speeds

Sub-Synchronous Energy
• Sub-synchronous energy - Less than turning speed
• The spectrum shows the first impacting peak below 1 Order. This is sub-synchronous energy
• Examples of sub-synchronous energy are:
• Belt Frequencies
• Other Machine Speeds
• Cage Frequencies

Synchronous
– N x RPM where N is an integer
Sub-synchronous
– <1 x RPM
Non-synchronous
– F x RPM where F is >1x RPM but not integer
Energy in a Spectrum
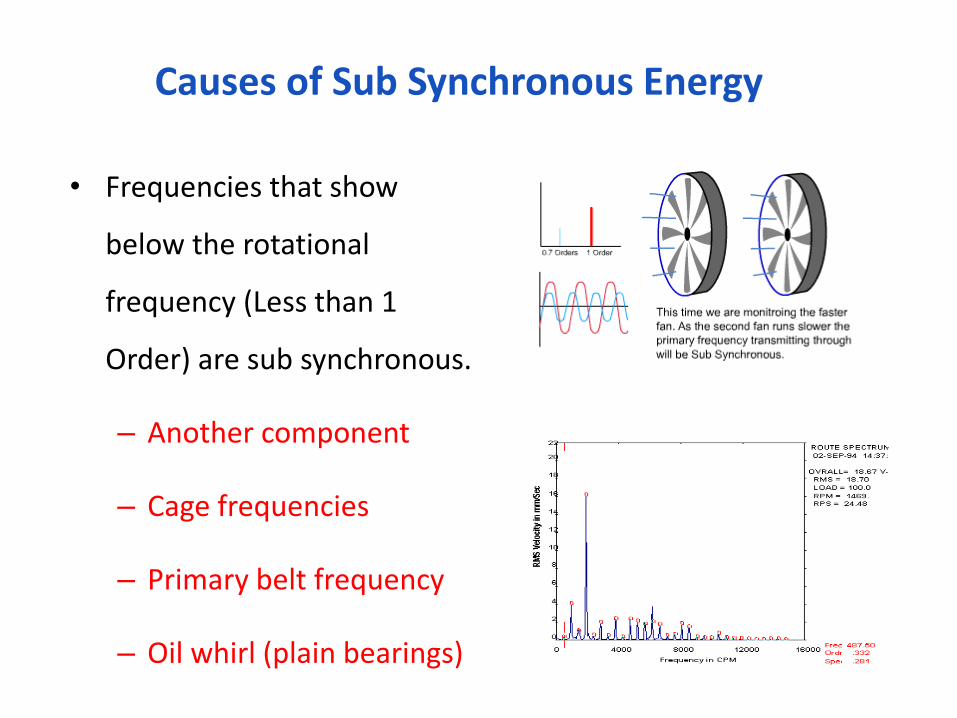
Causes of Sub Synchronous Energy
• Frequencies that show
below the rotational
frequency (Less than 1
Order) are sub synchronous.
– Another component
– Cage frequencies
– Primary belt frequency
– Oil whirl (plain bearings)

Causes of Synchronous Energy
• Frequencies that are equal too or a direct multiple of running speed are Synchronous
• Possible causes of Synchronous energy are:
– Imbalance
– Misalignment
– Looseness
– Vane pass frequency
– Gears etc

Causes of Non Synchronous Energy
• Frequencies above (but not integer multiples of) turning speed are non synchronous.
• Possible causes of non synchronous energy are:
– Another component
– Antifriction bearings
– Electrical
– System resonances
– Multiples of belt frequency