ECON 201: Introduction to Macroeconomics Professor Robert ...
Upload
hakeem-ingramCategory
view
27download
2description
Principles of Macroeconomics3250:201
Richard W. Stratton

04/19/23 The University of Akron 2
Administration
6 graded assignments this weekHomework 07, 08, 09, 10Essay 02CBT Test 03 (Friday - Monday)
4 graded assignments next weekHomework 11, 12Essay 03CBT Test 04 (Friday - Monday)
Decision Tree

Decision Tree
Student questionsMeasuring GrowthDeterminants of Economic GrowthTheories of GrowthWorksheet 07 Economic Growth
Q8
Q15
Q11

04/19/23 The University of Akron 4
Review Readings
Compare and discuss questions on worksheet or chapter 10write down top 5 questions for the Group
ClassDiscuss questions rotating among Groups

Decision Tree
Student questionsMeasuring GrowthDeterminants of Economic GrowthTheories of GrowthWorksheet 07 Economic Growth
Q8
Q15
Q11

04/19/23 The University of Akron 6
Calculating growth rate
Calculation of Growth Rate for 2001Year Nominal GDP GDP Deflator Real GDP Growth Rate
1998 8,781.5 103.20
1999 9,274.3 104.69
2000 9,824.6 106.89
2001 10,082.2 109.42
2002 10,442.1 110.66

04/19/23 The University of Akron 7
Calculating growth rate
Step 1 – Calculate Real GDPYear Nominal GDP GDP Deflator Real GDP Growth Rate
1998 8,781.5 103.20 8,509.2
1999 9,274.3 104.69 8,858.8
2000 9,824.6 106.89 9,191.3
2001 10,082.2 109.42 9,214.2
2002 10,442.1 110.66 9,436.2

04/19/23 The University of Akron 8
Calculating growth rate
Step 2 – Calculate Growth RateYear Nominal GDP GDP Deflator Real GDP Growth Rate
1998 8,781.5 103.20 8,509.2 ---1999 9,274.3 104.69 8,858.8 8859 – 8509
8509
2000 9,824.6 106.89 9,191.3 9191 – 88598859
2001 10,082.2 109.42 9,214.2 9214 – 9191 9191
2002 10,442.1 110.66 9,436.2 9436 – 9214 9214

04/19/23 The University of Akron 9
Calculating growth rate
Step 2a – Calculate Growth RateYear Nominal GDP GDP Deflator Real GDP Growth Rate
1998 8,781.5 103.20 8,509.2 --1999 9,274.3 104.69 8,858.8 4.1%
2000 9,824.6 106.89 9,191.3 3.7%
2001 10,082.2 109.42 9,214.2 0.3%
2002 10,442.1 110.66 9,436.2 2.4%

04/19/23 The University of Akron 10
Growth in Standard of Living
The standard of living depends on Real GDP per person
Real GDP per person = Real GDP divided by the population

04/19/23 The University of Akron 11
Growth in Standard of Living
The growth rate of real GDP per person can be calculated by using the formula:
Growth of real GDP per person
Growth rate of real GDP
Growth rate of population– =
Growth of real GDP per person 5 percent – 1 percent = 4 percent.=

Decision Tree
Student questionsMeasuring GrowthDeterminants of Economic GrowthTheories of GrowthWorksheet 07 Economic Growth
Q8
Q15
Q11

04/19/23 The University of Akron 13
Economic Growth
“… the limits to growth on this planet will be reached sometime within the next 100 years. The most probable result will be a sudden and uncontrollable decline in both population and industrial capacity.”
Comment
(The Limits to Growth, Meadows et al.; Universe, 1972)
#17
04/19/23 The University of Akron 14
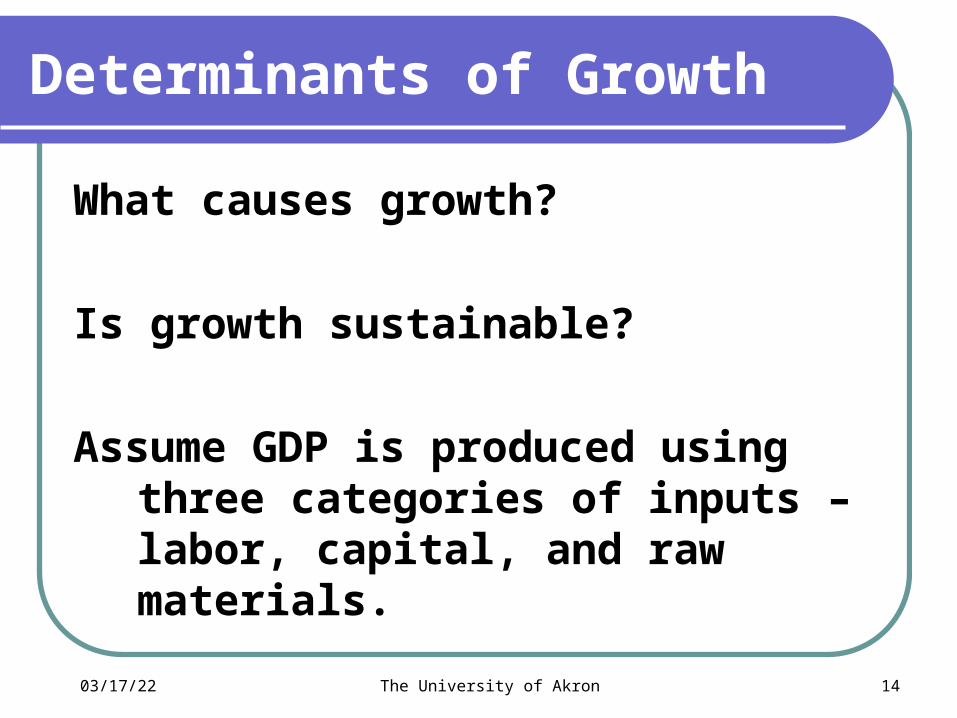
Determinants of Growth
What causes growth?
Is growth sustainable?
Assume GDP is produced using three categories of inputs – labor, capital, and raw materials.

04/19/23 The University of Akron 15
Determinants of Growth
If the number of aggregate hours of labor used increased, real GDP would ____________.
If the capital used in production increased, real GDP would ____________.
increase
increase

04/19/23 The University of Akron 16
Determinants of Growth
If the amount of raw materials used in production increased, real GDP would _____________.
If labor productivity increased and the number of aggregate hours remained the same, real GDP would _____________.
increase
increase

04/19/23 The University of Akron 17
Graphing changes
Axes?
Real
GDP
Aggregate Hours
Aggregate Production
04/19/23 The University of Akron 18
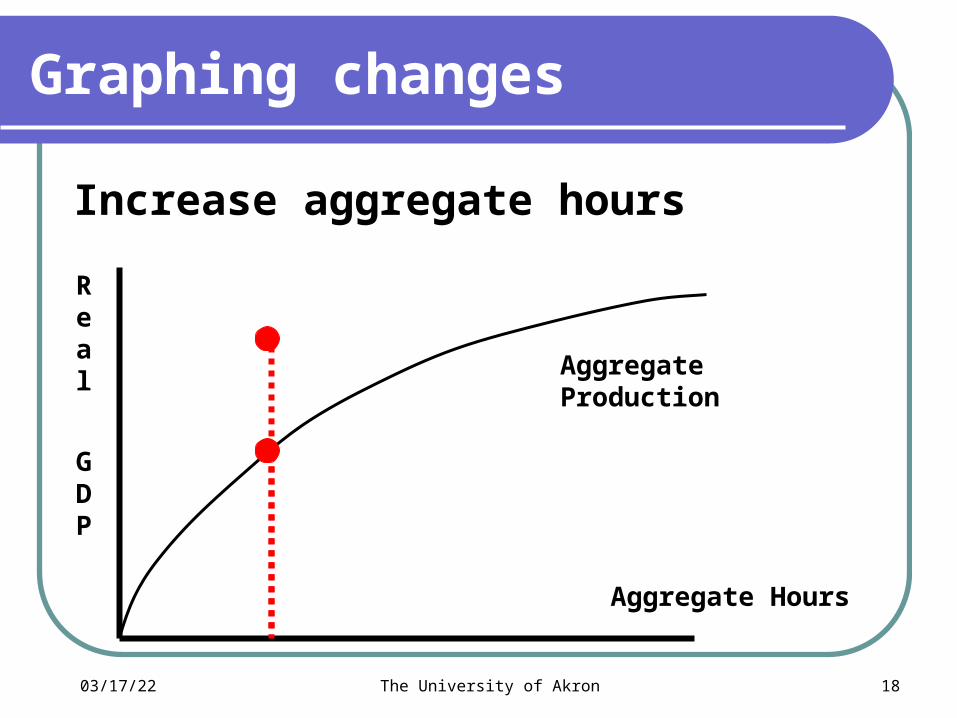
Graphing changes
Increase aggregate hours
Real
GDP
Aggregate Hours
Aggregate Production
04/19/23 The University of Akron 19
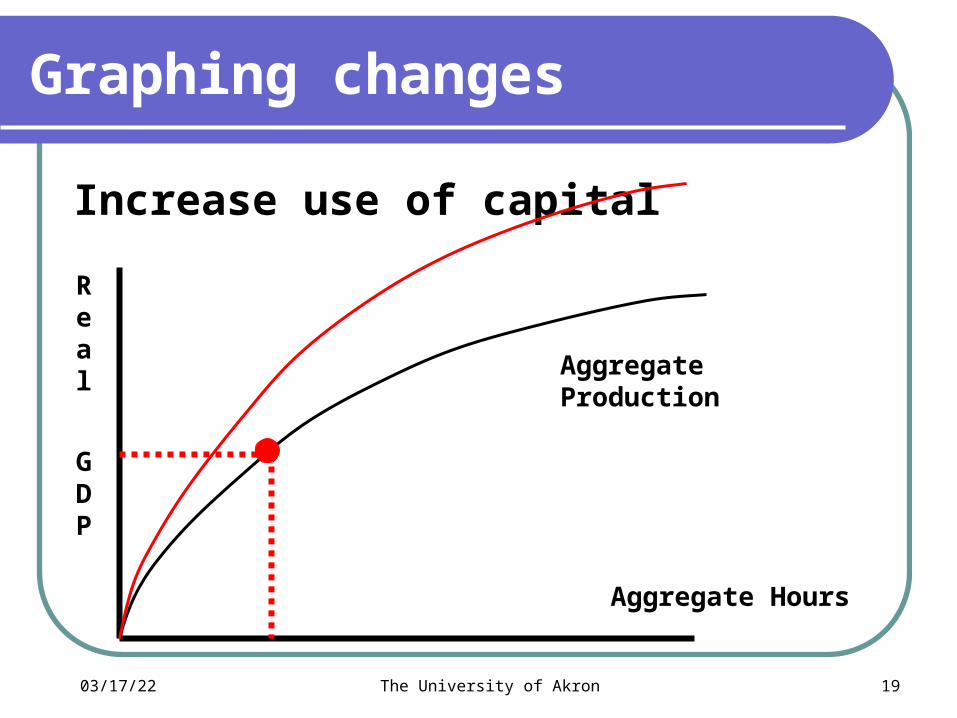
Graphing changes
Increase use of capital
Real
GDP
Aggregate Hours
Aggregate Production

04/19/23 The University of Akron 20
Graphing changes
Increase of raw materials
Real
GDP
Aggregate Hours
Aggregate Production
04/19/23 The University of Akron 21
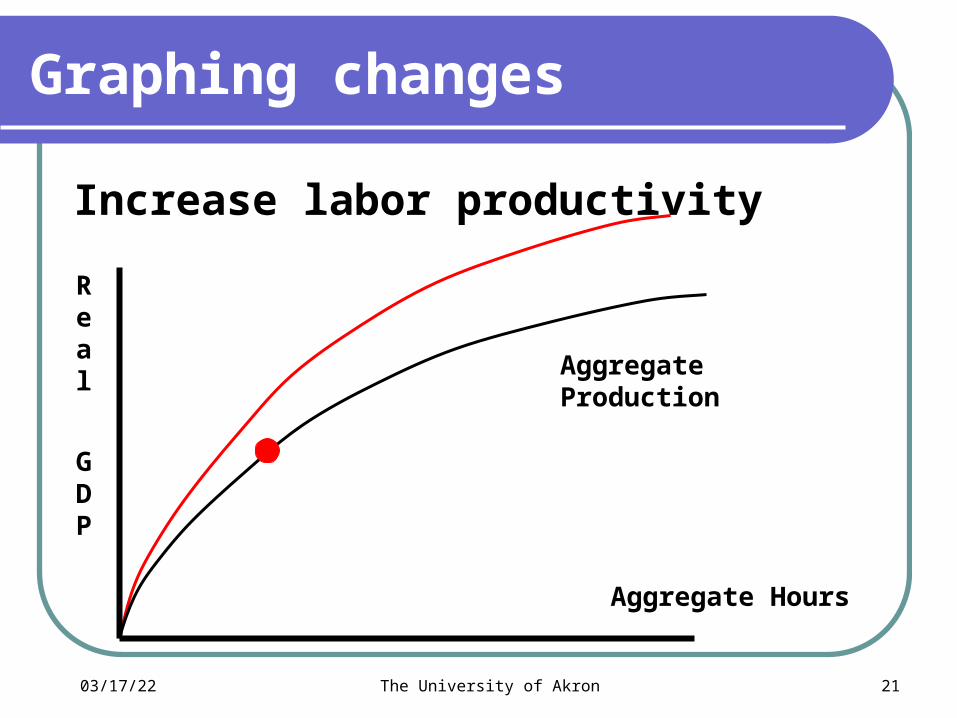
Graphing changes
Increase labor productivity
Real
GDP
Aggregate Hours
Aggregate Production
04/19/23 The University of Akron 22
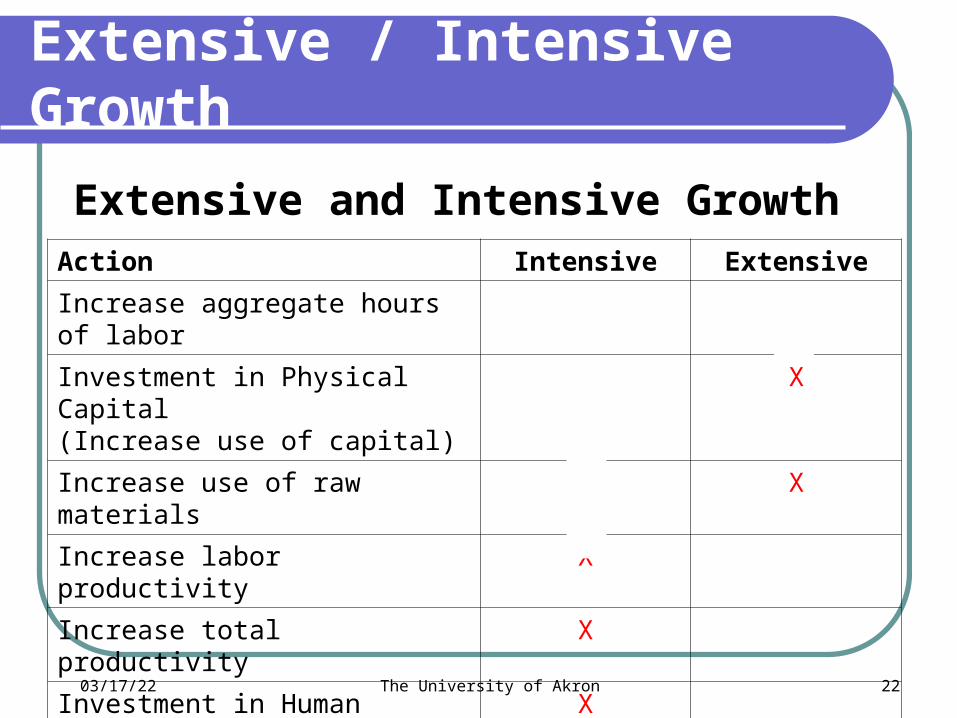
Extensive / Intensive Growth
Extensive and Intensive GrowthAction Intensive Extensive
Increase aggregate hours of labor X
Investment in Physical Capital (Increase use of capital)
X
Increase use of raw materials X
Increase labor productivity X
Increase total productivity X
Investment in Human Capital X
Discovery of new technologies X
04/19/23 The University of Akron 23
Sustainable Growth
Are there limits to extensive growth?
Are there limits to intensive growth?

Decision Tree
Student questionsMeasuring GrowthDeterminants of Economic GrowthTheories of GrowthWorksheet 07 Economic Growth
Q8
Q15
Q11

04/19/23 The University of Akron 25
Economic Growth
Growth Theories – Compare and contrast
Classical growth theoryNeo-classical growth theoryNew growth theory

04/19/23 The University of Akron 26
Comparing Growth Theories
Term, Person or Concept Classical Neo-Classical New Theory
Growth rate of GDP Measured as % change in Real GDP
Measured as % change in Real GDP
Measured as % change in Real GDP
Technical innovation
Labor productivity
Population growth

04/19/23 The University of Akron 27
Comparing Growth Theories
Term, Person or Concept Classical Neo-Classical New Theory
Growth rate of GDP Measured as % change in Real GDP
Measured as % change in Real GDP
Measured as % change in Real GDP
Technical innovation Random
Temp
Random HK growth R&D
Labor productivity Temp Sustainable random
Sustainable predicatable
Population growth Temp Limiting
Not limiting Women’s Choice
Not limiting Women’s Choice

04/19/23 The University of Akron 28
Comparing Growth Theories
Term, Person or Concept Classical Neo-Classical New Theory
Productivity growth
Wage rate for women
Death rate

04/19/23 The University of Akron 29
Comparing Growth Theories
Term, Person or Concept Classical Neo-Classical New Theory
Productivity growth Regresses to Subsistence
Unending growth
Unending growth
Wage rate for women Ignored Women wages & part. increase
Women wages & part. increase
Death rate Decrease with growth
Decrease with growth
Decrease with growth
04/19/23 The University of Akron 30
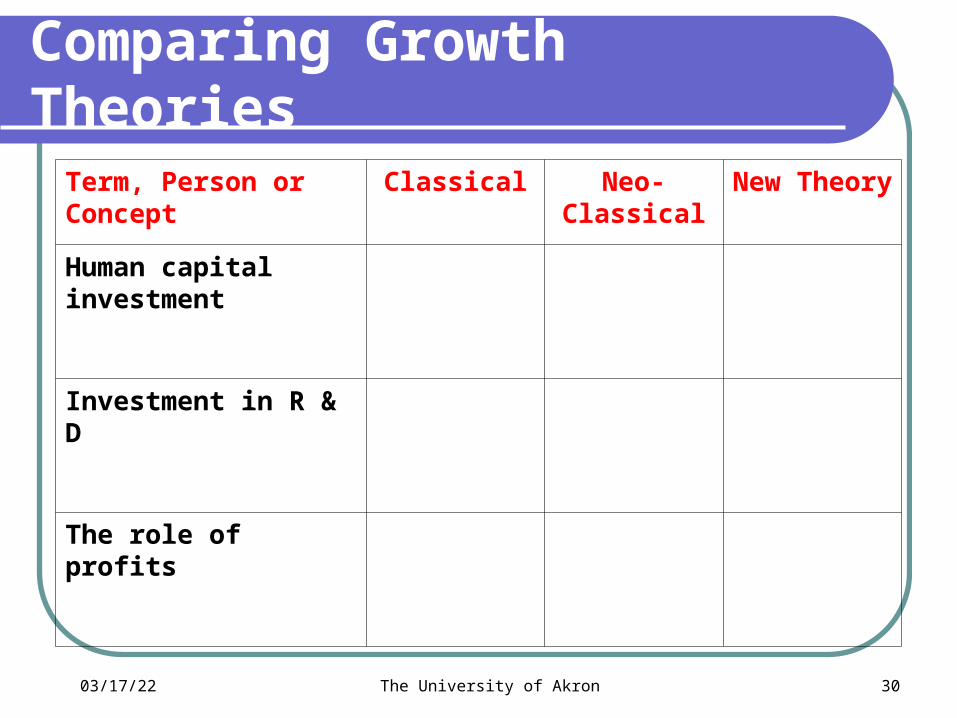
Comparing Growth Theories
Term, Person or Concept Classical Neo-Classical New Theory
Human capital investment
Investment in R & D
The role of profits

04/19/23 The University of Akron 31
Comparing Growth Theories
Term, Person or Concept Classical Neo-Classical New Theory
Human capital investment
Ignored Random
Unrelated to growth
Dependent on Choice
Investment in R & D Ignored Ignored Choice if profitable
The role of profits Ignored Ignored Primary driver

04/19/23 The University of Akron 32
Sustainable Growth
Are there limits to growth?
Are there limits to extensive growth?
Are there limits to intensive growth?

04/19/23 The University of Akron 33
Summary - Classical
Classical Growth Theory Increased productivity Increased GDP Reduced deaths and increased births Increased population Decrease in GDP per person Population growth limits increases in
human welfare

04/19/23 The University of Akron 34
Summary - Classical
Classical – Key featuresIncreases in labor productivity are
random and temporaryChanges in birth rate and life
expectancy primary determinants of population
Increases in population limited by subsistence level

04/19/23 The University of Akron 35
Summary - Classical
Classical Growth Theory – Prediction
Global Economy stagnates at subsistence level

04/19/23 The University of Akron 36
Summary - Neoclassical
Neo-Classical Growth Theory Technological advances Increased labor productivity Increase GDP Reduce deaths Reduce birth rates (women’s opt. cost)
Growth rate = population growth + productivity growth + accumulation of human capital
04/19/23 The University of Akron 37
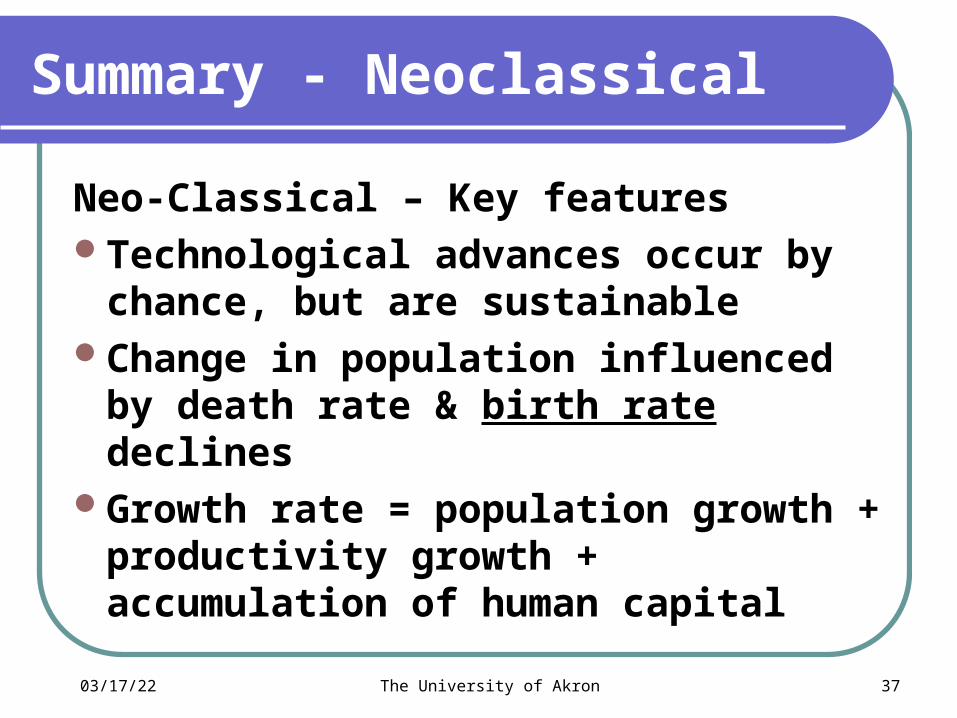
Summary - Neoclassical
Neo-Classical – Key featuresTechnological advances occur by
chance, but are sustainableChange in population influenced by
death rate & birth rate declinesGrowth rate = population growth +
productivity growth + accumulation of human capital

04/19/23 The University of Akron 38
Summary - Neoclassical
Neo-Classical – Prediction
Global Economy grows at a rate equal to technological change. National economies tend to converge.

04/19/23 The University of Akron 39
Summary – New Theory
New Growth TheoryEducation, R&D, & profit determine
technological advances Increased labor productivity Increase GDP per person Reduce death rates Reduce birth rates (women’s opt.
cost)

04/19/23 The University of Akron 40
Summary – New Theory
New Theory – Key featuresDecisions on education, R&D, and
profit potential determine the rate of technological advance
Change in population influenced by death rate & birth rate declines
Growth rate = population growth + productivity growth + accumulation of human capital

04/19/23 The University of Akron 41
Summary – New Theory
New Theory – Prediction
National economies grow at rates dependent on incentives (save, invest, etc.)
They will not necessarily converge.

Decision Tree
Student questionsMeasuring GrowthDeterminants of Economic GrowthTheories of GrowthWorksheet 07 Economic Growth
Q8
Q15
Q11

04/19/23 The University of Akron 43
Worksheet – MC questions
1. Which of the following is likely to increase the poverty in a country?
a) A decrease in population over time .
b) A decrease in the real GDP growth rate over time .
c) A decrease in the inflation rate over time.
d) An increase in the real GDP per person growth rate over time .

04/19/23 The University of Akron 44
Worksheet – MC questions
2. If the U.S. population grew at a 0.9 percent during 1999 and real GDP grew at a 4.4 percent during the same period, what was the growth rate of real GDP per person?
a) –3.5 percent b) 3.5 percent c) 4.0 percent d) 5.3 percent

04/19/23 The University of Akron 45
Worksheet – MC questions
3. Last year, in a nation far to the South, real GDP was $90 million and 900,000 workers were employed. This year real GDP is $100 million and 950,000 workers are employed. Hence, labor productivity has
a) increased.b) decreased.c) remained constant.

04/19/23 The University of Akron 46
Worksheet – MC questions
4. If Country A’s real GDP grows at a rate of 14 percent per year, how many years will it take for Country A’s real GDP to double ?
a) 5
b) 7
c) 10
d) 30

04/19/23 The University of Akron 47
Worksheet – MC questions
5. Neoclassical growth theory predicts that real GDP will
a) remain at the subsistence level .
b) grow at a rate that is determined by the pace of technological change .
c) grow but at a rate that will slow as time progresses and population growth increases.
d) continue to grow because of the choices people make in the pursuit of profit .

04/19/23 The University of Akron 48
Worksheet – T/F questions
6. Support for structuring taxes to encourage innovation is found in neoclassical growth theory.
False – In neoclassical growth theory, innovation and technological change are assumed random. Therefore, tax policies will not increase either. Support for this policy is found in the new growth theory.

04/19/23 The University of Akron 49
Worksheet – T/F questions
7. New growth theory predicts that national growth rates will slowly converge over time .
False – The “convergence” prediction is usually associated with the neoclassical theory of growth and the lack of evidence to support that predication was a stimulus to the development of the new theory of growth. Technically, the classical theory also predicts convergence, to subsistence levels.

04/19/23 The University of Akron 50
Worksheet – Real GDP
8. What is the per capita real GDP growth rate of Oz?
Oz Lilliput
Real GDP growth rate 5% 3%
Population growth rate 2% 1%
5% - 2% = 3%

04/19/23 The University of Akron 51
Worksheet – Real GDP
9. How many years will it take the real GDP per capita of Oz to double, at this rate of growth?
Oz Lilliput
Real GDP growth rate 5% 3%
Population growth rate 2% 1%
70 / 3 = 23.3 years
Use the rule of 70
04/19/23 The University of Akron 52
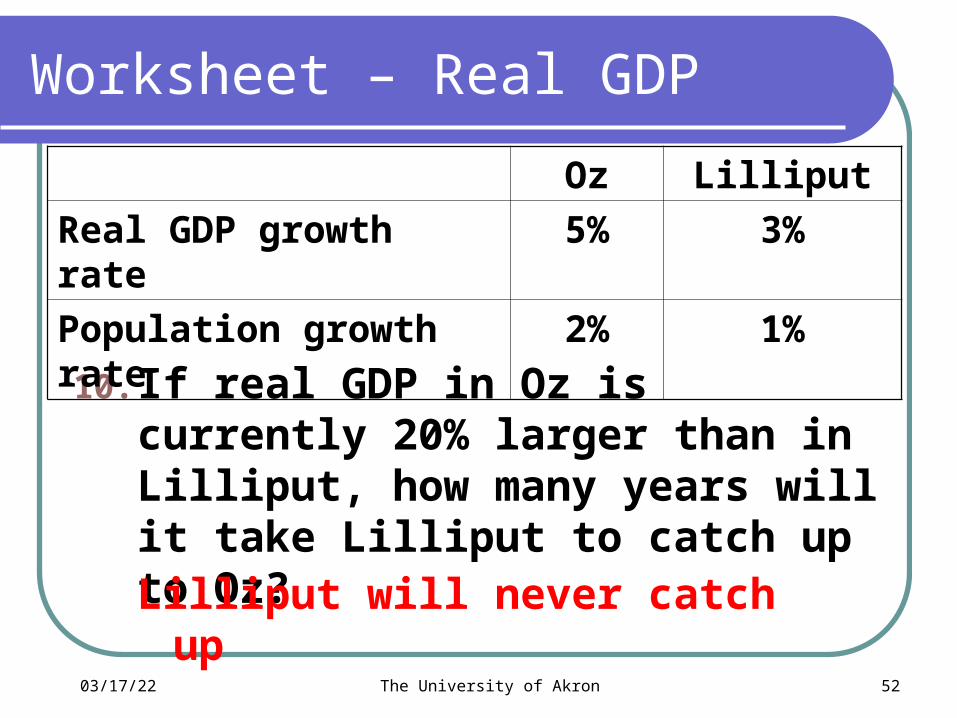
Worksheet – Real GDP
10. If real GDP in Oz is currently 20% larger than in Lilliput, how many years will it take Lilliput to catch up to Oz?
Oz Lilliput
Real GDP growth rate 5% 3%
Population growth rate 2% 1%
Lilliput will never catch up

04/19/23 The University of Akron 53
Worksheet – Real GDP2002 data Countr
y #1Country
#2Country
#3
Real GDP $8.444 $113.7 $133.8
Growth rate of real GDP - 0.6% 6.9% 1.6%
Real GDP per capita $30,200
$29,300 $25,800
Population 280,798
3,924,140
5,190,785
Population growth rate 0.49% 1.03% 0.14%11. Which country has the highest standard of living?

04/19/23 The University of Akron 54
Worksheet – Real GDP2002 data Countr
y #1Country
#2Country
#3
Real GDP $8.444 $113.7 $133.8
Growth rate of real GDP - 0.6% 6.9% 1.6%
Real GDP per capita $30,200
$29,300 $25,800
Population 280,798
3,924,140
5,190,785
Population growth rate 0.49% 1.03% 0.14%12. Which country has the fastest growing economy?

04/19/23 The University of Akron 55
Worksheet – Real GDP 2002 data Countr
y #1Country
#2Country
#3
Real GDP $8.444 $113.7 $133.8
Growth rate of real GDP - 0.6% 6.9% 1.6%
Real GDP per capita $30,200
$29,300 $25,800
Population 280,798
3,924,140
5,190,785
Population growth rate 0.49% 1.03% 0.14%13. What is the growth rate in the standard of living in country #3?
1.6% - 0.14% = 1.46%

04/19/23 The University of Akron 56
Worksheet – Real GDP2002 data Countr
y (Icelan
d)
Country (Ireland
)
Country (Finland
)
Real GDP $8.444 $113.7 $133.8
Growth rate of real GDP - 0.6% 6.9% 1.6%
Real GDP per capita $30,200
$29,300 $25,800
Population 280,798
3,924,140
5,190,785
Population growth rate 0.49% 1.03% 0.14%
14. If these trends continue in country #1, what will the real GDP per capita be in 2003?
-0.6% - 0.49% = -1.09% It will be 1.09% LOWER
$30,200 – (0.0109)*$30200 = 0.9891*30200 = $29,871

04/19/23 The University of Akron 57
Worksheet – Match the Theory
15. Growth is measured by the percentage change in real GDP
16. Technical innovation results from choices
17. Human capital investment is key to increases in labor productivity
Classical Neoclassical New Growth Theory
All three
New Growth Theory
New Growth Theory

04/19/23 The University of Akron 58
Worksheet – Match the Theory
18. Prosperity leads to decreases in death rates and increases in birth rates
19. Prosperity leads to decreases in death rates and in birth rates
20. Productivity growth is essential to increases in living standards
Classical Neoclassical New Growth Theory
Classical
Neoclassical
New Growth Theory

04/19/23 The University of Akron 59
Worksheet – Match the Theory
21. The relationship between wage rates for women and birth rates is key
22. Increased productivity leads to no improvement in living standards
23. Investment in R & D increases economic growth
Classical Neoclassical New Growth Theory
Classical
Neoclassical & New Growth Theory
New Growth Theory

04/19/23 The University of Akron 60
Worksheet – Match the Theory
24. The role of profits in the economy is an important component
25. Romer one of the major proponents
26. Malthus one of the major proponents
Classical Neoclassical New Growth Theory
Classical
New Growth Theory
New Growth Theory

Decision Tree
Student questionsMeasuring GrowthDeterminants of Economic GrowthTheories of GrowthWorksheet 07 Economic Growth
Q8
Q15
Q11