PRINCIPLES OF FAILURE ANALYSIS -...
72
PRINCIPLES OF FAILURE ANALYSIS Fatigue Failures Revised by William T. Becker, Ph.D. Course 0335 Lesson 4
Transcript of PRINCIPLES OF FAILURE ANALYSIS -...

PRINCIPLES OF FAILURE ANALYSIS
Fatigue Failures
Revised byWilliam T. Becker, Ph.D.
� Course 0335Lesson 4

Copyright © 2002by
ASM International®
All rights reserved
No part of this lesson may be reproduced, stored in a retrieval system, or transmitted, in any form or by any means,electronic, mechanical, photocopying, recording, or otherwise, without the written permission of the copyrightowner.
Great care is taken in the compilation and production of this lesson, but it should be made clear that NO WAR-RANTIES, EXPRESS OR IMPLIED, INCLUDING, WITHOUT LIMITATION, WARRANTIES OF MER-CHANTABILITY OR FITNESS FOR A PARTICULAR PURPOSE, ARE GIVEN IN CONNECTION WITHTHIS PUBLICATION. Although this information is believed to be accurate by ASM, ASM cannot guarantee thatfavorable results will be obtained from the use of this publication alone. This publication is intended for use bypersons having technical skill, at their sole discretion and risk. Since the conditions of product or material use areoutside of ASM’s control, ASM assumes no liability or obligation in connection with any use of this information.No claim of any kind, whether as to products or information in this publication, and whether or not based on neg-ligence, shall be greater in amount than the purchase price of this product or publication in respect of which dam-ages are claimed. THE REMEDY HEREBY PROVIDED SHALL BE THE EXCLUSIVE AND SOLE REMEDYOF BUYER, AND IN NO EVENT SHALL EITHER PARTY BE LIABLE FOR SPECIAL, INDIRECT ORCONSEQUENTIAL DAMAGES WHETHER OR NOT CAUSED BY OR RESULTING FROM THE NEGLI-GENCE OF SUCH PARTY. As with any material, evaluation of the material under enduse conditions prior tospecification is essential. Therefore, specific testing under actual conditions is recommended.
Nothing contained in this lesson shall be construed as a grant of any right of manufacture, sale, use, or reproduc-tion, in connection with any method, process, apparatus, product, composition, or system, whether or not coveredby letters patent, copyright, or trademark, and nothing contained in this lesson shall be construed as a defenseagainst any alleged infringement of letters patent, copyright, or trademark, or as a defense against liability for suchinfringement.
Comments, criticisms, and suggestions are invited, and should be forwarded to ASM International.
ASM International®
Materials Park, OH 44073-0002www.asminternational.org
Printed in the United States of America

Acknowledgements
Course Revisers
Roy Baggerly, Ph.D., FASMPACCAR Technical Center
William T. Becker, Ph.D.Consultant
Daniel J. BenacBryant-Lee Associates
Dennis McGarryFTI/SEA Consulting
Ronald J. ParringtonIMR Test Labs Incorporated
William R. Warke, Ph.D., FASMRetired Research Metallurgi
Technical Advisor
Gordon W. Powell, FASMOhio State University, Professor Emeritus
Technical Reviewers
Debbie AliyaSusan R. FreemanDavid N. FrenchLarry D. Hanke
William T. KaarlelaArun Kumar, Ph.D.
McIntyre R. Louthan, Jr., Ph.D., FASMKenneth F. Packer, Ph.D., FASM
Robert B. Pond, Jr., Ph.D.James J. Scutti, P.E.
Sharam Sheybany, Ph.D.Roch J. Shipley, P.E.Thomas J. Steigauf
George J. TheusJohn A. Wilkinson
Course Procreator
Donald J. Wulpi, FASMMetallurgical Consultant
Project Coordinators
Kathleen S. DragolichJoanne I. Miller

Upon completion of thislesson, you should be able to:� Understand the three different
ways in which fatiguebehavior is characterized interms of laboratory testing
� Understand the difficulties inusing behavior derived fromlaboratory test procedures topredict service performance
� Understand the differencebetween crack-initiation lifeand crack-propagation life, andthe conditions for which totallife is essentially controlled byonly one of these variables
� Recognize the featuresvisible at the macroscale andmicroscale that identify cyclicloading
� Understand how loadingparameters affect serviceperformance
� Understand howmanufacturing operations thatmay introduce materialimperfections and/or residualstresses affect serviceperformance
� Be aware of the environmentalconditions that may affectservice performance
*In addition to the glossary prepared for this course, definitions of terms used in this lessonmay also be found in Definitions of Metallurgical Terms, ASM International, 1977 and inASTM Specification E 1823.
Principles of Failure Analysis
Fatigue Failures
When a manufactured component is subjected to a fluctuating (repeat-ed) stress, it may fail in service after multiple load cycles even though themaximum stress in the cycle is less than the ultimate strength in a tensiletest. In fact, the stress causing failure of the part may be less than the netsection yield strength. The component is then said to have failed byfatigue. Just as with monotonic loading failure, it is important to under-stand how loading conditions are described, the variables that affectbehavior and the standardized testing conditions to define allowable loads(stresses). As in the case of monotonic loading failures, it is important todetermine if the failure occurred because of the loading conditions, thespecimen geometry, the environmental conditions, the microstructure, orsome combination of these variables.
When the term “fatigue” is used, it is commonly associated with loadsapplied to a component and is more completely described as mechanicalfatigue. However, fatigue failures can occur for other service conditions.One example is failure associated with time-dependent thermal cycling inwhich cyclic strain is created by differential thermal expansion (thermalfatigue).* Delayed fracture that occurs under a static load is known as sta-tic fatigue. Delayed fracture due to hydrogen embrittlement is a type offailure sometimes described as static fatigue but current preference is todescribe it as hydrogen-induced delayed cracking. Another typical repet-itive loading failure is described in the literature as contact fatigue. Con-tact fatigue is associated with rolling or sliding contact such as occurs ingears and bearings. Rubbing and sliding may also result in frettingfatigue. These types of fatigue failures are described in more detail in thelessons dealing with component failures. Fatigue failures may also occurunder corrosive conditions (corrosion fatigue, stress-corrosion fatigue)and at elevated temperature (interaction of creep and fatigue).

2 � Fatigue Failures
Service conditions where fatigue failures are common have been recog-nized and studied for more than 100 years—Early reports of fatigue fail-ures date from the 1780s in carriage wheels in France and in the 1860s onrailroad car wheels in Germany. Unfortunately although this long historyexists, fatigue failures still occur frequently and, in some manufacturedproducts, are the most common cause for failure. One report indicates thatthe most common loading conditions leading to failures in aircraft is byfatigue and that this type of failure accounts for 61% of the failures (G.R.Davies, in Ref 1, p 6).
Prediction of allowable loads in cyclic loading is complex because of thelarge number of variables that affect behavior and of the difficulty associat-ed with the correlation of data obtained in simple laboratory tests with theloading conditions and material behavior in a complex service environment.One example is the often complex nature of the variation in the appliedloads with time. If the maximum and minimum loads vary in an unknown orunpredictable way, it is difficult to extrapolate data collected using relative-ly simple tests to predict service behavior. In a laboratory test, for examplein rotating bending, the maximum and minimum stresses do not changewith time (Figure 1a). However, springs in an automobile are subjected to arandom loading spectrum in which there may be no regular repetition of themaximum and minimum stresses. An airplane wing is subjected to higherloading during takeoff and landing than during flight, but random loading ofan unknown nature due to wind gusts and/or storms is superimposed on therelatively constant flight loading (Figure 2). To predict allowable loading insuch a case, a model (cumulative damage) is required to predict how muchdamage is done in each portion of the loading spectrum. Until recently, goodmodels for cumulative damage have not been available. High-magnifica-tion examination of the fracture surface can sometimes provide quantita-tive information about changes in the maximum and minimum stress in theloading cycle with time and also provide quantitative information about thenumber of load cycles prior to failure. This quantitative coupling of fracto-graphic information with service loading conditions has resulted in a signif-icant improvement in the analysis of fatigue failures.
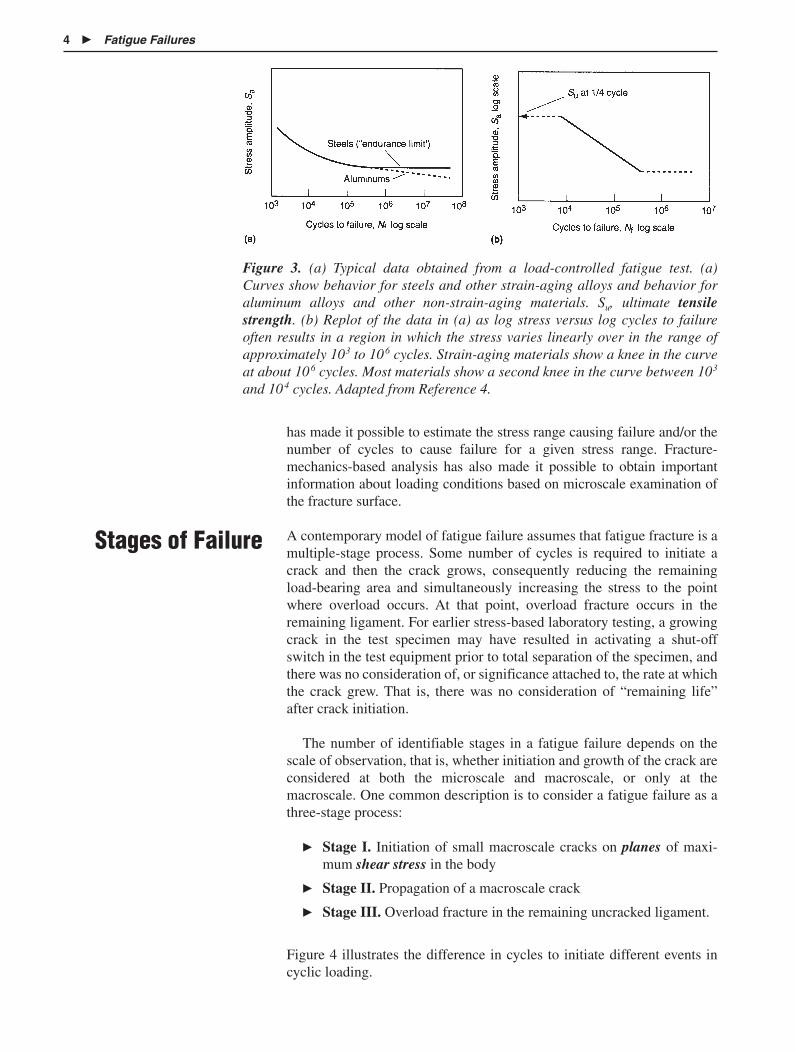
Fatigue data testing and methods of analysis have changed significantlysince the advent of fatigue testing. Until about 1960, fatigue testing anddesign was based primarily on bending loads, rotating-beam cylindricalspecimens with completely reversed loading, and cantilever-beam loadingof sheet specimens for which the loading may or may not be completelyreversed. In the rotating-beam test, the load is controlled, and, in the cantilever-beam tests, the deflection is controlled. Data were (and still are)plotted as the maximum bending stress calculated from the elastic beamequation versus life to failure, usually on a semi-log set of axes (Figure 3).Such data presentations are commonly known as S-N diagrams (stress-life).Data collected under load-controlled conditions and deflection-controlledconditions differ somewhat. For load-controlled conditions, the stress on theremaining ligament increases as the crack propagates, but the load requiredto maintain a given deflection decreases as the crack length increases.
The primary interest in using stress-based data is to predict the maxi-mum allowable stress for “long life,” that is, more than 1 million loadcycles. Starting in the early 1960s, two other methods of obtaining fatigue
Service LoadingConditions versusLaboratory Testing

Service Loading Conditions versus Laboratory Testing � 3
(a) (b)
Com
pres
sion
Stre
ss
Tens
ion
Com
pres
sion
Stre
ss
Tens
ion
Stre
ss
Stre
ssS
tress
Stre
ss
Tens
ion
0
S a
S m = S a
S a
S m
R = − 1
R = − 1 / 3
R = 0
0
0
Time Time
One block
0
Figure 1. (a) Sinusoidal load-time variation for laboratory fatigue testing. Stressvaries from a maximum to minimum value that defines the alternating and mean com-ponents of the stress. Sm, mean stress; Sa, stress amplitude. (b) The variation in loadwith time is not always sinusoidal. Triangular and square forms are possible. Some-times a repeating pattern occurs and the complete loading history is assumed to becomposed of a basic repeating block. At elevated temperature, the time at maximumstress is of importance. Adapted from Reference 2.
Storm
FlightG ' s
Time
Landing and taxi
0
TaxingLanding
Figure 2. Random loading of an airplane wing in flight. Source: Refer-ence 3.
data were developed. These are strain-life analysis and fatigue analysisbased on fracture mechanics concepts (often described as da/dN analysisor Paris Law behavior). Strain-life and da/dN analyses have permitted sig-nificant improvement in the development of fatigue design criteria and arediscussed below. The development of fracture-mechanics-based analysis
4 � Fatigue Failures
Stages of Failure
has made it possible to estimate the stress range causing failure and/or thenumber of cycles to cause failure for a given stress range. Fracture-mechanics-based analysis has also made it possible to obtain importantinformation about loading conditions based on microscale examination ofthe fracture surface.
A contemporary model of fatigue failure assumes that fatigue fracture is amultiple-stage process. Some number of cycles is required to initiate acrack and then the crack grows, consequently reducing the remainingload-bearing area and simultaneously increasing the stress to the pointwhere overload occurs. At that point, overload fracture occurs in theremaining ligament. For earlier stress-based laboratory testing, a growingcrack in the test specimen may have resulted in activating a shut-offswitch in the test equipment prior to total separation of the specimen, andthere was no consideration of, or significance attached to, the rate at whichthe crack grew. That is, there was no consideration of “remaining life”after crack initiation.
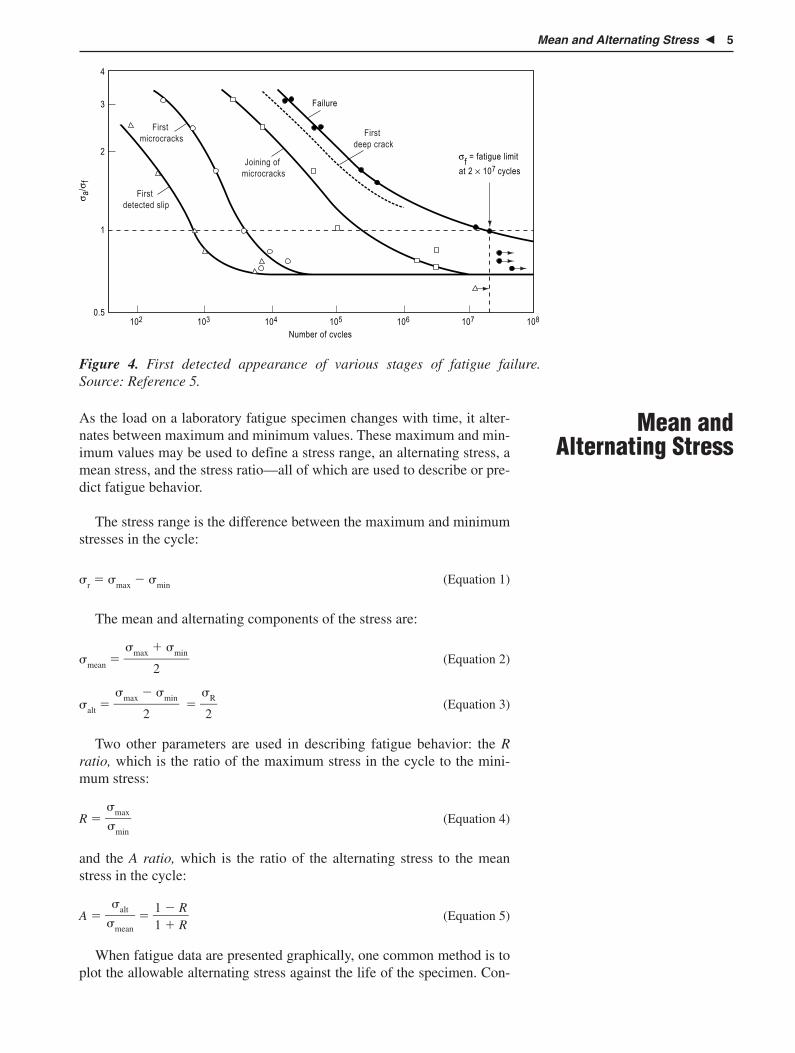
The number of identifiable stages in a fatigue failure depends on thescale of observation, that is, whether initiation and growth of the crack areconsidered at both the microscale and macroscale, or only at themacroscale. One common description is to consider a fatigue failure as athree-stage process:
� Stage I. Initiation of small macroscale cracks on planes of maxi-mum shear stress in the body
� Stage II. Propagation of a macroscale crack
� Stage III. Overload fracture in the remaining uncracked ligament.
Figure 4 illustrates the difference in cycles to initiate different events incyclic loading.
Figure 3. (a) Typical data obtained from a load-controlled fatigue test. (a)Curves show behavior for steels and other strain-aging alloys and behavior foraluminum alloys and other non-strain-aging materials. Su, ultimate tensilestrength. (b) Replot of the data in (a) as log stress versus log cycles to failureoften results in a region in which the stress varies linearly over in the range ofapproximately 103 to 106 cycles. Strain-aging materials show a knee in the curveat about 106 cycles. Most materials show a second knee in the curve between 103
and 104 cycles. Adapted from Reference 4.
Mean and Alternating Stress � 5
Mean andAlternating Stress
σ a/σ
f
σf = fatigue limit
at 2 × 10⁷ cycles
2
1
0.5
3
4
102 103 104
Number of cycles105 106
Failure
107 108
First deep crack
Joining of microcracks
First microcracks
First detected slip
Figure 4. First detected appearance of various stages of fatigue failure.Source: Reference 5.
As the load on a laboratory fatigue specimen changes with time, it alter-nates between maximum and minimum values. These maximum and min-imum values may be used to define a stress range, an alternating stress, amean stress, and the stress ratio—all of which are used to describe or pre-dict fatigue behavior.
The stress range is the difference between the maximum and minimumstresses in the cycle:
�r � �max � �min (Equation 1)
The mean and alternating components of the stress are:
�mean � ��max �
2
�min� (Equation 2)
�alt � ��max �
2
�min� � �
�
2R� (Equation 3)
Two other parameters are used in describing fatigue behavior: the Rratio, which is the ratio of the maximum stress in the cycle to the mini-mum stress:
R � ��
�m
m
a
in
x� (Equation 4)
and the A ratio, which is the ratio of the alternating stress to the meanstress in the cycle:
A � ��
�
m
a
e
l
a
t
n� � �
11
�
�
RR
� (Equation 5)
When fatigue data are presented graphically, one common method is toplot the allowable alternating stress against the life of the specimen. Con-

6 � Fatigue Failures
Laboratory TestingBlock Loading
sider data collected from a rotating-beam cylindrical specimen. As thespecimen rotates, a point A on the surface of the shaft sees the same stressas a point B on the surface at the same distance from the end of the shaft.When point A is at the bottom, it is loaded to a maximum tensile bendingstress and a maximum compressive stress of the same magnitude when ithas rotated 180° to the top. Point B, which started at the top, is initially incompression but is in tension when the specimen rotates 180° to the bot-tom. Consequently, we say that the stress is completely reversed, and Equa-tion 4 shows that R � �1. Use of Equation 2 shows that the mean stress inthe cycle is zero, and Equation 3 shows that the maximum stress in thecycle is equal to the alternating stress. The maximum alternating stress issometimes called the “maximum fiber stress” in older literature. If loadingis not completely reversed in the test, the R value must be reported.
Cantilever and axial loading permit testing conditions where the meanstress is not zero. As shown in Figure 5, an increasing mean component ofthe applied stress decreases the allowable alternating component. Realmaterials show a nonlinear variation (the Gerber curve), but most stress-based analyses and designs for fatigue are carried out using either theGoodman or Soderberg lines.
Stress-Based Analysis
Figure 5. Alternating stress versus mean stress. The Gerber parabolarepresents observed behavior. The Goodman line is usually used toapproximate the Gerber curve. The Goodman and Soderberg lines areused for design purposes.
Service loading conditions are usually more complex than those in the labo-ratory. The mean stress as well as the stress range may vary with time andcould even be completely random, such as the loading on a highway bridgedue to vehicular traffic. If the stress range and mean stress do vary withtime, it is more difficult to use simple laboratory data such as that describedabove to predict service performance. One type of testing known as blockloading is sometimes used to approximate service loading conditions better.For this loading condition, the load-time history of the component isassumed to be a repeating block as shown in Figure 1(b). Block-loading lab-oratory data are used to develop models for cumulative damage (see below).
Contemporary instrumentation makes it possible to change the shape ofthe stress-time curve between maximum and minimum values. Variationson three types of loading are used: sinusoidal, triangular, and square (Fig-

Laboratory Testing � 7
*There are a few exceptions. Materials that strain age typically show an endurance limit,which includes a few nonferrous materials such as titanium and zirconium alloys.
S-N Behavior
ure 1b). In elevated-temperature fatigue testing, the time at maximumstress is of considerable importance because time-dependent creep defor-mation occurs. In this case, tests may be performed with hold time atmaximum load as a test variable.
Ferrous and many nonferrous materials when tested in fatigue show dif-ferent stress-time behavior. More generally, materials that strain age showdifferent behavior from materials that do not strain age. Figure 3 illus-trates typical laboratory data collected in rotating bending in which casethe mean stress is zero.
Steels typically show a region at long life where the stress required forfailure (fatigue strength) becomes very weakly dependent on the number ofcycles (often described as the endurance limit).* A ferrous component pre-sumably then has infinite life if the stress never exceeds the long-life fatiguelimit (typically measured at 2 million cycles). The long-life fatigue limit foraluminum alloys is defined at some long life such as 10 million or 500 mil-lion cycles. In contemporary approaches to fatigue design, the endurancelimit is no longer considered to be a fundamental property of the materialand less interest is focused on its use in design, especially if the mean stressvaries with time. See the discussion of cumulative damage below.
The data shown in Figure 3(a) can often be linearized when log stress isplotted against log life (Figure 3b). This type of graph is useful because itallows the life at any stress to be calculated according to:
log � � log A � b log N (Equation 6)
or
� � A(N)b (Equation 7)
Data plots such as those shown in Figure 3(a) often do not show datafor a life less than about 10,000 cycles. When these shorter-life data areavailable, there is often a second knee visible in the curve at a life between1000 and 10,000 cycles as shown in Figure 3(b). In the absence of experi-mental data for a particular alloy, the short-life knee is assumed to be at1000 cycles. Values at 1000 cycles are assumed to be 90% of the monoto-nic values. That is, the stress to cause cyclic failure at, for example, 500cycles is not very much less than that obtained in a tensile test, whichcould be considered a 1⁄4 cycle, reversed-loading or a 1⁄2 cycle, zero-to-tension fatigue test.
With the development of more modern approaches to fatigue failure, it ispossible to recognize that a component has remaining life after crack ini-tiation. The fractions of the total life spent in initiation and propagationdepend on component geometry and the presence of cracklike imperfec-tions. The variables that affect fatigue behavior often affect initiation lifedifferently from propagation life. For example, a decreased grain size
Initiation Life andPropagation Life
8 � Fatigue Failures
increases the initiation life but decreases the propagation life. A periodicoverload decreases initiation life but increases propagation life.
Contemporary fatigue design also recognizes that a component may notbe subjected to hundreds of thousands or a few million cycles over its life.This in turn permits higher stresses to be applied to the component, andthe stress may be greater than the long-life fatigue limit.
The key to understanding modern fatigue analysis is that it is the stressat the tip of the advancing crack and the microstructure at that locationthat controls behavior, not the nominal or average stress on the compo-nent. The local stress in turn creates a local strain greater than the elasticstrain at yield, causing formation of a plastic zone at the tip of the crack.Early methods to take this plastic zone into account could not bedescribed very accurately and have been replaced by newer, more exactmethods.
If deformation causes the yield strength to be exceeded, the (flow) stressand strain are no longer linearly related. Yielding causes the flow stress ata strain greater than that at yield to be lower than that predicted for elasticdeformation at the same strain. Although it is possible to calculate thestress caused by a strain greater than that at yield, the calculations to deter-mine the strain gradient in the plastic zone are complex, and this is nottypically done in stress-based analysis. However, if a specimen is cycledbetween strain limits and the load to create those strains is measured, thenominal stress responsible for a given nominal strain can be accuratelydetermined.
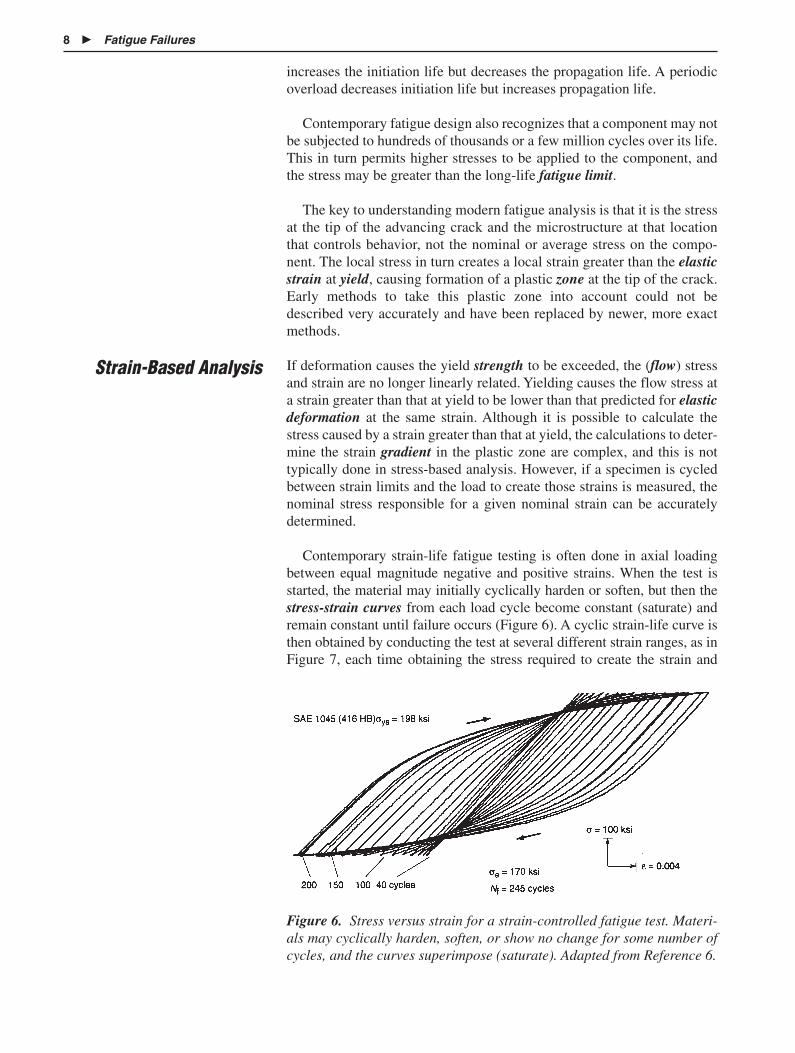
Contemporary strain-life fatigue testing is often done in axial loadingbetween equal magnitude negative and positive strains. When the test isstarted, the material may initially cyclically harden or soften, but then thestress-strain curves from each load cycle become constant (saturate) andremain constant until failure occurs (Figure 6). A cyclic strain-life curve isthen obtained by conducting the test at several different strain ranges, as inFigure 7, each time obtaining the stress required to create the strain and
Strain-Based Analysis
Figure 6. Stress versus strain for a strain-controlled fatigue test. Materi-als may cyclically harden, soften, or show no change for some number ofcycles, and the curves superimpose (saturate). Adapted from Reference 6.

Laboratory Testing � 9
Figure 8. Strain range versus cycles to failure for strain-life fatigue test-ing. The curve is approximated by two straight lines and a transition life.The straight line at long life is analogous to the stress-life behavior sincedeformation is essentially elastic. Adapted from Reference 4.
Figure 7. Stress versus strain for cyclic loading. The curve is prepared by deter-mining the stress required to maintain several saturated strain ranges. Adaptedfrom Reference 4.
therefore giving a stress-strain curve obtained for cyclic loading. Resultsare then finally plotted as strain amplitude (at zero mean strain) versus lifeon a log-log plot (Figure 8). For analytical analysis, it is convenient to con-sider the curve to consist of two straight line portions. At long life (above2Nf, the transition life) and small strains, elastic behavior dominates.

10 � Fatigue Failures
Figure 9. Stress-life or strain-life fatigue behavior showing initiation life,propagation life, and total life. Adapted from Reference 8.
Figure 10. Variation in crack-growth rate (da/dN) versus change in the stress-intensity factor (�K). Three regions are defined in the curve as well as athreshold value of �K to initiate crack growth. The threshold value is sensitiveto the environment and microstructure. Behavior in regions I and III depend onmicrostructure and the environment. Behavior in region II does not dependstrongly on the environment or microstructure, but is sensitive to mean stressand anisotropy inherent to the fabricated product. Source: Reference 9.
This is comparable to long-life stress-based testing. What has been addedis the behavior when plastic strains are created. The data show that plasticstrains dominate behavior at shorter life (life less than 2Nf). Intercepts andslopes of the straight-line approximations to the fatigue behavior can berelated to monotonic loading material properties. A discussion of theseapproximations is given in References 4 and 7.

Laboratory Testing � 11
Stress-life data and strain-life data collected on smooth, cross-section spec-imens essentially measure crack-initiation life while fracture-mechanics-based analysis accepts that a crack is present in the material and determinesthe remaining cycles until overload occurs (the propagation life) (Figure 9).At low stress, the total life is essentially due to the initiation life, but at highstress ranges the total life is dominated by the propagation life. S-N data donot accurately predict the behavior of real materials containing local geo-metric stress concentrators, materials containing cracklike defects, orfinite-life behavior of smooth specimens. Smooth-section members typi-cally have a relatively long initiation life (as much as 80% of the total life)and a shorter propagation life, while the opposite is true for members hav-ing a stress concentrator.
In fracture-mechanics-based fatigue analysis, the increase in cracklength per cycle (da/dN) is measured in terms of the change in the stress-intensity factor during a load cycle (�K). Figure 10 shows a schematicplot, and Figure 11 shows experimentally determined data. The curves inFigures 10 and 11 are divided into three regions, and the effect of a givenvariable on fatigue behavior is examined in terms of its effect on each
or
�ddan� � A(�K)m (Equation 9)
The stress-intensity factor is related to the applied stress by the equation(see also Lesson 3):
K � �(��a�)[f(a/W)] (Equation 10)
Therefore, if there is a change in stress from �max to �min, there is a cor-responding change in the stress-intensity factor:
Kmax � �max(��a�)[f(a/W)]
Kmin � �min(��a�)[f(a/W)] (Equation 11)
The change in stress intensity (�K) in one load cycle is then given by:
�K � Kmax � Kmin � (�max � �min)(��a�)[f(a/W)] (Equation 12)
region. Metallurgical and environmental variables have a strong effect inregion I, including the threshold value (�Kth), and in region III. They areusually reported to have little effect in region II. However, see the com-ments at the end of this section. Region II, in which the rate of crackgrowth is linear on a log-log plot, is the basis for quantitative fractograph-ic analysis.
Because the slope in region II is linear:
log (da/dN) � log A � m (log �K) (Equation 8)
Fracture-Mechanics-Based Analysis

12 � Fatigue Failures
Figure 11. Fatigue crack growth behavior of ASTM A533 B1 material.Source: Reference 10.
or
�K � (��)(��a�)[f(a/W)] (Equation 13)
The correction factor f(a/W) increases with crack length, but, if the totalamount of crack growth is small and/or if the correction factor remainsessentially constant, the rate of crack growth depends only on the changein stress in the cycle.
These equations are referred to in a later section where microscale frac-tographic features of fatigue failure are discussed.
Two final comments to this section: It was noted above that themicrostructure and environment do not have a very important effect onbehavior in region II. That statement is repeated in almost every text deal-ing with fracture-mechanics-based fatigue analysis. However, some cau-tion is necessary. Just as KIc varies with orientation in fabricated materialdue to banding and inclusion shape and distribution, the constants inEquation 9 also depend on specimen orientation.

Correlation of Fatigue Properties with Other Mechanical Properties � 13
The above analysis assumes the use of linear elastic fracture mechan-ics (LEFM) and, therefore, plane-strain loading conditions. Because con-straint may be lost at long crack lengths, assumptions of LEFM may notbe valid in region III. However, this does not limit the use of the LEFMapproach in practical failure analysis.
Fatigue data are not as commonly reported as are monotonic tensile dataand hardness data. Furthermore, it may not be possible to obtain a testspecimen from a failed component suitable for fatigue testing. (There areadditional issues involved, related to section thickness, surface condition,data scatter, microstructure, etc., that may make comparison of such datato literature values questionable even if it is obtained.) Therefore, it isdesirable to be able to correlate monotonic and cyclic data. This can bedone with reasonable accuracy for wrought materials but, unfortunately,not as reliably for cast materials.
For wrought material, there is usually a reasonable correlation betweenhardness and tensile strength (Lesson 3). Furthermore, there is usually areasonable correlation between tensile strength and long-life fatiguestrength (Figures 12, 13). This then implies that there should be a reason-able correlation between hardness and long-life fatigue strength. Thisrelationship is of considerable value in estimating cyclic-loading mater-ial strength. Estimates of material strength may then be compared toloading conditions and/or assumptions of strength used in design of thecomponent.
For steels, especially in the quenched-and-tempered condition, the long-life fatigue strength is about 1⁄2 of the tensile strength. The ratio of fatiguestrength to yield strength or fatigue strength to tensile strength does vary
Correlation ofFatigue Propertieswith OtherMechanicalProperties
End
uran
ce li
mit,
ksi
50
40
60
70
80
90
100
110
120
130
140
150
160
3020 40
Hardness, HRC
50 60 70
SAE 4063SAE 5150SAE 4052SAE 4140SAE 4340SAE 2340
H-11 Austempered
H-11 Conventional
Figure 12. Long-life fatigue strength as a function of Rockwell hard-ness. The curve is linear for several different steels in the quenched-and-tempered condition. Source: Reference 11.

14 � Fatigue Failures
Se,
ksi
00
5
10
15
20
25
10 20 30 40
UTS, ksi
50 60 70 80 90
HardenableNon-hardenable
Se versus UTS: Hardenable and non-hardenable Al alloys
Figure 13. Correlation of long-life fatigue strength and ultimate strengthfor aluminum alloys. Data indicate a different correlation for hardenablealloys (2xxx, 6xxx, 7xxx series alloys) and for nonhardenable alloys (1xxx,3xxx, 4xxx, 5xxx series). Data from Reference 12.
somewhat with microstructure. For steels, the ratios are higher in ferriticand austenitic microstructures than in pearlitic microstructures. The corre-lation is valid for steels to a tensile strength of about 1380 MPa (200 ksi)corresponding to a fatigue strength of 689 MPa (100 ksi), and to about 172MPa (25 ksi) for aluminum alloys. The ultimate tensile strength (UTS) (inpounds per square inch) is in turn about 500 times the Brinell hardness:
UTS � (500)(HB) (Equation 14)
Therefore, the long-life fatigue strength (FS) should be about 250 timesthe Brinell hardness; that is:
FS � (250)(HB) (Equation 15)
Hardness is not always obtained conveniently from the Brinell test, butstandard conversion charts can be used to obtain an equivalent Brinellhardness from a Rockwell or Vickers hardness (ASTM E 140). The con-version of hardness to fatigue strength is not exact, but is good enough to

Variables Affecting Fatigue Behavior � 15
estimate the fatigue strength of a given material. It is useful, for example,in predicting subsurface, fatigue crack initiation in surface-treated compo-nents (see below). Alternatively, for higher-strength steels, Rockwell hard-ness can be correlated with long-life fatigue strength according to:
FS � 2000(HRC � 20) (Equation 16)
where FS is the fatigue strength in psi.
Although it is common to assume that the long-life fatigue strength ofwrought steels is one-half of the tensile strength, this is not always true asis shown in Table 1. Therefore, some caution is necessary in utilizing thisapproximation, especially for cold-worked material.
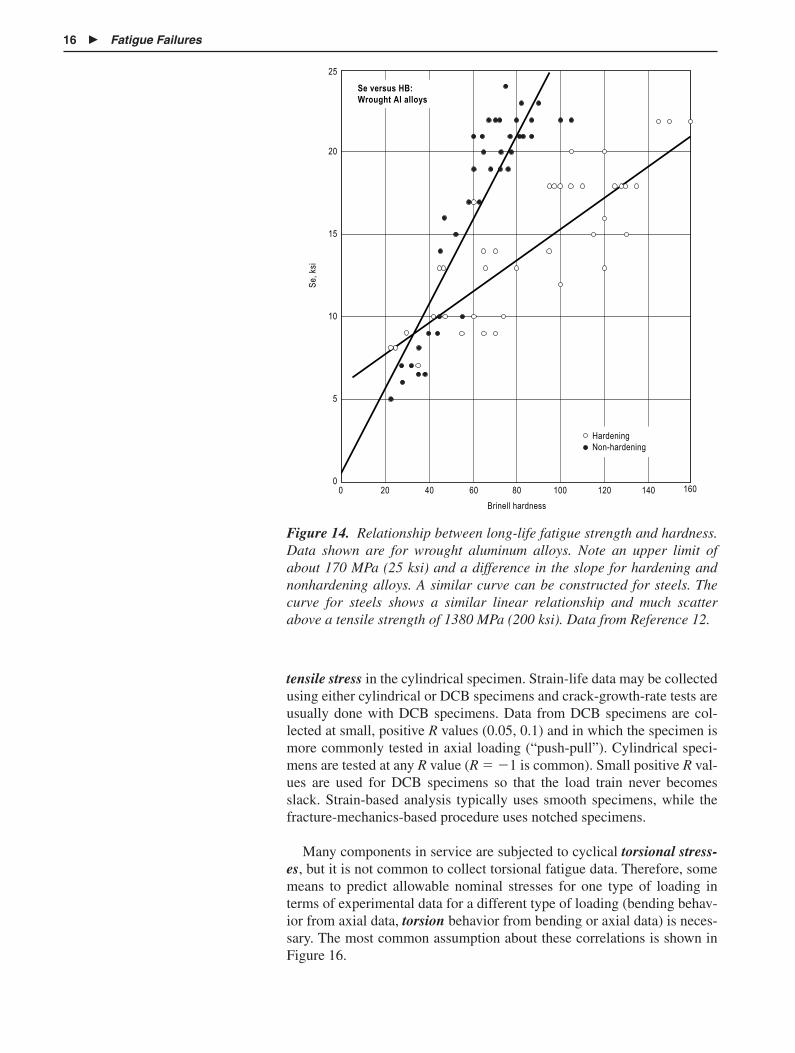
In a similar way, the hardness of wrought aluminum alloys can be corre-lated with their tensile strength, and the long-life fatigue strength (at 10million or 500 million cycles) can be correlated with the tensile strength(Figures 14, 15). Figure 14 shows that the hardness/strength correlation isdifferent for the hardenable (2xxx, 6xxx, 7xxx) alloys and the nonharden-able (1xxx, 3xxx, 4xxx, 5xxx) alloys. As for the steels, there is an upper limitof the fatigue strength, which is about 172 MPa (25 ksi) for aluminumalloys. This upper limit is obtained for several different heat treated condi-tions producing different tensile strengths, which causes more scatter inmonotonic-cyclic stress correlations. The ratio of the long-life fatiguestrength to the tensile strength is about 0.42 for the nonhardening alloysand about 0.32 for the hardening alloys. Figure 15 shows a similar compar-ison of fatigue strength versus hardness for aluminum casting alloys.
Most early fatigue data were collected for bending loads. Modern fatigue-testing techniques for both strain-life and �K-da/dN analysis use servo-hydraulic loading frames. Loading is axial. This creates the tensile and bending stresses in the double-cantilever-beam (DCB) specimen and a
Variables AffectingFatigue BehaviorFatigue in Axial andTorsional Loading
Table 1 Influence of Cold Work on the Tensile Stress andthe Fatigue Limit of Carbon Steel Rod
Reduction Tensile Fatigue Fatigue limit,of area, % stress, ksi limit, ksi tensile stress
0.36 carbon steel
25 148 �50 0.3450 157 �58 0.3775 190 �67 0.3580 202 �67 0.3385 224 �70 0.31
0.55 carbon steel
25 189 �59 0.3150 209 �64 0.3075 231 �69 0.3080 236 �72 0.3085 263 �73 0.28
0.79 carbon steel
25 220 �60 0.2750 258 �71 0.2875 298 �78 0.2680 307 �78 0.2685 309 �80 0.26
16 � Fatigue Failures
Se,
ksi
00
5
10
15
20
25
20 40 60 80
Brinell hardness
100 120 140 160
Se versus HB: Wrought Al alloys
HardeningNon-hardening
Figure 14. Relationship between long-life fatigue strength and hardness.Data shown are for wrought aluminum alloys. Note an upper limit ofabout 170 MPa (25 ksi) and a difference in the slope for hardening andnonhardening alloys. A similar curve can be constructed for steels. Thecurve for steels shows a similar linear relationship and much scatterabove a tensile strength of 1380 MPa (200 ksi). Data from Reference 12.
tensile stress in the cylindrical specimen. Strain-life data may be collectedusing either cylindrical or DCB specimens and crack-growth-rate tests areusually done with DCB specimens. Data from DCB specimens are col-lected at small, positive R values (0.05, 0.1) and in which the specimen ismore commonly tested in axial loading (“push-pull”). Cylindrical speci-mens are tested at any R value (R � �1 is common). Small positive R val-ues are used for DCB specimens so that the load train never becomesslack. Strain-based analysis typically uses smooth specimens, while thefracture-mechanics-based procedure uses notched specimens.
Many components in service are subjected to cyclical torsional stress-es, but it is not common to collect torsional fatigue data. Therefore, somemeans to predict allowable nominal stresses for one type of loading interms of experimental data for a different type of loading (bending behav-ior from axial data, torsion behavior from bending or axial data) is neces-sary. The most common assumption about these correlations is shown inFigure 16.

Variables Affecting Fatigue Behavior � 17
Se,
ksi
00
5
10
15
20
25
10 20
AlO8
Diecast
30 40 50
UTS, ksi
60
Series 1Series 2Series 3
Se versus UTS: Al casting alloys
Permanentmold cast
Sand cast
Figure 15. Relationship between long-life fatigue strength and hardnessfor as-cast aluminum alloys. Data shown are for sand cast, permanentmold cast, and die-cast alloys. Trend is for strength levels to be elevatedas the cooling rate increases (more accurately, as the dendrite sizedecreases). Note the large amount of scatter for the die-cast alloys. Datafrom Reference 12.
If data are collected in pure torsion, the apparent allowable alternat-ing torsional stress in terms of the mean torsion stress shows consider-able scatter. For pure torsional loading, there is no axial strain in thespecimen. The two surfaces of the fatigue crack, which are not smoothon the microscale, rub against each other, absorbing some of the appliedload. (This rubbing is visible on the fracture surface and is helpful inidentifying torsion loading.) However, if torsional testing is conductedwith a small axial load to separate the crack faces, scatter is muchreduced and the allowable alternating stress in terms of the mean stressshows a similar behavior to axial and bending loading of a decreasedallowable alternating load with increased mean load.
Many variables affect fatigue behavior, in fact, so many that sometimes itis necessary in the development of a new part to run full-scale laboratorytests on the as-fabricated part. Laboratory testing can be used to examineonly one dependent variable at a time, and a given manufacturing opera-tion may simultaneously change more than one variable.
Additional VariablesAffecting FatigueBehavior

18 � Fatigue Failures
Fatig
ue s
treng
th, f
ract
ion
of u
ltim
ate
tens
ile s
treng
th
Fatig
ue s
treng
th, f
ract
ion
of re
vers
e be
ndin
g en
dura
nce
limit
0.20
0
0.300.29
0.40
0.43
0.50
0.85
0.58
1.00
0.60
0.70
0.80
0.90
1.00
104103 105
Life, cycles
106
Bending
Axial
Torsion
107
Figure 16. Assumed variation in fatigue strength and cycles to failure foraxial, bending, and torsion loading for wrought materials. Source: Refer-ence 14.
If the maximum loads are determined based on published propertydata, it is common to obtain the allowable, smooth-section nominal stressand then to decrease this stress by appropriate factors for each variableaffecting behavior. Such variables would include section size, surfaceroughness, and others.
The effect of mean stress on allowable alternating stress has been dis-cussed, as well as predicting torsional behavior in terms of axial or bend-ing behavior. A more complete listing of variables affecting behavior fol-lows, any one of which might cause overloading. The classification issomewhat arbitrary and overlapping. For example, heat treating as a man-ufacturing method creates residual stresses unless the heat treatment is astress-relief anneal. Variables that affect fatigue behavior include:
Loading Variables
� Scatter in experimental data
� Axial versus bending versus torsional loading

Variables Affecting Fatigue Behavior � 19
� Uniaxial versus multiaxial loading
� For multiaxial loading, whether the stresses are in phase or out ofphase
� Relative magnitude of the mean and alternating components of thestress
� Time dependence of the mean and alternating stresses (constant,block, random)
� Loading frequency
� Shape of load-time curve (sinusoidal, triangular, with or withouthold time
� Expected life (infinite versus finite life)
� Contact (Hertzian) stresses
Component Geometry
� Size
� Shape
� Stress concentrators (changes in section, keyways, etc.)
Manufacturing/Assembly Methods
� Surface roughness
� Cast versus wrought
� Heat treatment
� Finishing operations—cold versus hot
� Press fit interference
� Residual stresses, thermal and mechanical
� Directionality of properties
� Identification marking
� Plating operations
Microstructure
� Nominal microstructure
� Variable microstructure—surface treated, decarburized, grain bound-ary oxides
� Volume fraction, distribution, deformability, and shape of inclusions
Service Environment
� Oxidizing, reducing, or neutral atmosphere
� Aqueous corrosion
� Temperature

20 � Fatigue Failures
Figure 17. S-N probability curves determined by using constant stresslevel method in finite life range and survival method in infinite life range.Adapted from Reference 39.
The effects of these variables are discussed in the following sections.
Data Scatter. When several fatigue specimens are tested at the samenominal stress, there is some scatter in the resulting number of cycles tofailure. This suggests that a published fatigue curve based on experimentaldata (which almost never shows actual data points) should be developedbased on statistical analysis. If the data are analyzed statistically, theresults can be reported in various ways. In one method, the drawn S-Ncurve represents 50% survival (median life). That is, 50% of the speci-mens will fail at or below the drawn curve. Alternatively, multiple curvescan be drawn indicating various survival rates. Figure 17 shows curves for5%, 50%, and 95% survival, or alternatively, 95%, 50%, and 5% failure.Unfortunately, when S-N curves are obtained from the literature, the sur-vival rate for the drawn curve is almost never reported.
Loading Frequency. Loading frequency is not a significant factor inaffecting the shape of the S-N curve for the common range of frequencies(500–10,000 cpm) used in laboratory testing in air. Qualitatively, fatiguestrength tends to increase with test frequency at low frequencies (0.2–500cpm), but the effect is not very large, perhaps a 10% increase for a changein frequency of two orders of magnitude (Reference 15). The allowablestress can both increase or decrease at very high frequencies, as shown inFigure 18. The decrease in fatigue strength at high frequencies is associat-ed with specimen heating. This can result in some softening of cold-worked materials and overaging in those alloys that precipitation hardenor strain age (Reference 16). Frequency effects are also present in corro-sion fatigue and elevated-temperature fatigue. For these situations, thetime at maximum tensile stress is of importance. The crack is open to theenvironment, and creep deformation occurs due to the tensile stress.
Cumulative Damage. Significant improvement has been made in theability to predict fatigue behavior using modern methods of analysis. Ofspecial note is the improvement in studies of cumulative damage where
Loading Variables

Variables Affecting Fatigue Behavior � 21
End
uran
ce li
mit,
tsi a
t 108
cyc
les
26
28
24
22
20
0.1 0.3Frequency ke/s
1.0 3.0
B
A
Figure 18. The effect of loading frequency on the endurance limit of twosteels. Strain-aged steels may overage at high frequencies due to heat gen-eration. Other microstructures may also soften at high frequency due toheat generation. Adapted from Reference 16.
the magnitude of the mean and alternating stresses are time dependent.The historical Palmgren-Miner linear cumulative damage model (Refer-ence 17) does not take into account the prior history of the specimen andtherefore does not consider the order in which different stress amplitudesare imposed. Data are analyzed in the same way whether the stress ampli-tude decreases with time or increases with time (“overstressing” and“coaxing”). This can lead to significant error if the material has an unsta-ble microstructure, including materials that strain age.
The Palmgren-Miner model says that if the life at a given stress �1 is N1
and the actual number of service cycles at that stress is n1, the amount ofdamage done at that stress is equal to n1/Ni. If the stress is changed from�1 to a new stress �2, the total damage done is:
�N
n1
1
� � �N
n2
2
� (Equation 17)
Failure is assumed to occur when the total damage (summation of all frac-tions ni/Ni) is equal to 1.
When stress-based analysis is used (as is assumed in the Palmgren-Miner model), the summation of cycle damage may be equal to one,greater than one, or less than one. For the case where the first stressamplitude is less than the second and the material strain hardens, thesummation is greater than one (“coaxing” or “understressing”). Alterna-tively, if the first stress amplitude is greater than the second (“overstress-ing”), the damage done at the second, lower-stress amplitude may begreater than that predicted by a summation of unity at fracture. That is,the summation is then less than unity. This is especially true if the firststress amplitude nucleates cracks in the material that grow at the secondstress amplitude.

22 � Fatigue Failures
There are additional reasons for actual behavior to deviate from thatpredicted by Miner’s Law including whether there is a change in the meanstress when the stress amplitude changes. If the minimum stress in thecycle is positive or zero, cyclic loading creates compressive residualstresses in front of the crack tip that result in a lowered net stress at thecrack tip and a reduced crack-growth rate. Conversely, if the minimumstress is compressive, residual tensile stresses are created at the crack tip,and the crack-growth rate is accelerated.
After the development of fracture mechanics analysis, it was recognizedthat a periodic overload could extend the life of a component—the oppositeeffect from that observed in stress-life testing. However, stress-life testingessentially measures crack initiation life, while the fracture mechanicsanalysis measures crack propagation life. As a result, alternative models topredict life have been developed. One such model is sometimes describedas rain-flow analysis. This procedure is described in ASTM Specification E1049, “Standard Practice for Cycle Counting in Fatigue Analysis,” and isalso discussed in detail in Reference 18. This procedure is not discussed inthis lesson, but it is important to remember that when maximum and mini-mum stresses vary with time there may be a different effect at long life thanat finite life and that periodic overloading does retard crack growth.
If microscale fractographic examination reveals the presence of stria-tions, striation spacing increases with stress (strain) amplitude. Therefore,a varying stress amplitude (for example, a periodic overload) can be iden-tified by study of the fracture surface.
Multiaxial Loading. The differences in fatigue behavior for uniaxial,bending, and torsional loading have been discussed. Models to predictbehavior for multiaxial loading conditions are more complex and less welldeveloped, and, again, two cases should be considered—initiation behav-ior and propagation behavior. Fracture mechanics analysis for propagationbehavior suggests that a second stress acting parallel to the crack-growthdirection does not have very much effect on the propagation rate in open-ing mode (mode I).
At first impression, multiaxial loading fatigue might be considered tobe relatively unimportant. However, there are many loading conditionsthat are combined bending and torsion. Furthermore, combined bendingand torsion fatigue for crankshafts is out of phase. As previously noted, lit-tle torsion data are collected. Therefore, it is necessary to have a modelthat will convert axial or bending data to torsion data. This lesson is notthe place for an extended discussion of fatigue modeling behavior for mul-tiaxial loading conditions with its heavy emphasis on mathematics, so it isdiscussed only briefly. Consult References 7, 18, and 19 for detailed dis-cussions of this matter.
When the stresses are in phase, multiaxial fatigue expressions are basedon both stress- and strain-based models. As for uniaxial fatigue, stress-based models were developed first and are more commonly used for long-life design, essentially determining initiation behavior. More recently,

Variables Affecting Fatigue Behavior � 23
multiaxial, strain-criteria models have been developed (Reference 7) andcan provide good agreement with experimental results.
One model that accurately predicts behavior for in-phase, combined bend-ing, and torsion rather well has been proposed by Gough (Reference 19):
��bB��2
� ��tT��2
� 1 (Equation 18)
where b and t are the fatigue limits in bending and torsion, respectively,and B and T are the applied stress amplitudes in bending and torsion.
Equation 18 assumes that the mean components of the stresses are zero.Intuition suggests that a normal stress acting on a crack tends to open thecrack and increase the rate of crack growth.
Sines and Waisman (Reference 3) and Lee (Reference 19) have pro-posed a modified form of the Gough equation that takes into account theeffect of the mean stress. Behavior can then be predicted when residualstresses are present. For in-phase stresses, the equation predicts that theapplication of a second, time-dependent stress degrades the fatigue behav-ior over that of a single cyclic stress, and the presence of a residual stressalso degrades behavior. The model associates the allowable alternatingprincipal stresses with the allowable mean principal stresses in a mannersimilar to the formulation of the distortion-energy-based multiaxial yieldcondition. The model is written as:
���1
2����(��1)
2 � (��2)2 � (��3)
2�1a/l2t� k1 � k2 (�1 � �2 � �3)mean (Equation 19)
The �� terms on the left side are the stress ranges for each of the threeprincipal stresses. The � terms on the right are the three mean stresses, andk1 and k2 are experimentally determined constants. If there is no meanstress, the k1 constant is the fatigue strength at some specified life, say theendurance limit. The k2 constant can then be obtained by running a secondtest, say zero to tension loading or can be taken as the Goodman slope (1⁄2)if no experimental data are available.
The importance of out-of-phase behavior is reflected by the inclusionof a model proposed by Langer (see Reference 19) in the ASME Boilerand Pressure Vessel Code (1974) and a modification of the model has beenincorporated into the ASME Code Case Studies (1978). The model con-verts out-of-phase loading conditions to an equivalent in-phase loadingcondition according to the equation:
SALT � ���B
2����1 � K2 � (1 � 2K2 cos 2 � K4)1/2�1/2
(Equation 20)
where SALT is the equivalent in-phase, multiaxial stress, B is the bendingstress, T is the torsion stress, K � 2B/T and cos (2) is the phase angle.Since development of the original model, other models have been pro-posed, and, again, the reader is referred to Reference 19.

24 � Fatigue Failures
The important point, as indicated by Equation 20, is that out-of-phaseloading is more detrimental to behavior than in-phase loading, and the sit-uation is the worst when the stresses are 90° out of phase.
Section Size. Laboratory fatigue specimens for stress-based analysisare typically cylindrical and about 7.62 mm (0.3 in.) in diameter. Strain-based-analysis specimens may be either similar-sized cylindrical orcompact-tension-type specimens (plate geometry) of variable thickness.There is a specimen size effect for both geometries. Early work (stress-based analysis) showed that there was a decrease in fatigue strength forbending and torsion loading with an increase in section size, but no effectfor axially loaded specimens. This size effect is presumably related to thevolume of highly stressed material and the likelihood of finding a defect inthat volume. As the specimen volume increases, it is more likely that adefect is present. There is a decrease of 15 to 20% in fatigue strength asthe section size increases to more than 25 mm (1 in.) in bending and tor-sion. There is also a section-size effect in compact-tension-type specimensbecause of the transition from plane-stress to plane-strain loading as thesection increases in thickness.
Stress Concentration and Shape. The presence of stress concentra-tion is known to often reduce the allowable stress on a component in long-life design. The first approach to account for stress concentration was tomultiply the alternating component of the nominal stress by the stress-concentration factor (kt) appropriate for the type of loading; that is, actualstress � nominal stress � kt, but not to modify the mean component of theapplied stress. (This assumes some inherent ductility in the material. If theductility is low, it is probably appropriate to also multiply the mean stressby the stress-concentration factor.) However, after more experience hadbeen gained, it became apparent that in some instances the notch did notdegrade behavior as much as predicted by correcting the nominal stress bythe stress-concentration factor. This resulted in two new parameters: thenotch sensitivity index, q, and the fatigue notch factor, kf. The fatiguenotch factor is experimentally determined as the stress to cause failure ofa notched specimen at a given life compared to that of an unnotched spec-imen at the same life, and kt is the theoretical stress-concentration factor.
The notch sensitivity index is defined so that it varies between zero andunity:
q � �k
kf
t �
�
1
1� (Equation 21)
kf � q(kt �1) � 1 (Equation 22)
Stress-concentration factors for common geometries are available inmany references. The most complete compilation is that due to Peterson,which has gone through four revisions and is currently available in Refer-ence 20.
Alternatively, kf may be estimated analytically by first calculating qfrom:
Component Geometry

Variables Affecting Fatigue Behavior � 25
q � �1 �
1�/ � (Equation 23)
where � is a material-sensitive constant and is the radius of curvature ofthe crack tip (References 18, 21).
If kf is equal to kt, then q � 1 and the notch does increase the stress aspredicted by kt. If the notch does not degrade the life as much as predictedby kt, then kf is less than kt and q is less than one. Notch sensitivity varieswith the microstructure as well as with the magnitude of the appliedstresses. In general, notch sensitivity is higher at long life and therefore atlow stresses. Notch sensitivity tends to increase with general strength levelof the material, so that a high hardness tempered martensitic microstruc-ture has a greater notch sensitivity than a hot-rolled pearlitic microstruc-ture. For a ductile material, stress concentration causes local plastic flowat the crack tip, relieving the stress concentration. Because q tends to be relatively high for higher-strength materials such as quenched-and-tempered steels, the allowable stress is not changed very much (say 10%)for a given life when kt is reduced to kf. Alternatively, the notch sensitivityof cast irons is typically quite low in comparison to wrought steels. This isbecause of the low-strength graphite present in a not-very-ductile pearliticmicrostructure.
Microstructure. Fatigue strength tends to increase with tensilestrength to some upper limit dependent on the material (689 MPa, or 100ksi, for steels, 172 MPa, or 25 ksi, for aluminum alloys) (Figures 12–15).At the higher strength levels, the steel microstructures are either bainiticor tempered martensite, which implies that the carbon content must behigh enough to respond to heat treatment. Because there is strong evi-dence that inclusions play a major role in initiating fatigue fracture, espe-cially at higher strength levels, it is possible that these limits could beimproved with increased material cleanliness. It has been reported thatabove 40 HRC, inclusions play a much stronger role in initiating fatiguecracks (Reference 22). It is at this same hardness level that the fatiguestrength for specific alloys begins to deviate from a linear relationshipbetween monotonic and cyclic strength that is likely caused by differencesin response to tempering.
A reduction in grain size is generally considered to improve fatiguestrength. However, as previously noted, a reduction in grain size increasescrack-initiation life, but decreases propagation life. There is a secondeffect of grain size in steels. The stress to initiate cleavage fracturedepends on grain size. If the temperature of the fatigue test is below thatrequired to initiate cleavage for a given grain size and the maximum stressin the fatigue cycle is greater that the cleavage initiation stress, cleavagecracking occurs during load cycling and accelerates fatigue crack propa-gation rates (Reference 23).
Inclusions. Inclusions play an important role in fatigue crack initiation,especially at higher strength (hardness) (Reference 22). The amount ofdamage done by the presence of inclusions depends on the type of inclu-sion, volume fraction and their distribution in the microstructure. Thereare three types of inclusions:
Manufacturing/AssemblyMethod
26 � Fatigue Failures
� Sulfide types, which can have a globular or stringer morphology
� Oxide types, which are spheroidal
� Faceted inclusions, of which the most important are the alloynitrides present in the HSLA steels
The oxide- or refractory-type inclusions and the faceted-type inclusionshave high strengths and low deformability. The sulfide-type inclusions, onthe other hand, are ductile and have low strengths.
Calcium (zirconium is also used) ladle additions are also important.Calcium additions are made primarily for inclusion shape control and itsinfluence on lamellar tearing. In noncalcium-treated steels, inclusionspresent include manganese sulfides, oxides, and some silicates. The sul-fides are usually present as stringers, and the oxides form a beadedstring. After calcium treatment, the inclusions are spheroidal and retainthis shape upon further deformation processing. These new inclusionsconsist of phases containing aluminum, calcium, sulfur, and oxygen.The net effect is to decrease the anisotropy of mechanical propertiesincluding fatigue crack propagation rates and also to decrease crack-propagation rates in any direction. Wilson (Reference 24), in an exten-sive study of six different pressure-vessel and alloy structural steels,compared fatigue crack propagation rates at a strength level where inclu-sions are believed to be important. For the six steels studied, theimprovement in anisotropy of crack-propagation rates (averaging crackpropagation in the longitudinal direction to crack propagation in thetransverse direction) ranged from 2 to 58% for the calcium treatment(i.e., decreases in the Paris exponent, m). Comparing only crack-propa-gation rates in the longitudinal direction (poor-property direction),improvement ranged from 5 to 59%.
The near-surface microstructure of a component may be altered eitherdeliberately as in the case of surface-treated components or inadvertentlydue to processing or a reaction with the service environment. Commonferrous-alloy, surface-treating procedures (induction hardening, carbur-izing, nitriding, etc.), if properly carried out, can produce dramaticincreases in allowable bending and torsional loads (see Lesson 3). Howev-er, decarburization can seriously degrade fatigue behavior (Figure 19)(Reference 11). Surface decarburization is typically present in hot-rolledmaterial and may be present due to improper heat treating and other man-ufacturing operations. In order to help mitigate the effects of surfacedecarburization without the expense of removing this layer by machiningor grinding, it is not uncommon to shot peen a heat treated part. The shot-peening operation produces a beneficial (surface compression) residualstress pattern. However, if the proper type of shot and the peening intensi-ty is not properly selected, the peening can be too intense. In this case, thecompressive stresses on the surface become too high, increasing the mag-nitude of the subsurface tensile stresses. Failure can then initiate in theregion of tensile stress. Standards for critical parts, especially in the aero-space industry, typically impose strict requirements on the permissibleamount of decarburization.

Variables Affecting Fatigue Behavior � 27
�������������������� ��
�������������������� ���
�����
�����
�����
�����
�����
������
������
������
������
������
��� ��� ��� ��� ��� ���
������ ! �������� ������ "#"$�� �%
&� ��"���� ���� '% ��� µ�� &&� ��"�����(�� � �� µ�� &&����� �� )�"�����(�� ��*�+ �� µ�� &&����� �� )�"�����(�� ��*�+ �� µ�� &&
,���$ " $��- ���� ������$ -�� �����$��
�� �� �+� �**�� "��"�$ ���*������� ! � ��� ��
$���+� ! ��� � ���"� ��"�����(�� �. �+�
�$� "+���� �+� ��� �(��
Figure 19. Variation in S-N behavior due to grain size, cold work (CF),and surface roughness (AA). Source: Reference 11.
Castings, heat treated or not, tend to have lower fatigue strengths thanthe same material in the wrought condition (Figure 15), and the ratio ofthe long-life fatigue strength to tensile strength may also be lower. Figure20 indicates that the wrought material is about 14% better at long life thanthe cast material. Additionally, there is far more scatter in plots of fatiguestrength versus tensile strength and hardness versus fatigue strength forthe as-cast materials (Figures 15). This is at least in part due to imperfec-
Max
imum
stre
ss, k
si
Max
imum
stre
ss, M
Pa
25
20150
30
35
40
45
50
55
CastWrought
94 (648)90 (620)
56 (386)56 (386)
2527
Wrought
Wrought
Cast
Cast
187170
200
250
300
350
Nonotch
Notch
105 106
Cycles to failure
Tensilestrength
ksi (MPa)
Yieldstrength
ksi (MPa)Elongation,
%Hardness,
HB
107104 108
Figure 20. Comparison of S-N behavior for wrought and cast material.Material is SAE 1040 as-cast and in the normalized-and-tempered condi-tion. Stress-concentration factor for notched specimen � 2.2. Adaptedfrom Reference 25.
28 � Fatigue Failures
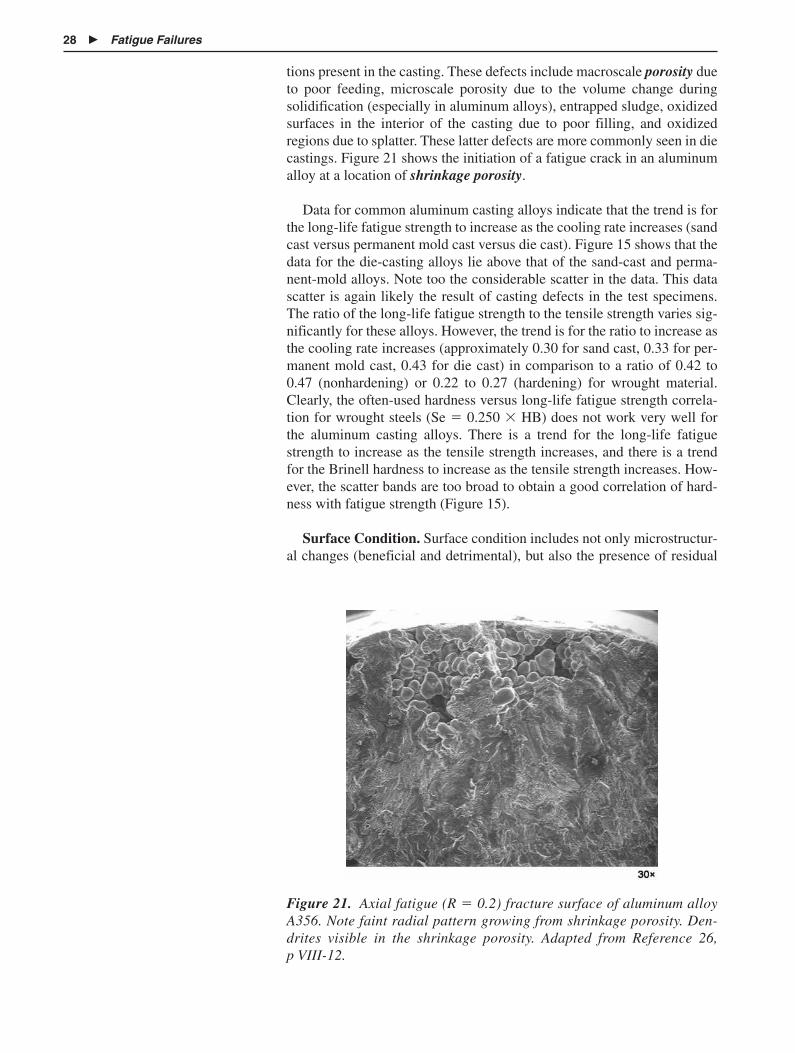
tions present in the casting. These defects include macroscale porosity dueto poor feeding, microscale porosity due to the volume change duringsolidification (especially in aluminum alloys), entrapped sludge, oxidizedsurfaces in the interior of the casting due to poor filling, and oxidizedregions due to splatter. These latter defects are more commonly seen in diecastings. Figure 21 shows the initiation of a fatigue crack in an aluminumalloy at a location of shrinkage porosity.
Data for common aluminum casting alloys indicate that the trend is forthe long-life fatigue strength to increase as the cooling rate increases (sandcast versus permanent mold cast versus die cast). Figure 15 shows that thedata for the die-casting alloys lie above that of the sand-cast and perma-nent-mold alloys. Note too the considerable scatter in the data. This datascatter is again likely the result of casting defects in the test specimens.The ratio of the long-life fatigue strength to the tensile strength varies sig-nificantly for these alloys. However, the trend is for the ratio to increase asthe cooling rate increases (approximately 0.30 for sand cast, 0.33 for per-manent mold cast, 0.43 for die cast) in comparison to a ratio of 0.42 to0.47 (nonhardening) or 0.22 to 0.27 (hardening) for wrought material.Clearly, the often-used hardness versus long-life fatigue strength correla-tion for wrought steels (Se � 0.250 � HB) does not work very well forthe aluminum casting alloys. There is a trend for the long-life fatiguestrength to increase as the tensile strength increases, and there is a trendfor the Brinell hardness to increase as the tensile strength increases. How-ever, the scatter bands are too broad to obtain a good correlation of hard-ness with fatigue strength (Figure 15).
Surface Condition. Surface condition includes not only microstructur-al changes (beneficial and detrimental), but also the presence of residual
Figure 21. Axial fatigue (R � 0.2) fracture surface of aluminum alloyA356. Note faint radial pattern growing from shrinkage porosity. Den-drites visible in the shrinkage porosity. Adapted from Reference 26, p VIII-12.
Variables Affecting Fatigue Behavior � 29
stresses and surface roughness. Decarburization, discussed in a later sec-tion, is one detrimental change in ferrous parts.
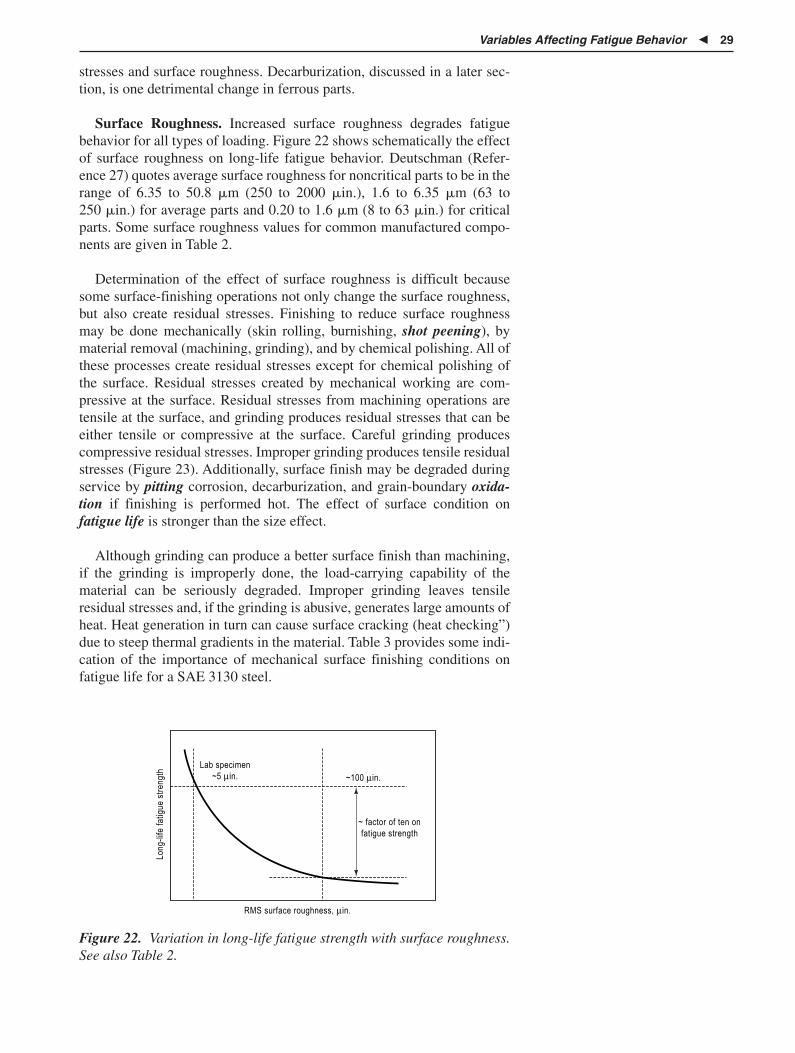
Surface Roughness. Increased surface roughness degrades fatiguebehavior for all types of loading. Figure 22 shows schematically the effectof surface roughness on long-life fatigue behavior. Deutschman (Refer-ence 27) quotes average surface roughness for noncritical parts to be in therange of 6.35 to 50.8 �m (250 to 2000 �in.), 1.6 to 6.35 �m (63 to250 �in.) for average parts and 0.20 to 1.6 �m (8 to 63 �in.) for criticalparts. Some surface roughness values for common manufactured compo-nents are given in Table 2.
Determination of the effect of surface roughness is difficult becausesome surface-finishing operations not only change the surface roughness,but also create residual stresses. Finishing to reduce surface roughnessmay be done mechanically (skin rolling, burnishing, shot peening), bymaterial removal (machining, grinding), and by chemical polishing. All ofthese processes create residual stresses except for chemical polishing ofthe surface. Residual stresses created by mechanical working are com-pressive at the surface. Residual stresses from machining operations aretensile at the surface, and grinding produces residual stresses that can beeither tensile or compressive at the surface. Careful grinding producescompressive residual stresses. Improper grinding produces tensile residualstresses (Figure 23). Additionally, surface finish may be degraded duringservice by pitting corrosion, decarburization, and grain-boundary oxida-tion if finishing is performed hot. The effect of surface condition onfatigue life is stronger than the size effect.
Although grinding can produce a better surface finish than machining,if the grinding is improperly done, the load-carrying capability of thematerial can be seriously degraded. Improper grinding leaves tensileresidual stresses and, if the grinding is abusive, generates large amounts ofheat. Heat generation in turn can cause surface cracking (heat checking”)due to steep thermal gradients in the material. Table 3 provides some indi-cation of the importance of mechanical surface finishing conditions onfatigue life for a SAE 3130 steel.
Long
-life
fatig
ue s
treng
th
RMS surface roughness, µin.
Lab specimen~5 µin. ~100 µin.
~ factor of ten onfatigue strength
Figure 22. Variation in long-life fatigue strength with surface roughness.See also Table 2.
30 � Fatigue Failures
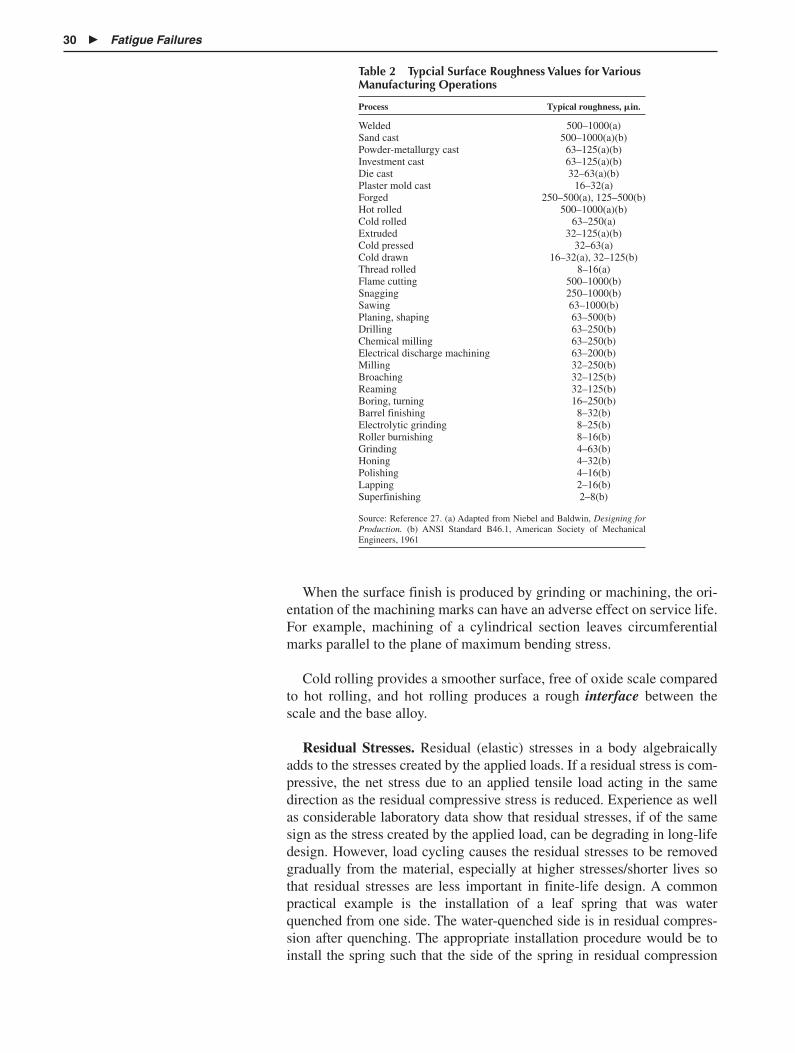
Table 2 Typcial Surface Roughness Values for VariousManufacturing Operations
Process Typical roughness, �in.
Welded 500–1000(a)Sand cast 500–1000(a)(b)Powder-metallurgy cast 63–125(a)(b)Investment cast 63–125(a)(b)Die cast 32–63(a)(b)Plaster mold cast 16–32(a)Forged 250–500(a), 125–500(b)Hot rolled 500–1000(a)(b)Cold rolled 63–250(a)Extruded 32–125(a)(b)Cold pressed 32–63(a)Cold drawn 16–32(a), 32–125(b)Thread rolled 8–16(a)Flame cutting 500–1000(b)Snagging 250–1000(b)Sawing 63–1000(b)Planing, shaping 63–500(b)Drilling 63–250(b)Chemical milling 63–250(b)Electrical discharge machining 63–200(b)Milling 32–250(b)Broaching 32–125(b)Reaming 32–125(b)Boring, turning 16–250(b)Barrel finishing 8–32(b)Electrolytic grinding 8–25(b)Roller burnishing 8–16(b)Grinding 4–63(b)Honing 4–32(b)Polishing 4–16(b)Lapping 2–16(b)Superfinishing 2–8(b)
Source: Reference 27. (a) Adapted from Niebel and Baldwin, Designing forProduction. (b) ANSI Standard B46.1, American Society of MechanicalEngineers, 1961
When the surface finish is produced by grinding or machining, the ori-entation of the machining marks can have an adverse effect on service life.For example, machining of a cylindrical section leaves circumferentialmarks parallel to the plane of maximum bending stress.
Cold rolling provides a smoother surface, free of oxide scale comparedto hot rolling, and hot rolling produces a rough interface between thescale and the base alloy.
Residual Stresses. Residual (elastic) stresses in a body algebraicallyadds to the stresses created by the applied loads. If a residual stress is com-pressive, the net stress due to an applied tensile load acting in the samedirection as the residual compressive stress is reduced. Experience as wellas considerable laboratory data show that residual stresses, if of the samesign as the stress created by the applied load, can be degrading in long-lifedesign. However, load cycling causes the residual stresses to be removedgradually from the material, especially at higher stresses/shorter lives sothat residual stresses are less important in finite-life design. A commonpractical example is the installation of a leaf spring that was waterquenched from one side. The water-quenched side is in residual compres-sion after quenching. The appropriate installation procedure would be toinstall the spring such that the side of the spring in residual compression

Variables Affecting Fatigue Behavior � 31
Com
pres
sion
Res
idua
l stre
ss, k
siTe
nsio
n
Gentle
A46HV2000
"LS"
Sulf.oil
Conventional
A46KV6000
.001
Sol. oil(1:20)
Abusive
A46MV8000
.002
Dry
WheelWheel speed
ft./min.Down feed
in./passGrinding
fluid
−40
−60
+40
+60
+80
+100
+120
0.0020 0.004 0.006
Depth below surface, in.
0.008 0.010 0.012
Grinding conditions
0
−20
+20
Gentle
Conventional Abusive
Gentle
Conventional Abusive
Figure 23. Residual stress patterns created by grinding operations. Gen-tle grinding produces a compressive residual stress at the surface. Moresevere grinding produces tensile residual stresses at the surface. Material:AISI 4340. Source: Reference 21.
Table 3 Effect of Mechanical Surface Finishing on the Fatigue Life of a SAE 3130Steel
Type of finish Surface roughness, �in. Median fatigue life, cycles
Lathe formed 105 24,000Partly hand polished 6 91,000Hand polished 5 137,000Ground 7 217,000Ground and polished 2 234,000Superfinished 7 212,000
Source: Reference 28
was oriented such that it was subjected to tensile stresses created by theapplied load. Although compressive residual stresses may be beneficial tolife, allowable, maximum-design service loads are not increased based onan assumption of beneficial residual stresses. Residual stresses created byvarious manufacturing processes are discussed in Lesson 2.
Figure 24 shows that surface compressive residual stresses created in ashot-peening operation can improve significantly fatigue behavior at long

32 � Fatigue Failures
C = T
Residual stress
T
0Tension Compression
C
C
Peened surface
Figure 24. Residual stress pattern created by shot peening. Source: Ref-erence 21.
Figure 25. Improvement of fatigue behavior due to surface treating byshot peening and by nitriding in production crankshafts. Source: Refer-ence 29.
life. Figure 25 shows the basis for the improvement on fatigue strength atlong life obtained by the presence of residual stress. The same magnitudeof the bending stress is present in Figures 33 (a and b) of Lesson 2. How-ever, in Figure 25, a residual stress is present so the net stress acting on thepart is the sum of the applied stress and the residual stress. Note that in thepresence of a compressive residual stress, the maximum tensile stress inthe part may occur below the surface. If the peening operation is toosevere, the residual tensile stress below the surface becomes too large,crack initiation is subsurface, and the fatigue strength is degraded.
Heat Treatment. A significant source of fatigue strength degradation,especially in forgings and age-hardening aluminum alloys is overheating

Variables Affecting Fatigue Behavior � 33
during hot forming and/or during a solution anneal. Overheating of a inho-mogeneous ferrous alloy microstructure results in excessive grain growthand a nonuniform grain size. In aluminum alloys, overheating during thesolution anneal prior to aging can cause eutectic melting (partial liqua-tion, incipient melting). Attempts to homogenize the cored microstructurecontaining a divorced eutectic by solution annealing can result in a rever-sal of the eutectic reaction, causing molten metal to be present in the grainboundaries or interdendritic regions. Microstructural inspection revealsthis imperfection. Following incipient melting, the melted region con-tracts, occupying less volume than it did as a liquid, leaving shrinkagecavities in the material at grain boundaries. These regions then becomesites for crack initiation.
There can be additional problems associated with overheating of fer-rous alloys containing manganese sulfide (MnS) inclusions. If the anneal-ing or hot-working (forging) temperature is too high, some MnS goes intosolution and is then reprecipitated during cooling, often in the grainboundaries.
Decarburization results any time steel is heated to an elevated tempera-ture in air. Consequently, hot-rolled ferrous alloys typically show decar-burization at the surface. Decarburization can also occur during improper-ly controlled, surface-treating operations and also quench-and-temperoperations. Concurrent with decarburization, there may also be oxide for-mation in grain boundaries intersecting the surface of the material. Figure19 shows the effects of decarburization on the fatigue strength of a 1042steel.
Quench Cracks. Quench cracking is the consequence of the develop-ment of large residual stresses that cannot be relieved by plastic deforma-tion of the fresh martensite formed during the quench from the austeniti-zation temperature. These cracks originate from both the thermal stressesand the phase-transformation stresses that develop during quenching. Thelikelihood of cracking is increased with an increase in quench severity (Hvalue), sharp edges, rough surfaces, too high an austenitizing temperatureand too high hardenability. Quench cracking may be “delayed” in that itoccurs after the material has been removed from the quench tank butbefore the interior of the part has cooled. In high-hardenability materials,the interior region can transform to martensite and promote cracking at thesurface. The problem is avoided in many high alloy steels by never lettingthe material cool to room temperature and to temper immediately afterquenching.
Quench cracks are intergranular. If cracking occurs prior to temper-ing, decarburization and scale formation, both of which can be identifiedby metallographic examination, may occur in the crack.
Interference Fits. Fatigue strength of joints can be improved byobtaining some minimum amount of interference between the two parts.The resulting state of stress is then beneficial to the fatigue behavior. Sucha situation is shown in Figure 26, which illustrates the improvement infatigue strength of an aluminum-alloy component containing a steel pin(Reference 16).

34 � Fatigue Failures
Pin
inte
rfere
nce,
in.
1.0
−1.0
0
2.0
3.0
× 10−3
107
Endurance, n108105 106
Figure 26. Improvement of fatigue strength of press-fitted assemblies.Data shown are for an interference fit of a steel pin in a hole in an alu-minum alloy. Source: Reference 16.
Identification Marking. Improper identification marking may degradebehavior by providing a crack-initiation site. In high-strength, low-ductility materials or in brittle materials such as gray cast iron, the stamp-ing of an identification number is likely to provide a crack-initiation site.For cast or forged products, it is better to use raised rather than indentedmarking. For identification of machined surfaces, machinist’s marking inkis preferable to electric pen etching, but both of these techniques are betterthan indentation stamping. Location of the marking is also important. Themarkings should be located in a low-stress area of the component.
Inspection Damage. Hardness testing for inspection purposes can cre-ate local stress risers that initiate fracture, especially if the material has ahigh hardness. Magnetic-particle testing can cause much damage if theprobe used for testing touches the surface of the part. The local heatingcaused by the arc strike can create untempered martensite and pitting.
Plating Operations. Plating is usually detrimental to the fatiguestrength of components. Carbon and low-alloy steels of high hardness aresusceptible to damage due to hydrogen absorption during the platingprocess. A soft plating alloy (zinc or cadmium) may inhibit the escape ofhydrogen from the steel and lead to hydrogen damage. Properly done athigh-current densities, plating minimizes potential damage, especially ifthe material is baked after plating at a temperature of about 190 °C (375 °F) for 24 h. Hard-plating materials (chromium) usually contain ten-sile residual stresses after plating. Cracks that develop in the plating act as

Variables Affecting Fatigue Behavior � 35
local stress risers and facilitate cracking of the base metal. Shot peening ofthe base metal prior to plating produces a compressive residual stress pat-tern in the base metal and can prevent the propagation of plating cracks inthe base metal. Government specifications QQ-C-320 and MIL-G-26074A specify shot peening prior to chromium or electroless nickel plat-ing for all design conditions requiring long-life fatigue strength. Chromeplating is covered by ASTM Specification B 177.
Service environment has a major effect on the fatigue behavior of machinecomponents. It includes not only high-temperature service (with both car-burization and decarburization possible in steels and overaging of precipi-tation-hardened materials), but also simultaneous creep deformation andthe possibility of aqueous corrosion, which can result in corrosion fatigueor stress-corrosion fatigue.
Corrosion fatigue is the term used to describe fatigue behavior in a cor-rosive environment. In that sense, testing in air might be considered corro-sion fatigue, and, in fact, one model for fatigue-crack initiation assumesthat crack initiation occurs at slip-band extrusions and intrusions due tothe adsorption of oxygen atoms on the exposed slip planes. Fatigue testsrun in vacuum show higher fatigue strength than tests run in dry air, airthat contains moisture, immersion in water, or in water that contains chlo-rides. Figures 27 and 29 show results of stress-based testing in a corrosiveenvironment, and Figure 29 shows da/dt-based test results. The effect ofthe corrosive environment on the da/dN plot is to shift the curve to the left.Note that this lowers the threshold value of �K. Note too that lower load-ing frequencies do more damage.
Sometimes fatigue data are plotted as crack-growth rate versus Kmax
rather than �K in cyclic loading (the same plot is used to monitor corro-sion crack-growth rate in static loading, Figure 28). The latter has the
ServiceEnvironment/CorrosionFatigue
Tors
iona
l stre
ss, k
g/m
m2
5
2
10
15
107
Number of cycles, n
108106
C
B
A
Figure 27. Comparison of S-N curves in torsion loading of a ferrousmarine propeller shaft. A, in air; B, in fresh water; C, in salt water. Adapt-ed from Reference 16.
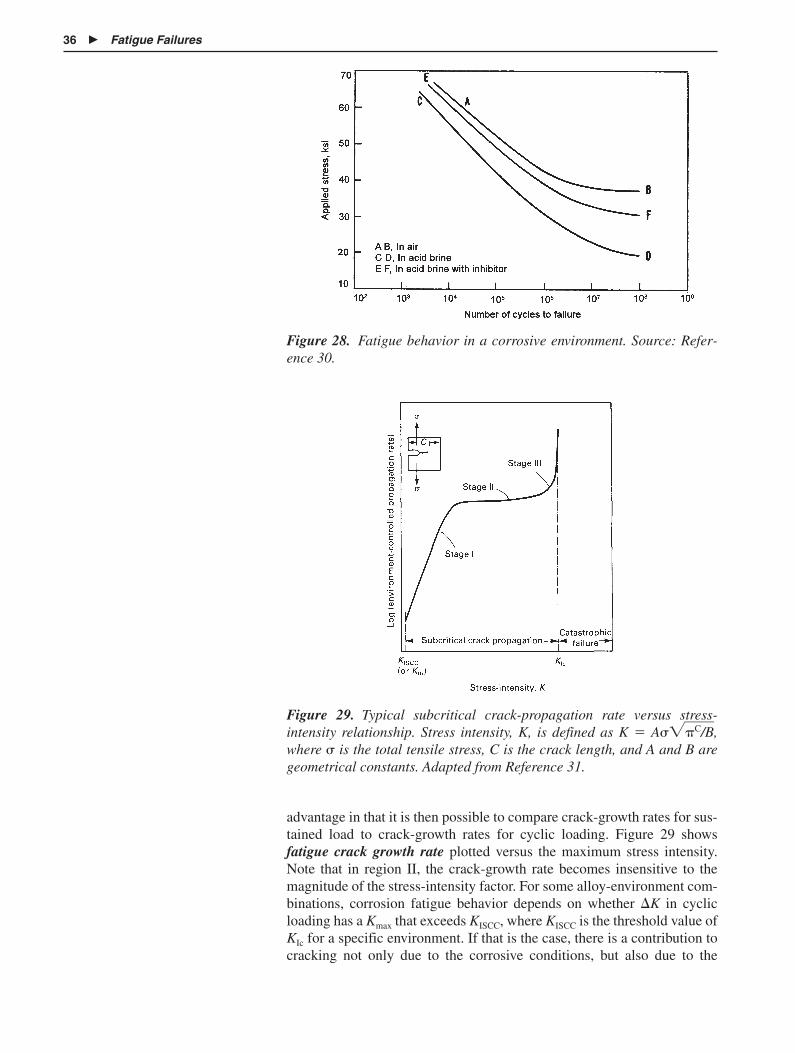
36 � Fatigue Failures
Figure 28. Fatigue behavior in a corrosive environment. Source: Refer-ence 30.
Figure 29. Typical subcritical crack-propagation rate versus stress-intensity relationship. Stress intensity, K, is defined as K � A���C/B�,where � is the total tensile stress, C is the crack length, and A and B aregeometrical constants. Adapted from Reference 31.
advantage in that it is then possible to compare crack-growth rates for sus-tained load to crack-growth rates for cyclic loading. Figure 29 showsfatigue crack growth rate plotted versus the maximum stress intensity.Note that in region II, the crack-growth rate becomes insensitive to themagnitude of the stress-intensity factor. For some alloy-environment com-binations, corrosion fatigue behavior depends on whether �K in cyclicloading has a Kmax that exceeds KISCC, where KISCC is the threshold value ofKIc for a specific environment. If that is the case, there is a contribution tocracking not only due to the corrosive conditions, but also due to the

Crack Initiation in Wrought Alloys � 37
growth rate due to the �K created by the mechanical loading. As a result,two different crack-growth conditions are identified: (1) true corrosionfatigue occurs when �K is less than �KISCC, and (2) corrosion-enhancedfatigue occurs when �K exceeds �KISCC.
Just as for monotonic loading, the macroscale location of crack initiationis that region where the stress created by the applied loads exceeds thestrength of the material. The stresses created by the applied loads in turndepend on the presence of both macroscale and microscale stress concen-tration, and the microstructure may not be constant across the cross sec-tion.
For bending and torsion, the maximum nominal stress is at the surfaceand the surface often contains macroscale and microscale imperfectionsthat act as stress risers. Therefore, macroscale crack initiation at, or near,the surface is expected unless internal imperfections, an inadequate casedepth or profile, or residual stresses can shift the location site to a subsur-face location. Note that a centerline manufacturing imperfection cannotinitiate a crack in this situation since there is no stress at that location inbending or torsion loading.
For axial loading, the stress is constant across the cross section In thesecases, surface condition (microstructure and surface roughness) as well asthe presence of residual stresses and the presence of any fabricationdefects commonly located either near the centerline or at the surface causecrack initiation at one of these two locations. Figure 30 shows crack initi-ation along the centerline due to a fabrication imperfection. Note thiscomponent could not have failed in bending or torsion fatigue becausethere is no stress acting along the centerline for those loading conditions.
A common microscale, crack-initiation site in a commercial alloy is atan inclusion. In steels, these inclusions would likely be MnS, and the ini-tiation mechanism is by debonding at the matrix/inclusion interface. Inhigher-strength, limited-ductility steels, crack initiation can occur in thematrix due to stress concentration from a faceted inclusion. If the materialhas been previously cold worked, the inclusions and/or second phases thatare present are typically cracked (Figure 31), and these microscale crackscan then act as fatigue crack initiation sites. Additional microscale initia-tion sites that have been observed include small cleavage cracks in steelsat low �K and large grain size, intergranular fracture, and shrinkageporosity. Imperfections that can initiate cracking at the surface includenicks and gouges, laps, and seams from forming, machining marks, corro-sion pits, spalls, and so forth. Centerline defects include shrinkage porosi-ty and bursts from prior plastic deformation.
Fundamental studies of crack initiation performed using high-puritysingle crystals have shown that fatigue cracks initiate at persistent slipbands at the surface of the specimen. Crack initiation can occur in com-mercial polycrystalline materials in the same way if not initiated first byinclusions or other second phases. If the surface of the specimen has a suf-ficiently small surface roughness, slip-band extrusions and intrusions canbe observed after cyclic loading (Figure 32), and, with further cycling, it is
Crack Initiation inWrought Alloys

38 � Fatigue Failures
Figure 30. Fatigue-crack initiation at a defect located near the center-line. Axial loading. Piston rod 20 cm (8 in.) diam of a forging hammer.Low-carbon steel. Surface hardness � 24 HRC, centerline hardness �17 HRC. Adapted from Reference 2, p 156.
Figure 31. Cracked grain-boundary cementite in a cold-rolled low-carbon steel. Optical micrograph. Etched. Magnification: 4000�. Cour-tesy of W.T. Becker.
seen that a microscopic crack initiates within the slip band. These obser-vations together with experimental evidence at high magnification verify

Crack Initiation in Wrought Alloys � 39
Figure 32. Slip-band extrusions on the surface of a cyclically loadedspecimen. Crack initiation is visible within the slip bands. Marker Apoints at the vertex of an intrusion at which a crack nucleus has formed.Source: Reference 32.
that fatigue failures can be initiated by slip and are therefore ductile fail-ures on a microscale. Exceptions can occur in steels when the combina-tion of test temperature and grain size permits cleavage crack formationand then continued growth from the cleavage crack. This is not expectedin materials that have a face-centered cubic (fcc) lattice.
Slip-band extrusions develop on the plane of maximum shear stress,which is often at 45° to the load, and the first stages of crack growth areknown as stage I fatigue failure as noted early in this lesson. This stage ofcrack growth occurs over small distances (a few grain diameters) and maybe difficult to identify when the fracture surface is observed with a scan-ning electron microscope (SEM). After stage I fatigue crack growth,development of a microscale and then a macroscale fatigue crack typical-ly occurs on the plane of maximum normal stress. These planes are identi-fied in Lesson 3. Stage I crack initiation (that is, on a plane of high shearstress) is not observed when �K is significantly above the threshold value.
Fractographic features of interest are those that distinguish cyclic frommonotonic loading and that may be present at both the macroscale andmicroscale. If the failure is identified as occurring due to cyclic load-ing, other features of primary interest are those that identify the crack-initiation site and the relative size of the fatigue and overload regions.
At the macroscale, fatigue cracks initiate where the local stress exceedsthe local strength. The presence of any material imperfections present in aregion of high nominal stress then controls the specific microscale initia-tion site. In bending or torsion loading, the maximum stress is at the sur-face of the material. The fracture initiation site is then expected to be nearor at the surface. Surface roughness magnifies the local stress at the sur-face, and the presence of a microscale imperfection such as an inclusioncould cause local stress concentration just below the surface. The actuallocation then depends on the relative magnitude of the stress at the two
Fractographic FeaturesAssociated with FatigueFailure—WroughtMaterial

40 � Fatigue Failures
microscale locations. The deeper the imperfection below the surface, thehigher the local stress concentration has to be to cause subsurface crackinitiation.
Other microscale initiation sites that have been observed include smallcleavage cracks, grain-boundary triple points (higher local stress), twinboundaries, and shrinkage porosity. Additional imperfections that can ini-tiate cracking at the surface include nicks and gouges, laps and seams,machining marks, corrosion pits, spalls, and so forth. Centerline defectsinclude shrinkage porosity and bursts from prior plastic deformation.
Fractographic features may be observed at both the macroscopic andmicroscopic scales. Short fatigue cracks when first initiated grow on theplane of maximum shear stress (stage I crack growth). However, thecracks soon turn and grow on the plane of maximum normal stress (stageII) if there is some degree of constraint. If the local stress is large, stage Igrowth may not be present. When thin sheets are loaded perpendicular tothe thin direction of the sheet, the macroscale fracture orientation can bedifferent from thicker sheets in which there is more constraint. Two differ-ent cases are possible: (1) if the sheet is moderately thick, initial plane-strain conditions change to plane stress resulting in crack propagation onplanes rotated 45° around the width direction, and (2) in thinner sheet, thecrack turns and runs on a plane rotated 45° around the thickness directionand around the width direction (see Reference 33 for more details).
At the macroscopic scale, fatigue cracks at low stress (long life) devel-op under essentially elastic loading conditions so that there is no net-section plastic yielding. This causes a fatigue crack to be tightly closed ifthe component has not completely fractured and no permanent distortionis visible in the component.
Three other features are commonly associated with macroscale appear-ance: beach marks (also called conchoidal marks, clamshell (or oystershell) marks, crack arrest marks), rubbing, and an increase in surfaceroughness between the fatigue region and the overload region. Beachmarks are regions of crack arrest or a sudden change in crack extensiondistance. They may be the result of interrupted loading, a sudden changein frequency, or a change in stress amplitude. Changes in stress amplitudeand frequency alter the rate of crack propagation, which changes surfaceroughness and light reflectivity. Increases in frequency can also result inlocal heating and discoloration at the crack tip. Interrupted loading per-mits concentration-cell oxidation at the crack tip. In steels, the oxideformed at the crack tip is dark and obvious. In other alloy systems, thecolor of the oxide may not be so strikingly different, but light reflectivityis changed. Additionally, microscale examination also easily identifies thepresence of an oxide due to the general loss in detail of the fractographicfeatures.
For loading conditions of constant stress amplitude and frequency,there will then be no beach marks due to discoloration unless the loadingis interrupted. Consequently, it cannot be concluded based on the absence
Macroscale FractureFeatures
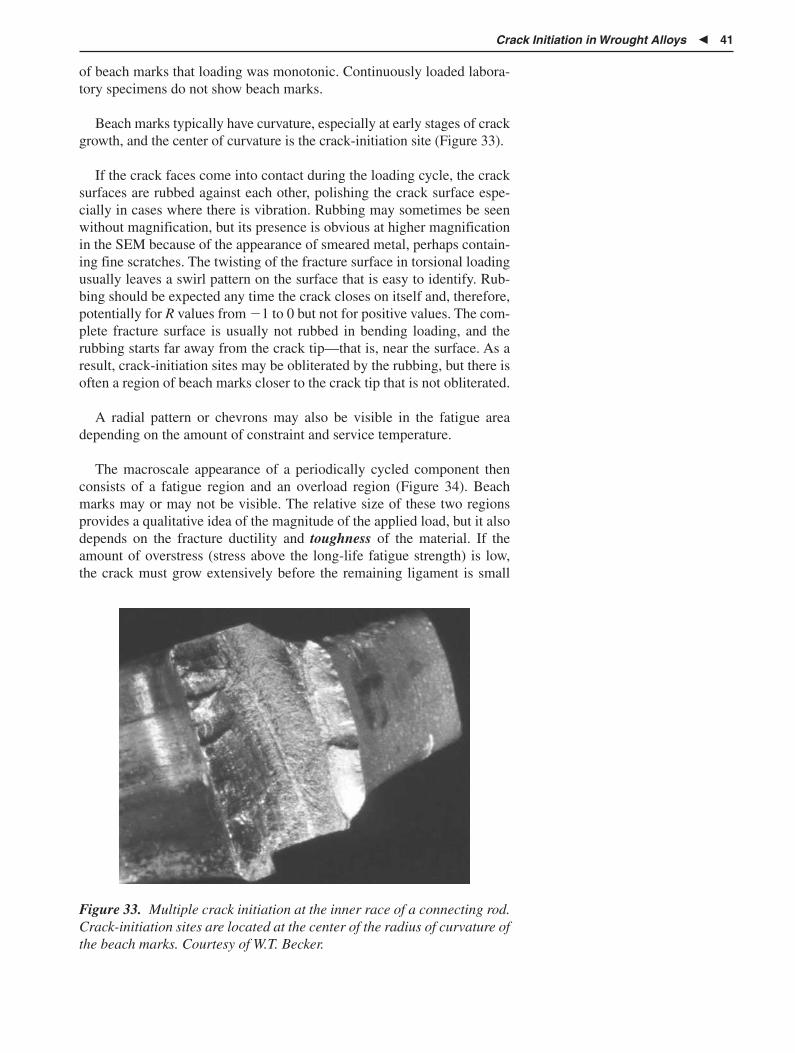
Crack Initiation in Wrought Alloys � 41
of beach marks that loading was monotonic. Continuously loaded labora-tory specimens do not show beach marks.
Beach marks typically have curvature, especially at early stages of crackgrowth, and the center of curvature is the crack-initiation site (Figure 33).
If the crack faces come into contact during the loading cycle, the cracksurfaces are rubbed against each other, polishing the crack surface espe-cially in cases where there is vibration. Rubbing may sometimes be seenwithout magnification, but its presence is obvious at higher magnificationin the SEM because of the appearance of smeared metal, perhaps contain-ing fine scratches. The twisting of the fracture surface in torsional loadingusually leaves a swirl pattern on the surface that is easy to identify. Rub-bing should be expected any time the crack closes on itself and, therefore,potentially for R values from �1 to 0 but not for positive values. The com-plete fracture surface is usually not rubbed in bending loading, and therubbing starts far away from the crack tip—that is, near the surface. As aresult, crack-initiation sites may be obliterated by the rubbing, but there isoften a region of beach marks closer to the crack tip that is not obliterated.
A radial pattern or chevrons may also be visible in the fatigue areadepending on the amount of constraint and service temperature.
The macroscale appearance of a periodically cycled component thenconsists of a fatigue region and an overload region (Figure 34). Beachmarks may or may not be visible. The relative size of these two regionsprovides a qualitative idea of the magnitude of the applied load, but it alsodepends on the fracture ductility and toughness of the material. If theamount of overstress (stress above the long-life fatigue strength) is low,the crack must grow extensively before the remaining ligament is small
Figure 33. Multiple crack initiation at the inner race of a connecting rod.Crack-initiation sites are located at the center of the radius of curvature ofthe beach marks. Courtesy of W.T. Becker.

42 � Fatigue Failures
Three stages: 1. Initiation 2. Propagation 3. Overload
2. Propagation If loading interrupted, beach marks occur.
1. Initiation, possible rubbing.
3. Overload Size of fatigue and overload regions depends on nominal and local stress.
If crack closes on itself, rubbing occurs and may obliterate initiation site.
1
2
3
Figure 34. Schematic appearance of the fracture surface of a cyclicallyloaded component. Three different zones may be present: (1) The imper-fection initiating the failure, (2) the fatigue region, which may containbeach marks; and (3) the overload region. Rubbing of the fracture surfacemay obliterate the evidence of the initiating imperfection and may obliter-ate some or all of the beach marks.
enough to raise the local strength above the ultimate strength. The fatiguearea is then large relative to the overload area. As the amount of overstressincreases, the size of the fatigue area is reduced relative to the overloadarea. Stress concentrators act in the same way as the amount of overstress.In heavy sections of low-fracture-toughness material, the fatigue regioncan be very small compared to the size of the overload region, say 0.8 mm(1⁄32 in.) deep or less in a 25 mm (1 in.) section. Consequently, carefulexamination is required.
The roughness of the overload region is greater than the fatigue region.The roughness of the overload region increases as the strength of thematerial decreases, but this region may have very few features if the mate-rial is of high hardness (50 HRC and greater). A radial pattern may or maynot be present. However, careful examination may show the presence ofratchet marks that then identify the initiation sites.
The roughness of the overload region also increases as the crack propa-gates. If the failed component has been surface treated, it is important notto base a conclusion regarding the fatigue and overload region just on sur-
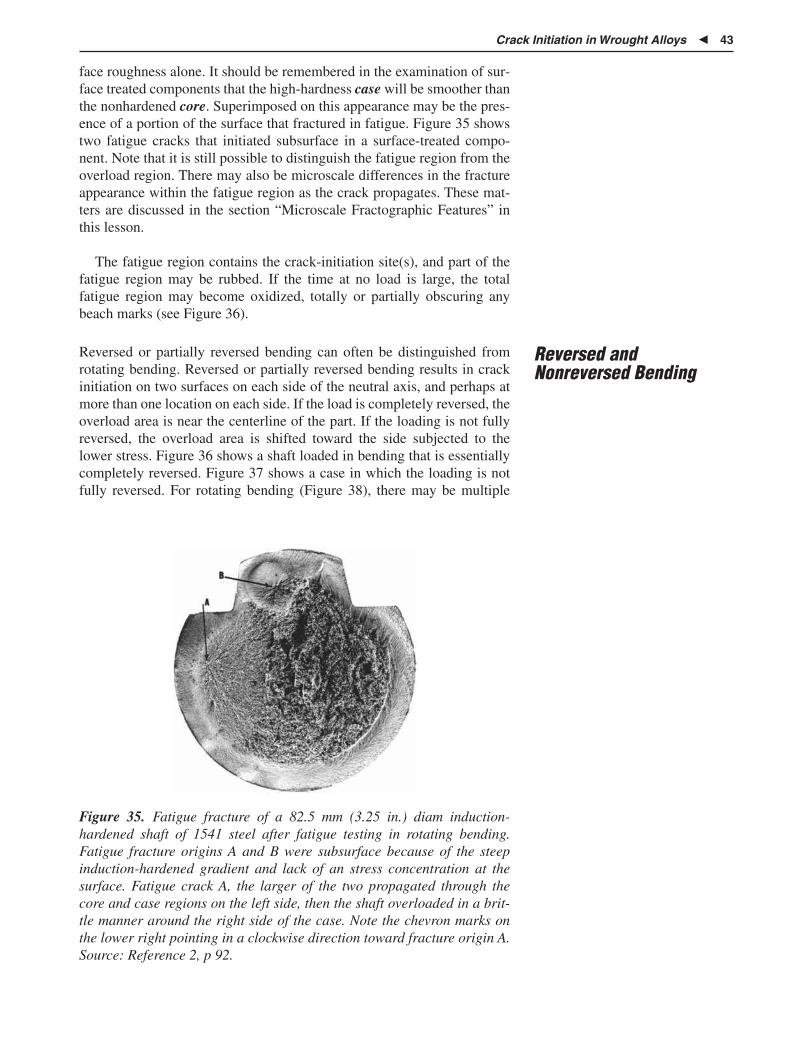
Crack Initiation in Wrought Alloys � 43
face roughness alone. It should be remembered in the examination of sur-face treated components that the high-hardness case will be smoother thanthe nonhardened core. Superimposed on this appearance may be the pres-ence of a portion of the surface that fractured in fatigue. Figure 35 showstwo fatigue cracks that initiated subsurface in a surface-treated compo-nent. Note that it is still possible to distinguish the fatigue region from theoverload region. There may also be microscale differences in the fractureappearance within the fatigue region as the crack propagates. These mat-ters are discussed in the section “Microscale Fractographic Features” inthis lesson.
The fatigue region contains the crack-initiation site(s), and part of thefatigue region may be rubbed. If the time at no load is large, the totalfatigue region may become oxidized, totally or partially obscuring anybeach marks (see Figure 36).
Reversed or partially reversed bending can often be distinguished fromrotating bending. Reversed or partially reversed bending results in crackinitiation on two surfaces on each side of the neutral axis, and perhaps atmore than one location on each side. If the load is completely reversed, theoverload area is near the centerline of the part. If the loading is not fullyreversed, the overload area is shifted toward the side subjected to thelower stress. Figure 36 shows a shaft loaded in bending that is essentiallycompletely reversed. Figure 37 shows a case in which the loading is notfully reversed. For rotating bending (Figure 38), there may be multiple
Reversed andNonreversed Bending
Figure 35. Fatigue fracture of a 82.5 mm (3.25 in.) diam induction-hardened shaft of 1541 steel after fatigue testing in rotating bending.Fatigue fracture origins A and B were subsurface because of the steepinduction-hardened gradient and lack of an stress concentration at thesurface. Fatigue crack A, the larger of the two propagated through thecore and case regions on the left side, then the shaft overloaded in a brit-tle manner around the right side of the case. Note the chevron marks onthe lower right pointing in a clockwise direction toward fracture origin A.Source: Reference 2, p 92.

44 � Fatigue Failures
Figure 36. Reversed-bending fatigue of a 4 cm (1.6 in.) diam shaft of1046 steel having an approximate hardness of 30 HRC. Ratchet marks arevisible at the surface on both sides, and the overload area is along thecenterline of the component, indicating essentially reversed-bending load-ing. Note the difference in appearance of the three different zones visiblein the photograph. Rubbing at both surfaces on the left and right sides hasobliterated evidence of any beach marks near the surface. The next regionis the relatively smooth fatigue region (but rougher than the rubbedregion), and the roughest region is the overload region along the center-line. Source: Reference 2, p 149.
Figure 37. Reversed-bending fatigue failure of an alloy steel steeringknuckle. Hardness is 30 HRC. Several ratchet marks are visible at the topand bottom, and beach marks are visible in the fatigue region. The asym-metrical location of the darker overload region indicates that the loadingwas not completely reversed (larger tensile load acting at the bottom).Source: Reference 2, p 150.

Crack Initiation in Wrought Alloys � 45
crack-initiation sites around the circumference, rather than crack-initia-tion sites being clustered in a small area.
When threaded fasteners fail in reversed or partially reversed bending,there is sometimes so much damage on the fracture surface that littleinformation is available. However, there is usually cracking in adjacentthread roots that can be studied either by metallographic examination orby opening the crack to complete the fracture. One way to open the crackis to cut into the material from the back side, chill the specimen in eitheracetone-dry ice or liquid nitrogen, and then clamp one end and tap the freeend with a hammer. There is no difficulty in distinguishing the region thatfailed. If it is a steel, cleavage occurs in the chilled region. In other caseswhen cleavage does not occur, microvoid coalescence dimple sizechanges.
The type of loading affects the number of crack-initiation sites. Thestress across the cross section can vary with the type of loading. In four-point bending, any location on the tension side between the two imposedloads sees the same stress. Consequently, any point along this distance canbe a site of crack initiation. Similarly, for three-point bending, crackingmay initiate on more than one plane near the point of load application.Cracking on two closely spaced planes at the same or almost the samenominal stress often results in a ratchet mark as the two cracks coalesceduring their growth. Ratchet marks are commonly seen in both bendingand torsion loading. See Lesson 3 for the various types of ratchet marksthat may develop for torsional loading.
Multiple crack-initiation sites may be difficult to identify, as might hap-pen in rotating bending or torsion, because the rubbing may obliterate anyearly stage beach marks or radial pattern. However, ratchet marks are pro-duced due to crack initiation on closely spaced parallel planes, and theirpresence aids in identifying multiple-site crack initiation. The magnitudeof the load as well as the type of loading affects the number of crack-initiation sites. In rotating bending, every point on the circumference atthe location of maximum bending moment sees the same mean and alter-nating stress. At nominal stresses below the fatigue strength, a fairly sig-nificant defect is required to raise the local stress above that required toinitiate the crack so that there is only one crack-initiation site. As the nom-inal stress is increased, the stress concentration required at an imperfec-tion to nucleate a crack is reduced so that multiple crack initiationbecomes more likely. At very high stress, the crack that initiates firstgrows so rapidly that it prevents other cracks from nucleating or growingto an appreciable length. Compare the number of crack-initiation sites inFigure 38 to that in Figure 39.
Multiple crack initiation in torsion is common, and cracking isobserved on both planes of maximum normal stress and maximum shearstress. This can result in as many as four different sets of planes on whichcracks propagate (two planes of maximum normal stress and two planesof maximum shear stress). The actual total number of fracture surfacescan be large because the shear and normal stresses are constant at anypoint on the circumference. Using the above information, it is possible to

46 � Fatigue Failures
Figure 38. Rotating bending fatigue failure in a 1050 steel shaft heattreated to 35 HRC. Multiple crack initiation at many locations from 2 o’clock to 8 o’clock, as shown by the presence of ratchet marks (smallshiny spots visible at the surface) located in a snap-ring groove. Finaloverload fracture is located off center near the left side. The location ofthe crack-initiation sites is attributed to an unbalanced load on the shaft.Source: Reference 2, p 133.
separate rotating bending from cantilever loading, which can be eitherreversed or nonreversed, and to determine if loading was multiaxial (e.g.,torsion with a small bending load).
When ductile, single-phase alloys are cyclically loaded, a characteristicfeature known as fatigue striations is often visible at the microscale (Fig-ure 40). Striations are especially prominent in some alloys—examplesinclude aluminum alloys, austenitic stainless steels, copper, and copperalloys. Whether striations are produced depends on multiple factors, themost important of which are the microstructure and the stress-intensityfactor. Striations develop in the region in which the da/dN � �K plot islinear—region II (Figure 41). The fracture mechanism in region III isoften microvoid coalescence, but it can also be intergranular separation.Less work has been done in characterizing the fracture appearance and themechanisms responsible for that appearance in region I, but it is oftendescribed as “brittlelike” (see Figure 41). Striation appearance changes as�K decreases in both ferrous and nonferrous materials. At low �K, thesize of the plastic zone at the crack tip approaches the scale of microstruc-tural features such as grain size, so that crystallographic orientationbecomes more important. It is argued that in this regime that Kmax may bemore important than �K. For steels, fractographic features in this regioninclude cleavage, intergranular fracture, and a “hill-and-valley” appear-ance. The presence of striations on the fracture surface is positive evi-
MicroscaleFractographic
Features—FatigueStriations

Microscale Fractographic Features—Fatigue Striations � 47
Figure 39. Rotating bending fatigue failure in a 1040 shaft containing akeyway. The fatigue crack initiated at the bottom left corner of the keywayand propagated downward and to the right. The final overload area isvery small and indicates that the nominal stress on the component wassmall. Curvature of the beach marks in a counterclockwise direction indi-cates that the shaft was rotating in the clockwise direction. Source: Refer-ence 2, p 152.
Figure 40. Fatigue striations in a 7075-T6 aluminum alloy. Note theincrease in striation spacing in two locations indicating an increase in�K. Source: Reference 2, p 122.
dence of cyclic loading and, therefore, of considerable importance in fail-ure analysis. However, their absence is not positive evidence of monoton-ic loading. As noted previously, the appearance of fatigue striationsdepends not only on the inherent ductility of the material, but also on thestress amplitude or, more accurately, the change in stress-intensity factor
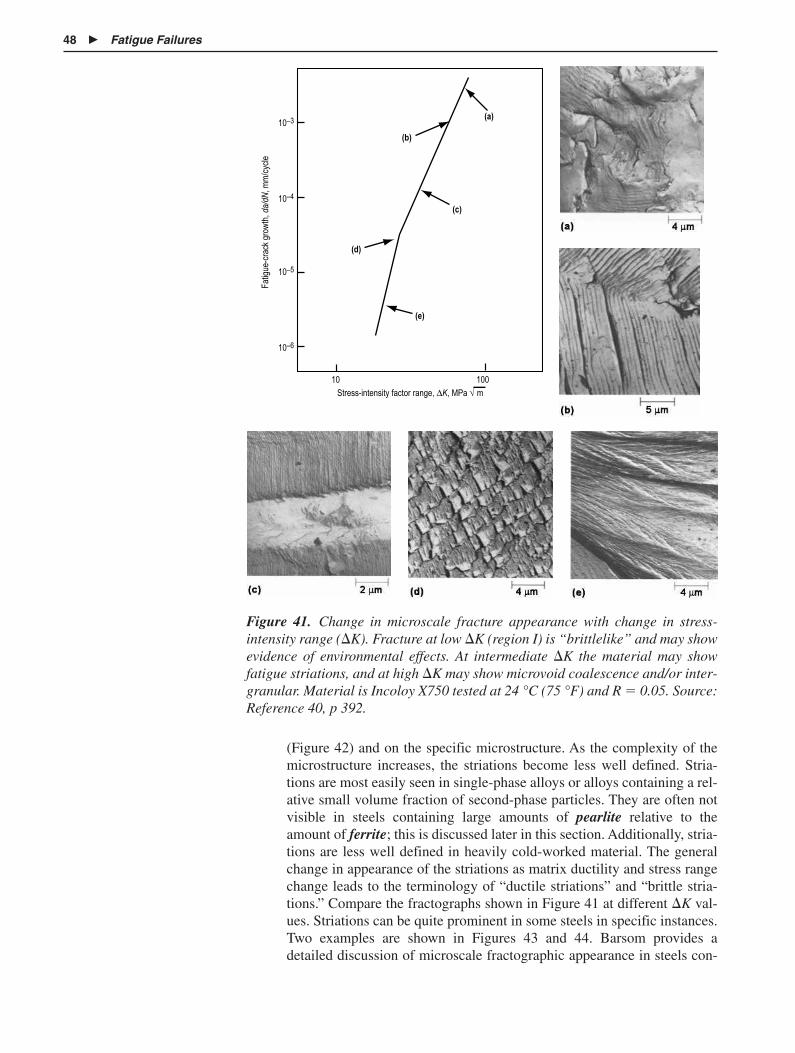
48 � Fatigue Failures
������������� ����
������
�������
���
���
���
���
���
����
����
����
����
�� ���
��������������� ����� ����� ∆�� � � √ �
Figure 41. Change in microscale fracture appearance with change in stress-intensity range (�K). Fracture at low �K (region I) is “brittlelike” and may showevidence of environmental effects. At intermediate �K the material may showfatigue striations, and at high �K may show microvoid coalescence and/or inter-granular. Material is Incoloy X750 tested at 24 °C (75 °F) and R � 0.05. Source:Reference 40, p 392.
(Figure 42) and on the specific microstructure. As the complexity of themicrostructure increases, the striations become less well defined. Stria-tions are most easily seen in single-phase alloys or alloys containing a rel-ative small volume fraction of second-phase particles. They are often notvisible in steels containing large amounts of pearlite relative to theamount of ferrite; this is discussed later in this section. Additionally, stria-tions are less well defined in heavily cold-worked material. The generalchange in appearance of the striations as matrix ductility and stress rangechange leads to the terminology of “ductile striations” and “brittle stria-tions.” Compare the fractographs shown in Figure 41 at different �K val-ues. Striations can be quite prominent in some steels in specific instances.Two examples are shown in Figures 43 and 44. Barsom provides adetailed discussion of microscale fractographic appearance in steels con-

Microscale Fractographic Features—Fatigue Striations � 49
Figure 42. Change in striation spacing with change in stress-intensity range. Source: Reference 41, p 22.
Figure 43. Fatigue striations in a vanadium HSLA steel. Source: Reference 34.
taining pearlite (See section “Additional Reading, General”). The difficul-ty in identifying striations involves crack growth around pearlite colonies,which results in multiple secondary cracking.
Various models to explain the microscale topography of ductile stria-tions have been developed, one of which is shown in Figure 45. Figure 45indicates that a striation is created for each load cycle, so the striationspacing is related directly to the rate of crack advance in the material.However, the ability to see the striation spacing depends on the resolutionof the imaging system. With inadequate resolution, a load cycle mightproduce striation spacing too small to be resolved. That is, every striationcorresponds to a load cycle, but every load cycle may not produce aresolvable striation. This is one of the complications in quantitative fracto-graphic analysis using the Paris Law to determine loading conditions. An

50 � Fatigue Failures
Figure 44. Fatigue crack propagation in compact tension test specimen of rail steel(0.69–0.82% C). Center: Fracture surface of typical specimen from rail head. Crack plane lies inthe cross section. First two circles at top identify precracked region. Fatigue crack propagationextends from second to sixth circle (from top to bottom). Bottom one-third of surface is region offast fracture. Magnification: 1.66�. Top left and top right: Fractographs of fatigue propagationregion in center photo illustrate typical fatigue striations. Note wavelike crests and variations ofwavelength near inclusion sites. Transmission electron microscopy replicas. Magnification:4900� and 4000�. Bottom left and bottom right: Two additional fractographs of fatigue crackpropagation region in center photo. Sharp crest outlines and lack of striation spacing changenear inclusions sites (arrows) identify these features as lamellar pearlite structure. Transmissionelectron microscopy replicas. Magnification: both at 4000�. Source: Reference 40, p 290.
abrupt change in striation spacing does provide positive evidence of anabrupt change in the stress-intensity factor range (Figure 40) and is anoth-er important microscale fractographic feature used to determine the load-ing conditions.
Because fatigue striations are the primary feature used to distinguishfatigue fractures from monotonic overload fractures, it is important not toconfuse fatigue striations with other microscale fractographic features.Fatigue striations are routinely discussed in the literature, and an examplefrom either an aluminum or stainless steel is often used to illustrate thefeature. Unfortunately, these ductile striations are not representative of the total range in appearance of striations in all alloys. Furthermore, theabsence of striations does not preclude a cyclic loading condition. Someexperience is necessary to not confuse striations with other microscale

Microscale Fractographic Features—Fatigue Striations � 51
Figure 45. Mechanism of fatigue crack propagation by alternate slip at thecrack tip. Sketches are simplified to clarify the basic concepts. (a) Crackopening and crack tip blunting by slip on alternate slip planes with increasingtensile stress. (b) Crack closure and crack tip resharpening by partial slipreversal on alternate slip planes with increasing compressive stress. Source:Reference 41, p 21.
features, especially in alloys where the striations are not sharply definedand in which other similar features are known to occur.
Identification of fatigue striations in pearlitic steels is complicated bythe confusion of pearlite lamella with striations on the fracture surface.Note that for Figure 44 the microstructure should be primarily pearlite.There is no obvious change in appearance as the crack propagates acrossferrite and pearlite. Other features are also helpful in identification: insteels, pearlite typically shows extensive branching (Figure 46), whilethere is little or no branching of fatigue striations. Fatigue striations typi-cally change spacing adjacent to inclusions or second-phase particles (seeFigure 44). Pearlite lamella adjacent to the same features do not changespacing. Another crack-propagation mechanism that leaves a microscaleridge pattern on the fracture surface is known as Wallner lines (Figure47). Wallner lines form under high-strain-rate loading conditions in brittlematerials such as glass, ceramics, and in brittle phases in metallic alloys.As shown in Figure 47, there are typically two sets of intersecting lineswhereas fatigue striations typically show only one set of lines. Secondly,fatigue striations typically are not produced in the brittle phases in whichWallner lines form.
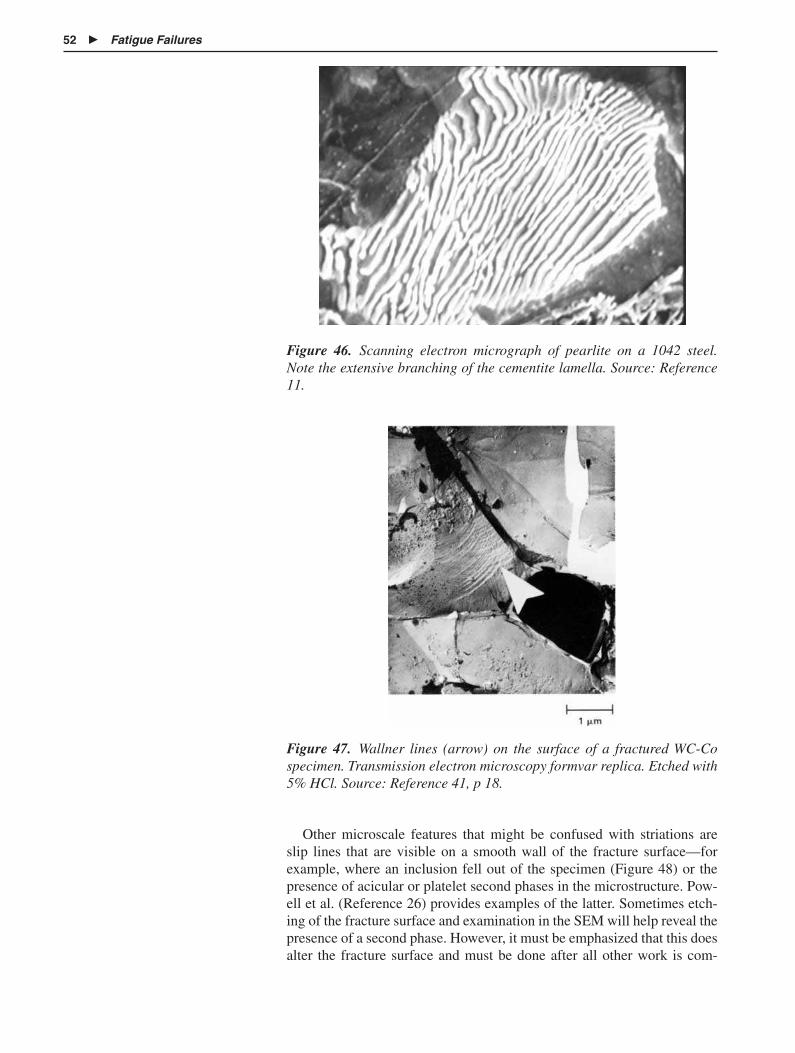
52 � Fatigue Failures
Figure 46. Scanning electron micrograph of pearlite on a 1042 steel.Note the extensive branching of the cementite lamella. Source: Reference11.
Figure 47. Wallner lines (arrow) on the surface of a fractured WC-Cospecimen. Transmission electron microscopy formvar replica. Etched with5% HCl. Source: Reference 41, p 18.
Other microscale features that might be confused with striations areslip lines that are visible on a smooth wall of the fracture surface—forexample, where an inclusion fell out of the specimen (Figure 48) or thepresence of acicular or platelet second phases in the microstructure. Pow-ell et al. (Reference 26) provides examples of the latter. Sometimes etch-ing of the fracture surface and examination in the SEM will help reveal thepresence of a second phase. However, it must be emphasized that this doesalter the fracture surface and must be done after all other work is com-

Microscale Fractographic Features—Fatigue Striations � 53
Figure 48. (a) Slip step formation resulting in serpentine glide and ripples on adimple wall. (b) Serpentine glide formation (arrow) in oxygen-free high-conductivitycopper specimen. Source: Reference 41, p 16, 17
pleted. Secondly, if litigation is involved in the failure, it may be necessaryto obtain a court order to etch the fracture surface.
One technique that can be used to characterize the microscale featuresof fracture surfaces in relation to the microstructure is to prepare a metal-lographic specimen showing a plane normal to the fracture surface. Attimes second phases or other microstructural constituents are not visibleon the fracture surface (as pearlite in steels). However, optical examina-tion of an etched microstructure can clearly show whether the fracturepath is controlled by microstructural features. A good example is the frac-ture process in aluminum-silicon casting alloys (see the section “CrackInitiation and Propagation in Cast Alloys” in this lesson).
Fatigue striations are formed at intermediate levels of �K and crack-growth rate—that is, in the linear portion of the da/dN versus �K curve. Athigh levels of either da/dN or �K (region III), the fracture surface of amaterial having some ductility is microvoid coalescence. In materials oflower ductility, it can result in cleavage fracture, especially at elevatedtemperature or in some corroding environments, can be intergranular.Examination of the numerical values of da/dN in the linear Paris regionfrom data plots shows that striation spacing is of the order of less than10�9 to 10�6 m/cycle. This suggests the required resolution and magnifi-cation to be able to see these features. Not only does the resolution of thehuman eye have to be considered to define a lower limit of magnification,but the striations have to be easily seen and, for any quantitative work, itmust be easy to count the striations. Assuming the human eye to have aresolution of about 0.03 mm at a working distance of 250 mm, therequired magnification to resolve a striation spacing of 5 � 10�5 mm is600 diameters. In practice, the actual magnification must be larger than

54 � Fatigue Failures
this for comfortable counting, and a practical magnification is in the rangeof 1000 to 3000 diameters. Any fractographic feature similar in appear-ance to striations that is visible at lower magnifications may well be some-thing else, and, the lower the magnification, the more difficult it is to iden-tify the appearance as that due to striations.
Many of the macroscale and microscale fractographic features associatedwith fatigue failure are either absent or less well defined in cast materials.Consider the case of the gray cast iron as shown in Figure 49. The materi-al was notched with a saw cut to provide a stress concentrator and crack-initiation site (Figure 49b). The unnotched specimen (Figure 49a) pro-vides no indication of initiation site or crack-growth direction. Loadingwas at an R value of �0.2. Because the specimen was tested continuouslyin the laboratory, beach marks are not expected. However, there is very lit-tle information visible on the fracture surface to indicate the location ofcrack initiation and direction of crack growth. Neither is there a clear dis-tinction between the fatigue region and the overload region. In contrast togray iron, pearlitic and ferritic ductile iron can show a ridge pattern point-ing back to the crack-initiation site. Microscopically, cast irons containinglarge amounts of pearlite may show a “striated” structure at high magnifi-cation, but the “striations” lie parallel to the cementite plates and are clear-ly controlled by the pearlite morphology. The most common imperfectionin cast microstructures is shrinkage porosity, and crack initiation at thesesites is common. One common type of casting alloy is based on thealuminum-silicon alloy system. Powell et al. (Reference 26) in a study ofseveral of these alloys (A380, A356, A319) have shown that crack initia-tion is often at shrinkage porosity and that fatigue crack propagation occursprimarily within the aluminum dendrites, producing a striated structurevisible at high magnification (Figure 50). Crack propagation is primarily
Macroscale and Microscale
Fractography of Cast
MicrostructuresCrack Initiation
and Propagation in Cast Alloys
Figure 49. Fatigue failure in gray cast iron. No thumbnail is visible to indicate fracture ori-gin, nor are any other markings visible on the fracture surface to indicate the initiation site.Beach marks are not expected since the specimen was continuously loaded to failure. (a) Rotating-beam sample. R � �1. Magnification: 73�. (b) Notched uniaxial load sample. R � 0.1. Magnification: 6.4�. Source: Reference 26, p II-11.

Macroscale and Microscale Fractography of Cast Microstructures � 55
Figure 50. Fatigue striations in aluminum alloy A360. Magnification:5000�. Source: Reference 26, p II-14.
through the matrix dendrites. This behavior is in contrast to crack propa-gation in monotonic overload in which case crack propagation is primari-ly within the interdendritic regions that contain a large fraction of brittleparticles that fail by cleavage. Shrinkage porosity is a common castingdefect, and the volume change in aluminum alloys is large so that shrink-age porosity is likely common. Shrinkage porosity is easy to recognize inthe SEM because of the characteristic appearance of dendrites visible inthe cavities.
When materials are repetitively loaded at elevated temperature, both creepand fatigue must be considered as damage mechanisms. Additionally, thecorrosion and oxidation resistance of the material at elevated temperaturemust be considered, as well as microstructural stability.
Loading frequency was mentioned as a potential variable in fatiguebehavior. At low fractions of the melting point (i.e., room-temperaturebehavior), the loading frequency is not considered to be a significant vari-able-controlling behavior. An increase in frequency over a few orders ofmagnitude is necessary to cause very much degradation. However, as tem-perature increases, loading frequency becomes more important.
The actual shape of the load/time curve also becomes more importantat elevated temperature because materials will strain at constant loadunder creep conditions. If the loading history involves holding at maxi-mum stress (Figure 1b), there is more creep damage than for triangularwave or sinusoidal-wave-form loading. At low temperatures, the fatiguestrength is less than the creep strength, but at elevated temperatures thecreep strength is less than the fatigue strength. Creep deformation must beconsidered at temperatures starting at about 40% of the melting point(degrees K). Figure 51 shows the effect of both tensile and compressivestress for various hold times on fatigue life. There is apparently no effect
Elevated-TemperatureFailure: Creep-FatigueInteraction

56 � Fatigue Failures
Figure 51. Creep-fatigue interaction effects on isothermal cyclic life of AISItype 304 stainless steel tested in air at 650 °C (1200 °F), normal strainingrate of 4 � 10�3 s�1. After Reference 35.
produced by compressive stresses, but tensile stresses degrade the allow-able creep strain and the degradation increases as the hold time increases.
Fatigue strength at elevated temperature can be seriously degraded dueto interaction of the metal with the environment. Situations that can causeproblems include carburization, decarburization, oxidation and scale for-mation, reaction of sulfur-containing compounds such as Captan used forsafety reasons in natural gas, and fuel ash containing vanadium pentoxidefrom leaded gasoline.
General microstructural degradation can occur due to incipient melting,recrystallization in cold worked material, overaging, grain-boundary pre-cipitate agglomeration, and other metallurgical changes. One particularproblem is in situ graphitization of the carbide in pearlite. In a plain-carbon steel, this can start at about 400 °C (750 °F). Consequently, it iscommon practice to alloy the steel with chromium, which not only stabi-lizes the carbide but prevents scale formation.
When rolling and/or sliding elements contact each other along a smallarea, contact fatigue must be considered as a failure mechanism. Commonsituations where this occurs is in roller bearings and in gears. Contactfatigue failures initiate below the surface at the location of maximumshear stress. However, these same materials have high surface hardnessand may or may not be through hardened. Typical manufacturing process-es for gears include surface treating, producing a strength gradient acrossthe cross section. Bearings in some cases may be carburized. Therefore,crack initiation could occur at the case/core interface. Additionally, if thecase is thin, high loads can cause case crushing.
Gears and Bearings

Macroscale and Microscale Fractography of Cast Microstructures � 57
The sources of material imperfections in gears and bearings as well asthe effect of operating conditions and the service environment are coveredin Lessons 11 and 12. Note, however, that multiple failure mechanisms arepossible and that a proper failure analysis must identify the specific causefor failure. Some issues that are involved include:
� Inadequate lubrication (perhaps due to excessive loading), whichcan cause pitting/spalling of material from the surface so that stressconcentrators are created in brittle material.
� In some instances, the lubricant can be contaminated with water thatcan lead to corrosion pitting.
� Bearings are of high hardness and may not be through-hardened;the gear components are often surface treated so that there is astrength variation from surface to core, and again the surface hard-ness is quite high (greater than 55 HRC). The case in some instancesis quite thin; therefore, all of the considerations of applied stressversus distance from the surface discussed in Lesson 3 apply todetermine if subsurface material was loaded above its strength.
� Case crushing can occur in thin cases at high loads; if case crushingdoes occur, the spalled material is entrapped in the lubricant and canthen score the gear or bearing surface.
Failure can occur at three locations: (1) at the surface due to surfaceimperfections, (2) in the region of maximum shear stress created by thecontact stresses, and (3) at the case/core interface. Examination of the sur-face of the failed components provides part of the information required forthe failure analysis, and metallographic examination provides additionalinformation. Figure 52 shows one example of bearing failure due to highloads. Bearings are typically finished ground so that improper grindingcan lead to surface imperfections and a detrimental residual stress pattern.As for other cases of cyclic loading, the presence of residual stress is moreimportant for long-life design than short-life design.
Figure 52. Subsurface fatigue failure in a carburized roller bearing. Thesubsurface crack location is below the location of maximum shear stresscreated by contact stresses. This type of fracture is not common in rollerbearings. Source: Reference 36.

58 � Fatigue Failures
This section of the lesson is an introductory discussion of the use of frac-ture mechanics to analyze fatigue failures. Fracture mechanics is the toolthat permits a quantitative evaluation of fatigue (and monotonic) fracturesand is, therefore, an important analytical tool.
It must be remembered that just because a fracture initiated at a geo-metric stress concentrator, or at a microstructural imperfection, that doesnot imply that the design was improper or that the material was “defec-tive.” The presence of geometric stress concentrators is an acceptable andunavoidable part of engineering design. It may be that the stress concen-trator was more severe than intended (for example, a sharper fillet thanindicated on a drawing), but that does not in itself mean that the compo-nent is defective. It just says that failure initiated at a high(er) stress loca-tion. It must still be shown that the increased severity of the stress concen-tration caused the assumed loading conditions used in the design toexceed the strength of the material. It is possible that failure required abu-sive loading conditions even with the increased notch severity. In the sameway, inclusions are a normal constituent in the microstructure of commer-cial materials. It is true that there has been a trend to reduce the inclusioncontent of many commercial alloys in recent years, and it is also true thatductility, toughness, and fatigue strength are typically improved by areduction in inclusion content. It is possible for the volume fraction ofinclusions to be higher than normally expected. That still does not in itselfimply that the imperfection is a defect, especially in the absence of a gov-erning standard or a specification that describes the permissible inclusioncontent. The material will always fail at the weakest location.
Fracture mechanics can be used in multiple ways in the examination offatigue failures. Examples are given below to show the importance of theprocedure.
Example 1: Macroscale. Examination of the fracture on themacroscale provides a measurement of the crack length when overloadoccurs. If the fracture is essentially macroscale brittle, the component hasfailed under plane-strain conditions. If the plane-strain fracture tough-ness (KIc) is known and the geometric correction factor is known, thestress causing fracture is known according to:
acrit ���2
max�
K
�f(l2c
a/W)�2� (Equation 24)
obtained by rearranging Equation 10.
The crack length at failure is typically visible on the fracture surface.Therefore, there are two unknowns in the equation: �max and KIc. Equation24 can then be solved assuming that either the nominal stress in service isknown or that the fracture toughness is known. The calculated fracturetoughness at failure using the maximum stress can be compared to a liter-ature value. Any inconsistency then says either that the nominal servicestress was greater than that assumed, or else the material did not have theassumed fracture toughness.
Fatigue Striations andFracture Mechanics
Analysis
Appendix: Use ofFracture Mechanicsin Fatigue FailureAnalysis
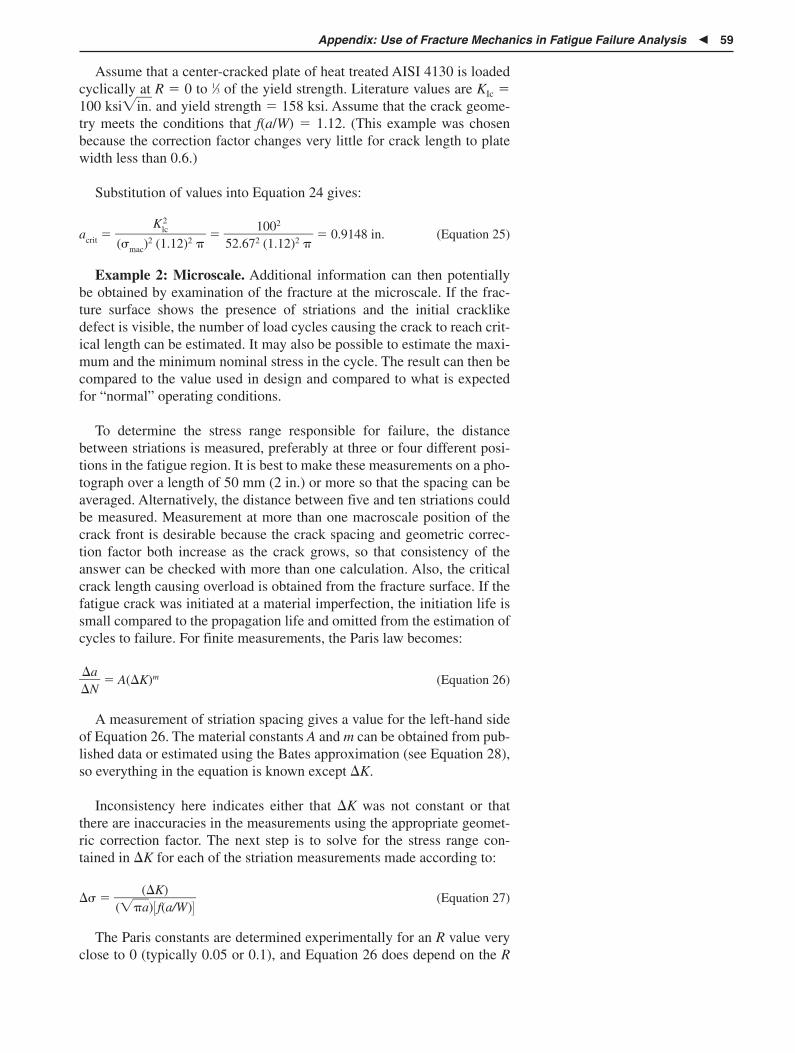
Appendix: Use of Fracture Mechanics in Fatigue Failure Analysis � 59
Assume that a center-cracked plate of heat treated AISI 4130 is loadedcyclically at R � 0 to 1⁄3 of the yield strength. Literature values are KIc �100 ksi�in.� and yield strength � 158 ksi. Assume that the crack geome-try meets the conditions that f(a/W) � 1.12. (This example was chosenbecause the correction factor changes very little for crack length to platewidth less than 0.6.)
Substitution of values into Equation 24 gives:
acrit ��(�mac)
2
K
(1l2c
.12)2 ����
52.672
1(010.
2
12)2 ��� 0.9148 in. (Equation 25)
Example 2: Microscale. Additional information can then potentiallybe obtained by examination of the fracture at the microscale. If the frac-ture surface shows the presence of striations and the initial cracklikedefect is visible, the number of load cycles causing the crack to reach crit-ical length can be estimated. It may also be possible to estimate the maxi-mum and the minimum nominal stress in the cycle. The result can then becompared to the value used in design and compared to what is expectedfor “normal” operating conditions.
To determine the stress range responsible for failure, the distancebetween striations is measured, preferably at three or four different posi-tions in the fatigue region. It is best to make these measurements on a pho-tograph over a length of 50 mm (2 in.) or more so that the spacing can beaveraged. Alternatively, the distance between five and ten striations couldbe measured. Measurement at more than one macroscale position of thecrack front is desirable because the crack spacing and geometric correc-tion factor both increase as the crack grows, so that consistency of theanswer can be checked with more than one calculation. Also, the criticalcrack length causing overload is obtained from the fracture surface. If thefatigue crack was initiated at a material imperfection, the initiation life issmall compared to the propagation life and omitted from the estimation ofcycles to failure. For finite measurements, the Paris law becomes:
��
�
Na� � A(�K)m (Equation 26)
A measurement of striation spacing gives a value for the left-hand sideof Equation 26. The material constants A and m can be obtained from pub-lished data or estimated using the Bates approximation (see Equation 28),so everything in the equation is known except �K.
Inconsistency here indicates either that �K was not constant or thatthere are inaccuracies in the measurements using the appropriate geomet-ric correction factor. The next step is to solve for the stress range con-tained in �K for each of the striation measurements made according to:
�� ��(��
(a��
)�Kf()a/W)�� (Equation 27)
The Paris constants are determined experimentally for an R value veryclose to 0 (typically 0.05 or 0.1), and Equation 26 does depend on the R

60 � Fatigue Failures
value. Therefore, it may be necessary, in back calculations, to calculate�� for two or three different R values because the R value for the failedcomponent would typically not be known (but is known to be R � �1 forrotating bending).
Note: It may not be possible to find values of A and m for the specific aspecific alloy. However, since Paris Law behavior is essentially insensitiveto microstructural variables, constants for a similar alloy can be used—forexample, constants for 316 stainless when the material in question is 304stainless. Generic constants are given by Clark (Reference 37). Alterna-tively, an approximation credited to Bates (Reference 38) requiring onlythat the elastic modulus is known may be used:
�ddNa� � 6��
�
EK��
2(Equation 28)
See Hertzberg (Reference 34) for a discussion.
A sample problem follows, using the results from example 1. The mate-rial is still heat treated AISI 4130 having fracture toughness and yieldstrength as given previously. Assume that the plate is loaded from 0 to ten-sion (R � 0). Assume that macroscale fractographic examination showsthat the starter imperfection was through thickness and 0.5 in. long. Alsoassume that the crack length at overload has been measured as in example1 and is 0.91 in. long. Generic constants for the coefficient and exponentare 6.6 � 10�9 and 2.25 using inches and ksi�in.� Because the geometriccorrection factor can be assumed to be constant for 10% accuracy so longas the crack length to plate width is less than 0.6, assume that it is con-stant. The integrated form of the Paris Law then gives:
Nf � af
ai
�A(�
daK)m� � af
ai
�A[1.12m (
1�)m �m/2]��
adm
a/2
� (Equation 29)
Performing the integration gives:
Nf – (Equation 30)
Substituting:
Nf � � 2750 cycles (Equation 31)
Alternatively, the problem could have been solved using the genericBates approximation given by Equation 26. Assume that the modulus is 30 � 103 ksi; performing the necessary integration gives:
Nf � (ln af � ln ai) �(1.12)2
E(
2
��)2 ��
� � 8290 cycles (Equation 32)
The two answers are obviously different, but reasonable based on theassumptions made in the calculation and the use of two different models.
(ln 0.9148 � ln 0.5)(30 � 103)2
����(1.12)2(52.67)2�
0.91481�2.25/2 � 0.51�2.25/2
����(1 � 2.25/2)(1.122.25)(52.67)2.25�2.25/2
a1f�m/2 � a1
i�m/2
���(1 � m/2)A(1.12��)m�m/2

References � 61
Example 3: Spreadsheet Computation of Crack Length to Obtainthe Number of Load Cycles to Cause Failure. The procedure involvesfirst determining the critical crack length as described above in example 1.The length of the imperfection causing crack initiation is also measured.Starting with the initial imperfection length, the increase in crack length(�a) is calculated for a small number of load cycles (e.g., �N � 200 forlong life, something less for finite life). The new crack length is then theprevious crack length plus the increment �a. A new value of �K is calcu-lated for the new crack length, and a new correction factor is obtained. Theprocess is repeated, each time recalculating the crack length, the new cor-rection factor and the new �K. A running total is maintained of the totalnumber of cycles. The process is repeated until the crack length reachesacrit. The total number of cycles is then obtained. Because of the tediousnature of the calculations, they are best performed using a spreadsheet pro-gram on a computer. For mathematical reasons, the actual crack lengthused in the iteration at each step is the average of the old and new cracklengths and not the sum of the old crack length plus the increment. Becauseof variations in the actual numerical iteration procedure such as the �Nchosen, some variation in the final answer is possible and the calculationshould not be considered to be more accurate than about 1 decade of life.
1. C. Brooks and A. Choudhury, Metallurgical Failure Analysis,McGraw-Hill, 1993, p 6
2. D. Wulpi, Understanding How Components Fail, ASM Interna-tional, 1999
3. G. Sines and J.L. Waisman, Metal Fatigue, McGraw-Hill, 1959
4. M.R. Mitchell, Fundamentals of Modern Fatigue Analysis andDesign, Fatigue and Microstructure, American Society for Metals,1979
5. W.G. Barrois, Manual on Fatigue of Structures, AGARD-MAN-8-70, NATO, Brussels, 1970, p 227
6. J. Morrow, G. Halford, and J.F. Millan, Optimum Hardness forMaximum Fatigue Strength of Steels, Proc. First Int. Conf. Frac-ture (Sendai, Japan), Vol 3, 1965, p 1611–1635
7. J.A. Bannantine, J.J. Comer, and J.L. Handrock, Fundamentals ofMetal Fatigue Analysis, Prentice-Hall, 1990
8. M. Kesten and K.-F. Windgassen, Design of Equipment to ResistHydrogen Fatigue Service, Current Solutions to Hydrogen Prob-lems in Steels, C.G. Interrante and G.M. Pressouyre, Ed., AmericanSociety for Metals, 1982, p 390
9. M.E. Fine and Y. Chung, Fatigue Failure in Metals, Fatigue andFracture, Vol 19, ASM Handbook, 1996, p 67
10. P.C. Paris et al., Stress Analysis and Growth of Cracks, STP 513,ASTM, 1972, p 141–176
11. D. Bales, “Effect of Decarburization on the Fatigue Behavior ofSteels,” M.S. thesis, University of Tennessee, Knoxville, TN, 1975
12. Alcoa Aluminum Handbook, Aluminum Company of America,1967
References

62 � Fatigue Failures
13. W. Murray, Ed., Fatigue and Fracture of Metals, John Wiley, 1952,p 283
14. C. Lipson and R.C. Juvinall, Handbook of Stress and Strength,Macmillan Co., 1963, p 107
15. D.E. Gucer and M. Capa, “Effect of Loading Frequency on theStrain Behavior and Damage Accumulation in Low Cycle Fatigue,”AGARD Report No. 572, NATO, 1970
16. A.J. Kennedy, Processes of Creep and Fatigue in Metals, Oliverand Boyd, London, 1962, p 313
17. M.J. Miner, Estimation of Fatigue Life with Particular Emphasison Cumulative Damage, Metal Fatigue, G. Sines and J.L. Wais-man, Ed., McGraw-Hill, 1959, p 278
18. N.E. Dowling, Mechanical Behavior of Materials, 2nd ed., Prentice-Hall, 1999, Chapters 9–11, 14
19. S.-B. Lee, A Criterion for Fully Reversed Out-of-Phase Torsionand Bending, Multi-Axial Fatigue, STP 853, ASTM, 1985, p 553
20. R.E. Peterson, Notch Sensitivity, Metal Fatigue, G. Sines and J.L.Waisman, Ed., McGraw-Hill, 1959, p 293
21. Fatigue Design Handbook, AE-10, Society of Automotive Engi-neers, 1988
22. D.H. Breen and E.M. Wene, Fatigue in Machines and Structures—Ground Vehicles, Fatigue and Microstructure, American Societyfor Metals, 1979, p 57
23. R.O. Ritchie and J.F. Knott, Micro Cleavage Cracking DuringFatigue Crack Propagation in Low Strength Steel, Mater. Sci. Eng.,Vol 14, 1974, p 7
24. A.D. Wilson, Comparing the Effect of Inclusions on Ductility,Toughness and Fatigue Properties, Through Thickness TensionTesting of Steel, R.J. Glodowski, Ed., STP 794, ASTM, 1983
25. P.F. Weiser, Ed., Steel Castings Handbook, Steel Founders’ Societyof America, 1980, p 15–10
26. G.W. Powell, S.-H. Cheng, and C.E. Mobley, A Fractography Atlasof Casting Alloys, Battelle Press, 1992
27. A.D. Deutschman, W.J. Michels, and C.E. Wilson, MachineDesign—Theory and Practice, MacMillan, 1975, p 211
28. G. Fluck, Proc. ASTM, Vol 51, 1951, p 584; as quoted in A. Han-son, The Engineer’s Guide to Steel, Addison-Wesley, 1965 p 133
29. B. Boardman, Fatigue Resistance of Steels, Properties and Selec-tion: Irons, Steels, and High-Performance Alloys, Vol 1, ASMHandbook, 1990, p 673–688
30. J.F. Chittum, Corrosion Fatigue Cracking of Oil Well Sucker Rods,Corrosion Source Book, S.K. Coburn, Ed., American Society forMetals, 1984, p 380
31. R.H. Jones and R.E. Picker, Stress-Corrosion Cracking, in Envi-ronmentally Induced Cracking, Corrosion, Vol 13, Metals Hand-book, 1987, p 158

References � 63
32. A. Hunsche and P. Neumann, Crack Nucleation in Persistent SlipBands, Basic Questions in Fatigue, Vol 1, STP 924, ASTM, 1988,p 2
33. D.A. Ryder, The Elements of Fractography, AD-734–619, Distrib-uted by NTIS, U.S. Dept. of Commerce, p 127
34. R.W. Hertzberg and Robert Goodenow, Fracture Toughness andFatigue Crack Propagation in Hot-Rolled Microalloyed Steel,Proc. Microalloying—75, Union Carbide Corp., 1975, p 503
35. V.M. Radhakrishnan, Life Prediction in Time Dependent Fatigue,Advances in Life Prediction Methods, American Society ofMechanical Engineers, 1983, p 143–150
36. R.L. Widner and J.O. Wolfe, Valuable Results from Bearing Dam-age Analysis, Source Book in Failure Analysis, American Societyfor Metals, 1974, p 52
37. W.G. Clark, Met. Eng. Quart., Vol 14 (No. 3), 1974, p 16
38. R.C. Bates and W.G. Clark, Trans. ASM, Vol 62, 1969, p 380
39. J.A. Collins, Failure of Materials in Mechanical Design, JohnWiley, 1981
40. Fractography, Vol 12, ASM Handbook, ASM International, 1987
41. V. Kerlins and A. Phillips, Modes of Fracture, Fractography, Vol12, ASM Handbook, ASM International, 1987, p 12–71
Fatigue Behavior
� N.E. Dowling, Mechanical Behavior of Materials, 2nd ed.,Prentice-Hall, 1999
� Fatigue Design Handbook, AE-10, Society of Automotive Engi-neers, 1988
� S. Suresh, Fatigue of Materials, Cambridge University Press, 1991
Fracture Mechanics Analysis
� N.E. Dowling, Mechanical Behavior of Materials, 2nd ed.,Prentice-Hall, 1999, Chapters 9–11, 14
Environmental Effects
� E.E. Stansbury and R.A. Buchanan, Fundamentals of Electrochemi-cal Corrosion, ASM International, 2000, p 368
Data Compilations
� H. Boyer, Ed., Atlas of Fatigue Curves, American Society for Met-als, 1986
� W.D. Pilkey, Peterson’s Stress Concentration Factors, 2nd ed., JohnWiley, 1997
Additional Reading

64 � Fatigue Failures
General
� J.M. Barsom, Fatigue Crack Propagation in Steels of Various YieldStrengths, Trans. ASME, J. Eng. Ind., Ser. B, Vol 93 (No. 4), Nov 1971
� J. Barsom and S.T. Rolfe, Fracture and Fatigue Control in Struc-tures, 2nd ed., Prentice-Hall, 1987
� J. Cooke and C.J. Beevers, Slow Fatigue Crack Growth in PearliticSteels, Mater. Sci. Eng., Vol 13, 1974, p 201
� Failure Analysis and Prevention, Vol 11, Metals Handbook, Ameri-can Society for Metals, 1986; revised in 2002
� Fatigue and Fracture, Vol 19, ASM Handbook, ASM International,1996
� Fractography, Vol 12, 9th ed., Metals Handbook, ASM Internation-al, 1987
� G.R. Halford, B.A. Lerch, and M.A. McGaw, Fatigue, CreepFatigue, and Thermomechanical Fatigue Life Testing, MechanicalTesting and Evaluation, Vol 8, ASM Handbook, ASM International,2000, p 686–716
� D. Wulpi, Understanding How Components Fail, ASM Internation-al, 1999


Metric Conversion Factors
To convert from To Multiply by
in. mm 25.4in. m 25.4 � 10�3
mil �m 25.4�in. �m 25.4in.2 m2 6.45 � 10�4
in.3 m3 1.64 � 10�5
ft m 3.048 � 10�1
ft2 m2 9.29 � 10�2
ft3 m3 2.831 � 10�2
oz g 2.834 � 10lb kg 4.536 � 10�1
Btu J 1.054 � 103
Btu/lb � °F J/kg � K 4.18 � 103
Btu/ft � h � °F W/m � K 1.730in./in. � °F m/m � K 1.8
psi Pa 6.895 � 103
psi kPa 6.895ksi kPa 6.895 � 103
ksi MPa 6.895ksi � in.1/2 MPa � m1/2 1.099
ksi MPa 1.099ozf gf 28.4lbf kgf 4.536 � 10�1
lbf N 4.448ft � lbf N � m (or J) 1.356lbf/in.2 kgf/cm2 14.223lbf/in.3 kgf/m3 2.768 � 104
lb/ft3 kg/m3 16.019lb/in.3 g/cm3 2.768 � 10lb/in.3 kg/m3 2.768 � 104
gal (U.S. liquid) L 3.785gal (U.S. liquid) m3 3.785 � 10�3
lb/gal g/L 119.826ft/gal ml/L 748
°F °C (°F � 32)/1.8°F K (°F � 459.67)/1.8°C °F (°C � 1.8) � 32°C K °C � 273.15K °C K � 273.15
Multiple and submultiple units
1012 tera 10�1 deci109 giga 10�2 centi106 mega 10�3 milli103 kilo 10�6 micro102 hecto 10�9 nano10 deka 10�12 pico
Abbreviations
J joule m meter Pa pascalkgf kilogram force mm millimeter K kelvinL liter N Newton W watt
√m√in.
ASM International®
Materials Park, OH 44073-0002www.asminternational.org

ASM International®
Materials Park, OH 44073-0002www.asminternational.org