Principles of Exploratory Data Analysis in Problem … · Principles of Exploratory Data Analysis...
18
Principles of Exploratory Data Analysis in Problem Solving: What Can We Learn from a Well-Known Case? Jeroen de Mast, Benjamin P. H. Kemper Institute for Business and Industrial Statistics (IBIS UvA), University of Amsterdam, Amsterdam, The Netherlands ABSTRACT Exploratory data analysis (EDA) is sometimes suggested as a hypothesis identification approach. It is often used as such in problem sol- ving and consists of the analysis of observational data, often collected with- out well-defined hypotheses, with the purpose of finding clues that could inspire ideas and hypotheses. This article seeks to uncover some of the main principles of EDA in problem solving. The article discusses and explains EDA’s main steps: (1) Display the data; (2) identify salient features; (3) inter- pret salient features. The empiricist notion of EDA, which pervades many textbook accounts of EDA, is criticized and contrasted to an account that emphasizes the role of mental models in hypothesis generation. The frame- work has some implications for the limitations of EDA. It also sheds light on the role of the statistician compared to the role of the context expert. The article argues that in teaching EDA the emphasis for statistical data analysis should be balanced with teaching students to theorize and be inquisitive. Throughout the article, ideas are illustrated by the well-known case of John Snow’s studies of the transmission mechanism of cholera. KEYWORDS discovery, graphical data analysis, hypothesis generation, mental models, salient features INTRODUCTION In 1854 there was a major outbreak of cholera in London. Many then-prevailing theories failed to associate the transmission of cholera to hygiene, assuming that cholera was noncontagious or that the disease agent was airborne (Vinten-Johansen et al., 2003). Some popular accounts of the story narrate how a doctor named John Snow discovered the cause of the outbreak by making a map indicating where the victims lived (see Figure 1, which was taken from Snow 1855). The map showed a cluster in Soho, and Snow identified a water pump in Broad Street as the epicenter of the outbreak. Excavations showed that a nearby cesspit leaked fecal bac- teria into the pump-well. Allegedly, Snow convinced officials to remove the handle from the pump, thus ending the outbreak (some accounts even claim that Snow removed the handle himself). Address correspondence to Jeroen de Mast, Institute for Business and Industrial Statistics (IBIS UvA), University of Amsterdam, Plantage Muidergracht 12, Amsterdam, 1018 TV, The Netherlands. E-mail: [email protected] Quality Engineering, 21:366–375, 2009 Copyright # Taylor & Francis Group, LLC ISSN: 0898-2112 print=1532-4222 online DOI: 10.1080/08982110903188276 366 Downloaded By: [Universiteit van Amsterdam] At: 09:06 16 September 2009
Transcript of Principles of Exploratory Data Analysis in Problem … · Principles of Exploratory Data Analysis...

Principles of Exploratory Data Analysis inProblem Solving: What Can We Learn
from a Well-Known Case?Jeroen de Mast,
Benjamin P. H. Kemper
Institute for Business and
Industrial Statistics (IBIS UvA),
University of Amsterdam,
Amsterdam, The Netherlands
ABSTRACT Exploratory data analysis (EDA) is sometimes suggested as a
hypothesis identification approach. It is often used as such in problem sol-
ving and consists of the analysis of observational data, often collected with-
out well-defined hypotheses, with the purpose of finding clues that could
inspire ideas and hypotheses. This article seeks to uncover some of the main
principles of EDA in problem solving. The article discusses and explains
EDA’s main steps: (1) Display the data; (2) identify salient features; (3) inter-
pret salient features. The empiricist notion of EDA, which pervades many
textbook accounts of EDA, is criticized and contrasted to an account that
emphasizes the role of mental models in hypothesis generation. The frame-
work has some implications for the limitations of EDA. It also sheds light on
the role of the statistician compared to the role of the context expert. The
article argues that in teaching EDA the emphasis for statistical data analysis
should be balanced with teaching students to theorize and be inquisitive.
Throughout the article, ideas are illustrated by the well-known case of John
Snow’s studies of the transmission mechanism of cholera.
KEYWORDS discovery, graphical data analysis, hypothesis generation, mental
models, salient features
INTRODUCTION
In 1854 there was a major outbreak of cholera in London. Many
then-prevailing theories failed to associate the transmission of cholera to
hygiene, assuming that cholera was noncontagious or that the disease agent
was airborne (Vinten-Johansen et al., 2003). Some popular accounts of the
story narrate how a doctor named John Snow discovered the cause of the
outbreak by making a map indicating where the victims lived (see
Figure 1, which was taken from Snow 1855). The map showed a cluster
in Soho, and Snow identified a water pump in Broad Street as the epicenter
of the outbreak. Excavations showed that a nearby cesspit leaked fecal bac-
teria into the pump-well. Allegedly, Snow convinced officials to remove the
handle from the pump, thus ending the outbreak (some accounts even claim
that Snow removed the handle himself).
Address correspondence to Jeroen deMast, Institute for Business andIndustrial Statistics (IBIS UvA),University of Amsterdam, PlantageMuidergracht 12, Amsterdam, 1018TV, The Netherlands. E-mail:[email protected]
Quality Engineering, 21:366–375, 2009Copyright # Taylor & Francis Group, LLCISSN: 0898-2112 print=1532-4222 onlineDOI: 10.1080/08982110903188276
366
Downloaded By: [Universiteit van Amsterdam] At: 09:06 16 September 2009

This article is about exploratory data analysis
(EDA), the study of empirical data to generate ideas
and hypotheses. Compared to confirmatory data ana-
lysis, the literature on EDA is meager, both in pure
volume of texts devoted to the subject and in the pre-
cision and depth of its theoretical development.
Some concede that perhaps EDA is more of an art,
or even a bag of tricks, than a science (Good,
1983). This poor development of theory on EDA in
the academic literature does not do justice to the
importance of EDA in practice, as an often used
approach in discovery and problem solving. It is
the purpose of this article to develop a theoretical
model for EDA that can serve as the backbone for
developing teaching programs for practitioners and
can serve as a paradigm for the scientific study of
EDA techniques in problem solving. The model is
presented and elaborated in later sections of this
article.
EDA cannot meaningfully be studied in isolation
of its contexts, namely, its role in empirical inquiry
and the fact that it proceeds through human cogni-
tive processes. Our model, consequently, is based
on scientific insights not only from the statistical
sciences but from philosophy of science and the cog-
nitive sciences as well. A subsidiary objective of the
article is to provide references to the relevant litera-
ture in all three of these disciplines, thus facilitating
that researchers from one discipline can explore
the work in complementary fields.
Throughout the article, the John Snow story serves
to illustrate our ideas. We think it is an example that
most readers can relate to, and there are not that
many applications of EDA that are so well documen-
ted (both by biographers and historians, but also
Snow’s own account of the events, published in
1855, is very insightful for understanding EDA in
action). Historical research shows that the authenti-
city of some of the details in the story can be ques-
tioned (Brody et al., 2000), and especially the
episode of the map and the Broad Street pump has
taken the forms of a myth (Koch, 2004). For exam-
ple, it is true that Snow became aware of the Broad
Street pump because of the clustered pattern of
casualties, but he did not make a map on paper until
months after the events. Some of the popular
accounts of the story illustrate well what we will call
an empiricist account of EDA, which, as we claim in
the section so titled, seems misguided. The historical
facts and John Snow’s own account, far less smooth
and stylized as they are, serve to illustrate what we
propose as a more realistic notion of EDA.
The reader looking for more examples of EDA is
referred to De Mast and Trip (2007), who describe
EDA examples from problem solving in business
and industry. This earlier paper also represents the
empirical basis on which we developed and tested
our theory.
EXPLORATORY DATA ANALYSIS ASAN APPROACH TO HYPOTHESIS
GENERATION
The Purpose of EDA
Snow encountered disbelief about his theory that
cholera was water-borne. To prove his theory, he
made a study in 1853–1854 that he called The Grand
Experiment. Two companies supplied South London
with drinking water. The Southwark & Vauxhall
company had its water intake downstream on the
river Thames and, consequently, the water it sup-
plied was contaminated with sewage. The Lambeth
Company had moved its water intake upstream in
1852 and had provided cleaner water since. Snow
focused his study on a number of districts in South
London where both companies delivered water.
FIGURE 1 Part of Snow’s map showing the distribution of
cholera casualties in Soho (from Snow 1855).
367 Principles of Exploratory Data Analysis
Downloaded By: [Universiteit van Amsterdam] At: 09:06 16 September 2009

In these districts, a total of 300,000 people lived, of
all classes and occupations, and the clients of both
companies were almost completely mixed: one
house could take its water from Lambeth, and its
neighbors from Southwark & Vauxhall. The situa-
tion approached the conditions of a randomized
experiment—a ‘‘natural experiment’’. Snow pains-
takingly determined from which company house-
holds in the districts under study got their water
and found the mortality rate in the houses supplied
by the Southwark & Vauxhall company more than
eight times as great as in the houses supplied by
Lambeth (Snow, 1855, p. 86).
Snow’s Grand Experiment is a skillful demon-
stration of a confirmatory study. The theories of
experimental design, hypothesis testing, and model
building are some of the greatest contributions of sta-
tistics. But to get a confirmatory study off the ground,
one needs to have identified the hypothesis that is to
be confirmed or refuted in the first place. Before
Snow could collect data about the origin of the water
of cholera victims, he must have identified the water
supply as interesting in the first place.
The term EDA is mostly attributed to Tukey (1977).
In EDA, one’s aim is not to draw conclusions on
predefined research questions (be it the construction
of amodel, the estimation of parameters, or the confir-
mation or rejection of a hypothesis); in fact, EDA in
problem solving is often applied to data collected
withoutwell-definedhypotheses. In EDA, one screens
the data for clues that could inspire ideas and hypoth-
eses. The manner in which discovery through EDA
proceeds is illustrated by Snow, who collected data
(the addresses of cholera casualties), noted the clus-
tered pattern, and identified a particular water pump
as potentially instrumental in the 1854 outbreak.
In empirical inquiry (in its scientific and applied
manifestations) one often pursues the development
of causal explanations. To this end, the phenomena
under study are parameterized; that is, made opera-
tional in the form of dependent (Y) and independent
(X) variables. Confirmatory data analysis is aimed at
testing and modeling conjectured relationships
between dependent and independent variables.
Confirmatory data analysis is aimed at objectivity
and conclusion and therefore its way of working is
methodical and rigorous in nature.
EDA, on the other hand, has as its purpose the
identification of Y- and X-variables that may prove
to be of interest in understanding or solving the
problem under study. It requires an altogether differ-
ent mindset; EDA is speculative (pursuing hypotheses
that have potential, rather than hypotheses that are
true) and open-ended (leaving the conclusion to con-
firmatory data analysis). The way of working is neces-
sarily flexible and adaptive, because the inquirer is
looking for features that he did not expect to find
beforehand. In Snow’s Broad Street study, the depen-
dent variable was whether persons are infected by
cholera. The study resulted in the explanatory
variable whether a person did or did not drink the
contaminated water from the Broad Street pump-well.
An Empiricist Account of EDA
Many statisticians know Snow’s story in the ver-
sion by Tufte (1983) or Gilbert (1958). Both present
a map that they claim is Snow’s but that in fact is a
far less detailed map, indicating victims by dots
rather than bars per household (note that Tufte’s
1997 book has a more authentic map, as well as a
historically more accurate description of the events
in 1854). Tufte’s (1983, p. 24) account of the story
is ‘‘Examining the scatter over the surface of the
map, Snow observed that cholera occurred almost
entirely among those who lived near (and drank
from) the Broad Street water pump.’’
Some historical inaccuracies aside, we find this
account misguided on a more profound level. The
account suggests that, if you look at the map, it is
obvious to identify the water pump as the epicenter
(that is, hypotheses are self-evident inferences from
observations). The fact that city officials, who made
a similar map in the same time, did not identify the
pump as the epicenter illustrates that discovery is
not that straightforward (officials of the General
Board of Health inferred from their own map, as well
as from Snow’s, that the Soho outbreak had an
‘‘atmospheric cause’’; see Brody et al., 2000).
Tufte’s (1983) description is reminiscent of empiri-
cism in the styles attributed to Francis Bacon and
John Stuart Mill (Mulaik, 1985), where discoveries
come ‘‘automatically’’ from looking at data (see
Figure 2). Empiricist ideas pervade many descrip-
tions of EDA found in statistical textbooks. They
give, we claim, a profoundly misguided depiction
of EDA, ignoring the role played in discovery by
mental models. Mental models are the way humans
J. de Mast and B. P. H. Kemper 368
Downloaded By: [Universiteit van Amsterdam] At: 09:06 16 September 2009

store knowledge in their long-term memory
(Johnson-Laird, 2006); mental models and their struc-
ture play a prominent part in modern philosophies of
discovery (for example, Thagard, 1992).
A layman and an expert studying an X-ray will
note different features as salient and will interpret
them differently; the cause is the much more refined
mental models related to anatomy that the expert
has. Mental models guide what the inquirer identifies
as salient, and they provide a vocabulary for specu-
lating about how to interpret the data. A model of
EDA should take the role of mental models into
account; in the next section, we present our model.
A MODEL OF EDA INCORPORATINGTHE ROLE OF MENTAL MODELS
Figure 3 displays our model of EDA. It discerns
three steps in the process of EDA (which have been
proposed earlier in De Mast and Trip, 2007).
1. Display the data (for example, Snow’s map of the
distribution of cholera victims).
2. Identify salient features (the cluster around Broad
Street).
3. Interpret salient features (identification of the
water pump as the cluster’s epicenter).
In our model, hypotheses do not originate in data,
they originate in the confrontation between data and
the mental models that the inquirer entertains. As
Figure 3 illustrates, none of the three steps is an
objective derivation from the data; each one of them
is strongly influenced by the inquirer’s mental
models. We discuss each of the three steps in detail.
Display the Data
Snow’s Soho map shows the distribution of victims
over London. For EDA, the relevant information in
data is their distribution, and the data presentation
should be aimed at displaying the data’s distribution
such that the pattern recognition capabilities of our
brains can be used optimally. Given the limited capa-
city of our working memory (typically, about seven
slots), the raw data are too complex for human
brains. Tables of aggregate statistics, on the other
hand, eliminate components of the data’s distribu-
tion, thereby losing information that is potentially
crucial for EDA. Graphical display is ideal for EDA.
Inquirers well trained in statistical techniques have
a refined repository of graphical techniques, as well
as mental models about when and in which combi-
nation to use them.
Techniques useful for EDA reveal the data distri-
bution. Examples include:
. Histograms and ogives (presenting the distribution
of one-dimensional data);
. Time series plots and boxplots per time unit
(showing the data’s distribution over time);
. Boxplots or dotplots per stratum (showing the dis-
tribution within and across strata in the dataset);
. Principal components analysis and projection pur-
suit to project high-dimensional data onto a plane,
and scatter plots showing the data distribution on
this plane.
Identify Salient Features
Once the distribution of the data is displayed, the
inquirer looks for salient features. Salient means
standing out from what was expected a priori. The
inquirer has in mind a reference distribution that
reflects the knowledge he already has about the phe-
nomenon but that is neutral with respect to other fea-
tures. A natural reference distribution for the Soho
FIGURE 3 Discovery, following the three steps of EDA, as an
interaction between the mental models that the inquirer enter-
tains, and the observations that he makes.
FIGURE 2 Model of the empiricist notion of discovery, where
ideas follow from or are derived from data.
369 Principles of Exploratory Data Analysis
Downloaded By: [Universiteit van Amsterdam] At: 09:06 16 September 2009
map would be that the distribution of cholera victims
mirrors the population density. The cluster of victims
on Snow’s map is a deviation from this neutral refer-
ence distribution and therefore is a salient feature.
Taking, in a second stage, this cluster as the neutral
reference distribution, Snow observed some further
salient features:
. At a short distance to the epicenter of the cluster
were a factory and a brewery that had surprisingly
low numbers of casualties (mortality rates of 5 per
500 and zero, respectively).
. Some ten victims lived decidedly beyond the outer
bounds of the cluster.
Typical neutral reference distributions are the uni-
form and the normal, the latter, for example, being
the standard reference model in statistical process
control. Deviations from the uniform or normal, such
as bimodality or outliers, are salient. For stratified or
time series data, the neutral reference distribution
typically also assumes the data to be i.i.d. (indepen-
dent and identically distributed), and autocorrelation
or differences between strata (in mean or spread) are
salient. De Mast and Trip (2007) propose Jaynes’s
(1957) maximum entropy principle as the theoretical
model for the identification of salient features. It
suggests to select as neutral reference distribution
the one that has the largest entropy in the class of
distributions that is consistent with prior knowledge.
The maximum entropy principle results in a neutral
reference distribution that is consistent with prior
knowledge but is maximally noninformative (and
therefore neutral) with respect to other features.
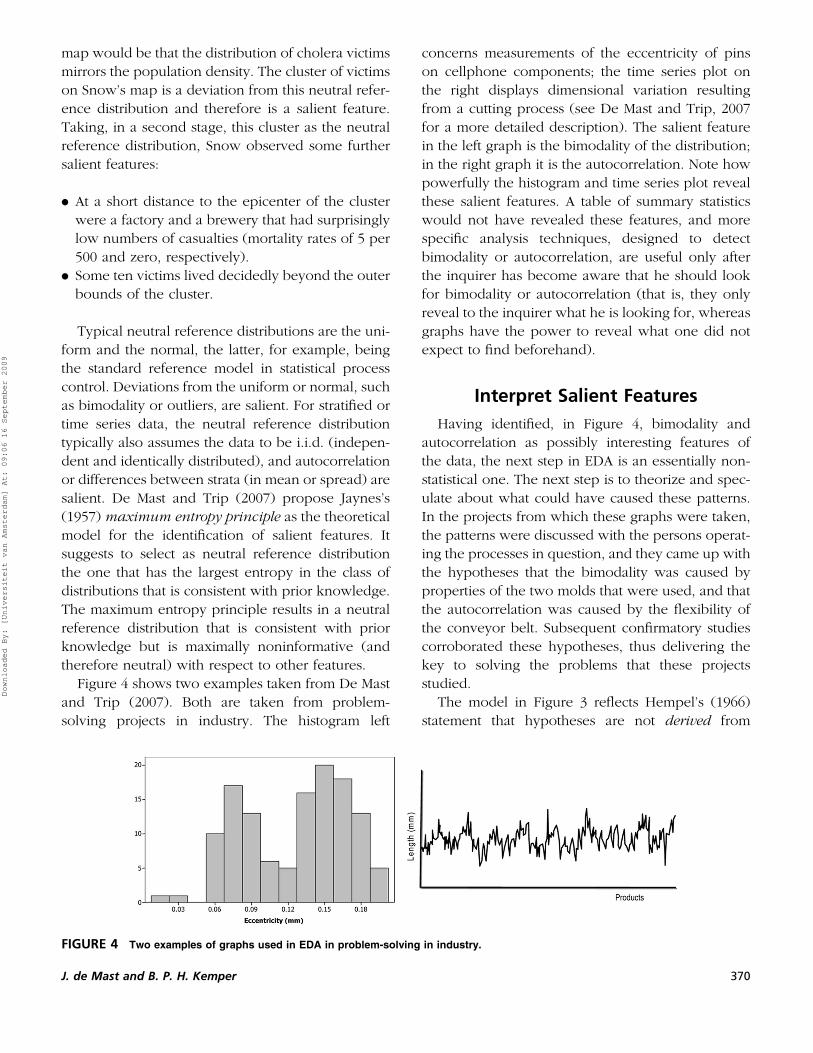
Figure 4 shows two examples taken from De Mast
and Trip (2007). Both are taken from problem-
solving projects in industry. The histogram left
concerns measurements of the eccentricity of pins
on cellphone components; the time series plot on
the right displays dimensional variation resulting
from a cutting process (see De Mast and Trip, 2007
for a more detailed description). The salient feature
in the left graph is the bimodality of the distribution;
in the right graph it is the autocorrelation. Note how
powerfully the histogram and time series plot reveal
these salient features. A table of summary statistics
would not have revealed these features, and more
specific analysis techniques, designed to detect
bimodality or autocorrelation, are useful only after
the inquirer has become aware that he should look
for bimodality or autocorrelation (that is, they only
reveal to the inquirer what he is looking for, whereas
graphs have the power to reveal what one did not
expect to find beforehand).
Interpret Salient Features
Having identified, in Figure 4, bimodality and
autocorrelation as possibly interesting features of
the data, the next step in EDA is an essentially non-
statistical one. The next step is to theorize and spec-
ulate about what could have caused these patterns.
In the projects from which these graphs were taken,
the patterns were discussed with the persons operat-
ing the processes in question, and they came up with
the hypotheses that the bimodality was caused by
properties of the two molds that were used, and that
the autocorrelation was caused by the flexibility of
the conveyor belt. Subsequent confirmatory studies
corroborated these hypotheses, thus delivering the
key to solving the problems that these projects
studied.
The model in Figure 3 reflects Hempel’s (1966)
statement that hypotheses are not derived from
FIGURE 4 Two examples of graphs used in EDA in problem-solving in industry.
J. de Mast and B. P. H. Kemper 370
Downloaded By: [Universiteit van Amsterdam] At: 09:06 16 September 2009

observed facts but invented in order to account for
them. Mental models include an ontology of what
sort of things there are in the world and how they
are typically related (Mulaik, 1985); we invent inter-
pretations by combining concepts in our ontology
until we have a combination that could explain our
observations. The operators identified properties of
the mold and conveyor belt as possible causes
because they knew these things were there (and in
addition, that there are two molds, and that the
number of products on one loop of the conveyor
belt matches the seasonality in the right graph of
Figure 4).
The sort of inference where, by combining con-
cepts and analogies, eventually the pieces seem to
fit together and an explanation for the salient fea-
tures emerges is often named abduction (the term
was introduced by Peirce, 1931–1935 CP 5.189; but
see Niiniluoto, 1999 for an introduction). The logical
form is:
Surprising fact C is observed;
If A were true, C would be a matter of course;
Therefore, the hypothesis A is worthy of further
inquiry.
To come up with possible interpretations, human
brains do a mental search, combining concepts until
they have a combination that has explanatory coher-
ence (Thagard, 2004). In extreme cases, these mental
searches are pure trial and error (a so-called neo-
Darwinian search; see Simonton, 1999). In cases
where the inquirer has more familiarity with the pro-
blem, searches tend to be more directed (so-called
neo-Lamarckian searches; Johnson-Laird, 2006).
Going, as John Snow did, from identifying the
clustered pattern of victims, to identifying a water
pump as the epicenter is not a trivial step; one can
imagine that there are dozens of items in the cluster’s
center, each of which might have been instrumental
in causing the outbreak. One can imagine that in
Snow’s mind a mental search took place, until his
subconscious stumbled upon the water pump. In
Snow’s case, it is quite unlikely that the mental
search was a purely neo-Darwinian blind search.
By 1854, Snow had already become aware of the role
of the water system in the spread of cholera. Figure 5
gives an idea of some of the mental models in John
Snow’s ontology. Based on Snow (1855), the figure
reconstructs, in the form of a decision tree, Snow’s
reasoning in the years before the 1854 outbreak.
Given the advanced mental models that he had built
in his long-term memory, his mind probably was
quite fast in identifying the Broad Street pump as a
plausibly crucial element in an explanation of the
outbreak. Someone less immersed in the matter
would probably have needed more trial and error.
PRACTICAL ADVICE
How to Proceed If No Useful
Explanations Emerge?
Tufte’s (1983) account stops when Snow has iden-
tified the pump. But the hypothesis that the Broad
Street pump is the epicenter of the cluster does not
provide a complete causal explanation of what hap-
pened in 1854. This is an important stage in EDA, in
which the inquirer will find himself frequently: the
graph shows salient features, but the mind does
not come up with a complete explanation.
FIGURE 5 Decision tree illustrating what parts of the ontology
in Snow’s long-term memory could have looked like. The page
numbers refer to Snow (1855), but we do not claim that the given
tree accurately reconstructs Snow’s thinking process. The tree
shows how one can become aware of a number of constraints
in the problem (such as: is the disease contagious or nonconta-
gious?) by analyzing observations (these are briefly indicated in
the right margin). These constraints focus the inquirer’s attention.
Following a similar thinking process, by 1854 Snow had identified
human contact as one of the transmission mechanisms, but he
knew that there must be another mechanism that can work over
longer distances.
371 Principles of Exploratory Data Analysis
Downloaded By: [Universiteit van Amsterdam] At: 09:06 16 September 2009

Confronted with such a situation, many of the pro-
fessionals we teach fall in a trap we call ‘‘torture the
data until they confess.’’ They resort to making more
(and progressively more advanced) data analyses, in
the vain hope that data analysis will give them
answers. It does not; data analysis reveals salient fea-
tures, but their interpretation has to come from the
inquirer’s ontology. If the inquirer’s ontology is not
detailed enough, he has to observe and study the
phenomenon closer to learn more detail. The identi-
fied salient features are valuable clues where infor-
mative data can be collected (see the adjusted
model in Figure 6). Sterile accounts of the like of
Tufte (1983) fail to teach practitioners to be inquisi-
tive (collect empirical detail) and theorize (refine
one’s ontology).
This is what Snow did. Guided by the salient fea-
tures in the distribution of casualties, he collected
detailed information, interviewing people, making
analyses of water samples, thus discovering impor-
tant clues (the following and numerous other obser-
vations are described in Snow, 1855). Reverent
Henry Whitehead informed Snow that in the house
closest to the pump (Broad Street number 40), a
child had been infected by cholera and had died a
few days later (Vinten-Johansen et al., 2003). Its
mother had washed the diapers, and disposed of
the water through a drain that was later shown to
run a few feet from the well of the pump. The
1854 outbreak followed immediately. An excavation
in 1855 showed that both the drain and the
pump-well leaked, thus identifying the probable
cause of the outbreak.
By making inquiries and interviewing people,
Snow also discovered the probable causes of the
other salient features. The factory and the brewery,
having surprisingly low numbers of casualties given
their proximity to the Broad Street pump, turned
out to have their own pump-wells on their premises.
Some victims lived decidedly closer to other pumps;
inquiries taught Snow that some of these people pre-
ferred the taste of the water from the Broad Street
pump (and had their servants get it for them), other
victims were children who went to school close to
the Broad Street pump.
What Can Statistical Procedures
Do in EDA?
Statistics offers a wide range of analysis proce-
dures that are often affiliated with EDA, such as clus-
ter analysis, change-point analysis, runs tests, outlier
detection, projection pursuit, principal components
analysis, and more procedures designed to detect
patterns in data. These procedures are a welcome
complement to human pattern recognition, and in
the case of high dimensional datasets, there is not
really an alternative to these automated procedures
at least as a first step. But it is important to teach
practitioners what these procedures can and cannot
do. They can help in displaying the data, providing
graphs designed to make specific forms of salient
features stand out more clearly. Think of dendro-
grams (designed to reveal clustering) and CUSUM
plots (revealing drifts and shifts in time series). Some
of these procedures also incorporate decision criteria
for automatically flagging salient features, such as
control limits in CUSUM and other types of control
charts.
We wish to mention two important limitations.
First, these procedures miss the versatility of human
pattern recognition. They can do little beyond
screening the data for predefined patterns. For exam-
ple, a CUSUM analysis does not identify patterns in
data, it simply screens the data for drifts and shifts,
just as automatic outlier detection screens the data
for outliers. Second, we find it hard to conceive that,
in the foreseeable future, such procedures can auto-
matically perform the third step in EDA, interpreting
salient features. Thus, these procedures can reveal
and detect salient features, but they cannot automa-
tize discovery.
FIGURE 6 Often, EDA does not result in hypotheses immedi-
ately, because the inquirer’s knowledge about the phenomena
is not yet detailed enough. In such cases, the identified salient
features direct further investigation, suggesting where interesting
observations can be made.
J. de Mast and B. P. H. Kemper 372
Downloaded By: [Universiteit van Amsterdam] At: 09:06 16 September 2009

What Sort of Causes Can EDADiscover?
Suppose all Londoners had got their water from
the same supply. Would EDA have uncovered the
cause of the cholera outbreak? EDA can only reveal
influence factors that actually vary during data collec-
tion (that is, it uncovers sources of variation). If all
Londoners had drunk polluted water, the distribution
of victims would probably not have revealed the
water-based transmission mechanism; the distribu-
tion would probably have mirrored the population
density in that case, and no salient features would
have emerged. For this reason, EDA should be
complemented by other approaches to hypothesis
generation.
EDA Creeps into CDA
Did Snow’s Soho map prove anything? The flexible
and adaptive style of inquiry in EDA often fails to
produce datasets that are suited for confirmatory data
analysis. Typically, observations made for EDA come
with no warranty that they are representative for a
target population, and because EDA mostly works
with observational data, randomization and ceteris
paribus conditions are usually not met. Since EDA
does not pursue objective conclusions, this is not a
problem (or would even be unwanted) for EDA,
but inquirers should be critical about the appropri-
ateness of EDA data for confirmatory purposes. In
general, it is advisable to collect new data, from
a research design tailored to studying selected
hypotheses.
EDA in Combination with OtherApproaches to Hypothesis
Generation
EDA should not be studied or taught in isolation.
EDA is just one of numerous approaches to hypoth-
esis generation. De Mast and Bergman (2006)
present an inventory of approaches for problem
solving in business and industry, and Halpern
(2002) lists generic problem solving strategies. Some
of these approaches are mostly driven by knowledge
and theories (they focus on the top side of Figure 3);
others favor observations and data (the bottom side
of Figure 3) and some explicitly seek the interaction.
These approaches complement each other. Further,
these approaches can reinforce each other, the
results of one approach making the application of
another approach more fruitful.
Also John Snow exploited other strategies besides
EDA. Failing to identify cholera’s disease agent under
a microscope, Snow reasoned by analogy with
syphilis, small-pox and vaccinia, and speculated that
there must be some kind of morbid material, prob-
ably with the structure of a cell, which passes from
the sick to the healthy, and with the property of mul-
tiplying in the body of persons it attacks (Snow,
1855, pp. 14–15). Reasoning by analogy is one of
TABLE 1 Eight principles for EDA. Principles P1–P4 have
been introduced in De Mast and Trip (2007)
373 Principles of Exploratory Data Analysis
Downloaded By: [Universiteit van Amsterdam] At: 09:06 16 September 2009

the strategies described in De Mast and Bergman
(2006) as well as Halpern (2002). Cue acquisition
(a systematic description of symptoms, guided by
questions such as who?, where?, what?, when?, how
much?) is a strategy that Snow demonstrates on
nearly every page of his book, interviewing people,
making examinations of water and local conditions,
and gathering noteworthy details on the spot. The
excavation of the Broad Street pump-well in 1855
could be seen as what is called in industry an
autopsy, a reconstruction of what went wrong based
on a close examination of a malfunctioning product
or machine (or other items that are good specimens
of the problematic behavior under study).
We have summarized, in the form of the eight
principles in Table 1, some of the practical implica-
tions of our theoretical model. These principles give
a tangible prescriptive framework for EDA, and can
be the starting point of a teaching paradigm.
CONCLUSIONS
In this concluding section we discuss some ramifi-
cations of our model. First, Figure 3 suggests that two
sorts of expertise are needed for EDA, which we will
refer to as statistical expertise and context expertise.
Becoming an expert involves building a refined set
of mental models relevant to the field of expertise.
Since mental models representing context knowl-
edge (the inquirer’s ontology) are the source of
hypotheses, the interpretation of salient features (step
III in EDA) is the role of the context expert. On the
other hand, the statistician’s expertise includes a
refined repository of means of graphical display of
data (which are the mental models relevant to step I
in EDA). For the identification of salient features
(step 2), both the statistician and the context expert
bring valuable but partly complementary mental
models. The statistician is trained in noticing generic
salient features (outliers, multimodality, serial corre-
lation, multiple components of variation), whereas
the context expert is more versed in the particular fea-
tures that are relevant in the particular domain (such
as tell-tale configurations on an X-ray). For EDA the
two roles of statistical expert and context expert are
both needed (with the comment that both roles can
be played by a single person).
Second, for data analysis software the account
implies that procedures intended for EDA should
enable a flexible way of working driven by graphics,
thus facilitating a process that aims to reveal what
one did not expect to find beforehand. An emphasis
on formal hypothesis testing and modeling, though
essential for other pursuits, mainly hinders EDA.
The pursuit of objectivity, statistical significance,
and the related worries about assumptions and valid-
ity of the data are the backbone of confirmatory data
analysis, but they are irrelevant for EDA. Further, the
detailed statistical results—p-values, tables with fitted
coefficients, realizations of test statistics—are ineffec-
tive in inspiring hypotheses, and they are a distrac-
tion that keeps the inquirer from being inquisitive
and theorizing. For example, where histograms and
ogives can reveal how data deviate from a normal
distribution, thus inspiring the inquirer to think
about causal explanations, a normality test merely
tells the inquirer whether or not a normal distribution
fits to the data, which is fairly useless in EDA.
In teaching EDA the attention for data analysis
techniques (the statistician’s role) should be
balanced with attention for theorizing and being
inquisitive (the context expert’s role), because both
are inseparable facets of EDA. To facilitate this,
exemplars presented in textbooks should not be
sterile, offering a highly streamlined version of the
inquirer’s investigation, stripped of its contextual
detail. Snow’s own account (Snow, 1855) does a far
better job exemplifying the disposition and tedious
work it takes to discover things than some of the later
accounts. Further, EDA should be presented in rela-
tionship to the many alternative approaches for
hypothesis generation. In teaching EDA the relation
with other approaches should be mentioned, because
they necessarily complement and reinforce each
other. Taking this into account, EDA should prefer-
ably be taught in the wider context of empirical
inquiry (as opposed to the more restricted scope of
statistical data analysis).
ABOUT THE AUTHORS
Jeroen de Mast is Principal Consultant at IBIS UvA
and Associate Professor at the Department of Quan-
titative Economics, University of Amsterdam, The
Netherlands (E-mail: [email protected]).
Benjamin P. H. Kemper is a Consultant at IBIS UvA,
and Ph.D. student at the University of Amsterdam,
The Netherlands (E-mail: [email protected]).
J. de Mast and B. P. H. Kemper 374
Downloaded By: [Universiteit van Amsterdam] At: 09:06 16 September 2009

REFERENCES
Brody, H., Rip, M. R., Vinten-Johansen, P., Paneth, N., Rachman, S.(2000). Map-making and myth-making in Broad Street: The Londoncholera epidemic, 1854. The Lancet, 356:64–68.
De Mast, J., Bergman, M. (2006). Hypothesis generation in improve-ment projects. Quality and Reliability Engineering International, 22:839–850.
De Mast, J., Trip, A. (2007). Exploratory data analysis in quality improve-ment projects. Journal of Quality Technology, 39:301–311.
Gilbert, E. W. (1958). Pioneer maps of health and disease in England.Geographical Journal, 124:172–183.
Good, I. J. (1983). The philosophy of exploratory data analysis. Philosophyof Science, 50:283–295.
Halpern, D. F. (2002). Thought and Knowledge: An Introduction toCritical Thinking, 4th ed. New York: Psychology Press.
Hempel, C. G. (1966). Philosophy of Natural Science. Englewood Cliffs,NJ: Prentice-Hall.
Jaynes, E. T. (1957). Information theory and statistical mechanics. PhysicalReview, 106:620–630.
Johnson-Laird, P. (2006). HowWe Reason. Oxford: Oxford University Press.Koch, T. (2004). The map as intent: Variations on the theme of John
Snow. Cartographia, 39:1–14.
Mulaik, S. A. (1985). Exploratory statistics and empiricism. Philosophy ofScience, 52:410–430.
Niiniluoto, I. (1999). Defending abduction. Philosophy of Science,66:S436–S451.
Peirce, C. S. (1931–1935). Abduction and induction. In: Hartshorne, C.,Weiss, P., Eds. Collected Papers 1–5. Cambridge: Harvard UniversityPress, pp. 150–156.
Simonton, D. K. (1999). Creativity as blind variation and selective retention:Is the creative process Darwinian? Psychological Inquiry. 10:309–328.
Snow, J. (1855). On the Mode of Communication of Cholera, 2nd ed.London: John Churchill.
Thagard, P. (1992). Conceptual Revolutions. Princeton, NJ: PrincetonUniversity Press.
Thagard, P. (2004). Rationality and science. In: Mele, A., Rawlings, P., Eds.Handbook of Rationality. Oxford: Oxford University Press.
Tufte, E. R. (1983). The Visual Display of Quantitative Information.Cheshire: Graphics Press.
Tufte, E. R. (1997). Visual Explanations. Cheshire: Graphics Press.Tukey, J. W. (1977). Exploratory Data Analysis. Reading, PA: Addison-
Wesley.Vinten-Johansen, P., Brody, H., Paneth, N., Rachman, S., Rip, M. R.
(2003). Cholera, Chloroform, and the Science of Medicine: A Life ofJohn Snow. Oxford: Oxford University Press.
375 Principles of Exploratory Data Analysis
Downloaded By: [Universiteit van Amsterdam] At: 09:06 16 September 2009

Discussion of ‘‘Principles of ExploratoryData Analysis in Problem Solving: What Can
We Learn from a Well-Known Case?’’James R. Simpson
It is an honor and a pleasure to take part in the discussion of this important
article on the much neglected topic of exploratory data analysis. Jeroen de
Mast and Benjamin Kemper are to be commended for not only addressing
the world of found data (what statisticians=analysts=engineers routinely
confront) but for providing a framework for systematic interrogation of
otherwise seemingly disparate information. The authors creatively blend
modern graphical methods with ontological mental models as the founda-
tion for discovery and knowledge acquisition in observational studies. They
also strongly emphasize cooperation between the subject matter experts
and the analyst to combine relative strengths as the key for forward
progress.
What was somewhat necessary for the purposes of unfolding the pro-
posed template for exploratory data analysis (EDA), a stark contrast
between EDA studies and confirmatory data analysis (CDA) experiments,
is the focus of this discussion. Though it may be convenient to bucket
data analysis exercises as either EDA or CDA, many, if not most, times
projects consist of some combination of experiment and observation.
So, analysts operate in environments requiring EDA and CDA, not EDA
or CDA. Most of what follows addresses rationale for integrating EDA with
CDA, common ground between the two, and how well-intentioned-but-
awry CDA can benefit from the EDA methodology proposed by de Mast
and Kemper.
Before commenting on conditions for experiment and observation,
I would like to highlight some of the many contributions of the article.
The authors provide a valuable construct for gaining understanding by
iterating between mental models and various distribution-centric graphics.
This method should serve as the model for purely observational studies,
when no prior hypotheses exist. The complete diagram (de Mast and Kem-
per, Figure 6), involving iterative data gathering when salient features can-
not be resolved, is a sound roadmap. Box et al. (2005) contains a similar
general discovery procedure using induction and deduction iteration, but
it is the details and applications to EDA that make the proposed method
abundantly useful.
Address correspondence to James R.Simpson, Group Operations Analyst,53rd Test Management Group, EglinAir Force Base, FL. E-mail:[email protected]
Quality Engineering, 21:376–379, 2009Copyright # Taylor & Francis Group, LLCISSN: 0898-2112 print=1532-4222 onlineDOI: 10.1080/08982110903188292
376
Downloaded By: [Universiteit van Amsterdam] At: 08:52 16 September 2009

For those not familiar with the groundwork laid
in de Mast and Trip (2007), it is well worth the
read. The initial principles for the proposed EDA
methodology are clearly explained and detailed.
De Mast and Trip also provide sage advice to take
care in treating observational data as if they were a
confirmatory experiment with hypotheses to be
tested for statistical significance. Likewise, when pro-
jects involve some combination of observation and
experiment, it is important to apply rigorous
statistical methods only where appropriate.
Is it proper to draw such clear distinctions
between EDA and CDA? Many of the suggestions
for practice of EDA apply to even routine CDA. Often
we encounter CDA gone awry, or CDA plus obser-
vational variables (covariates), or CDA as part of a
larger observational study. Clearly, unknown noise
sources play a spoiler’s role in any well-planned
experiment, such that searching for salient features
is common practice. So lurking variable identification
via outliers and root cause investigation are good
examples of the need for EDA methods in otherwise
confirmatory tests. In these cases, no prior hypoth-
eses are proposed regarding the particular source
of outside intervention, yet an investigation should
be conducted using the de Mast and Kemper EDA
strategy to uncover the underlying cause. The com-
mon use of covariates in CDA should also drive the
experimenter to adopt a more disciplined, integrated
EDA–CDA investigation that allows for models to be
developed while iterative mental models are enter-
tained. Other routinely encountered exceptions to
the assumptions of CDA are randomization restric-
tions, missing data, imprecise execution, and serial
correlated data.
Randomization in experimentation is fundamental
to success in identifying true underlying signals due
to purposeful manipulation of primary interest vari-
ables. Bisgaard (2008 and discussion) emphasizes
the importance of randomization in experimentation,
especially when processes are not necessarily stable.
In practice, unfortunately, pressures for timely, prac-
tical execution often lead to tests conducted in some
structured run order. Take, for example, the business
of military testing and the goal of determining the
goodness of a new parachute system for use by free-
fall rescue specialists. A seemingly straightforward
experiment becomes difficult to randomize. Suppose
the factors are landing zone altitude, jump initiation
altitude, time of day, jumper weight, jumper equip-
ment, and aircraft velocity. Suppose further that two
aircraft (helicopter and jump plane) are necessary to
achieve the required velocities. Quickly one can see
that more than half of the control variables are
difficult to randomize. Plus, jumper weight may be
difficult to set. Person-to-person jump style varia-
bility, weather conditions, inability to set other vari-
ables precisely, center of gravity variation, and
many other variables make this CDA much more of
a combined CDA with EDA.
Consider next a much more complex study
involving a military weapon system evaluation.
Operational pilots in an exercise are tasked to
employ weapons against targets in an otherwise
chaotic environment. Though some parameters can
be specified to some extent (weapon type, weapon
quantity), most other variables (range, altitude, velo-
cities, aspect angles, pilot tactics, winds) are
observed. This type of problem is not specific to
the military, because it is also prevalent in manu-
facturing and especially in the services arena. Here
CDA takes a back seat to EDA, but it is nonetheless
a combination of the two types of data analyses.
CDA is also cast by de Mast and Kemper as
representative of the population. Again, this
characterization is definitely the aim of a designed
experiment. However, Murphy’s law is invoked
regularly, such that data cannot be collected for var-
ious reasons, experiments are cut short, variables
have set point error, and biases are introduced by
unplanned deviations in execution (operator A, the
only inexperienced one, is the only one available).
What can go wrong will.
Other complications that corrupt the traditional
CDA template exist. Box and Paniagua-Quinones
(2007) point out that data over time are not born of
a stable random process. Any data collected over time
with reasonably short intervals between data should
have the expectation of serial correlation. As such it
makes sense to invoke statistical methods adept at
identifying salient features in time series data. Plots
of the data certainly aid in identifying such behavior;
however, is it not appropriate to hypothesize the
presence of serial correlation? Our job as analysts=
statisticians in such a situation is made all the more
tractable if we anticipate behavior commonly experi-
enced in practice. The presence of and the integration
with subject matter expertise cannot be overstated.
377 Discussion
Downloaded By: [Universiteit van Amsterdam] At: 08:52 16 September 2009

Hypothesis testing is clearly foundational to CDA
but is also inherent in EDA via mental models—we
often arrive to the scene with either preconceived
notions, agendas, or we note something peculiar
during data collection. For example, back to the
weapon engagement exercise, perhaps the context
expert (pilot project manager) picked up irregular
yet recurring anomalous behavior of the operator
pilot via radio communication prior to strafing runs
that may impact success in hitting a target. For this
largely observational study, a hypothesis is formed
that merits investigation, prior to any analysis of
the data. So hypotheses are not always clearly
defined as a priori or post hoc. More evidence of
commonalities between CDA and EDA are described
by de Mast and Kemper in the first subsection of
Practical Advice and in Figure 6, where a roadblock
to progress is averted by collecting more data. Tar-
geted, iterative experimentation is common practice
in CDA because the questions are not fully answered
through initial experimentation.
So what are the appropriate tools and methods to
apply in this hybrid data environment? Certainly, the
first ones applied should be graphical in nature, tak-
ing care to emphasize plots exposing distributional
properties, just as de Mast and Kemper suggest.
General-purpose statistical software packages have
come a long way in providing revealing graphical
displays of high-dimension (many variables) data in
small multiples, easing the processing of informa-
tion. JMP even has a data distribution feature that
plots multiple variable histograms, allowing the ana-
lyst to highlight subsets of observations in particular
bins in one variable to see the locations of those
observations in the distributions of other variables
to visualize possible correlations. Graphical methods
can lead to finding salient features. Other methods
worthy of consideration are a host of empirical
modeling techniques, partition trees, smoothing
methods for complex functions, and clustering
methods. It is important to note that the investigation
process should place first priority on simpler meth-
ods, include the context expert, and be mindful of
expectations with more complex methods, again as
de Mast and Kemper warn. Empirical statistical
modeling should take into account influence due to
leverage, outliers, collinearity, serial correlation,
and heavily skewed or multimodal responses. Parti-
tion trees such as classification and regression trees
(CART) can be surprisingly helpful, especially when
variables take on many categories. CART is easy to
implement and is well suited to identify breaks or
grouping in variables that may not be obvious in
graphs. Explanatory flexible regression methods
(Hastie et al. 2001) such as multivariate adaptive
regression splines have strengths in providing feed-
back on fairly complex input–output relationships
while accommodating many variables. Clustering
methods aid in identifying salient features in more
than two variables. Analysts can work together with
context experts to move toward better understanding
in observational studies.
The bottom line is that the distinction between stu-
dies=investigations requiring purely EDA or CDA is
nearly always blurred. Some combination of these
methods should always be the preferred solution.
Know what can and cannot be done within the
confines of an investigation. Are hypotheses in place
a priori that enable significance testing? What addi-
tional information can be obtained? Are the context
and statistical experts working together? Are graphi-
cal methods being fully employed prior to any for-
mal statistical methods? Are advanced statistical
methods warranted? Are the salient features correctly
identified? Clearly and thankfully, the authors have
developed a much needed framework for EDA
and, more importantly, raised awareness of the
importance of EDA in any investigation.
ABOUT THE AUTHOR
James R. Simpson is Chief Operations Analyst for
the Air Force’s 53rd Test Management Group at Eglin
Air Force Base, FL. He formerly served as Associate
Professor of Industrial Engineering at Florida State
University and Associate Professor of Operations
Research at the United States Air Force Academy.
He is the immediate past Editor-in-Chief for Quality
Engineering and an associate editor for Quality
and Reliability Engineering International. He earned
a B.S. in Operations Research from the United States
Air Force Academy, and M.S. in Operations Research
from the Air Force Institue of Technology, and a
Ph.D. in Industrial Engineering from Arizona State
University. He is a senior member of ASQ and IIE,
a member of ASA and AIAA, and his e-mail address
J. R. Simpson 378
Downloaded By: [Universiteit van Amsterdam] At: 08:52 16 September 2009

REFERENCES
Bisgaard, S. (2008). Must a process be in statistical control beforeconducting designed experiments? Quality Engineering, 20(2):143–150.
Box, G. E. P., Hunter, J. S., Hunter, W. G. (2005). Statistics for Experimen-ters: Design, Innovation, and Discovery, 2nd ed. New York: Wiley.
Box, G. E. P., Paniagua-Quinones, C. (2007). Two charts: Not one. QualityEngineering, 19(2):93–100.
de Mast, J., Trip, A. (2007). Exploratory data analysis in quality improve-ment projects. Journal of Quality Technology, 39:301–311.
Hastie, T., Tibshirani, R., Friedman, J. (2001). The Elements of StatisticalLearning: Data Mining, Inference, and Prediction. New York:Springer.
379 Discussion
Downloaded By: [Universiteit van Amsterdam] At: 08:52 16 September 2009
Geoff Vining’s Discussion of ‘‘Principles ofExploratory Data Analysis in ProblemSolving: What Can We Learn From a
Well-Known Case?’’Geoff Vining
Virginia Polytechnic Institute and
State University, Blacksburg,
VirginiaI want to thank the authors for such a wonderful article. I am extremely
happy that they chose to submit it to Quality Engineering. Exploratory data
analysis (EDA), properly used, is an excellent start to solving many of the
problems that Six Sigma Black Belts and other applied statisticians face.
The authors do an outstanding job illustrating how one should apply this
methodology. De Mast and Kemper demonstrate, very effectively, that often
the key to successful discovery and problem solving is asking the right
questions to form the proper hypotheses.
Many years ago, I worked with a major chemical company who wanted to
create a problem-solving strategy system like Six Sigma but not exactly like
Six Sigma. They wanted a series of surefire steps to address all of their basic
problems. As the training unfolded, they expected to solve every problem
by first confirming the measurement system, next conducting an appropriate
experiment, and then maintaining the gain through statistical process con-
trol. Basically, they wanted a single process, purely based on confirmatory
data analysis techniques, to solve all of their quality and process problems.
I taught them several of the component parts, such as design of experi-
ments, response surface methodology, and statistical process control. I truly
blew their minds away in the last course, when I told them, ‘‘In some cases,
the solution to the problem is not through some designed experiment but
rather through proper control of the process,’’ as Deming advocated. He
strongly believed that the proper application of Shewhart control charts is
the key to quality and productivity improvement. At a fundamental level,
this company failed to realize that we must understand the right questions
to ask before we can determine the proper tools. The company did not
appreciate that we need the right tools for the right job. De Mast and
Kemper have taken this approach to a whole new level through their focus
on using EDA early in the problem-solving efforts.
I very much like how de Mast and Kemper show the interplay of the men-
tal models with the simple tools of EDA. Their analogy of the interpretation
of an X-ray is perfectly on spot. Can a pure empiricist solve very real
Address correspondence to GeoffVining, Virginia Polytechnic Instituteand State University, Blacksburg, VA24061. E-mail: [email protected]
Quality Engineering, 21:380–381, 2009Copyright # Taylor & Francis Group, LLCISSN: 0898-2112 print=1532-4222 onlineDOI: 10.1080/08982110903188300
380
Downloaded By: [Universiteit van Amsterdam] At: 09:10 16 September 2009

problems? Yes, but it is a very messy process. Being
able to take simple, graphical tools and combine
them with salient expertise is the key to effective dis-
covery and problem solving. Statisticians, as such,
are pure empiricists. We have a great deal of exper-
tise that can help solve the practitioner’s problem,
but we can only help. We do not know the proper
questions to ask. The beauty of this article is that
de Mast and Kemper show us how we as statisticians
can work with the subject matter experts to find the
real questions of interest through EDA. Once we
have the proper questions, we then have the proper
hypotheses to perform confirmatory data analysis,
which is what many of us statisticians do best.
The idea of an iterative induction–deduction pro-
cess for solving problems is not new. It goes to the
heart of the scientific method. George Box has been
teaching this point for more than fifty years! I suggest
that readers interested in George’s perspective
should look at Box (1999). A wonderful quote from
this paper is ‘‘It is the investigation itself, involving
many designs and analyses, that must be regarded
as the unit, and the success of the investigation must
be regarded as the objective’’ (p. 21). I believe that
this paper offers a nice complement to de Mast and
Kemper’s work. The key that ties these two papers
together is that the proper application of EDA with
an appropriate mental model helps the problem-
solver to do the iterative induction–deduction cycle
more effectively.
Once again, as editor of Quality Engineering, I
thank the authors for submitting this work to our
journal. I know that it will prove invaluable to our
readers as they go out to solve real problems!
REFERENCE
Box, G. E. P. (1999). Statistics as a catalyst for learning by scientificmethod part II—A discussion. Journal of Quality Technology, 31:16–29.
381 Discussion
Downloaded By: [Universiteit van Amsterdam] At: 09:10 16 September 2009

Discussion of ‘‘Principles of ExploratoryData Analysis in Problem Solving: What
Can We Learn From a Well-KnownCase?’’—Rejoinder
Jeroen de Mast,
Benjamin P. H. Kemper
Institute for Business and
Industrial Statistics (IBIS UvA),
University of Amsterdam,
Amsterdam, The NetherlandsWe would like to thank the editor for organizing this discussion of our
paper, and we appreciate the points brought forward by the discussants.
Professor Vining’s example of the chemical company illustrates the
problem that we aimed to address with our paper. The professionals
responsible for designing this company’s problem solving methodology
were tool experts—they were, probably competent, experts on (mostly
confirmatory) tools for data analysis, but they were, apparently, lacking in
understanding of the process of inquiry. For us, being an expert on the tools
of data analysis is not enough for being called a statistician, as the latter for
us also involves understanding of the process of inquiry, and the roles of
exploratory investigations and confirmatory investigations in it. We follow
professor Vining here in acknowledging professor George Box as our
profession’s inspiring tutor on this thought.
Dr. Simpson makes a point in place, warning the reader that in the actual
process of problem solving, EDA and confirmatory data analysis (CDA) can-
not be clearly distinguished—activities, techniques and pursuits related to
these two are often thoroughly intertwined. Dr. Simpson’s assertion that
problem solving cannot be clearly distinguished into studies requiring
purely EDA and studies requiring purely CDA, is illustrated by the case of
John Snow. The reader may have assumed Snow’s Grand Experiment
(mainly CDA in intention and set-up) to be after the Soho episode which
identified the pump, and more generally, the water system, as instrumental
in the epidemic; but in fact, these two investigations were concurrent, with
John Snow frequently traveling between the south and north shore of the
River Thames. The distinction between an EDA phase which identifies the
hypotheses, and a CDA phase in which they are tested, is often a simplifying
reconstruction afterwards.
For us, the reason for contrasting the concepts of EDA and CDA, is
that both represent distinctive functions in the problem solving process
(sometimes characterized as discovery and justification). Each function
Address correspondence to Jeroen deMast, Institute for Business andIndustrial Statistics (IBIS UvA),University of Amsterdam, PlantageMuidergracht 12, Amsterdam, 1018TV, The Netherlands. E-mail:[email protected]
Quality Engineering, 21:382–383, 2009Copyright # Taylor & Francis Group, LLCISSN: 0898-2112 print=1532-4222 onlineDOI: 10.1080/08982110903291757
382
Downloaded By: [Universiteit van Amsterdam] At: 09:11 16 September 2009

has its own mindset, and distinctive and partly con-
tradictory requirements (adaptivity and imaginative-
ness versus rigour and objectiveness). Although
EDA and CDA activities may be intertwined in the
heat of the battle, we consider it a good mental habit
to take a step back and ask oneself: ‘‘Am I trying to
reach a conclusion and prove something, or am I try-
ing to generate ideas?’’ Failing to relate what one is
doing to either an exploratory or a confirmatory
ambition, brings about the danger of not applying
the proper requirements to what one is doing. This
could result in, for example, one’s EDA not being
imaginative enough due to a misguided pursuit of
objectivity, or one’s CDA being unreliable due to a
way of working which is not methodical.
The danger of not distinguishing EDA and CDA
in teaching and in theorizing about our profession,
is that EDA is underappreciated. It results in the
development of the field of EDA to be marginal
compared to the field of CDA, and it results in stu-
dents overfocused on experiments, and not paying
enough attention to hypothesis generation.
383 Discussion
Downloaded By: [Universiteit van Amsterdam] At: 09:11 16 September 2009