Principles and practices of laser scanning confocal microscopy · Principles and Practices of Laser...
23
Laser Scanning Confocal Microscopy 127 MOLECULAR BIOTECHNOLOGY Volume 16, 2000 REVIEW 127 Molecular Biotechnology 2000 Humana Press Inc. All rights of any nature whatsoever reserved. 1073–6085/2000/16:2/127–149/$15.75 1. Introduction The major application of confocal microscopy in the biomedical sciences is for imaging either fixed or living tissues that have been labeled with one or more fluorescent probes. When these samples are imaged using a conventional light microscope, fluorescence in the specimen in focal planes away from the region of interest interferes with resolution of structures in focus, especially for those specimens that are thicker than 2 μm or so (Fig. 1). The confocal approach provides a slight increase in both lateral and axial resolution. It is the ability of the instrument to eliminate the “out-of-focus” flare from thick fluorescently labeled specimens that has caused the explosion in its popularity recently (1). Most modern con- focal microscopes are now relatively easy to operate and have become integral parts of many multiuser imaging facilities. Since the resolution achieved by the LSCM is a little bet- ter than that achieved in a conventional wide- field light microscope (theoretical maximum resolution of 0.2 μm), but not as great as that in the transmission electron microscope (0.1 nm), it has bridged the gap between these two commonly used techniques. The method of image formation in a confocal microscope is fundamentally different from that in a conventional wide-field microscope where the entire specimen is bathed in light from a mer- cury or xenon source, and the image can be viewed directly by eye. In contrast, the illumina- tion in a confocal microscope is achieved by scan- ning one or more focused beams of light, usually from a laser, across the specimen. An image pro- duced by scanning the specimen in this way is called an optical section. This term refers to the noninvasive method of image collection by the instrument, which uses light rather than physical means to section the specimen. The confocal approach has thus facilitated the imaging of liv- ing specimens, enabled the automated collection *Author to whom all correspondence and reprint requests should be addressed. Department of Molecular Biology, University of Wisconsin, 1525 Linden Drive, Madison, Wisconsin 53706, USA, E-mail: [email protected] Principles and Practices of Laser Scanning Confocal Microscopy Stephen W. Paddock* Abstract The laser scanning confocal microscope (LSCM) is an essential tool for many biomedical imaging appli- cations at the level of the light microscope. The basic principles of confocal microscopy and the evolution of the LSCM into today’s sophisticated instruments are outlined. The major imaging modes of the LSCM are introduced including single optical sections, multiple wavelength images, three-dimensional reconstruc- tions, and living cell and tissue sequences. Practical aspects of specimen preparation, image collection, and image presentation are included along with a primer on troubleshooting the LSCM for the novice. Index Entries: Confocal microscopy; laser scanning; fluorescence light microscopy.
Transcript of Principles and practices of laser scanning confocal microscopy · Principles and Practices of Laser...

Laser Scanning Confocal Microscopy 127
MOLECULAR BIOTECHNOLOGY Volume 16, 2000
REVIEW
127
Molecular Biotechnology 2000 Humana Press Inc. All rights of any nature whatsoever reserved. 1073–6085/2000/16:2/127–149/$15.75
1. IntroductionThe major application of confocal microscopy
in the biomedical sciences is for imaging eitherfixed or living tissues that have been labeled withone or more fluorescent probes. When thesesamples are imaged using a conventional lightmicroscope, fluorescence in the specimen in focalplanes away from the region of interest interfereswith resolution of structures in focus, especiallyfor those specimens that are thicker than 2 µm orso (Fig. 1). The confocal approach provides aslight increase in both lateral and axial resolution.It is the ability of the instrument to eliminate the“out-of-focus” flare from thick fluorescentlylabeled specimens that has caused the explosionin its popularity recently (1). Most modern con-focal microscopes are now relatively easy tooperate and have become integral parts ofmany multiuser imaging facilities. Since theresolution achieved by the LSCM is a little bet-ter than that achieved in a conventional wide-
field light microscope (theoretical maximumresolution of 0.2 µm), but not as great as that inthe transmission electron microscope (0.1 nm), ithas bridged the gap between these two commonlyused techniques.
The method of image formation in a confocalmicroscope is fundamentally different from thatin a conventional wide-field microscope wherethe entire specimen is bathed in light from a mer-cury or xenon source, and the image can beviewed directly by eye. In contrast, the illumina-tion in a confocal microscope is achieved by scan-ning one or more focused beams of light, usuallyfrom a laser, across the specimen. An image pro-duced by scanning the specimen in this way iscalled an optical section. This term refers to thenoninvasive method of image collection by theinstrument, which uses light rather than physicalmeans to section the specimen. The confocalapproach has thus facilitated the imaging of liv-ing specimens, enabled the automated collection
*Author to whom all correspondence and reprint requests should be addressed. Department of Molecular Biology, University of Wisconsin,1525 Linden Drive, Madison, Wisconsin 53706, USA, E-mail: [email protected]
Principles and Practices of Laser Scanning Confocal Microscopy
Stephen W. Paddock*
AbstractThe laser scanning confocal microscope (LSCM) is an essential tool for many biomedical imaging appli-
cations at the level of the light microscope. The basic principles of confocal microscopy and the evolution ofthe LSCM into today’s sophisticated instruments are outlined. The major imaging modes of the LSCM areintroduced including single optical sections, multiple wavelength images, three-dimensional reconstruc-tions, and living cell and tissue sequences. Practical aspects of specimen preparation, image collection, andimage presentation are included along with a primer on troubleshooting the LSCM for the novice.
Index Entries: Confocal microscopy; laser scanning; fluorescence light microscopy.

128 Paddock
MOLECULAR BIOTECHNOLOGY Volume 16, 2000
of three-dimensional data in the form of Z-series,and improved the images of multiple labeledspecimens (1).
Emphasis has been placed on the laser scan-ning confocal microscope (LSCM) throughoutthis article because it is currently the instrumentof choice for most biomedical research applica-tions, and it is therefore most likely to be theinstrument first encountered by the novice user.Several alternative designs of confocal instru-ments occupy specific niches within the biologi-cal imaging field (2). Optical sections can beproduced using other, nonconfocal, methods. Forexample, using deconvolution, which calculatesthe out-of-focus information in an image andremoves it digitally (3), and multiple photonimaging (4), which uses the same method of scan-ning as the LSCM but uses a laser that onlyexcites the fluorochromes that are imaged in theoptical section itself.
2. Evolution of the Confocal ApproachThe development of confocal microscopes
was driven largely by a desire to image biologi-cal events as they occur in vivo. The inventionof the confocal microscope is usually attributedto Marvin Minsky, who built a working micro-scope in 1955 with the goal of imaging neuralnetworks in unstained preparations of livingbrains. Details of the microscope, and of its devel-opment can be found in an informative memoir
by Minsky, and all of the modern confocal imag-ing systems employ the principle of confocalimaging that he patented in 1957 (5).
In Minsky’s original confocal microscope thepoint source of light is produced by a pinholeplaced in front of a zirconium arc source. Thepoint of light is focused by an objective lens intothe specimen, and light that passes through it isfocused by a second objective lens at a secondpinhole, which has the same focus as the first pin-hole, i.e., it is confocal with it. Any light thatpasses through the second pinhole strikes a low-noise photomultiplier, which produces a signalthat is directly proportional to the brightness ofthe light. The second pinhole prevents light fromabove or below the plane of focus from strikingthe photomultiplier. This is the key to the confo-cal approach, namely the elimination of out-of-focus light or “flare” in the specimen by spatialfiltering. Minsky also described a reflected lightversion of the microscope that uses a single objec-tive lens and a dichromatic mirror arrangement.This is the basic configuration of most modernconfocal systems used for fluorescence imaging(Fig. 2).
In order to build an image, the focused spot oflight must be scanned across the specimen insome way. In Minsky’s original microscope thebeam was stationary and the specimen itself wasmoved on a vibrating stage. This optical arrange-ment has the advantage of always scanning on the
Fig. 1. Conventional epifluorescence image (A) compared with a confocal image (B) of a similar region of awhole mount of a butterfly (Precis coenia) pupal wing stained with propidium iodide. Note the improved resolu-tion of the nuclear detail (B).

Laser Scanning Confocal Microscopy 129
MOLECULAR BIOTECHNOLOGY Volume 16, 2000
optical axis, which can eliminate any lens defects.However, for many biological specimens, move-ment of the specimen can cause them to wobbleand distort, which results in a loss of resolution inthe image. Moreover, it is impossible to performvarious manipulations such as microinjection offluorescently labeled probes when the specimenis moving.
Finally an image of the specimen has to be pro-duced. A real image is not formed in Minsky’soriginal microscope but rather the output fromthe photodetector is translated into an image ofthe region-of-interest. In Minsky’s original designthe image was built up on the screen of a militarysurplus oscilloscope with no facility for hardcopy. Minsky admitted at a later date that the
image quality in his microscope was not veryimpressive because of the quality of the oscillo-scope display and not because of lack of resolu-tion achieved with the microscope itself.
It is clear that the technology was not availableto Minsky in 1955 to fully demonstrate the poten-tial of the confocal approach especially for imag-ing biological structures. According to Minsky,this is perhaps a reason why confocal microscopydid not immediately catch on with the biologicalcommunity, who were, (as they are now) a highlydemanding and fickle group when it came to thequality of their images. After all, at the time theycould quite easily view and photograph theirbrightly stained and colorful histological tissue sec-tions using light microscopes with excellent optics.
In modern confocal microscopes the imageis either built up from the output of a photo-multiplier tube or captured using a digital chargecoupled device (CCD) camera, directly pro-cessed in a computer imaging system, and thendisplayed on a high-resolution video monitorand recorded on modern hard copy devices, withspectacular results.
The optics of the light microscope have notchanged drastically in decades since the finalresolution achieved by the instrument is governedby the wavelength of light, the objective lens andproperties of the specimen itself. However, theassociated technology and the dyes used to addcontrast to the specimens have been improved sig-nificantly over the past 20 yr. The confocalapproach is a direct result of a renaissance inlight microscopy that has been fueled largely byadvancements in modern technology. Severalmajor technological advances that would havebenefited Minsky’s confocal design are nowavailable (and affordable) to biologists. Theseadvances include:
1. Stable multiwavelength lasers for brighterpoint sources of light.
2. More efficiently reflecting mirrors.3. Sensitive low-noise photodetectors.4. Fast microcomputers with image processing
capabilities.5. Elegant software solutions for analyzing the
images.
Fig. 2. The light path in a typical LSCM is basedupon that of a conventional reflected-light wide-fieldepifluorescence microscope, but with pinholes placedin front of the light source (the point source is now alaser) and in front of the photodetector. The pinhole atthe light source, the focused point in the specimen,and the pinhole in front of the detector are all confocalwith one another.

130 Paddock
MOLECULAR BIOTECHNOLOGY Volume 16, 2000
6. High-resolution video displays and digitalprinters.
7. Brighter and more stable fluorescent probes.
These technologies have been developed inde-pendently, and since 1955, they have slowly beenincorporated into modern confocal imaging sys-tems. For example, Shinya Inoue and RobertAllen first effectively applied digital image pro-cessing to biological imaging in the early 1980sat Woods Hole. Their “video-enhanced micro-scopes” enabled an apparent increase in resolu-tion of structures using digital enhancement ofimages captured using a low-light-level silicon-intensified-target (SIT) video camera mounted ona light microscope and connected to a digitalimage processor. Cellular structures such as themicrotubules, which are just beyond the theo-retical resolution of the light microscope, wereimaged using differential interference contrast(DIC) optics and enhanced using such digitalmethods as background subtraction and contrastenhancement in real time. These techniques arereviewed in a landmark book titled Video Micros-copy by Shinya Inoue, which has been recentlyupdated with Ken Spring, and provides an excel-lent primer for the principles and practices ofmodern light microscopy (6).
Confocal microscopes are usually classified bythe method in which the specimens are scanned.Minsky’s original design was a stage scanningsystem driven by a primitive tuning fork arrange-ment that was rather slow to build an image. Stagescanning confocal microscopes have evolved intoinstruments that are used traditionally for materi-als science applications such as the microchipindustry. Systems based upon this principle haverecently become popular in biomedical applica-tions for screening arrays of fluorescently labeledDNA oligonucleotides on glass wafer supports or“gene chips” (7).
An alternative to moving the specimen is toscan the beam across a stationary one, which ismore practical for imaging biological samples,and is the basis of many systems that haveevolved into the confocal imaging systems thatare so prevalent today. The more technical aspects
of confocal instrumentation have been coveredelsewhere (2), but briefly there are two funda-mentally different methods of beam scanning:multiple-beam scanning or single-beam scan-ning. The most popular way is currently single-beam scanning, which is typified by the LSCM.Here the scanning is most commonly achievedby computer-controlled galvanometer drivenmirrors (1 frame/s), or in some systems, by anacoustooptical device for faster scanning rates(near video rates). The alternative is to scan thespecimen with multiple beams (almost real time)usually using some form of spinning Nipkowdisc. The forerunner of these systems was thetandem scanning microscope (TSM) and subse-quent improvements to the design have becomemore efficient for collecting images from flu-orescently labeled specimens.
There are currently two viable alternatives toconfocal microscopy that produce optical sectionsin technically different ways. These are decon-volution (3) and multiple photon imaging (4), andas with confocal imaging they are based on aconventional light microscope. Deconvolution isa computer-based method that calculates andremoves the out-of-focus information from a fluo-rescence image. The deconvolution algorithmsand the computers themselves are now fastenough to make this technique a practical optionfor imaging. Multiple photon microscopy uses ascanning system that is identical to that of theLSCM but there is no need for the pinhole sincethe laser only excites at the point of focus in thespecimen. This makes the technique more practi-cal for imaging living tissue (4).
3. The Laser Scanning Confocal MicroscopeThe LSCM is built around a conventional light
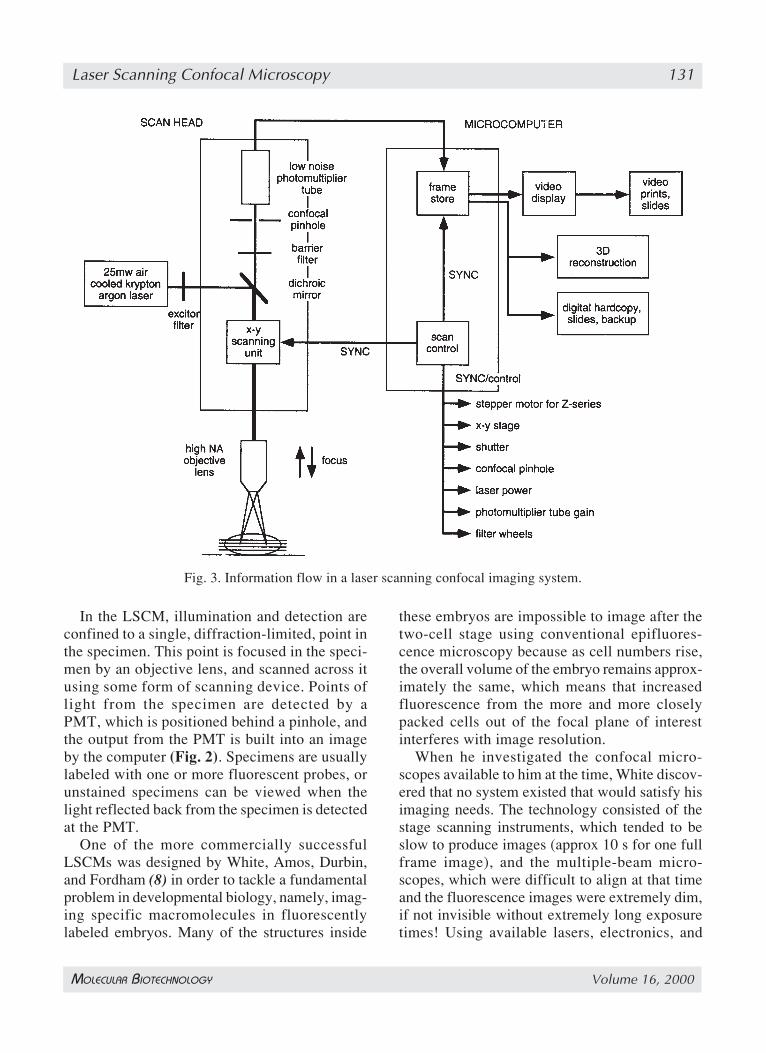
microscope, and uses a laser rather than a lampfor a light source, sensitive photomultiplier tubedetectors (PMTs), and a computer to control thescanning mirrors and to facilitate the collectionand display of the images. The images are subse-quently stored using computer media and ana-lyzed using a plethora of computer software eitherusing the computer of the confocal system or asecond computer (Fig. 3).
Laser Scanning Confocal Microscopy 131
MOLECULAR BIOTECHNOLOGY Volume 16, 2000
In the LSCM, illumination and detection areconfined to a single, diffraction-limited, point inthe specimen. This point is focused in the speci-men by an objective lens, and scanned across itusing some form of scanning device. Points oflight from the specimen are detected by aPMT, which is positioned behind a pinhole, andthe output from the PMT is built into an imageby the computer (Fig. 2). Specimens are usuallylabeled with one or more fluorescent probes, orunstained specimens can be viewed when thelight reflected back from the specimen is detectedat the PMT.
One of the more commercially successfulLSCMs was designed by White, Amos, Durbin,and Fordham (8) in order to tackle a fundamentalproblem in developmental biology, namely, imag-ing specific macromolecules in fluorescentlylabeled embryos. Many of the structures inside
these embryos are impossible to image after thetwo-cell stage using conventional epifluores-cence microscopy because as cell numbers rise,the overall volume of the embryo remains approx-imately the same, which means that increasedfluorescence from the more and more closelypacked cells out of the focal plane of interestinterferes with image resolution.
When he investigated the confocal micro-scopes available to him at the time, White discov-ered that no system existed that would satisfy hisimaging needs. The technology consisted of thestage scanning instruments, which tended to beslow to produce images (approx 10 s for one fullframe image), and the multiple-beam micro-scopes, which were difficult to align at that timeand the fluorescence images were extremely dim,if not invisible without extremely long exposuretimes! Using available lasers, electronics, and
Fig. 3. Information flow in a laser scanning confocal imaging system.

132 Paddock
MOLECULAR BIOTECHNOLOGY Volume 16, 2000
digital image processors, White and his col-leagues designed and built a LSCM that was suit-able for conventional epifluorescence microscopyof biological specimens, for example, fluores-cently labeled embryos, that has since evolvedwith improvements in technology into an instru-ment that is now used in a plethora of biomedicalapplications.
In a landmark paper that captured the attentionof the cell biology community by the quality ofthe images published in it (9), White et al. com-pared images collected from the same specimensusing conventional wide-field epifluorescencemicroscopy and their LSCM. Rather than physi-cally cutting sections of multicellular embryos,their LSCM produced “optical sections” that werethin enough to resolve structures of interest andwere free of much of the out-of-focus fluores-cence that had previously contaminated theirimages. This technological advance allowed themto take full advantage of the specificity of immu-nofluorescence labeling to follow changes in thecytoskeleton in cells of early embryos at a higherresolution than was possible using conventionalepifluorescence microscopy.
Simply adjusting the diameter of a pinhole infront of the photodetector could vary the thick-ness of the optical sections (Fig. 2). This opticalpath has proven to be extremely flexible for imag-ing biological structures as compared with someother designs that employ fixed diameter pin-holes. The image can be zoomed with no loss ofresolution simply by decreasing the region of thespecimen that is scanned by the mirrors, and plac-ing the scanned information into the same size ofdigital memory or framestore. This imparts arange of magnifications to a single objective lens,and is extremely useful when imaging rare eventswhen changing a lens may risk losing the regionof interest.
This microscope and several other LSCMsdeveloped during the same time period, were theforerunners of the sophisticated instruments thatare now available to biomedical researchersfrom several commercial vendors (10). There hasbeen a tremendous explosion in the popularity ofconfocal microscopy over the past 10 yr. Indeed
many laboratories are purchasing the systems asshared instruments in preference to electronmicroscopes despite the reduced resolution, whichis between the conventional light microscope andthe electron microscope. The advantage of confo-cal microscopy lies within its great number ofapplications and its relative ease for producingextremely high-quality digital images from speci-mens prepared for the light microscope.
The first generation LSCMs were tremen-dously wasteful of photons in comparison to thenew microscopes. The early systems worked wellfor fixed specimens but tended to kill living speci-mens unless extreme care was taken to preservethe viability of specimens on the stage of themicroscope by minimizing the exposure to laserlight. Nevertheless, the microscopes producedsuch good images of fixed specimens that confo-cal microscopy was fully embraced by the bio-logical imagers.
Improvements have been made at all stages ofthe imaging process in the subsequent generationsof instruments including the addition of morestable lasers, more efficiently reflecting mirrors,more sensitive low noise photodetectors, andimproved digital imaging systems (Fig. 3). Thenew instruments are much improved ergonom-ically so that alignment is easier to achieve (if atall necessary), the choice of different filter com-binations, which is now controlled by software,motorized filter wheels and electronic filters, ismuch easier to achieve, and multiple fluoro-chromes can be imaged either simultaneously byframe or sequentially on a line-by-line basis (1).Furthermore, it is easier to manipulate the imagesusing improved, more reliable software that hasbeen developed over the ten or so years of experi-ence with the LSCM, and using faster computerswith more hard disk space and random accessmemory (RAM).
4. Confocal Imaging Modes4.1. Single Optical Sections
The optical section is the basic image unit ofthe confocal microscope. Data are collected fromfixed and stained samples in single-, double-,triple-, or multiple-wavelength modes (Fig. 4).

Laser Scanning Confocal Microscopy 133
MOLECULAR BIOTECHNOLOGY Volume 16, 2000
The resulting images are in register with eachother and portray an accurate representation ofthe specimen, as long as an objective lens that iscorrected for chromatic aberration is used. Regis-tration can usually be relatively easily restored us-ing digital methods. The time of image collectionwill also depend on the size of the image and thespeed of the computer; for example, a typical 8-bit image of 768 by 512 pixels in size will occupyapprox 0.3 MB. Using most LSCMs it takesapprox 1 s to collect a single optical section,although several such sections are usually digi-tally averaged in order to improve the signal-to-noise ratio (6).
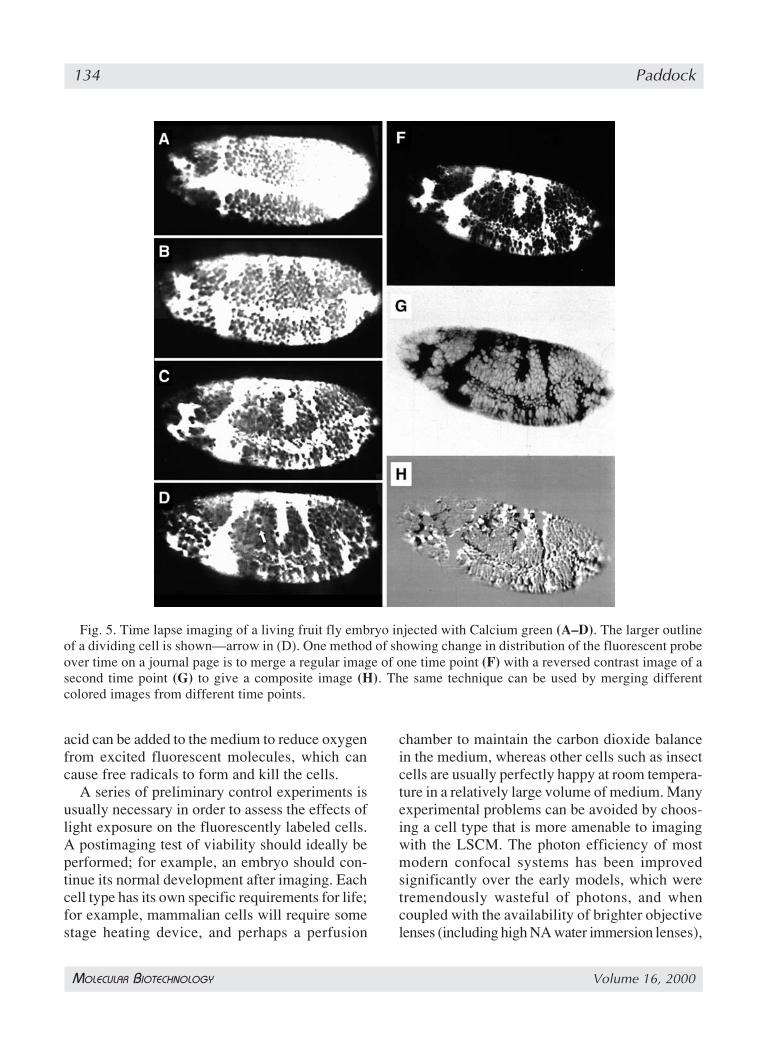
4.2. Time-Lapse and Live Cell ImagingTime-lapse imaging refers to the collection of
single optical sections at preset points in time, andit uses the improved resolution of the LSCM forstudies of the dynamics of living cells (Fig. 5). Im-aging living tissues is perhaps an order of magni-tude more difficult than imaging fixed ones usingthe LSCM (Table 1). For successful live-cell im-aging extreme care must be taken to maintain thecells in a healthy state on the stage of the micro-scope throughout the imaging process (11), and touse the minimum laser exposure possible becausephotodamage from the laser beam can accumulateover multiple scans. Antioxidants such as ascorbic
Fig. 4. Single optical sections collected simultaneously using a single krypton argon laser at three differentexcitation wavelengths—488 nm, 568 nm, and 647 nm—of a fruit fly third instar wing imaginal discimmunofluorescently labeled with antibody probes for three genes involved with patterning the developing wing;(A) vestigial (fluorescein 496 nm); (B) apterous (lissamine rhodamine 572 nm) and (C) CiD (cyanine 5 649 nm);with a grey-scale image of the three images merged (D).
134 Paddock
MOLECULAR BIOTECHNOLOGY Volume 16, 2000
acid can be added to the medium to reduce oxygenfrom excited fluorescent molecules, which cancause free radicals to form and kill the cells.
A series of preliminary control experiments isusually necessary in order to assess the effects oflight exposure on the fluorescently labeled cells.A postimaging test of viability should ideally beperformed; for example, an embryo should con-tinue its normal development after imaging. Eachcell type has its own specific requirements for life;for example, mammalian cells will require somestage heating device, and perhaps a perfusion
chamber to maintain the carbon dioxide balancein the medium, whereas other cells such as insectcells are usually perfectly happy at room tempera-ture in a relatively large volume of medium. Manyexperimental problems can be avoided by choos-ing a cell type that is more amenable to imagingwith the LSCM. The photon efficiency of mostmodern confocal systems has been improvedsignificantly over the early models, which weretremendously wasteful of photons, and whencoupled with the availability of brighter objectivelenses (including high NA water immersion lenses),
Fig. 5. Time lapse imaging of a living fruit fly embryo injected with Calcium green (A–D). The larger outlineof a dividing cell is shown—arrow in (D). One method of showing change in distribution of the fluorescent probeover time on a journal page is to merge a regular image of one time point (F) with a reversed contrast image of asecond time point (G) to give a composite image (H). The same technique can be used by merging differentcolored images from different time points.

Laser Scanning Confocal Microscopy 135
MOLECULAR BIOTECHNOLOGY Volume 16, 2000
and brighter and less phototoxic dyes, live-cellconfocal analysis has become much more of apractical option.
The bottom line is to use the least amount oflaser power possible for imaging and to collectthe images quickly in order to reduce the time ofexposure of the specimen to laser light. The pin-hole may be opened wider than for fixed samplesto speed up the imaging process and to collect thesignal from all of the available photons for laterimage processing, for example, deconvolutionmay be used to improve the images.
Many physiological events take place fasterthan the image-acquisition speed of most LSCMs,which is typically on the order of a single frameper second. Faster scanning LSCMs that use anacoustooptical device and a slit to scan the speci-men rather than the slower galvanometer-drivenpoint scanning systems are marketed with physi-ological imaging in mind. These designs have theadvantage of good spatial resolution coupled withgood temporal resolution, i.e., full screen resolu-tion 30 frames per s (near video rate). Using thepoint scanning LSCMs good temporal resolutionis achieved by scanning a much-reduced area.Here frames at full spatial resolution are collectedmore infrequently (12). The disk scanning sys-
tems can also be used for imaging fast physiologi-cal events. The multiple-photon approach is nowthe method of choice for imaging living cells,however (4).
4.3. Z-Series and Three-Dimensional Imaging
A Z-series is a sequence of optical sectionscollected at different levels from a specimen(Fig. 6). Z-series are collected by correlating themovement of the fine focus of the microscopewith image collection usually using a computer-controlled stepping motor to move the stage ofthe microscope by preset distances (Fig. 3). Thisis relatively easily accomplished using a macroprogram that collects an image, moves the micro-scope stage (focus) by a predetermined distance,collects a second image, moves the microscopestage (focus), and carries on in this way until sev-eral images through the region of interest havebeen collected. Often two or three images areextracted from such a Z-series and digitally pro-jected to highlight some specific cells. It is alsorelatively easy to display a Z-series as a montageof images (Fig. 6). These programs are standardfeatures of most of the commercially availableimaging systems.
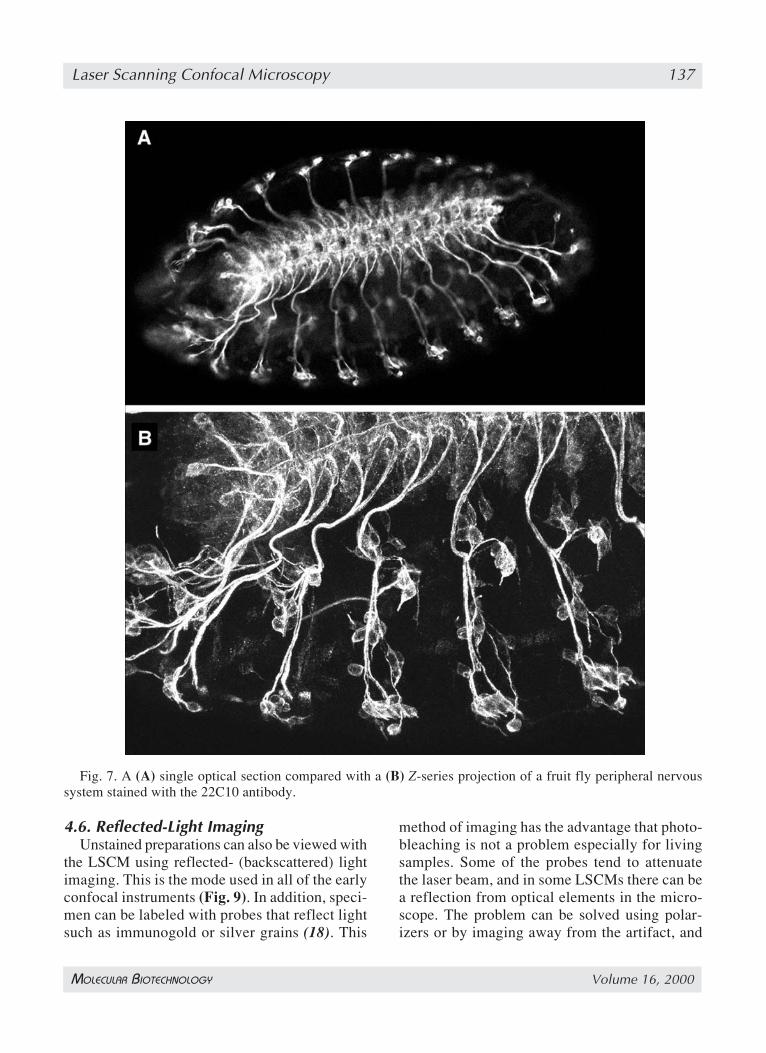
Z-series are ideal for further processing into athree-dimensional (3D) representation of thespecimen using volume visualization techniques(13). This approach is now used to elucidate therelationships between the 3D structure and func-tion of tissues, because it can be conceptuallydifficult to visualize complex interconnectedstructures from a series of 200 or more opticalsections taken through a structure with the LSCM.Care must be taken to collect the images at thecorrect Z-step of the motor in order to reflect theactual depth of the specimen in the image. Sincethe Z-series produced with the LSCM are in per-fect register (assuming the specimen itself doesnot move during the period of image acquisition)and are in a digital form, they can relatively eas-ily be processed into a 3D representation of thespecimen (Fig. 7).
There is sometimes confusion about what ismeant by optical section thickness. This usuallyrefers to the thickness of the section of the sample
Table 1Different Considerations for Imaging Fixed
and Living Cells with the LSCM
Fixed Cells Living Cells
Limits of illumination Fading of Phototoxicityfluorophore and fading
of dyeAntifade reagent Phenylenediamine, NO!
etc.Mountant Glycerol (n = 1.51) Water (n = 1.33)Highest NA lens 1.4 1.2Time per image Unlimited Limited by
speed ofphenomenon;lightsensitivity ofspecimen
Signal averaging Yes NoResolution Wave optics Photon statistics

136 Paddock
MOLECULAR BIOTECHNOLOGY Volume 16, 2000
collected with the microscope and not to the stepsizes taken by the stepper motor, which is set up bythe operator. In some cases these can be the samehowever, and may be a source of the confusion.
The series of optical sections from a time-lapserun can also be processed into a 3D representa-tion of the data set so that time is the Z-axis. Thisapproach is useful as a method for visualizingphysiological changes during development. Forexample, calcium dynamics have been character-ized in sea urchin embryos (14). A simple methodfor displaying 3D information is by color codingoptical sections at different depths. This can beachieved by assigning a color (usually red, green,or blue) to sequential optical sections collected atvarious depths within the specimen. The coloredimages from the Z-series are then merged andcolorized using an image manipulation programsuch as Adobe Photoshop (15).
4.4. Four-Dimensional ImagingTime-lapse sequences of Z-series can also be
collected from living preparations using the LSCMto produce four-dimensional (4D) data sets, i.e.,three spatial dimensions X, Y, and Z with time asthe fourth dimension. Such series can be viewedusing a 4D-viewer program, stereo pairs of eachtime point can be constructed and viewed as amovie or a 3D reconstruction at each time point issubsequently processed (16,17).
4.5. X-Z ImagingAn X-Z section is a profile of the specimen, and
it can either be produced directly from the speci-men using the LSCM by scanning a single line atdifferent Z depths under the control of the steppermotor (Fig. 8) or indirectly in a 3D reconstructionprogram by extracting the X-Z profile from aZ-series of optical sections (13).
Fig. 6. A Z-series of optical sections collected from a fruit fly embryo labeled with the antibody designated22C10, which stains the peripheral nervous system.
Laser Scanning Confocal Microscopy 137
MOLECULAR BIOTECHNOLOGY Volume 16, 2000
4.6. Reflected-Light ImagingUnstained preparations can also be viewed with
the LSCM using reflected- (backscattered) lightimaging. This is the mode used in all of the earlyconfocal instruments (Fig. 9). In addition, speci-men can be labeled with probes that reflect lightsuch as immunogold or silver grains (18). This
method of imaging has the advantage that photo-bleaching is not a problem especially for livingsamples. Some of the probes tend to attenuatethe laser beam, and in some LSCMs there can bea reflection from optical elements in the micro-scope. The problem can be solved using polar-izers or by imaging away from the artifact, and
Fig. 7. A (A) single optical section compared with a (B) Z-series projection of a fruit fly peripheral nervoussystem stained with the 22C10 antibody.

138 Paddock
MOLECULAR BIOTECHNOLOGY Volume 16, 2000
off the optical axis. The reflection artifact is nota problem using the slit- or multiple-beam scan-ning systems.
4.7. Transmitted Light ImagingAny form of light-microscope image, includ-
ing phase contrast, DIC, polarized light or darkfield, can be collected using a transmitted lightdetector (Fig. 8). This is a device that collects thelight passing through the specimen and the signalfrom it is transferred to one of the PMTs in thescan head via a fiber optic. Since confocal epi-fluorescence images and transmitted-light imagesare collected simultaneously using the same exci-tation beam, image registration is preserved, sothat the precise localization of labeled cells withinthe tissues is preserved when the images aremerged using digital methods.
It is often informative to collect a transmitted,nonconfocal image of a specimen and to merge sucha transmitted light image with one or more confocalfluorescence images of labeled cells. For example,
the spatial and temporal components of the migra-tion of labeled cells within an unlabeled populationof cells can be mapped over hours or even years (19).
A real-color transmitted-light detector has beenintroduced into those systems that scan threechannels simultaneously. The detector collectsthe transmitted signal in the red, the green, andthe blue channels through red, green, and blue fil-ters, respectively, and builds the real-color imagein a similar way to some color digital cameras (6).This device is useful to pathologists who are usedto viewing real colors in bright-field mode of theirstained preparations, and also to combine themwith confocal images taken of the same region ofthe specimen in fluorescence mode.
4.8. Correlative MicroscopyThe aim of correlative or integrated microscopy
is to collect information from the same region of aspecimen using more than one microscopic tech-nique. Confocal microscopy can be used in tandem
Fig. 8. X-Z imaging; the laser is scanned across a single line at different Z depths—black line in (A) and an X-Z image of all the scanned lines was constructed by the confocal imaging system (B). Note that the butterfly wingepithelium is made up of two epithelial layers, and note that the fluorescence intensity drops off deeper into thespecimen.

Laser Scanning Confocal Microscopy 139
MOLECULAR BIOTECHNOLOGY Volume 16, 2000
with transmission electron microscopy (TEM). Forexample, the distribution of microtubules withinfixed tissues has been imaged using the LSCM, andthe same region was imaged in the TEM usingeosin as a fluorescence marker in the LSCM and asan electron-dense marker in the electron micro-scope (20). Reflected light imaging and the TEMhave also been used in correlative microscopy toimage cell substratum contacts (21).
5. Specimen Preparation and ImagingMore details of specimen preparation and the
confocal methods used to image them are avail-able elsewhere (22–25). Most of the protocols forconfocal imaging are based upon those developedover many years for preparing samples for the
conventional wide field microscope. A good start-ing point for the development of a new protocolfor the confocal microscope therefore is with aprotocol for preparing the samples for conven-tional light microscopy, and to later modify it tothe confocal instrument if necessary. Most of themethods for preparing specimens for the conven-tional light microscope were developed to reducethe amount of out-of-focus fluorescence. The con-focal system undersamples the fluorescence in athick sample as compared with a conventionalepifluorescence light microscope, with the resultthat samples may require increased staining timesor concentrations for confocal analysis, and mayappear to be overstained in the light microscope.Moreover, whole mounts may be imaged success-
Fig. 9. Reflected-light and transmission imaging: Interference reflection microscopy in the LSCM demon-strates cell substratum contacts in black around the cell periphery (A); confocal systems are used extensively inthe materials sciences - here the surface of an audio CD is shown (B); and (C) through (E) is an in situ hybridiza-tion of HIV infected blood cells. The silver grains can be clearly seen in the reflected light confocal image (C) andin the transmitted light dark-field image (D) and bright-field image (E). Note the false positive from the dustparticle—arrow in (D).
140 Paddock
MOLECULAR BIOTECHNOLOGY Volume 16, 2000
fully in the LSCM where it was only practical toview sections using a conventional wide fieldlight microscope.
The illumination in a typical laser scanningconfocal system is extremely bright, althoughmillions of points are scanned per second. Forexample, a typical scan speed is one point per 1.6µs so that the average illumination at any onepoint is relatively moderate, and generally lessthan a conventional epifluorescence light micro-scope. Many protocols include an antibleachingagent that protects the fluorophore from thebleaching effects of the laser beam. It is advisableto use the lowest laser power that is practical forimaging in order to protect the fluorochrome, andit may be possible to omit the antibleaching agentswhen using many of the more modern instruments.
The major application of the confocal micro-scope is for improved imaging of thicker spe-cimens although the success of the approachdepends on the specific properties of the speci-men. Some simple ergonomic principles apply:for example, the specimen must physically fit onthe stage of the microscope and the area of inter-est should be within the working distance of thelens. For example, a high-resolution lens such asa 60× NA 1.4 has a working distance of 170 µm,whereas a 20× NA 0.75 has a working distance of660 µm. This means that resolution may have tobe compromised in order to reach the region ofinterest and to prevent squashing the specimenand risking damage to the lens.
It is often necessary to take steps to preservethe 3D structure of the specimen for confocalanalysis using some form of spacer between theslide and the coverslip, for example, a piece ofcoverslip or plastic fishing line. When livingspecimens are the subject of study, it is usuallynecessary to mount them in some form of cham-ber that will provide all of the essentials for lifeon the stage of the microscope, and will also allowaccess to the specimen by the objective lens forimaging without deforming the specimen.
Properties of the specimen such as opacity andturbidity can influence the depth that the laserbeam may penetrate into it. For example, unfixedand unstained corneal epithelium of the eye is
relatively transparent and therefore the laser beamwill penetrate further into it (approx 200 µm) thaninto unfixed skin (approx 10 µm), which is rela-tively opaque and therefore scatters more light. Thetissue can act as a neutral density filter and attenu-ate the laser beam. Many fixation protocols incor-porate some form of clearing agent, which willincrease the transparency of the specimen.
If problems do occur with depth penetration ofthe laser light into the specimen, then thick sectionscan be cut using a microtome; usually fixed speci-mens but also slices of living brain have been cutusing a vibratome, and imaged successfully. Thespecimen can also be removed from the slide,inverted, and remounted, although this is oftenmessy, and usually not too successful. Dyes that areexcited at longer wavelengths, for example, cya-nine 5, can be used to collect images from a littledeeper within the specimen than those dyes excitedat shorter wavelengths (26). Here the resolutionis slightly reduced in comparison to that attainedwith images collected at shorter wavelengths.Multiple photon imaging allows images to be col-lected from more deeply within specimens (4).
5.1. The Objective LensThe choice of objective lens for confocal inves-
tigation of a specimen is extremely important(27). This is because the numerical aperture (NA)of the lens, which is a measure of its light collect-ing ability, is related to optical section thicknessand to the final resolution of the image. Basically,the higher the NA, the thinner the optical section.
The optical section thickness for the 60× (NA1.4) objective with the pinhole set at 1 mm (closed)is on the order of 0.4 µm, and for a 16× (NA 0.5)objective, again with the pinhole at 1 mm, theoptical section thickness is around 1.8 mm. Open-ing the pinhole (or selecting a pinhole of increaseddiameter) will further increase the optical sectionthickness (Table 2). The vertical resolution isnever as good as lateral resolution (Fig. 8). Forexample, for a 60× NA 1.4 objective lens the hori-zontal resolution is around 0.2 µm and the verti-cal resolution is around 0.5 µm. Additional factorsinclude chromatic aberration especially for imag-ing multilabel specimens at different wavelengths

Laser Scanning Confocal Microscopy 141
MOLECULAR BIOTECHNOLOGY Volume 16, 2000
and flatness of field are of importance whenchoosing an objective lens for confocal imaging.
The lenses with the highest numerical aperturesare generally the highest magnifications (and themost expensive), so that a compromise is oftenstruck between the area of the specimen to bescanned and the maximum achievable resolutionfor the area (Table 3). For example, when imag-ing Drosophila embryos and imaginal discs a 4×lens (NA 0.2) is used to locate the specimen onthe slide, a 16× (NA 0.5) lens for imaging wholeembryos, and a 40× (NA 1.2) or 60× (NA 1.4)lens for resolving individual cell nuclei withinembryos and imaginal discs. In contrast for but-terfly work where the structures of interest aremuch larger, the 4× lens is extremely useful forimaging whole wing imaginal discs in a singleimage, and for cellular resolution a 40× or a 60×objective lens is used (Fig. 10). Some micro-scopes have the facility to view large fields at highresolution using an automated X-Y stage that canmove around the specimen collecting images intoa montage. Such montages can also be builtmanually and pasted together digitally.
A useful feature of most LSCMs is the abilityto zoom an image with no loss of resolution usingthe same objective lens. This is achieved simplyby decreasing the area of the specimen scannedby the laser by controlling the scanning mirrorsand by placing the information from the scan intothe same area of frame store or computer memory.In this way, several magnifications are impartedonto a single lens without moving the specimen
(Fig. 10). However, when possible, a higher NAlens should be used for the best resolution.
Many instruments have an adjustable pinhole.Opening the pinhole gives a thicker optical sec-tion and reduced resolution but it is often neces-sary to give more detail within the specimen or toallow more light to the photodetector. As the pin-hole is closed down the section thickness andbrightness decreases, and resolution increases upto a certain pinhole diameter, when resolutiondoes not increase but brightness continues todecrease. This point is different for each objec-tive lens (28).
5.2. Probes For Confocal ImagingThe synthesis of novel fluorescent probes for
improved immunofluorescence localization con-tinues to influence the development of confocalinstrumentation (29). Fluorochromes have beenintroduced over the years that have their excita-tion and emission spectra more closely matchedto the wavelengths delivered by the lasers sup-plied with most commercial LSCMs (Table 4).Improved probes that can be conjugated to anti-bodies continue to appear. For example, the cya-nine dyes are alternatives to more establisheddyes; cyanine 3 is a brighter alternative to rhod-amine and cyanine 5 is useful in triple-label strat-
Table 2Optical Section Thickness (in µm)
for Different Objective Lenses UsingThe BioRad MRC600 Laser Scanning
Confocal Microscope
Objective Pinhole
Closed OpenMagnification NA (1 mm) (7 mm)
60× 1.40 0.4 1.940× 1.30 0.6 3.325× 0.80 1.4 7.820× 0.75 1.8 10.0
4× 0.20 20.0 100.0
Table 3Important Properties of Microscope Objectives
for Confocal Imaginga
Property Objective 1 Objective 2
Design plan-apochromat CF-fluor DLMagnification 60 20Numerical aperture 1.4 0.75Coverslip thickness 170 µm 170 µmWorking distance 170 µm 660 µmTube length 160 mm 160 mmMedium oil dryContrast technique None or DIC Ph3Color correction Best GoodFlatness of field Best FairUV transmission None Excellent
aAn aid for choosing the correct lens for imaging. Objec-tive 1 would be more suited for high-resolution imaging offixed cells, whereas Objective 2 would be better for imaging aliving preparation.

142 Paddock
MOLECULAR BIOTECHNOLOGY Volume 16, 2000
egies. More recently, the brighter Alexa dyes havebeen introduced by Molecular Probes (29).
Fluorescence in situ hybridization (FISH) isan important approach for imaging the distri-bution of fluorescently labeled DNA and RNAsequences in cells. Improved protocols have been
developed for imaging specimens prepared byFISH, for example, the tyramide amplificationsystem (30). In addition, brighter probes are nowavailable as counterstains for imaging the totalDNA in nuclei and isolated chromosomes usingthe LSCM. For example, the dimeric nucleic acid
Fig. 10. Different objective lenses and zooming using the same lens. The 4× lens (A) is useful for viewing theentire butterfly fifth instar wing imaginal disc although the 16× lens (B) gives more nuclear detail of the Distal-less stain. The 40× lens gives even more exquisite nuclear detail (C), and zoomed by progressive increments (D,E, and F). This is achieved by scanning smaller regions of the same area of the specimen, and in this way, severalmagnifications are imparted onto the same objective lens.

Laser Scanning Confocal Microscopy 143
MOLECULAR BIOTECHNOLOGY Volume 16, 2000
dyes TOTO-1 and YOYO-1, dyes such as Hoechst33342 and DAPI, have excitation spectra (346 nmand 359 nm) that are too short for most of thelasers and mirrors that are supplied with the com-mercially available LSCMs, although these dyescan be imaged using a HeNe laser/UV system (31)or multiple photon microscopy. The latter tech-nique does not require specialized UV mirrors andlenses, because red light from a pulsed Ti-Sap-phire laser is used for illumination (4).
Many fluorescent probes are now available thatstain specific cellular organelles and structures inrelatively simple protocols (24). This includes aplethora of dyes that stain nuclei (Fig. 11), mito-chondria, the Golgi, and the endoplasmic reticu-lum, and also dyes such as the fluorescentlylabeled phalloidins that label polymerized actinin cells (29). Phalloidin is used to image cell out-lines in developing tissues, because the periph-eral actin meshwork appears as bright fluorescentrings in the optical section (Fig. 11). These dyesare extremely useful in multiple-labeling strate-
gies in order to locate antigens of interest to spe-cific compartments in the cell (24). For example,using a combination of phalloidin and a nucleardye with the antigen of interest in a triple-label-ing scheme, the labeled protein can be mapped toa specific cellular compartment. In addition, anti-bodies to proteins of known distribution or func-tion in cells, for example, antitubulin, is a usefultool for mapping in multilabel experiments.
When imaging living cells, it is most importantto be aware of the effects of adding fluorochromesto the system. Such probes can be toxic to livingcells especially when they are excited with thelaser. Adding ascorbic acid to the medium canreduce such effects. The region of the cell labeledcan also affect its viability; for example, nuclearstains tend to have a more deleterious effect thanvital staining in the cytoplasm. One trick is to usea fluorescent dye, which does not enter the cellsat all, but rather fluoresces in the medium sur-rounding the cells. Here an outline or negativeimage of the sample is produced. Probes thatdistinguish between living and dead cells arealso available. Most of these assays rely on thefact that the membranes of dead cells are perme-able to many dyes that cannot cross them in theliving state. Such probes include acridine or-ange, and various “cell-death” kits are availablecommercially (29).
Dyes are available that change their fluores-cence characteristics in the presence of ions suchas calcium. These dyes can be imaged using vis-ible wavelengths used in the LSCM, for exam-ple, fluo-3 or rhod-2 (14,23,24). New reporterprobes for imaging gene expression have beenintroduced. For example, the jellyfish greenfluorescent protein (GFP) allows gene expres-sion and protein localization to be observed invivo. For example, GFP has been used to moni-tor gene expression in many different cell typesincluding living Drosophila oocytes, in mamma-lian cells, and in plants using the 488 nm line ofthe LSCM for excitation (32,33). Moreover,spectral mutants of GFP are now available formultilabel experiments and are also useful foravoiding problems with autofluorescence of liv-ing tissues.
Table 4Peak Excitation and Emission Wavelengths
of Some Commonly Used Fluorophoresand Nuclear Counterstains
Excitation EmissionDye Max (nm) Max (nm)
Coumarin 350 440GFP 470 508FITC 496 518Bodipy 503 511CY3 554 568Tetramethylrhodamine 554 576Lissamine rhodamine 572 590CY3.5 581 588Texas red 592 610CY5 652 672CY5.5 682 703CY7 755 778
Nuclear DyesHoechst 33342 346 460DAPI 359 461Acridine orange 502 526Propidium iodide 536 617ToPro 642 661

144 Paddock
MOLECULAR BIOTECHNOLOGY Volume 16, 2000
5.3. AutofluorescenceAutofluorescence can be a major source of
increased background when imaging some tis-sues. Tissue autofluorescence occurs naturally inmost cell types, and especially in yeast and inplant cells, for example, chlorophyll fluoresces inthe red. Some reagents, especially glutaraldehydefixative, are sources of autofluorescence, and itcan be reduced using borohydride treatment.Autofluorescence can be avoided by using awavelength for excitation that is out of the rangeof natural autofluorescence. For example, cyanine5 excitation is often out of the range of theautofluorescence of many tissues.
An idea of the amount of autofluorescence canbe gained by viewing an unstained specimen atdifferent wavelengths, and taking note of the PMTsettings of gain and black level together with thelaser power (Fig. 12). A relatively simple solu-tion is to collect the experimental images at set-tings above those recorded for autofluorescence.Autofluorescence may also be bleached out usinga quick flash at high laser power or flooding thespecimen with the mercury lamp to bleach it outwhere the fluorescence of labeled structures isprotected by antifade reagents. A more sophisti-cated method of dealing with autofluorescence is
to use time-resolved spectroscopy. Autofluores-cence can also be removed digitally by image sub-traction. Although it is more often a problem,tissue autofluorescence can be utilized as a lowlevel background signal for imaging overall cellmorphology in multiple-labeling schemes (Fig. 4).
5.4. Collecting the ImagesThe novice user can gain experience of confocal
imaging from several sources. The manual pro-vided with the confocal imaging system will usu-ally include a series of simple exercises necessaryfor getting started. The person responsible for run-ning the instrument will usually be only too happyto provide a short orientation session, and in mostmultiuser facilities, the manager will usuallyrequire a short training session and demonstrationof a certain competence level before solo imagingis allowed. The novice should pay particular atten-tion to the house rules of the facility. Other usefulsources of information are the training courses runby the confocal companies, workshops on lightmicroscopy, and various publications (24).
It is essential to be familiar with the basic opera-tion of the imaging system before working with ex-perimental slides. It is usually recommended, for thenovice at least, to start imaging with a relatively easy
Fig. 11. Examples of dyes used for labeling cellular features. Cell outlines can be labeled with fluorescentlylabeled phalloidin (A) or nuclei using ToPro (B). Both samples are whole mounts of butterfly (Precis coenia)pupal wing imaginal discs.

Laser Scanning Confocal Microscopy 145
MOLECULAR BIOTECHNOLOGY Volume 16, 2000
specimen rather than with a more difficult experi-mental one. Some good test samples include papersoaked in one or more fluorescent dyes or a prepara-tion of fluorescent beads, which are both bright, andrelatively easy specimens to image with the confo-cal microscope. A particular favorite of mine is aslide of mixed pollen grains that autofluoresce atmany different wavelengths (Fig. 12). Such slidesare available from biological suppliers such as Caro-lina Biological (www.Carolina.com) or can be eas-ily prepared from pollen collected from gardenplants. These specimens tend to have some interest-ing surface features and hold up well in the laserbeam. A relatively reliable test specimen for livingstudies can be prepared from onion epithelium orthe water plant Elodea sp., using autofluorescenceor staining with DiOC6.
The aim should always be to gain the best pos-sible performance from the instrument, and thisstarts with optimal alignment, especially whenimaging with older model confocal instruments.The alignment routine depends on the specificinstrument, and is usually best performed by theperson responsible for the instrument. Alignmentshould definitely not be attempted before trainingand permission from the microscope owner has
been granted. This is because the beam can be lostcompletely, and in some instruments it mayrequire a service visit to rectify the situation.
The basic practices of light microscopic tech-nique should be followed at all times (6). Forexample, all glass surfaces should be clean, be-cause dirt and grease on coverslips and objectivelenses is a major cause of poor images. Careshould be taken to mount the specimen so that itis within the working distance of the objectivelens. The refractive index between the objectivelens and the specimen should be matched. Forexample, a coverslip of correct thickness for theobjective lens should be used, especially forhigher-power lenses, which will require a #1 or#1.5 coverslip, and not a #2 coverslip. The cover-slip should be sealed to the slide in some way,and mounted flat—use nail polish for fixed speci-mens making sure that it’s dry before imaging,and some form of nontoxic sealing agent for livespecimens, for example, a Vaseline, beeswax, andlanolin mixture works well although for viewingliving cells some form of specimen chamber ismuch preferred to a coverslip/slide arrangement.Taking great care with the simple basics of clean-liness at this stage can save a lot of time and effort.
Fig. 12. Example of tissue autofluorescence in pollen grains. Note that different types of pollen fluoresce atdifferent excitation wavelengths and some at different intensities in different channels—these images were col-lected simultaneously at the same settings of gain, black level and pinhole diameter.
146 Paddock
MOLECULAR BIOTECHNOLOGY Volume 16, 2000
One of the secrets of successful confocal imag-ing is in mastering the interplay between lens NA,pinhole size, and image brightness using the low-est laser power possible to achieve the best image.The new user should play with these parametersusing the test specimen and several differentobjective lenses of different magnifications andnumerical apertures in order to get a feel for thecapabilities of the instrument before progressing tothe experimental specimens. Try zooming usingthe zoom function and compare these images withthose obtained using a different objective lens.
The specific imaging parameters of the micro-scope should be set up away from the region ofinterest to avoid photobleaching of valuableregions of the specimen. This usually involvessetting the gain and the black levels of the pho-tomultiplier detectors together with the pinholesize in order to achieve a balance between accept-able resolution and adequate contrast using thelowest laser power possible to avoid excessivephotobleaching. Many instruments have colortables that aid in setting the correct dynamic rangewithin the image. Such look-up tables are designedso that the blackest pixels, around zero, arepseudocolored green and the brightest pixels,around 255 in an 8-bit system, are colored red.The gain and black levels (and the pinhole) areadjusted so that there are a few red and green pix-els in the image thus ensuring the full dynamicrange from 0 to 255 is utilized. These adjustmentscan also be made by eye. It is not always practicalto collect an image at full dynamic range becausefull laser power cannot be used or the specimenhas uneven fluorescence so that a bright regionmay obscure a dimmer region of interest in theframe.
As the specimen is scanned, an image-averag-ing routine is usually employed that filters out ran-dom noise from the photomultiplier and enhancesthe constant features from labeled structures in theimage. An image equalization routine can be applieddirectly after collection of the images so that theimage is scaled to the full dynamic range. Thisroutine should not be applied if measurements offluorescence intensity are to be made unless acontrol image is included in the same frame as the
rest of the experimental images before applyingthe equalization routine. If space on the hard diskallows, it is often a good strategy to save rawunprocessed images alongside any processed ones.
The image is usually saved to the hard disk ofthe computer and later backed up onto a mass-storage device, for example, onto CDs. In generalit is advisable to collect as many images as pos-sible during an imaging session, and, if necessary,to cull out the bad ones in a later review session.It is quite surprising how a seemingly unneces-sary image at first sight suddenly becomes valuedat a later date after further review—especiallywith one’s peers! It is much harder to prepareanother specimen, and often harder still to repro-duce the exact parameters of previously preparedspecimens, and hard disk space should be moreplentiful.
A strategy for labeling image files should bemapped out before imaging, and during imagingmany notes should be taken or placed on theimage file along with the image if this facility isavailable. Users should conduct a test to ensurethat the information is accessible after imagingand remember that it can be lost when the imagesare subsequently transferred to image manipu-lation programs such as NIH Image or AdobePhotoshop on other computers. It is hard toreplace a well-ordered note book preferablyusing a table of image file names with facilityfor comments and details of the objective lensand the zoom factor for calculating scale bars ata later date. Many modern systems incorporatean image database that will keep track of filenames, location of the files and include a thumb-nail of the images (34).
5.5. TroubleshootingA protocol will sometimes inexplicably cease
to work, and there is often an initial reflex toblame the instrument rather than the sample. Agood test is to view the sample with a conven-tional epifluorescence microscope, and if somefluorescence is visible by eye, then the signalshould be very bright on the confocal system. Ifthe sample is visible by eye but not detected withthe LSCM, it might be prudent to run through

Laser Scanning Confocal Microscopy 147
MOLECULAR BIOTECHNOLOGY Volume 16, 2000
some checks of the confocal system. It is advis-able to use a known test specimen rather than theexperimental one for testing the system. A digitalfile of an image of the test specimen should beaccessible to all users together with all of theparameters of its collection including laser power,gain, black level, pinhole diameter, zoom, andobjective lens used.
It is advisable to seek help from an expert whomay have prior experience of the problem. If allelse fails, do not panic, each of the confocal com-panies should have a good help line whose num-ber will usually be posted close to the microscope.The golden rule is, if you are not sure of some-thing, ask or at least step back from the problembefore attempting to fix something.
Problems with the protocols themselves areusually caused by degradation of reagents, and aseries of diagnostic tests should be performed. Itis usually best to make up many of the reagentsfresh yourself or to your recipe, or at least, “bor-row” them from a trusted lab mate! Antibodiesshould be aliquoted in small batches from the fro-zen stock, and stored in the refrigerator. Theyshould only be re-used if absolutely necessary,although this is sometimes unavoidable withexpensive or rare reagents, and often does notpresent a problem.
Bleed through can occur from one channelinto another in multiply labeled specimens.This can result from properties of the specimenitself or from problems with the instrument. Thecauses and remedies of bleed through have beenreviewed in much detail elsewhere (35). A goodtest of the instrument is to view a test sample withknown bleed through properties using both themultiple-labeling settings and the single-label set-tings. It is advisable to collect an image of the testspecimen and record the settings of laser power,gain, black level, and pin hole diameter so thatwhen problems do occur, one can return to thesesettings with a test sample and compare theimages collected with those of the stored testimages collected when the instrument was oper-ating in an optimal way.
Additional tests include a visual inspection ofthe laser color and the anode voltage of the laser,
for example, if the beam from a krypton/argonlaser appears blue and not white when scanningon a multiple-label setting, then this suggests thatthe red line is weak. If this is the case, then theanode voltage will usually be high, and can usu-ally be reduced to an acceptable level by adjust-ing the mirrors on the laser (often called “walkingthe beam”—this should usually be left to the per-son responsible for the instrument). If it is not pos-sible to reduce the voltage, a new or refurbishedlaser may be required.
Sometimes the antibody probes may havedegraded or need to be cleaned (36). Older speci-mens may have increased background fluo-rescence and bleed through caused by thefluorochrome coming off the secondary antibodyand diffusing into the tissue. Always view freshlyprepared specimens if at all possible. Changingthe concentration and/or the distribution of thefluorochromes often helps. For example, if fluo-rescein bleeds into the rhodamine channel, thenswitch the fluorochromes so that rhodamine is onthe stronger channel because the fluorescein exci-tation spectrum has a tail that is excited in therhodamine wavelengths. The concentration of thesecondaries can be reduced in subsequent experi-ments. The use of an acoustooptical tunable filterfor the excitation beams can help to fine tune thestrength of each channel independently (37).
5.6. Image Processing and PublicationConfocal images are collected as digital com-
puter files, and they can usually be manipulatedusing the proprietary software provided with theconfocal imaging system or using secondary soft-ware, for example, Adobe Photoshop (38). Oneof the most dramatically improved features of theLSCM has been in the display and analysis ofconfocal images. This part of the process isextremely important because it is fine to achieveimproved resolution using the LSCM but thisimprovement is of little value if it cannot be dis-played and reproduced in hard copy format.
Even 5 yr ago most laboratories used dark-rooms and chemicals for their final hard copy.Color images were even harder to reproducebecause an independent printer who had little idea

148 Paddock
MOLECULAR BIOTECHNOLOGY Volume 16, 2000
of the correct color balance usually printed them.For hard copies, images are now exported to aslide maker, a color laser printer, or a dye subli-mation printer for publication quality prints. Pho-tographs were taken directly from the screen ofthe video monitor. Moreover, movie sequencescan be published on the World Wide Web.
The quality of published images has alsoimproved drastically as most of the journals are ableto accept digital images for publication. This meansthat the resolution displayed by the computer of theconfocal imaging system is more faithfully repro-duced in the final published article. Many journalspublish their articles in CD ROM format or they areavailable on the World Wide Web. This means thatthe images viewed by the reader should be exactlythe same as those collected using the confocalmicroscope. These technological advances are espe-cially useful for color images where the intendedresolution and color balance can be accurately repro-duced by the journals, and, theoretically, at a muchlower cost to the author.
6. ConclusionsThe LSCM has found a niche in many biomed-
ical imaging laboratories, because it producesimproved images of all specimens prepared for fluo-rescence microscopy including those labeled byimmunofluorescence and FISH (24). The confocalsystems currently available, while they are stillbased on Minsky’s long-expired patent and a con-ventional wide-field epifluorescence microscope,have been developed into sophisticated digital imag-ing systems that are relatively easy to operate espe-cially if the user has some experience using anepifluorescence microscope and a microcomputer.
Today’s instruments are largely computer-controlled, and they have greatly facilitatedthe collection of multidimensional images fromfluorescently labeled specimens. These dimen-sions include the X and the Y dimension of theoptical section, the Z dimension of a throughfocus series of optical sections (Z-series), thedimension of wavelength so that multiple fluoro-chromes are imaged either simultaneously orsequentially in the same region of the specimen(38), the dimension of time for imaging living tis-
sues by collecting optical sections of the sameregion or Z-series (4D imaging) in a time-lapsemode (39), and the dimension of position in thespecimen where several locations are imagedsequentially using a motorized stage that can becontrolled by the computer.
The technology continues to improve at a rapidrate as evidenced by the introduction of practicalmultiple photon imaging, which gives improved via-bility of living cells, deeper penetration into intactspecimens, and the possibility of multiple wave-length imaging (40). Instruments are now availablewith several laser sources so that confocal and mul-tiple photon imaging modes can be used, and whencombined with improved probes, gives a powerfulmeans of imaging the spatial distribution and behav-ior of macromolecules in cells (41).
AcknowledgmentsI would like to thank Jim Williams (Fig. 4),
Grace Panganiban and Duc Dong (Fig. 7), JaneSelegue (Fig. 8), Dorothy Lewis (Fig. 9 C,D,E)and Julie Gates (Fig. 11) for allowing me to imagetheir beautiful specimens, and Sean Carroll forour continued collaborations.
References1. Paddock, S. W. (1999) Confocal laser scanning
microscopy. BioTechniques 27, 992–1004.2. Pawley, J. B (1995) Handbook of Biological Confo-
cal Microscopy, 2nd ed., Plenum, New York.3. Chen, H., Hughes, D. D., Chan, T. A., Sedat, J. W., and
Agard, D. A. (1996) IVE (Image Visualization Envi-ronment): a software platform for all three-dimensionalmicroscopy applications. J. Struct. Biol. 116, 56–60.
4. Potter, S. M. (1996) Vital imaging: two photons arebetter than one. Curr. Biol. 6, 1595–1598.
5. Minsky, M. (1988) Memoir on inventing the confo-cal scanning microscope. Scanning 10, 128–138.
6. Inoue, S. and Spring, K. S. (1997) Video Microscopy:The Fundamentals, 2nd ed. Plenum, New York.
7. DeRisi, J., Penland, L., Brown, P. O., Bittner, M. L.,Meltzer, P. S., Ray, M. et al. (1996) Use of a cDNAmicroarray to analyze gene expression patterns inhuman cancer. Nature Genetics 14, 457– 460.
8. White, J. G., Amos, W. B., Durbin, R., and Fordham,M. (1990) Development of a confocal imaging sys-tem for biological epifluorescence application, inOptical Microscopy For Biology, Wiley-Liss, NewYork, pp. 1–18.
9. White, J. G., Amos, W. B., and Fordham, M. (1987)An evaluation of confocal versus conventional imag-
Laser Scanning Confocal Microscopy 149
MOLECULAR BIOTECHNOLOGY Volume 16, 2000
ing of biological structures by fluorescence lightmicroscopy. J. Cell Biol. 105, 41–48.
10. Pawley, J. B. (1995) Light paths of current commer-cial confocal microscopes for biology, in Handbookof Biological Confocal Microscopy, 2nd ed. (PawleyJ. B., ed.) Plenum, New York, pp. 581–598.
11. Terasaki, M. and Dailey, M. E. (1995) Confocalmicroscopy of living cells, in Handbook of Biologi-cal Confocal Microscopy, 2nd ed. (Pawley J. B., ed.),Plenum, New York, pp. 327–346.
12. Cheng, H., Lederer, W. J., and Cannell, M. B. (1993) Cal-cium sparks: elementary events underlying excitation-con-traction coupling in heart muscle. Science 262, 740–744.
13. White, N. S. (1995) Visualization systems for multi-dimensional CLSM, in Handbook of Biological Con-focal Microscopy, 2nd ed. (Pawley J.B., ed.) Plenum,New York, pp. 211–254.
14. Stricker, S. A., Centonze, V. E., Paddock, S. W., andSchatten, G. (1992) Confocal microscopy of fertili-zation-induced calcium dynamics in sea urchin eggs.Dev. Biol. 149, 370–380.
15. Paddock, S. W., Hazen, E. J., and DeVries, P. J.(1997) Methods and applications of three color con-focal imaging. BioTechniques 22, 120–126.
16. Thomas, C. F., DeVries, P., Hardin, J., and White, J.G. (1996) Four dimensional imaging: computer visu-alization of 3D movements in living specimens. Sci-ence 273, 603–607.
17. Mohler, W. A. and White, J. G. (1998) Stereo-4-Dreconstruction and animation from living fluorescentspecimens. Biotechniques 24, 1006–1012.
18. Paddock, S. W., Mahoney, S., Minshall, M., Smith,L. C., Duvic, M., and Lewis, D. (1991) Improved de-tection of in situ hybridization by laser scanning con-focal microscopy. BioTechniques 11, 486–494.
19. Serbedzija, G. N., Bronner-Fraser, M., and Fraser, S.(1992) Vital dye analysis of cranial neural crest cell mi-gration in the mouse embryo. Development 116, 297–307.
20. Deerinck, T. J., Martone, M. E., Lev-Ram, V., Green,D. P. L., Tsien R. Y., Spector, D. L., et al. (1994)Fluorescence photooxidation with eosin: a methodfor high resolution immunolocalisation and in situhybridization detection for light and electron micros-copy. J. Cell Biol. 126, 901–910.
21. Paddock, S. W. and Cooke, P. (1988) Correlatedconfocal laser scanning microscopy with high-voltageelectron microscopy of focal contacts in 3T3 cells stainedwith Napthol Blue Black. EMSA Abs 46, 100–101.
22. Sheppard, C. J. R. and Shotten, D. M. (1997) Confo-cal laser scanning microscopy. Royal MicroscopicalSociety Handbook Series #38, Bios scientific pub-lishers, Oxford, UK.
23. Matsumoto, B. (2000) Cell Biological Applicationsof Confocal Microscopy, 2nd ed. Methods In CellBiology, Academic Press, San Diego, CA, in press.
24. Paddock, S. W. (1998) Protocols In Confocal Micros-copy. Methods In Mol. Biol. 122. (J. Walker, ed.)Humana, Totowa, NJ.
25. Spector, D. L., Goldman, R., and Leinwand, L. (1998)Cells: A Laboratory Manual, vol. II Light Microscopyand Cell Structure. Cold Spring Harbor Press, ColdSpring Harbor, NY.
26. Cullander, C. (1994) Imaging in the far-red with elec-tronic light microscopy: requirements and limitations.J. Microsc. 176, 281–286.
27. Keller, H. A. (1995) Objective lenses for confocalmicroscopy, in Handbook of Biological Confocal Mi-croscopy, 2nd ed. (Pawley, J. B., ed.), Plenum, NewYork, pp. 111–126.
28 Wilson, T. (1995) The role of the pinhole in confocalimaging system, in Handbook of Biological ConfocalMicroscopy, 2nd ed. (Pawley, J. B., ed.), Plenum,New York, pp. 167–182.
29. Haugland, R. P. (1999) Handbook of FluorescentProbes and Research Chemicals. 7th ed. MolecularProbes Inc., Eugene, Oregon. (www.probes.com).
30. Wilkie, G. S. and Davis, I. (1998) High resolution andsensitive mRNA in situ hybridization using fluores-cent tyramide amplification. Tech. Tips Online t01458(www.biomednet.com).
31. Bliton, C., Lechleiter, J., and Clapham, D. E. (1993)Optical modifications enabling simultaneous confo-cal imaging with dyes excited by ultra-violet and vis-ible-wavelength light. J. Microsc. 169, 15–26.
32. Chalfie, M. and Kain, S. (1998) Green FluorescentProtein: Properties, Applications and Protocols.Wiley-Liss, New York.
33. Sullivan, K. F. and Kay, S. A. (1998) Green fluorescent pro-teins. Meth. Cell Biol. Vol. 58. Academic, San Diego, CA.
34. Karten, H. J. (1998) Information management of confo-cal microscopy images. Meth. Mol. Biol. 122, 403–420.
35. Brelje, T. C., Wessendorf, M. W., and Sorenson, R.L. 1993. Multicolor laser scanning confocal immun-ofluorescence microscopy: practical applications andlimitations. Meth. Cell Biol. 38, 98–177.
36. Brown, N. L. (1998) Imaging gene expression usingantibody probes. Meth. Mol. Biol. 122, 75–91.
37. Sharma, D. (1999) The use of an AOTF to achieve highquality simultaneous multiple label imaging. BioRadTech. Note 04. www.microscopy.bio-rad.com38.
38. Halder, G. and Paddock, S. W. (1998) Presentation ofconfocal images. Meth. Mol. Biol. 122, 373–384.
39. Bornfleth, H., Edelmann, P., Zink, D., Cremer, T.,and Cremer. C. (1999) Quantitative motion analysisof subchromosomal foci in living cells using four-dimensional microscopy. Biophys. J. 77, 2871–2886.
40. Centonze, V. E. and White, J. G. (1998) Multiphotonexcitation provides optical sections from deeperwithin scattering specimens than confocal imaging.Biophys. J. 75, 2015–2024.
41. Fan, G. Y., Fujisaki, H., Miyawaki, A, Tsay, R.-K.,Tsien R. Y., and Ellisman, M. H. (1999) Video-ratescanning two-photon excitation fluorescence micro-scopy and ratio imaging with cameleons. Biophys. J.76, 2412–2420.