Mentor Principals’ Perceptions About a Mentoring Program ...

PRINCIPALS’ PERCEPTIONS OF BARRIERS TO DISMISSAL OF POOR-PERFORMING TEACHERS
A Dissertation
By
Jason R. Dandoy Doctoral Candidate
The University of Kansas
B.S., University of Iowa, 2000 MS.ED., University of Kansas, 2004
Submitted to the graduate degree program in Educational Leadership and Policy Studies
and the Graduate Faculty of the University of Kansas in partial fulfillment of the requirements for the degree of Doctor of Philosophy.
Dr. Michael Imber, Ph.D., Chairperson
Dr. Charles Epp, Ph.D., Committee member
Dr. Argun Saatcioglu, Ph.D., Committee member
Dr. Ardith Pierce, Ph.D., Committee member
Dr. Perry Perkins, Ed.D., Committee member
Date defended: May 7, 2012

ii
The Dissertation Committee for Jason R. Dandoy certifies that this is the approved version of the following dissertation:
PRINCIPALS’ PERCEPTIONS OF BARRIERS TO DISMISSAL OF POOR-PERFORMING TEACHERS
Chairperson: Dr. Michael Imber
Date approved: May 7, 2012

iii
Abstract
The purpose of this study is to determine which factors influence items that
school principals consider “barriers” to dismissal of “incompetent” or “poor performing”
teachers. This study determines if specific characteristics of schools, principals, or a
combination of the two can predict the specific barriers cited by principals as the reasons
for renewing contracts of poor performing teachers. By identifying causes for the
tolerance of poor-performing teachers, school officials and educational institutions may
take a more proactive approach to training principals and hopefully prevent the repetition
of this problematic administrative behavior.
Data from the 2007-2008 Schools and Staffing Survey is used to provide insight
into the quantitative study questions. In this survey, principals indicated items that they
considered to be barriers to dismissal of poor-performing teachers. Items that principals
considered to be barriers to dismissal serve as the outcome variables. Characteristics of
schools and school administrators serve as the predicting variables. Questions are
answered within the educational and legal context that permits and restrains the ability of
a school district to make contract decisions based on teacher performance.
Major findings of this study identify that principals cite “union presence”,
“tenure”, “length of time”, and “effort required for documentation” as the most common
barriers to dismissal of poor-performing teachers. In order to decrease the presence of
these barriers, this study found that principal training and district support are important;

iv
specifically, involvement in professional development for principals and involvement by
curriculum specialists. Principals who were enthusiastic and motivated to do their jobs
also reported the presence of barriers less frequently. Those who were tired of the work,
had dissatisfied staffs, or lacked enthusiasm were more burdened by the challenges of
removing low-performing teachers. Of the barriers studied, few characteristics of
principals or schools assisted in reducing the principals’ reports that union presence
created a barrier.
Conclusions of this study suggest that district administrators need to take a
proactive approach to ensuring that principals receive support and maintain enthusiasm to
do the work. Providing professional development to principals, specifically in the areas of
staff evaluation, is a recommendation. Supporting principals with curriculum specialists
or other district administrators will also aid in the reduction of barriers to dismissal of
poor-performing teachers.
v
Acknowledgements
This dissertation is the result of effort given by many close advisors, colleagues,
and friends. Dr. Michael Imber has provided endless support, advice, and perspective
during my doctoral journey. His guidance has resulted in my acquisition of new learning
and skill. In addition to Dr. Imber, I would like to acknowledge the assistance given by
Dr. Argun Saaticioglu during the data collection and analysis process. This work would
not have been possible without the efforts of both of these esteemed advisors. Special
recognition is also given to Dr. Charles Epp, my minor advisor, Dr. Ardith Pierce, Dr.
Perry Perkins, and the many wonderful instructors I was fortunate enough to encounter
during my graduate studies.
I would like to thank the many fellow University of Kansas students who offered
support throughout this process. We spent many long nights working toward this end
result. I will never forget the personal and professional relationships built during this
time.
To my fellow educators in the Turner School District, I would like to offer a
special “thank you” for allowing the professional growth they’ve helped me accomplish.
My Turner colleagues, led by Dr. Michelle Sedler, have taught me relentless
perseverance by refocusing me during difficult times. They have offered professional and
personal advice that kept me engaged in the work.
vi
I would like to acknowledge my closest friends, Ms. Deanna Barden, Mr. Michael,
Koonce, and Dr. Michael Schumacher for sharing their professional support and “never
give up” attitudes. My Mother, Ms. Lynda Cole, and her husband, Mr. Steve Cole, have
instilled in me a love for education and furthering oneself through professional work. My
Grandmother, Ms. Berget Starch, deserves special recognition for following up with me,
on a weekly basis, about my dissertation progress. Without the time invested in me by
these individuals, this work would not have been possible.
Most importantly, I would like to thank my wonderful son, Michael Dandoy, for
being the caring and thoughtful young man that he is. Michael’s unconditional love for
his father was obvious during this long process during which the obligations of doctoral
work took my time away from him on many occasions. It is my hope that the effort put
toward this degree shows Michael the importance of becoming an educated, independent
thinker.

vii
TABLE OF CONTENTS
ABSTRACT .................................................................................................................................. iii
ACKNOWLEDGEMENTS ......................................................................................................... v
CHAPTER
I. INTRODUCTION: THE PROBLEM OF CONTINUAL RENEWAL OF CONTRACTS FOR POOR PERFORMING TEACHERS .............................................. 1
II. REVIEW OF THE LITERATURE ..................................................................................... 7
A. LEGAL ACCOUNTABILITY OF SCHOOLS AND STUDENT ACHIEVEMENT ................................................................. 7 B. EDUCATOR QUALITY AND APPRAISAL ................................................................................................................. 11 C. CONTRACT RENEWAL DECISIONS AND DUE PROCESS ......................................................................................... 17 D. OUTCOME VARIABLES: BARRIERS TO DISMISSAL ................................................................................................ 23 E. PREDICTIVE VARIABLES: PRINCIPAL AND SCHOOL CHARACTERISTICS ................................................................ 25
III. METHODS ........................................................................................................................... 31
IV. FINDINGS ........................................................................................................................... 35
A. TENURE ................................................................................................................................................................ 35 B. UNION PRESENCE ................................................................................................................................................. 40 C. LENGTH OF TIME REQUIRED ................................................................................................................................ 43 D. EFFORT REQUIRED ............................................................................................................................................... 46
V. CONCLUSIONS, LIMITATIONS, AND NEED FOR FUTURE STUDY .................... 49
A. CONCLUSIONS ...................................................................................................................................................... 58 B. LIMITATIONS AND NEED FOR FUTURE STUDY ....................................................................................................... 56
REFERENCES
WORKS CITED ......................................................................................................................... 61
TABLE 9: VARIABLE NAMES AND PURPOSE .................................................................. 69

1
Chapter I The Problem of Continual Renewal of Contracts for Poor Performing Teachers
This purpose of this study is to answer the following questions:
1) Which barriers do principals cite as impeding dismissal of a poor-
performing tenured teacher?
2) What principal or school characteristics predict the likelihood that a
principal says he/she faces certain barriers to dismissal?
These research questions are designed to offer insight into a problem affecting public
schools. Results from the 2007-2008 Schools and Staffing Survey show that school
principals admit both “unsatisfactory” and “fair” teachers continue to practice in
American schools. Of the 4,601 school districts completing a 2007-2008 Schools and
Staffing Survey (SASS), survey data indicates that 81.94% renewed the past year’s
contract of every tenured teacher, regardless of level of performance. It is problematic
that four out of five school districts report taking no action to remove poor-performing
teachers from the classroom. In a recent study by Weisberg, et al (2009), responses from
15,000 teachers and 1,300 school administrators were analyzed to show that more than
99% of teachers received a rating of “satisfactory” on a binary (satisfactory or
unsatisfactory) teacher evaluation tool. In the same study, 81% of school administrators
acknowledged that at least one tenured teacher in their building was performing poorly.
Anecdotal writing publicized the topic of poor-performing teachers continuing to

2
practice due to tenure and non-renewal barriers faced by their evaluators (Brill, 2009).
Steven Brill’s writing on New York City’s now-defunct “Rubber Rooms” describes the
consequences for schools when attempting to fire poor-performing teachers. Most studies
surrounding this topic are anecdotal in nature and few, if any, systematically attempt to
quantify this issue.
In juxtaposition with writing on the challenges of dismissal are studies that suggest
how important teachers are to students’ lives. A recent study by economists at Harvard
and Columbia tells us that the value added by teachers greatly impacts the long-term
success of students. Simply defined, “value added” is determined by measuring growth
on student assessments. They state: “Replacing a teacher whose: “value added” is in the
bottom 5% with an average teacher would increase the present value of students’ lifetime
income by more than $250,000 for the average classroom in our sample. We conclude
that good teachers create substantial economic value and that test score impacts are
helpful in identifying such teachers” (Chetty, et al., 2012). School administrators have the
responsibility to ensure that the value added by teachers has a positive effect on students.
This task may require that poor-performing teachers be dismissed. Thus, the purpose of
this study is to determine which factors influence items that school principals consider
“barriers” to teacher non-renewal as reported in the Schools and Staffing Survey.
A question on the Schools and Staffing Survey asks principals which items they
consider barriers to dismissal of a “poor-performing” or “incompetent” teacher. Eight
barriers are listed in a format where principals indicate whether each is considered a

3
barrier by simply checking “yes” or “no”. On the survey, this question follows one in
which principals indicate how many “fair” and “unsatisfactory” teachers are present in
their schools. Although not an exhaustive list, of the eight barriers listed in the survey,
principals view “union presence”, “tenure”, “length of time”, and “effort required” as
those that stand in the way of dismissal of poor-performing teachers (Table 3).
Hanushek (2009) addresses the problem of poor-performing teachers: “The bottom
end of the teaching force is harming students. Allowing ineffective teachers to remain in
the classroom is dragging down the nation". Hanushek puts forth a statistical model in
which student achievement is improved by firing the poorest-performing 10% of
teachers. Based on research conducted using data from students in Chicago, it was shown
that characteristics of quality teachers positively influence students’ attitudes toward
school and student achievement (Hallinan, 2008). Additionally, research suggests that the
most competent school principals have an overwhelming positive impact on student
performance (Robinson, et.al, 2008).
This study attempts to solve the problem of maintaining poor-performing teachers
by asserting characteristics that may demonstrate an influence on the barriers of dismissal
cited by school administrators. Painter (2000) presents research in which principals cited
union presence, procedural challenges, and time as top barriers to dismissal. Even when
an administrator is present who has the time, willpower, and organization skill to
recommend non-renewal, practicing within the confines of law and the teacher’s contract
takes a great deal of knowledge and effort. Additionally, school-level factors (low student

4
socio-economic status, staff satisfaction) may influence the items that principals consider
when deciding to non-renew a contract.
Chapter 2 of this work describes literature related to dismissal of poor performing
teachers. Literature is broken into the following topics: legal accountability of schools
and student achievement, educator quality and appraisal, contract renewal decisions and
due process, barriers to dismissal of poor-performing teachers, and principal and school
characteristics.
Chapter 3 describes the methodology used to answer the research questions. Data
from the 2007-2008 Schools and Staffing Survey is used to determine which
characteristics of principals and schools are positively and negatively correlated with
barriers of dismissal. Data from two levels of the survey is used in this study: one
completed by district-level personnel and another completed by school principals.
Datasets from the district-level and school-level surveys are combined to weigh the
relationship between characteristics and barriers of dismissal. Based on each
characteristic, we determine the degree to which the independent variables result in an
increase or decrease in the likelihood of principals reporting “barriers” to dismissal.
Logistical regression with an “odds ratio” factor was used for analysis. This model allows
for the researcher to estimate how various predictors (principal characteristics) estimate
the likelihood that a certain outcome variable (presence of barriers to dismissal) is
present.

5
Chapter 4 reports the findings of this work. It begins with a summary table
showing whether or not each predicting variable increases or decreases the likelihood that
a barrier to dismissal is present. In this work, predicting variables are included when
resulting in a 15% (or greater) increase or decrease in the likelihood that a barrier be
present. A natural break in the data was noticed between predictive barriers that had little
or no effect, and those resulting in at least a 15% increase or decrease that the barrier to
dismissal is present. Thus, conclusions for each barrier to dismissal are discussed when
the relationship between the values is at least 15% across models.
This study identified that principals cited “tenure”, “effort required for
documentation”, “union presence”, and “length of time required” as the primary barriers
to dismissal of incompetent or poor-performing teachers. It found that principals who
worked in districts where collective bargaining and/or “meet and confer” relationships
with unions existed were likely to cite the presence of all barriers studied. Principals
working in schools that are “on improvement” reported a higher presence of three of the
four barriers; all except “tenure”. Generally speaking, the degree to which principals
disliked their jobs was positively correlated with the likelihood that they believed barriers
to dismissal exist. Principals who had dissatisfied staffs or wanted to transfer schools
were more likely to report facing three of the four barriers. Indicating that the principal
lacked enthusiasm increased the reporting of all barriers studied. Few principal or school
characteristics were shown to decrease the perceived presence of barriers. Only
participation in professional development and Curriculum Specialists’ involvement in

6
teacher evaluation resulted in a decrease of barriers being cited in three of the four
barriers studied.
Chapter 5 includes conclusions, limitations, and recommendations for future
study. It is suggested that barriers to dismissal of incompetent or poor performing
teachers might be reduced through a system of district support which includes
participation in professional development and support from curriculum specialists.
Districts should also consider taking a proactive role in ensuring that principals maintain
enthusiasm and passion for the work. Future study should also consider investigating the
factors that relate to principal contract renewal decisions and principal performance.

7
Chapter II Issues Relating to Dismissal of Poor Performing Teachers
A study of current literature focuses on a number of issues relating to dismissal of poor
performing teachers and the barriers encountered by principals. Literature is broken into
the following topics:
a. Legal Accountability of Schools and Student Achievement
b. Educator Quality and Appraisal
c. Contract Renewal Decisions and Due Process
d. Outcome Variables: Barriers to Dismissal
e. Predicting Variables: Principal and School Characteristics
a. Legal Accountability of Schools and Student Achievement
The primary interest of this study is to determine which principal and school
characteristics predict the presence of barriers to dismissal of poor-performing teachers.
To clearly outline the importance of dismissing poor-performing teachers, it is necessary
to describe the manner in which schools are legally accountable for student performance.
Darling-Hammond (1997) notes that levels of student achievement in a school are
contingent on the quality of teachers it employs. Using data from more the 2.5 million
students, Chetty, et al. (2012) show that the value added by growth on tests can be used
as a demonstrator of teacher quality. They also note that: “When a high value-added (top
8
5%) teacher enters a school, end-of-school-year test scores in the grade he or she teaches
rise immediately... …students assigned to such high value-added teachers are more likely
to go to college, earn higher incomes, and less likely to be teenage mothers”. However,
not all students are fortunate enough to have a teacher performing at high levels. With
four out of five districts indicating in the Schools and Staffing Survey that all teachers
received contract renewals in the previous year, it seems like there is reasonable cause for
concern. From the standpoint of student preparedness and federal accountability, schools
must ensure that all students receive the best educational experience possible.
Since 2001, the success of schools has been measured by their ability to make
“adequate yearly progress” on a state assessment. “No-Child-Left-Behind” was the name
given to the reauthorization of the Elementary and Secondary Education Act (ESEA) of
2001. NCLB’s purpose as an act is: “To close the achievement gap with accountability,
flexibility, and choice, so that no child is left behind” (NCLB, 2002). Adequate Yearly
Progress (AYP) targets are determined by each state with the end mandate being that all
students perform at a level of “proficient” by 2014. If schools fail to meet AYP
repeatedly, an improvement process ensues and includes potential sanctions at different
intervals. As a corrective action, NCLB also calls for the termination of staff members
who are “relevant to the failure of a school to make AYP” (NCLB, 2002). Unfortunately,
the amount of time it can take an administrator to remove an inadequate tenured teacher
from duty can take longer than the time preceding a state takeover or school
restructuring. White (1997) reports that a New York School Board Association study
9
found that teacher dismissal proceedings took an average of 455 days… far longer than it
may take for a school to be placed on “improvement” for sub-par student achievement.
In addition to the primary mandate of ensuring schools make AYP, NCLB
requires that “highly-qualified” teachers be present in every school classroom. Tucker
and Stronge (2005) argue for the inclusion of performance characteristics being added to
the “credentialing” portion of what it means to be “highly qualified”: “According to the
legislation, “highly-qualified” teachers are defined as those who hold at least a bachelor’s
degree, are fully licensed or certified by the state in the subjects they teach, and can
demonstrate competence in the subjects they teach. While licensure or certification is a
significant indicator of teacher quality, these factors alone are insufficient for teacher
effectiveness. [Teacher effectiveness] includes dispositions and an array of planning,
organizational, instructional, and assessment skills… A “highly qualified” teacher is
certainly a good starting point, but most of us would want our child to have a highly
effective teacher whose teaching effort yields high rates of student learning.” No-Child-
Left-Behind makes no provision as to how a school is to go about removing teachers that
are failing to improve student outcomes. In fact, No-Child-Left-Behind (NCLB)
specifically states that no part of NCLB should be construed “to alter or otherwise affect
the rights, remedies, and procedures afforded schools or school district employees under
Federal, State, or local laws … or under the terms of collective bargaining agreements,
memoranda of understanding, or other agreements between such employees and their
employers.” (NCLB 1116(d) and USDOE, 2002).

10
There are indications that some characteristics of current law will be amended
with re-authorization of the Elementary and Secondary Education Act. In September,
2011, the United States Department of Education began accepting waiver requests for
states seeking flexibility from the targets of Adequate Yearly Progress. In early February,
2012, ten of the eleven waivers submitted had been granted. Although state tenure laws
are not directly linked to the reauthorization of ESEA, consistent, growth-oriented data
systems that measure student growth disaggregated by teacher and principal are cited as
priority in the waivers and revisions of the Elementary and Secondary Education Act. In
2012, the state of Kansas re-submitted a waiver to be granted flexibility in the
accountability outcomes required by NCLB. This waiver consisted of school
improvement outcomes attached to three principles: (1) College- and Career-Ready
Expectations for All Students, (2) State-Developed Differentiated Recognition,
Accountability, and Support, and (3) Supporting Effective Instruction and Leadership.
Principle 3 focused on evaluation systems for principals and teachers, which includes
student growth outcomes as measurable objectives.
Although preliminary, these changes bring us back to the key issue of this work.
When the topics of school accountability and student achievement are prevalent in the
school community, why do so few principals attempt to remove teachers that research
(Weisberg, at al, 2009) indicates they acknowledge are “incompetent” or “poor
performing”?

11
b. Educator Quality and Appraisal
Educator quality and appraisal are important elements to understand when
considering contract decisions for teachers. Darling-Hammond (1997) cites large-sample
research by Ferguson (1991) in which she “found that teacher’s experiences – as
measured by scores on a licensing examination, master’s degrees, and experience –
accounted for about 40% of the measured variance in student’s reading and mathematics
achievement at grades 1 through 11, more than any other single factor”. Using large-
scale NAEP data, Wenglinsky (2000) finds that the classroom practices of teachers are
most largely responsible for variations in student achievement. Wright et al., (1997)
notes: “if the teacher is ineffective, students under that teacher’s tutelage will achieve
inadequate progress academically...”. Furthermore, “students assigned to ineffective
teachers continue to show the effects of such teachers even when these students are
assigned to very effective teachers in subsequent years” (Sanders and Horn, 1998).
Simply put, on one end of the spectrum, we have good teachers who do good
things for kids. On the other, we have poor-performing or incompetent teachers.
Alexander and Alexander (2009) define teacher incompetence in the context of “fitness to
teach”: "fitness to teach is essential and contains a broad range of factors…lack of
knowledge of subject matter, lack of discipline, unreasonable discipline, unprofessional
conduct, and willful neglect of duty". McCarthy and Cambron-McCabe (1987) define

12
incompetency as: "lack of ability, legal qualifications, or fitness to discharge the required
duty."
Bridges (1992), Lavely, Berger, and Follman (1992), and Tucker (2001) have
noted that the percentage of “incompetent” teachers, in comparison to the population, is
between 5-15%. At the same time, teachers are non-renewed at a rate of less than 1%,
annually (Painter, 2000). If barely 1% of tenured teachers are released from contracts, it
cannot be reasonably asserted that the 98-99% of remaining teachers are high performing
(Bridges, 1994). Additionally, most states’ tenure statute(s) currently lack the inclusive
use of student data and prevent the termination of any teacher who is simply “average”.
Educator quality is most directly evaluated using a local personnel appraisal
process. Some states include elements of this process in statutory language. Other states
allow local school boards to define the method in which administrators will appraise staff
members. In Kansas, local chapters of the National Education Association collectively
bargain with school boards to define the parameters of the evaluation process. A recent
emphasis has been placed on attaching teacher evaluation to compensation or other
benefits. Jacob (2010) found that districts with "pay for performance" policies also take a
more direct path to non-renewing poor-performing teachers. Figlio and Kenny (2007)
note that in addition to pay incentives encouraging teachers to do a “good job”, the threat
of dismissal may also be a powerful incentive. Hanushek, et.al (1999) suggests that the
connection between traditional teacher pay and quality is thin. However, teacher
13
evaluation in most districts is not related to compensation, or even the likelihood that
poor-performing teachers are dismissed (Weisberg, 2009).
A recent dissertation by Megan Hollingsworth Ferchen (2011) is focused on
determining what teacher characteristics constitute an “incompetent” teacher. In order to
do this, she analyzed performance-based teacher evaluation documents from fourteen
school districts each within thirty miles of Kansas City, Missouri as well as case law on
the topic. All of the evaluation systems considered “student success” as the primary
purpose of teacher evaluation. She found that most followed a model provided by the
state in which they exist. For example, she cites the Missouri state evaluation philosophy
that states:
“A performance-based teacher evaluation system is critical to improving student
knowledge and performance. Performance-based teacher evaluation is intended to
assist administrators and teachers in creating a learning environment in which
students acquire and apply knowledge and skills” (Missouri Performance-based
Teacher Evaluation Guide).
In general, she found that the evaluation standards used to measure teacher quality were
often similar but also considered by the researcher to be largely subjective. The common
standards for performance were: (1) Planning and Preparation, (2) Instruction Processes,
(3) Assessment, (4) Classroom Environment and Management, (5) Professional
Responsibilities, (6) Interpersonal Relationships, and (7) Professional Development. Her
research identifies an interesting point; each of the evaluation protocols reviewed

14
discussed the positive traits districts want to see in teachers. However, in cases where
teachers are dismissed for “incompetence”, the burden of proof falls on districts to show
actual acts of “incompetence”; not necessarily just the fact that the teacher wasn’t able to
demonstrate competency on an evaluation tool. Dr. Ferchen’s review of the literature
found very little research specifically on the topic of teacher incompetence. Her review of
case law indicated that: “competency in all of the above areas isn’t necessarily required.
Teachers may fail to meet the expectations in one or more of the areas discussed, but he
or she isn’t incompetent until they’ve been given warnings, been placed on assistance
plans, worked alongside a mentor, and still not made improvements within the 90-day
remediation period. Teachers dismissed for reasons of incompetency must be repeat
offenders – they must consistently fail to meet expectations.”
Typically, teachers are supervised and evaluated by a building-level administrator,
or principal. Although other groups, such as boards of education, parents, and district
administrators may influence a teacher’s evaluation, Schools and Staffing Survey (2007-
2008) data shows that principals believe they have a stronger influence on evaluation
than any other group. On a scale of 1-4, 1 representing “No influence” and 4 representing
“Major Influence”, principals rated themselves at a 3.94:
Table 1: Schools and Staffing Survey, 2007
State Board of Education Local Board of Education District Staff Principal Teachers Curriculum Specialist Parent Groups2.4206 2.5848 2.6983 3.939 2.6283 2.2576 1.7946
Influence of Various Groups on Teacher Evaluation

15
Two types of evaluation occur; formative and summative. Scriven (1967)
generated these terms as contrasting forms of evaluation or assessment. Formative
evaluation is designed to gather information from which decisions regarding
improvement can be made. An evaluator observes practice and provides feedback in
order for the teacher to learn and grow. Fullan (2001) notes that the purpose of formative
teacher evaluation is to produce shared knowledge through interaction, so that teachers
can solve real-world problems. Summative feedback provides a final judgment that is
used to formally fulfill the evaluation process. As summative evaluation is most directly
related to contract decisions, it is also related to the barriers discussed within this work.
Formal summative evaluation should capture the totality of a teacher’s work and be used
for improvement purposes.
Charlotte Danielson (2002) divided teaching into four domains: 1) planning and
preparation, 2) classroom environment, 3) instruction, and 4) professional
responsibilities. She asserts that each of these should be considered when designing a
model for summative teacher evaluation. Many school districts, like the Chicago Public
Schools, have adopted Danielson’s framework as the basis for their teacher evaluation
program. Published by the American Federation of Teachers, Harvard professor Susan
Johnson writes in support of having a consistent, performance-based evaluation model
like Danielson’s: “Principals have too many responsibilities. Evaluation procedures are
too detailed and daunting. Administrators are reluctant to confront poor teachers. The
effort is wasted since unions will protect teachers facing dismissal with costly arbitrations
16
or court cases. Such explanations, often untested, become weak excuses for not taking
action. Inevitably, however, underlying this low dismissal rate is a poor—or poorly
used—evaluation system. Teachers who repeatedly fail to do a good job should be given
detailed feedback and advice about how to improve. If they don’t make rapid and steady
progress, they should be dismissed”.
Identification of marginal-performing educators is an essential consideration when
considering a proactive approach to contract decisions. This identification also triggers a
formal improvement process that is necessary when seeking non-renewal for cause. In a
comprehensive study of 20,000 teachers, Bridges (1992) cites research by Digilio (1984)
in which only .003 percent of the teaching body was classified as being less than
“satisfactory” on formal observations while 44.6 percent were classified as “outstanding”.
He goes on to note that “supervisor ratings and observations” are the most frequently
reported tool that school districts use to identify incompetent teachers. As research has
reported that the actual percentage of incompetent teachers is between 5-15 percent, if
only .003 percent of teachers are classified as being less than satisfactory, this measure
doesn’t suggest much hope for removal of poor performing teachers (Bridges, 1992,
Lavely, Berger, and Follman, 1992, and Tucker, 2001).
Jacob and Lefgren (2008) assert that “…if principals had greater autonomy with
regard to hiring and promotion decisions, there is some evidence that they would be able
to distinguish between the most and least effective teachers in their buildings. They found
that school administrators are successful in evaluating teachers who are considered low

17
performing using typical criteria, such as observation results, number of parent
complaints, and frequency of parent requests for that teacher. Additionally, they
determined that the positive or negative perception held by the principal correlated to the
likelihood that a particular teacher produces positive or negative trends in student
achievement when using a value-added method (Jacob & Lefgren, 2008). However, in
2010, Jacob wrote that “…few studies have examined how principals hire or fire
teachers, or how changes in personnel policies might influence teacher quality.”
c. Contract Renewal Decisions and Due Process
As the barriers to dismissal cited by principals deal with “time” and “effort”, this
section addresses factors relating to contract renewal decisions and the context in which
they are made. In essence, this section outlines the most “time” and “effort” laden steps
in the dismissal process.
Following the evaluation process, if an administrator identifies a teacher as “poor-
performing”, he/she must make a decision about that person’s job renewal or placement
within the school system. Doing essentially nothing with evaluation results is one option.
Acting on those that are poor is another. Research suggests that the struggle in non-
renewing tenured teachers causes many schools to simply choose to move these
individuals to non-tested or less desirable placements (Toch, 1996). Bridges (1994)
considers this practice to be an “escape hatch” for incompetence. Transfers between

18
schools, placement in a roving substitute pool, or re-assignments to non-teaching
positions are all considered to be passive ways of tolerating incompetence. If an
administrator decides to deal with incompetence by recommending dismissal, a series of
processes must ensue. Within these processes, the barriers to dismissal cited by principals
become apparent. Of the barriers to dismissal posed in the Schools and Staffing Survey,
most are ultimately characteristics or byproducts of due process. When looking at the
specific legal requirements of due process, “union presence”, “tenure”, “length of time”,
and “effort required” are each present.
Although this work focuses on barriers related to dismissal of tenured teachers, it
is important to point out the distinction between contract renewal practices for non-
tenured versus tenured teachers. Due process is constitutionally required for tenured
teachers since an expectation to employment exists and is thus protected by the
Fourteenth amendment. Two widely cited U.S. Supreme Court cases, Perry v.
Sindermann (1972), and Board of Regents v. Roth (1972), deal with constitutional
ramifications of due process rights afforded to teachers. In Roth, it was affirmed that non-
tenured individuals are not generally entitled to due process since there is no liberty or
property interest in continued employment. In Sindermann, the Supreme Court yielded a
different finding as a pattern of issuing a new one-year contract had occurred each year.
Although he was not “tenured”, his University had a policy and practiced the continued
renewal of contracts as long as the employee’s performance was satisfactory. When
Sindermann’s contract was not renewed, the University issued a press release describing
19
incidents of insubordination that could have posed a threat to Sindermann’s “liberty”
when searching for a new job. Thus, the Supreme Court determined that due process was
required.
For non-tenured or “probationary” teachers, contracts can be non-renewed for any
constitutionally permissible reason. In Kansas, non-tenured teachers must simply be
notified in writing of the board’s decision to non-renew by May 1st of the current school
year (Kansas Statute 72-5437). If the new teacher is not notified of a decision to non-
renew his/her contract, tenure is given upon issuance of the fourth continued contract by
the school district in which the person has been employed during previous contract years.
If a teacher moves districts, in Kansas, statute offers tenure protection after two
additional years of employment. As noted above, if the school fails to notify the teacher
of non-renewal before the date listed in statute, in some situations, tenure has been issued
even before the fourth contract has been signed.
A tenured teacher can only be terminated for cause. In general, states consider
some specific areas of performance to be considered “just cause” for termination.
Commission of a crime, negligence, insubordination, and incompetence typically arise as
general terms to describe grounds for termination. It is the demonstration and
measurement of these terms that is the basis for argument in due process proceedings.
Once a recommendation for termination is made to the board, due process is
executed. It includes very detailed and often lengthy steps, thus involving large amount
of time and effort. Due process includes the requirement of notice, a fair hearing, and the

20
opportunity for appeal. In Kansas, due process specifications are clearly outlined in state
statute. The teacher must receive written notice including a statement of reason for the
termination. Once notice is received, the teacher has a right to be heard by a hearing
officer and can exercise that right by filing a notice with the board within 15 days of the
original notice. Only the reasons (i.e.: incompetence) included in the notice can be used
as evidence by the Board. Notice is a required component of the process so that the
teacher can have ample opportunity to prepare a defense.
Once a teacher files notice to request a hearing, the commissioner of education (or
other state-appointed official) is charged with providing the teacher with a list of
qualified hearing officers. Kansas statute even goes so far as to describe the method to be
used for determining who the hearing offer is; both the teacher and the school board
essentially eliminate names from the original list until an officer is selected. In place of
this, both parties can agree that the American Arbitration Association be charged with
appointing an arbitrator to serve as a hearing officer. Once a hearing officer is selected,
the actual hearing must take place within 45 calendar days.
In Gillett v. U.S.D. No. 276 (1980), the court summarizes the theory of statutory
language surrounding the hearing process: "The purpose of the due process hearing
granted to a teacher by statute is to develop the grounds that have induced the board to
give the teacher notice of its desire to discontinue her services, and to afford the teacher
an opportunity to test the good faith and sufficiency of the notice. The hearing must be
fair and just, conducted in good faith, and dominated throughout by a sincere effort to

21
ascertain whether good cause exists for the notice given. If it does not, or if the hearing
was a mere sham, then justification for the board of education's action is lacking."
During the hearing, the following six components fulfill the requirements of due
process: (1) each party has the right to be represented by counsel of their choosing; (2)
each side may cross-examine the other; (3) each side may present witnesses; (4) the
teacher may testify on his/her own behalf; (5) the hearing is held in an orderly fashion;
(6) the result is one that is fair, unbiased, and based on evidence presented during the
hearing (KS Statute 72-5439). U.S.D. No. 434 v. Hubbard (1994) outlines the due
process hearing as a fact finding meeting where the committee is charged with: “…
deciding if: (1) the committee's decision was within the scope of its authority; (2) the
committee's decision was supported by substantial evidence; and (3) the committee did
not act fraudulently, arbitrarily, or capriciously”.
As an agent of the board, a school administrator assumes the responsibility of
demonstrating the cause for which a teacher was non-renewed. In order for an
administrator to demonstrate “cause”, documentation is often provided in form of letters
to the teacher, copies of evaluations, or testimony by witnesses. In addition to examples
of the teacher’s failure to perform, documentation of the teacher’s opportunity to
remediate his/her performance is required. Following the decision of the school board or
hearing panel, the teacher (or the Board) has the right to appeal either to a state
educational agency or some other administrative panel. Other appeals are heard by a
court of law.

22
U.S.D. No. 500 v. Robinson (1996) describes the attempt by an elementary teacher
to be reinstated following dismissal for failure to plan and conduct lessons and maintain
an orderly environment conducive to learning. Following an intensive intervention period
mandated by the district in hopes to improve the teacher’s performance, the decision was
made to non-renew the contract. The initial hearing officer found that the district did not
have the substantial evidence to support its claim that the teacher failed to plan for and
implement lessons and maintain an orderly environment conducive to learning. Instead,
the district’s testimony was framed with general terms to describe the teacher’s
performance, such as “substandard” and “mediocre” and “incompetent”. These general
terms did not support the burden of proof placed on the district, resulting in a finding for
re-instatement of the teacher. The hearing officer’s decision was supported by the district
court, overruled by the court of appeals, and finally supported once again by the Supreme
Court of Kansas finding that the officer acted within the scope of his duty and considered
only facts appropriate to the case.
Due process is a fundamental constitutional right essential to life in the United
States. It ensures that a school administrator may not act in an arbitrary and capricious
manner when dismissing a tenured teacher. However, it clearly can take a great deal of
time and effort, thus resulting as a barrier to dismissal of poor-performing teachers.
23
d. Outcome Variables: Barriers to Dismissal
Outcome variables in this category relate to the presence of tenure, time required
to dismiss a teacher, effort required for documentation when dismissing a teacher, and the
presence of unions/collective bargaining. Of the barriers available to principals on the
Schools and Staffing Survey, these were the most commonly cited as being present. This
category of variables is essential in offering the most direct answers to the question of
which principal and school characteristics predict the barriers cited.
Research cited in this work expressed that principals actually have historically
non-renewed very few teachers while suggesting that the number of poor-performers was
actually much higher than the number terminated (Bridges, 1994). Tucker (1997) notes
factors that describe principals’ reluctance to non-renew including: discomfort with
confrontation, lack of skills, role conflict between assistance and summative judgment,
inadequate time, lack of central office support, and lack of financial resources. Others
may be hesitant due to the cost involved. Dawson & Billingsley (2000) write of a district
where costs to dismiss a tenured teacher were in excess of $300,000. Bridges (1992)
interviewed district administrators in the 1980s and found, even then, that districts
expected to pay $50,000 for a single dismissal, with some proceedings costing upwards
of $200,000. In a study for the New York School Boards Association, White (1997)
updated these costs noting that dismissals cost an average of $177,000 in 1994. If the
case was appealed, the cost jumped to $317,000.

24
In addition to the time, effort, and financial burden, some principals may simply
avoid dismissal because they lack the competence or assertiveness to undertake the
process. Bridges (1994) suggests that principals are simply not confrontational enough to
instigate the process. Mitiello, et al. (2009) states: “Beyond the personnel and financial
investment necessary to whether legal challenges, lawsuits are also on the minds of
public school administrators as they make changes to both school and district policy as
well as their daily practice”. They also address a concerning body of research that needs
to resolve the issue of Principal’s lacking legal knowledge. Mitiello, et. al. (2009) notes
that additional research is necessary to determine why many principals are uninformed or
misinformed about student and teacher rights.
Schools and Staffing Survey data includes a measure of whether union presence is
a factor in the given district. Both teacher unions, the National Education Association
(NEA) and the American Federation of Teachers (AFT), were part of the movement
toward tenure laws as collective bargaining became widespread in the 1960’s (Carini,
2008). In many cases, these labor unions negotiate with school districts to define the due
process requirements outlined in state statute. Labor unions also represent members in the
case of a potential firing. Considerable evidence suggests that union contracts constrain
principals’ autonomy to manage their corps of teachers (Johnson, 1984). In particular, it
is difficult for principals to remove incompetent teachers under union contracts. The
procedural hurdles to remove a teacher can be extensive (Carini, 2008). Of the barriers to

25
dismissal cited by principals when completing Schools and Staffing Surveys, “union
presence” was the second most frequently identified, after “tenure” (Table 3).
e. Predictive Variables: Principal and School Characteristics
Predictive variables in this study indicate the likelihood that principals identified a
barrier to dismissal. Principals and school characteristics were selected for inclusion
based on one of two reasons: 1) past research has anecdotally cited certain characteristics
as related to teacher termination decisions; 2) based on experience in the field, the
researcher believed that some barriers to dismissal may have an inherent relationship to
certain principal characteristics. For example, a principal who finds the “effort required”
involved in dismissal proceedings to be a barrier likely will report low job satisfaction
levels. This proved to be the case. On the whole, there is remarkably little research
connecting characteristics of principals to their behaviors when making contract
decisions. Schools and Staffing Survey data includes variables that can be combined into
common groups. Groups include: principal and school characteristics, principal job
satisfaction elements, and influence on evaluation by various stakeholders. In this work,
each group of variables is given a base in relevant literature prior to further examination
through data analysis.

26
Principal and School Characteristics
Variables in this category address a variety of principal-specific characteristics as
well as characteristics specific to school sites. They express a relationship between items
such as principals participating in professional development, presence of collective
bargaining, and degree to which “academic excellence is a top priority” in the respective
school. Essentially, they define some of the characteristics that came up in literature as
being related to the personnel decisions. Little empirical research exists on the
characteristics selected and their impact on non-renewal barriers.
Data points are included that measure the length of contracts and salary ranges for
principals. A review of the literature did not generate any supporting documentation of a
relationship between contract length and contract decisions. In fact, multiple searches of
Wilson Omnifile, Academic Search Premier, Project MUSE, and Google Scholar were
completed using the search terms “school+principal+compensation” and
“school+principal+pay”. Not only was there an absence of literature related to principal
compensation and barriers to dismissal, but a simple absence of literature related to
principal pay. Other than the occasional narrative arguing for better pay in order to
reduce principal turn over, the relevant literature is sparse. It is clear that principals are
typically issued pay based on an approach more aligned to market demands and less
aligned to a traditional teacher “salary schedule”.
Other principal characteristics included measured the amount of time a principal
has been practicing as well as whether he/she participated in a training program for new

27
principals. Research expressed concerning data on the amount of time spent training
principals in topics relevant to their ability to remove poor-performing teachers. In a large
scale study of principal training programs, Hess and Kelly (2007) note that: “Of 360
course weeks devoted to personnel management, just 12 weeks mentioned teacher
dismissal and nine mentioned teacher compensation.” “Just 2 percent of 2,424 course
weeks addressed accountability in the context of school management or school
improvement, and less than 5 percent included instruction on managing school
improvement via data, technology, or empirical research.” It might be assumed that
principals with more experience or previous managerial experience would be more likely
to avoid barriers of dismissal. However, Jacob (2010) notes that older principals are less
likely than younger principals to dismiss teachers.
In addition to the range of quality in principal-preparation programs, school
districts approach the topic of in-house professional development for principals in varied
manners. Interestingly, 98% of the principals completing a Schools and Staffing Survey
indicated that they participated in professional development in the previous year (Schools
and Staffing Survey, 2008). Marzano and Waters (2009) describe the essential
relationship between district and building-level administration. The high percentage of
principals who participated suggests that districts are aware of the importance of new
learning for administrators. The University Council for Education Administration
published work by Peterson, (2002) who writes of the importance of professional
development for principals. Like much of the other research, Peterson summarizes

28
recommended professional development models put forth by the National Center for
Staff Development among other leading organizations. Little attention is given to topics
frequently used when teaching principals. Future research might take a look at the topics
chosen by districts for principal professional development and the degree of their
alignment to items principals consider weaknesses or barriers to their work. SASS data
will show a promising connection between the principals who participated in professional
development and their view on barriers to dismissal.
Two variables are included which rate the relative focus on student-achievement.
School “improvement” status was measured to indicate whether a school with poor
student performance on NCLB-required assessments relates to barriers to dismissal.
Additionally, we included a weighted data point expressing the degree to which a
principal named “encouraging academic excellence” as his or her top goal. Given the
emphasis placed on school personnel to document student achievement, the job of the
school administrator has clearly moved from a management position to one that requires
“instructional leadership”. For Principals to enact real change and improve the quality of
schooling, one would hope that the majority of Principals would suggest that
“encouraging academic excellence” is a top priority.
Job Satisfaction Variables
Research shows that school principals with high job efficacy have a great impact
on student performance (Robinson, et.al., 2008). However, data will show that some

29
principals do not like their job in general, or at least dislike specific parts of it. In these
instances, principals who lacked job satisfaction also faced more barriers to removing
poor performing teachers in their buildings. Variables in this category measure the degree
to which the principalship is perceived to be stressful, the staff dissatisfied, district
management poor, and the principal generally displeased and too tired to do the job well.
In essence, they rate job satisfaction.
There is a definite pattern in the data showing a strong relationship between
principals lacking enthusiasm to do the job and an increase in the presence of non-
renewal barriers. Whether those with high levels of enthusiasm confidently deal with
issues of low performance, thus reducing barriers, or those who simply happen not to
have any barriers also happen to be more enthusiastic, a clear relationship exists.
Variables in this category are coded as (0=No, 1=Yes) to identify when a principal has a
negative outlook on a characteristic of their job. This set of variables yielded some of the
strongest empirical conclusions of this work. At the same time, there is remarkably little
research available on the topic of principal job satisfaction and struggle with dismissal
barriers. This area will be one in which future research should focus.
Various groups’ influence on teacher evaluation
This group of predictive variables measures the effect of various groups’ influence
on teacher evaluation. Principals responded to questions regarding these groups by
indicating whether they had “no influence” up to “major influence” on teacher evaluation

30
in each respective school. Of the outcome variables, “tenure, union presence, effort
required, and length of time required” all exist due to the influence of groups and/or
issues typically outside of the principal’s office. One might assume that the “length of
time” or “effort” required is a direct result of procedures or obstacles posed by district,
state, or political bodies. As teacher evaluation is closely related to the steps necessary to
remove a poor performing teacher, it is important to look at factors related to appraisal.
Conclusions in this area will be interesting; across all four dependent variables,
involvement in evaluation by teachers decreased the presence of barriers. This supports
the notion that teachers, although a highly unionized group, know very well that poor-
performers negatively impact the ability of schools to make the level of progress
potentially attainable.

31
Chapter III Methods
Schools and Staffing Survey data is collected by the National Center for Education
Statistics. Data is collected from district administrators, individual schools, principals,
and teachers. This is done every four years so that longitudinal trends can be investigated.
In this work, specific data from both the School district survey and the Principal survey is
analyzed. Datasets from the School and Principal surveys were combined using school
ID. Stata 10 was used to run analyses. Table 9 following this paper lists each variable,
code name, variable type, and explanation of the purpose for inclusion. Sample sizes and
response rates provided by the National Center for Educational Statistics are offered
below:
Schools and Staffing Survey Sample Sizes and Response Rates Survey Sample Size Response Rate Public School District 5,250 87.8 Public School 9,800 80.4 Public School Principal 9,800 79.4
Table 2: Schools and Staffing Survey, 2007
As noted, the principal questioner included a list of “barriers to dismissal” each
principal faced when considering non-renewal of a poor performing teacher. Of the
barriers listed on the Schools and Staffing Survey, the following percentages of principals

32
viewed each as an issue when attempting to terminate contracts of poor performing
teachers:
Items Viewed as Barriers to Dismissal of Poor-performing Teachers Frequency Percent Personnel policies
Yes 3,743 50.18 No 3,716 49.82
Termination decisions not upheld Yes 1,463 19.61 No 5,996 80.39
Length of time required for termination process Yes 4,527 60.69 No 2,932 39.31
Effort required for documentation Yes 5,001 67.05 No 2,458 32.95
Tight deadlines for completing documentation
Yes 2,667 35.76 No 4,792 64.24
Tenure Yes 5,280 70.79 No 2,179 29.21
Teacher associations or unions Yes 4,675 62.68 No 2,784 37.32
Dismissal is too stressful and/or uncomfortable for you
Yes 1,089 14.6 No 6,370 85.4
Difficulty in obtaining suitable replacements Yes 1,656 22.2 No 5,803 77.8
Resistance from parents Yes 353 4.73 No 7,106 95.27
Table 3: Schools and Staffing Survey, 2007

33
Of these, the majority of Principals viewed “length of time”, “effort required for
documentation”, “tenure”, and “teacher unions” to be the primary barriers to dismissal.
These barriers are used to complete an analysis of the relationship between barriers and
principal/school characteristics. It is important to note that these variables are each
considered as independent factors principals subjectively cited as barriers to dismissal of
poor-performing or incompetent teachers. A factor analysis of these variables is not
included in this study. Barriers cited may have interrelated effects; for instance, the
presence of tenure may inherently involve increased time and effort on behalf of a
principal. Again, this work views each of the barriers as independent factors.
We began by correlating principal characteristics with each of these barriers in an
attempt to identify characteristics that predict the presence of each “barrier”. Based on
each characteristic, we determine the degree to which the independent variables result in
an increase or decrease in the likelihood of “barriers” to dismissal. Logistical regression
with an “odds ratio” factor was used for analysis. This model allows for the researcher to
estimate how various predictors (principal characteristics) estimate the likelihood that a
certain outcome variable (presence of barriers to dismissal). The “odds ratio” suggests
that a one-unit increase in the measure of an independent variable results in a certain
likelihood (represented here as percentages) that the unit increase results in the barrier
being present. A hypothetical odds ratio of 1 would indicate that no difference exists
between the groups. For example, Table 5 indicates that males (Variable: Is the subject
male? Yes=1, No=0) are 6% (Odds ratio of 1.06) more likely to view “tenure” as a

34
barrier to dismissal than females, the other group measured in this variable. An odds ratio
model was used in order to offer the ability to identify that certain characteristics actually
predict the likelihood that a principal demonstrating particular characteristic would view
a certain variable as a barrier.
As the primary interest of this work was to determine which characteristics of
principals impacted their perception of barriers to dismissal, three models were run for
each dependent variable. Model 1 includes only principal/school characteristics; model 2
includes principal/school characteristics and principal job satisfaction variables; model 3
includes principal/school characteristics, principal job satisfaction characteristics, and
variables representing the influence of various groups on teacher evaluation. By running
three separate models, we are able to determine whether certain principal characteristics
are present in the presence (or absence) of other variables such as the job satisfaction or
evaluation influence variables. Even with the inclusion of multiple models, results were
very similar overall. Discrepancies between models which may be of interest to school
administrators are disaggregated in the “findings” section.
Significance levels were tested at three levels, p<0.010, p<0.050, and p<0.1. These
are represented in the data tables and only data presented at the p<0.05 level will be
considered in the “findings”, and “conclusions” section.

35
Chapter IV Findings
Data is presented in four sections; one for each outcome variable. In each section,
the principal/school characteristics of interest are evaluated. Given the non-linear nature
of some of the included variables, logistic regression using an “odds ratio” is used here to
generalize the likelihood (or “odds”) that one value predicts presence of the outcome
variable. In this dataset, predicting variables are included when resulting in a 15% (or
greater) increase or decrease in the likelihood that a barrier be present. A natural break in
the data was noticed between predictive barriers that had little or no effect, and those
resulting in at least a 15% increase or decrease that the barrier to dismissal is present.
Thus, conclusions are discussed when the relationship between the values is at least 15%
across models. As few of the predicting variables were significantly more and less
predictive of a barrier to dismissal being present across each model, odds ratios presented
in the analysis below are computed while including all predicting variables. For variables
that showed significance in one or two of the models, discussion is offered.
In this section, each barrier to dismissal of “poor performing or incompetent”
teachers is analyzed separately. A summary table offering trends across each of the
barriers to dismissal is offered in Chapter 5.
36
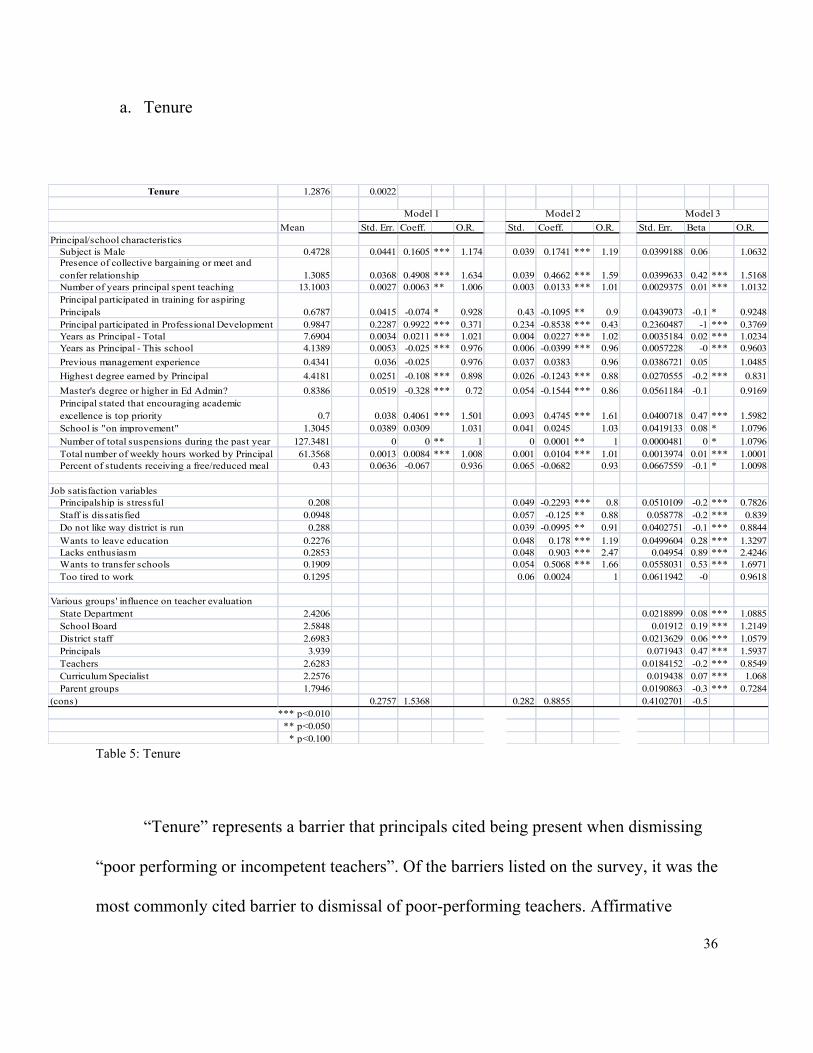
a. Tenure
Table 5: Tenure
“Tenure” represents a barrier that principals cited being present when dismissing
“poor performing or incompetent teachers”. Of the barriers listed on the survey, it was the
most commonly cited barrier to dismissal of poor-performing teachers. Affirmative
Tenure 1.2876 0.0022
Mean Std. Err. Coeff. O.R. Std. Coeff. O.R. Std. Err. Beta O.R.Principal/school characteristics
Subject is Male 0.4728 0.0441 0.1605 *** 1.174 0.039 0.1741 *** 1.19 0.0399188 0.06 1.0632Presence of collective bargaining or meet and confer relationship 1.3085 0.0368 0.4908 *** 1.634 0.039 0.4662 *** 1.59 0.0399633 0.42 *** 1.5168Number of years principal spent teaching 13.1003 0.0027 0.0063 ** 1.006 0.003 0.0133 *** 1.01 0.0029375 0.01 *** 1.0132Principal participated in training for aspiring Principals 0.6787 0.0415 -0.074 * 0.928 0.43 -0.1095 ** 0.9 0.0439073 -0.1 * 0.9248Principal participated in Professional Development 0.9847 0.2287 0.9922 *** 0.371 0.234 -0.8538 *** 0.43 0.2360487 -1 *** 0.3769Years as Principal - Total 7.6904 0.0034 0.0211 *** 1.021 0.004 0.0227 *** 1.02 0.0035184 0.02 *** 1.0234Years as Principal - This school 4.1389 0.0053 -0.025 *** 0.976 0.006 -0.0399 *** 0.96 0.0057228 -0 *** 0.9603Previous management experience 0.4341 0.036 -0.025 0.976 0.037 0.0383 0.96 0.0386721 0.05 1.0485Highest degree earned by Principal 4.4181 0.0251 -0.108 *** 0.898 0.026 -0.1243 *** 0.88 0.0270555 -0.2 *** 0.831Master's degree or higher in Ed Admin? 0.8386 0.0519 -0.328 *** 0.72 0.054 -0.1544 *** 0.86 0.0561184 -0.1 0.9169Principal stated that encouraging academic excellence is top priority 0.7 0.038 0.4061 *** 1.501 0.093 0.4745 *** 1.61 0.0400718 0.47 *** 1.5982School is "on improvement" 1.3045 0.0389 0.0309 1.031 0.041 0.0245 1.03 0.0419133 0.08 * 1.0796Number of total suspensions during the past year 127.3481 0 0 ** 1 0 0.0001 ** 1 0.0000481 0 * 1.0796Total number of weekly hours worked by Principal 61.3568 0.0013 0.0084 *** 1.008 0.001 0.0104 *** 1.01 0.0013974 0.01 *** 1.0001Percent of students receiving a free/reduced meal 0.43 0.0636 -0.067 0.936 0.065 -0.0682 0.93 0.0667559 -0.1 * 1.0098
Job satisfaction variablesPrincipalship is stressful 0.208 0.049 -0.2293 *** 0.8 0.0510109 -0.2 *** 0.7826Staff is dissatisfied 0.0948 0.057 -0.125 ** 0.88 0.058778 -0.2 *** 0.839Do not like way district is run 0.288 0.039 -0.0995 ** 0.91 0.0402751 -0.1 *** 0.8844Wants to leave education 0.2276 0.048 0.178 *** 1.19 0.0499604 0.28 *** 1.3297Lacks enthusiasm 0.2853 0.048 0.903 *** 2.47 0.04954 0.89 *** 2.4246Wants to transfer schools 0.1909 0.054 0.5068 *** 1.66 0.0558031 0.53 *** 1.6971Too tired to work 0.1295 0.06 0.0024 1 0.0611942 -0 0.9618
Various groups' influence on teacher evaluationState Department 2.4206 0.0218899 0.08 *** 1.0885School Board 2.5848 0.01912 0.19 *** 1.2149District staff 2.6983 0.0213629 0.06 *** 1.0579Principals 3.939 0.071943 0.47 *** 1.5937Teachers 2.6283 0.0184152 -0.2 *** 0.8549Curriculum Specialist 2.2576 0.019438 0.07 *** 1.068Parent groups 1.7946 0.0190863 -0.3 *** 0.7284
(cons) 0.2757 1.5368 0.282 0.8855 0.4102701 -0.5*** p<0.010
** p<0.050* p<0.100
Model 1 Model 2 Model 3

37
responses to the following predictive variables was most directly related to an increase in
“tenure” being a barrier:
• Presence of collective bargaining (52% increase) • Encouraging academic excellence is a top priority (60% increase) • Principal wants to leave education (32% increase) • Principal lacks enthusiasm (142% increase) • Principal wants to transfer schools (70% increase) • School board influences teacher evaluation (21% increase) • Principal influences teacher evaluation (59% increase)
Affirmative responses to the following predictive variables was most directly related to a
decrease in “tenure” being a barrier:
• Principal participated in professional development (64% decrease) • Principalship is stressful (22% decrease) • Teachers influence teacher evaluation (15% decrease) • Parent groups influence teacher evaluation (27% decrease)
It is likely common sense to believe that the Principals who lack enthusiasm, want
to leave education, or leave a particular school are most likely to deal with barriers to
doing the job well. Dismissal of poor-performing teachers is probably no exception. It is
hard work and exacerbated by the presence of tenure. That said, principals
acknowledging that the job is stressful were less likely to see tenure as a barrier. This
makes sense; even Principals who actively dismiss poor-performing teachers would likely
say the process is stressful. It might also be noted that Principals who have successfully
combated the barrier of tenure experienced stress by engaging in the process.

38
School boards and principals influencing the evaluation process cause tenure to be
viewed as more of a barrier. It was common for school boards’ influence to be related to
the presence of other barriers analyzed in this project. However, an increase in principals’
influence on teacher evaluation was only related to an increase in presence of the
“tenure” variable. One possible explanation might be that the principals who found tenure
to be a barrier happened to be those who successfully non-renewed poor performers and
thus know the importance of proper evaluation procedures. Principals were less likely to
see tenure as a barrier when teachers and parent groups influenced evaluation. Perhaps
the involvement of teacher and parent groups in the evaluation process is greater in
regions where tenure is less prevalent.
Of all the independent variables, participation in professional development leads
to the greatest decrease of the dependent variables being seen as barriers to dismissal. In
the case of tenure, Principals who participated in professional learning were 64% less
likely to see tenure as a barrier. There are a number of plausible explanations for this as
we have no knowledge as to the type of professional development principals participated
in; we only know that they report participating. In some cases, districts that are savvy
enough to have a comprehensive professional development program are also likely to
have other barrier-reducing supports in place. This shows the importance of ensuring that
principals are regularly exposed to training in practical areas that affect their work.
Predictive variables above were significant across all three runs of the data.
However, other variables showed significance in only one or two of the models. The

39
variable “male” showed a near 19% increase in “tenure” being a barrier across models
including principal/school characteristics and principal/school characteristics plus job
satisfaction variables. However, tenure was viewed as less of a barrier when including the
evaluation influence variables.
If only including the variables related to principal/school characteristics, “tenure”
was 18% less likely to be considered a barrier to dismissal when the principal had a
master’s degree. However, having a master’s degree wasn’t significantly advantageous to
decreasing presence of the barrier when the job satisfaction and evaluation influence
variables were introduced.

40
b. Union Presence
Table 6: Union Presence
“Union Presence” represents the degree to which a teacher union is involved with
the school district. Perhaps because so many elements of teacher evaluation and due
process are related to union presence, principals reported that unions are the third most
commonly cited barriers to non-renewal. Most of the independent variables are associated
with an increase in union presence being seen as a barrier. Affirmative responses to the
Union presence 1.2544 0.0022
Mean Std. Err. Coeff. O.R. Std. Err. Coeff. O.R. Std. Err. Beta O.R.Principal/school characteristics
Subject is Male 0.4728 0.04303 0.02976 1.0302 0.04352 0.05869 1.0605 0.04477 0.05338 1.0548Presence of collective bargaining or meet and confer relationship 1.3085 0.04180 0.62604 *** 1.8702 0.04292 0.57290 *** 1.7734 0.04412 0.48941 *** 1.6314Number of years principal spent teaching 13.1003 0.0032 0.0058 * 1.0058 0.0032 0.0051 1.0051 0.0033 0.0057 * 1.0057Principal participated in training for aspiring Principals 0.6787 0.0458 0.2770 *** 1.3192 0.0465 0.2809 *** 1.3243 0.0478 0.2362 *** 1.2664Principal participated in Professional Development 0.9847 0.1665 0.5471 *** 1.7282 0.1675 0.5342 *** 1.7061 0.1725 0.4858 *** 1.6254Years as Principal - Total 7.6904 0.0038 0.0152 *** 1.0153 0.0038 0.0122 *** 1.0123 0.0038 0.0118 *** 1.0119Years as Principal - This school 4.1389 0.0062 0.0071 1.0072 0.0062 0.0043 1.0043 0.0064 -0.0016 0.9984Previous management experience 0.4341 0.0416 0.2419 *** 1.2736 0.0422 0.2204 *** 1.2465 0.0437 0.2792 *** 1.3221Highest degree earned by Principal 4.4181 0.0289 -0.1514 *** 0.8595 0.0294 -0.1397 *** 0.8696 0.0304 -0.1398 *** 0.8695Master's degree or higher in Ed Admin? 0.8386 0.0645 -0.5502 *** 0.5768 0.0660 -0.4301 *** 0.6505 0.0675 -0.3535 *** 0.7023Principal stated that encouraging academic excellence is top priority 0.7000 0.0440 0.3127 *** 1.3672 0.0444 0.3214 *** 1.3790 0.0454 0.4125 *** 1.5106School is "on improvement" 1.3045 0.0424 0.7740 *** 2.1684 0.0432 0.7111 *** 2.0363 0.0442 0.6751 *** 1.9643Number of total suspensions during the past year 127.3481 0.0001 -0.0010 *** 0.9990 0.0001 -0.0010 *** 0.9990 0.0000 -0.0009 *** 0.9991Total number of weekly hours worked by Principal 61.3568 0.0016 0.0165 *** 1.0167 0.0016 0.0148 *** 1.0149 0.0017 0.0166 *** 1.0167Percent of students receiving a free/reduced meal 0.4300 0.0735 -0.0646 0.9374 0.0743 -0.1272 * 0.8805 0.0756 -0.1170 0.8896
Job satisfaction variablesPrincipalship is stressful 0.2080 0.0578 0.0837 1.0873 0.0598 0.0316 1.0321Staff is dissatisfied 0.0948 0.0792 0.5641 *** 1.7579 0.0800 0.6333 *** 1.8838Do not like way district is run 0.2880 0.0466 0.3892 *** 1.4758 0.0475 0.3104 *** 1.3640Wants to leave education 0.2276 0.0530 -0.1963 *** 0.8218 0.0549 -0.0889 0.9149Lacks enthusiasm 0.2853 0.0536 0.3657 *** 1.4415 0.0545 0.2959 *** 1.3444Wants to transfer schools 0.1909 0.0594 -0.0014 0.9986 0.0612 0.0029 1.0029Too tired to work 0.1295 0.0659 -0.1173 * 0.8893 0.0669 -0.1224 * 0.8848
Various groups' influence on teacher evaluationState Department 2.4206 0.0255 0.0256 1.0259School Board 2.5848 0.0243 0.2247 *** 1.2519District staff 2.6983 0.0255 -0.1341 *** 0.8745Principals 3.939 0.0932 -0.2501 *** 0.7787Teachers 2.6283 0.0212 -0.0415 * 0.9593Curriculum Specialist 2.2576 0.0213 -0.3542 *** 0.7017Parent groups 1.7946 0.0215 0.1529 *** 1.1652
(_cons) 0.2441 -0.3310 0.2456 -0.4916 0.4491 0.8327*** p<0.010
** p<0.050* p<0.100
Model 1 Model 2 Model 3

41
following predictive variables were most directly related to an increase in “union
presence” being a barrier:
• Presence of collective bargaining (63% increase) • Principal participated in training for aspiring Principals (26% increase) • Participated in Professional Development (63% increase) • Principal had previous managerial experience (32% increase) • Encouraging academic excellence is a top priority (51% increase) • School is “on improvement” (96% increase) • Staff is dissatisfied (88% increase) • Principal does not like the way the district is run (36% increase) • Principal lacks enthusiasm (34% increase) • School board influences teacher evaluation (25% increase) • Parent groups influence teacher evaluation (16% increase)
Affirmative responses to the following independent variables were most directly related
to a decrease in “union presence” being a barrier to dismissal:
• Principal has Master’s Degree or higher (30% decrease) • Principal influences teacher evaluation (22% decrease) • Curriculum Specialist influences teacher evaluation (30% decrease)
Unfortunately, the data doesn’t offer much hope for proactive action when it
comes to ridding union presence as a barrier. Of the many variables that increase the
presence of this barrier, the school being “on improvement” and having a dissatisfied
staff are especially troublesome. A school “on improvement” may have issues present in
addition to teacher quality that affect the presence of union pressure when administration
considers non-renewal. Also, by the time a school is identified as being “on

42
improvement”, there is likely a low rate of satisfaction. Subsequently, a dissatisfied staff
may be more likely to solicit support from unions when trouble is perceived.
Data does support the notion that advanced education and training somewhat
alleviates the burden placed by union presence. Additionally, Principals and Curriculum
Specialists who have control over teacher evaluation also view unions as less of a barrier;
perhaps the extra support of having a Curriculum Specialist allows administration to
show additional steps taken to remediate a poor-performing teacher prior to dismissal.

43
c. Length of Time Required
Table 7: Amount of Time Required
“Length of time required” represents the fact that principals view the lengthy
process as a barrier to non-renewal. As was shown in the research, teacher dismissal
proceedings took an average of 455 working days (White 1997). Few educators would
likely believe that running a school is an easy task, or at least one that is not extremely
busy. Adding to this the state or local remediation and due process requirements, the time
Time required 1.261 0.0021
Mean Std. Err. Coeff. O.R. Std. Err. Coeff. O.R. Std. Err. Beta O.R.Principal/school characteristics
Subject is Male 0.4728 0.0415 -0.0559 0.9457 0.0430 -0.0666 0.9355 0.0442 -0.1089 ** 0.8968Presence of collective bargaining or meet and confer relationship 1.3085 0.0402 0.6304 *** 1.8785 0.0425 0.6199 *** 1.8588 0.0440 0.6119 *** 1.8440Number of years principal spent teaching 13.1003 0.0031 0.0169 *** 1.0170 0.0032 0.0216 *** 1.0218 0.0033 0.0272 *** 1.0276Principal participated in training for aspiring Principals 0.6787 0.0455 0.0405 1.0413 0.0473 0.0023 1.0023 0.0482 -0.0526 0.9488Principal participated in Professional Development 0.9847 0.2186 -0.6680 *** 0.5128 0.2278 -0.5399 ** 0.5828 0.2321 -0.6477 *** 0.5233Years as Principal - Total 7.6904 0.0038 0.0277 *** 1.0281 0.0039 0.0231 *** 1.0234 0.0039 0.0262 *** 1.0266Years as Principal - This school 4.1389 0.0060 -0.0090 0.9910 0.0062 -0.0211 *** 0.9791 0.0064 -0.0268 *** 0.9735Previous management experience 0.4341 0.0398 -0.1549 *** 0.8565 0.0415 -0.1833 *** 0.8325 0.0431 -0.1208 *** 0.8862Highest degree earned by Principal 4.4181 0.0291 0.1099 *** 1.1161 0.0302 0.1234 *** 1.1314 0.0310 0.0756 ** 1.0785Master's degree or higher in Ed Admin? 0.8386 0.0569 -0.0793 0.9238 0.0608 0.2264 *** 1.2541 0.0624 0.2771 *** 1.3193Principal stated that encouraging academic excellence is top priority 0.7000 0.0411 -0.0463 0.9548 0.0424 -0.0013 0.9987 0.0435 0.0582 1.0599School is "on improvement" 1.3045 0.0410 0.5525 *** 1.7376 0.0429 0.4988 *** 1.6467 0.0442 0.4997 *** 1.6482Number of total suspensions during the past year 127.3481 0.0000 -0.0001 *** 0.9999 0.0000 -0.0002 *** 0.9998 0.0000 -0.0002 *** 0.9998Total number of weekly hours worked by Principal 61.3568 0.0016 0.0203 *** 1.0205 0.0017 0.0215 *** 1.0217 0.0017 0.0220 *** 1.0223Percent of students receiving a free/reduced meal 0.4300 0.0707 0.3707 *** 1.4487 0.0729 0.2329 *** 1.4917 0.0745 0.3329 *** 1.3950
Job satisfaction variablesPrincipalship is stressful 0.2080 0.0590 0.1785 *** 1.1954 0.0613 0.1059 1.1117Staff is dissatisfied 0.0948 0.0800 0.9332 *** 2.5426 0.0805 0.9543 *** 2.5969Do not like way district is run 0.2880 0.0444 -0.2342 *** 0.7912 0.0453 -0.2757 *** 0.7590Wants to leave education 0.2276 0.0525 -0.3709 *** 0.6901 0.0541 -0.2722 *** 0.7617Lacks enthusiasm 0.2853 0.0588 1.2870 *** 3.6220 0.0598 1.2361 *** 3.4420Wants to transfer schools 0.1909 0.0609 0.2684 *** 1.3078 0.0625 0.3164 *** 1.3721Too tired to work 0.1295 0.0653 -0.4366 *** 0.6462 0.0663 -0.4183 *** 0.6582
Various groups' influence on teacher evaluationState Department 2.4206 0.0253 0.3132 *** 1.3678School Board 2.5848 0.0218 -0.1087 *** 0.8970District staff 2.6983 0.0243 -0.1087 *** 0.8970Principals 3.9390 0.0934 -0.0423 0.9585Teachers 2.6283 0.0211 -0.1433 *** 0.8665Curriculum Specialist 2.2576 0.0208 -0.2410 *** 0.7859Parent groups 1.7946 0.0209 0.0337 1.0343
(cons) 0.2818 -0.9341 0.2932 0.2439 0.4783 -0.5551*** p<0.010
** p<0.050* p<0.100
Model 1 Model 2 Model 3
44
it takes to non-renew a poor-performing teacher can make the task seem daunting.
Affirmative responses to the following predictive variables resulted in an increase of
Principals identifying that the “length of time required” was a barrier:
• Presence of collective bargaining (84% increase) • Master’s degree or higher in Ed Admin (32% increase) • School is “on improvement” (65% increase) • Percent of students receiving a free/reduced meal (39% increase) • Staff is dissatisfied (160% increase) • Principal lacks enthusiasm (244% increase) • Principal wants to transfer schools (37% increase) • State Department influences teacher evaluation (37% increase)
Affirmative responses to the following independent variables was most directly related to
a decrease in “time required” being a barrier:
• Principal participated in Professional Development (52% decrease) • Principal does not like the way district is run (24% decrease) • Principal wants to leave education (24% decrease) • Principal is too tired to work (34% decrease) • Curriculum Specialist influence teacher evaluation (21% decrease)
Clearly, an unenthused principal and dissatisfied staff creates the largest likelihood
that the amount of time required is a substantial barrier to dismissal. This is the third time
we have seen lack of principal “enthusiasm” as a significant detriment to the non-renewal
process. Although this work doesn’t address the elements of principal enthusiasm, this is
an area where research should be conducted.
This is the second time we have seen participation in professional development
and Curriculum Specialist influence arise as characteristics which decrease the presence

45
of barriers. A couple of inferential explanations might be that districts with professional
development programs for principals are more likely to have other supports in place to
make the process more efficient, thus reducing the time involved. Also, the support of a
Curriculum Specialist who takes on evaluation duties may allow each administrator
within a site to focus on timelines and workload, also reducing the time involved.
However, “time required” is often dictated by specific due process checkpoints, many of
which are statutory in nature and thus unable to be deviated from.
One variable surfaced as being a significant predictor across two of the three runs.
If a principal had “previous managerial experience”, the length of time required for
dismissal was less of a barrier across the principal/school characteristics and job
satisfaction variables. Thus, without the consideration of various groups’ influence on
evaluation, principals with previous managerial experience show promise.

46
d. Effort Required
Table 8: Effort Required for Documentation
“Effort Required for Documentation” represents the degree to which Principals
viewed the effort involved in documenting non-renewal as a barrier. Affirmative
responses to the following independent variables was most directly related to an increase
in “effort required” being a barrier:
Effort required 1.2304 0.002
Mean Std. Err. Coeff. O.R. Std. Err. Coeff. O.R. Std. Err. Coeff. O.R.Principal/school characteristics
Subject is Male 0.4728 0.0430 -0.3179 *** 0.7277 0.0445 -0.3377 *** 0.7134 0.0461 -0.4023 *** 0.6688Presence of collective bargaining or meet and confer relationship 1.3085 0.0419 0.3909 *** 1.4783 0.0440 0.3293 *** 1.3899 0.0459 0.2393 *** 1.2703Number of years principal spent teaching 13.1003 0.0032 0.0240 *** 1.0242 0.0034 0.0266 *** 1.0270 0.0035 0.0310 *** 1.0314Principal participated in training for aspiring Principals 0.6787 0.0488 -0.1752 *** 0.8393 0.0504 -0.1757 *** 0.8389 0.0520 -0.2346 *** 0.7909Principal participated in Professional Development 0.9847 0.2106 -0.3707 0.6903 0.2157 -0.3150 0.7298 0.2217 -0.4305 * 0.6502Years as Principal - Total 7.6904 0.0040 0.0314 *** 1.0319 0.0040 0.0270 *** 1.0274 0.0041 0.0311 *** 1.0315Years as Principal - This school 4.1389 0.0062 -0.0166 *** 0.9836 0.0064 -0.0239 *** 0.9764 0.0067 -0.0325 *** 0.9680Previous management experience 0.4341 0.0412 -0.3034 *** 0.7383 0.0430 -0.3977 *** 0.6719 0.0450 -0.3157 *** 0.7293Highest degree earned by Principal 4.4181 0.0294 -0.0113 0.9888 0.0305 0.0313 1.0318 0.0318 0.0042 1.0042Master's degree or higher in Ed Admin? 0.8386 0.0606 -0.1468 ** 0.8634 0.0643 0.1241 * 1.1322 0.0662 0.2497 *** 1.2836Principal stated that encouraging academic excellence is top priority 0.7000 0.0424 -0.0898 ** 0.9141 0.0438 -0.0515 0.9498 0.0452 0.0333 1.0339School is "on improvement" 1.3045 0.0428 0.4452 *** 1.5608 0.0447 0.4168 *** 1.5171 0.0464 0.3694 *** 1.4468Number of total suspensions during the past year 127.3481 0.0000 -0.0001 ** 0.9999 0.0000 -0.0001 ** 0.9999 0.0001 0.0000 1.0000Total number of weekly hours worked by Principal 61.3568 0.0016 0.0240 *** 1.0243 0.0017 0.0225 *** 1.0227 0.0018 0.0238 *** 1.0241Percent of students receiving a free/reduced meal 0.4300 0.0732 -0.1382 0.8709 0.0754 -0.1598 ** 0.8523 0.0775 -0.1999 ** 0.8188
Job satisfaction variablesPrincipalship is stressful 0.2080 0.0677 0.7582 *** 2.1344 0.0709 0.7535 *** 2.1245Staff is dissatisfied 0.0948 0.0826 0.8283 *** 2.2895 0.0847 0.9768 *** 2.6560Do not like way district is run 0.2880 0.0466 0.0358 1.0364 0.0480 -0.0339 0.9666Wants to leave education 0.2276 0.0545 -0.3578 *** 0.6992 0.0568 -0.2617 *** 0.7698Lacks enthusiasm 0.2853 0.0590 0.9527 *** 2.5927 0.0602 0.8439 *** 2.3255Wants to transfer schools 0.1909 0.0652 0.3552 *** 1.4265 0.0677 0.4101 *** 1.5069Too tired to work 0.1295 0.0694 -0.3290 *** 0.7197 0.0709 -0.3368 *** 0.7141
Various groups' influence on teacher evaluationState Department 2.4206 0.0261 0.1686 *** 1.1837School Board 2.5848 0.0242 0.1215 *** 1.1292District staff 2.6983 0.0258 -0.0686 *** 0.9337Principals 3.9390 0.1014 0.0081 1.0081Teachers 2.6283 0.0217 -0.0355 0.9651Curriculum Specialist 2.2576 0.0215 -0.4373 *** 0.6458Parent groups 1.7946 0.0220 0.0945 *** 1.0991
(_cons) 0.2773 0.0448 0.2833 -0.6260 0.4982 -0.1487*** p<0.010
** p<0.050* p<0.100
Model 1 Model 2 Model 3

47
• Presence of collective bargaining (27% increase) • Principal participated in training for aspiring Principals (26% increase) • Principal has Master’s degree or higher in Ed Admin (28% increase) • School is “on improvement” (45% increase) • Principalship is stressful (112% increase) • Staff is dissatisfied (165% increase) • Principal lacks enthusiasm (132% increase) • Principal wants to transfer schools (51% increase) • State Department influences teacher evaluation (18% increase)
Affirmative responses to the following independent variables was most directly related to
a decrease in “effort required” being a barrier:
• Subject is male (33% decrease) • Principal participated in professional development (35% decrease) • Principal has previous managerial experience (27% decrease) • Percent of students receiving free/reduced meal (18% decrease) • Principal wants to leave education (23% decrease) • Principal is too tired to work (29% decrease) • Curriculum Specialist influence teacher evaluation (35% decrease)
Principal “job satisfaction” characteristics (stress, dissatisfaction, lack of
enthusiasm) all show a marked increase in the presence of “effort” being a barrier. Said
plainly, principals who don’t claim to like their jobs or have the desire to do the work
find the effort to be too much. Unfortunately, citing that “effort” is a barrier only
perpetuates the presence of teachers whom the principal has indicated are poor-
performing but simply doesn’t have the energy or willingness to put forth effort to
dismiss. Over time, the continued presence of poor-performers is surely going to cause

48
the principal (and other staff members) even more dissatisfaction, lack of enthusiasm, and
desire to just move to another school. This fact presents a clear message to the educators
responsible for hiring and maintaining principals: ensuring enthusiastic, hard-working
principals who enjoy their work is the most important factor in lessening the perception
that there is too much effort required in a human resources plan that removes the worst
teachers.
Regarding characteristics leading to a decrease, again, participation in professional
development and influence on evaluation by a Curriculum Specialist result in a decrease
in presence of a barrier. There are two surprising characteristics which results in a
decrease in effort being a variable. Principals who are too tired to work and those
indicating that they wish to leave education both showed a decrease in effort being a
barrier. It is hard to suggest why these two variables showed up in this way when the
other “job satisfaction” variables all led to a very strong rise in effort being a variable
when principals indicated that they have negative feelings about their work.
There was consistency between the variable groups across all models. However,
principals with a Master’s degree or higher were 14% less likely to identify effort as a
barrier when the “job satisfaction” and “evaluation influence” barriers were not included.
With “job satisfaction” variables included, principals with advanced degrees became 13%
more likely to see effort as a barrier (a 27% increase). When adding in the “influence on
evaluation” variables, effort as a barrier increased another 14%.

49
Chapter V Conclusions, Limitations, and Implications for Future study
a. Conclusions
The purpose of this study is to determine which factors influence items that school
principals consider “barriers” to dismissal of “incompetent” or “poor performing”
teachers. This study determines if specific characteristics of schools, principals, or the job
itself can predict the specific barriers cited by principals as the reasons for renewing
contracts of poor performing teachers. Using data from the 2007-2008 Schools and
Staffing Survey, this study answers the following questions: 1) Which barriers do
principals cite as impeding dismissal of a poor-performing tenured teacher? 2) What
principal or school characteristics predict the likelihood that a principal says he/she faces
certain barriers to dismissal?
A summary table demonstrating the correlation of each predicting variable across
each outcome variable is presented in order to answer these questions. Table 4
demonstrates the effect of each predictive variable on the group of barriers to dismissal.
A “+” indicates that the predictive variable increased the odds that principals cited a
particular barrier to dismissal by at least 15%. A “-” indicates that the predictive variable
decreased the odds that principals cited a particular barrier by at least 15%.

50
Table 4: Relationship Between Principal/School Characteristics and Perceived Barriers to Dismissal
Tenure Union Presence Length of TimeEffort Required
for DocumentationPrincipal/school characteristics
Subject is Male -Presence of collective bargaining or meet and confer relationship + + + +Number of years principal spent teachingPrincipal participated in training for aspiring Principals + +Principal participated in Professional Development - + - -Years as Principal - TotalYears as Principal - This schoolPrevious management experience + -Highest degree earned by PrincipalMaster's degree or higher in Ed Admin? - + +Principal stated that encouraging academic excellence is top priority + +School is "on improvement" + + +Number of total suspensions during the past yearTotal number of weekly hours worked by PrincipalPercent of students receiving a free/reduced meal + -
Job satisfaction variablesPrincipalship is stressful - +Staff is dissatisfied + + +Do not like way district is run + -Wants to leave education + - -Lacks enthusiasm + + + +Wants to transfer schools + + +Too tired to work - -
Various groups' influence on teacher evaluationState Department + +School Board + +District staffPrincipals + -Teachers -Curriculum Specialist - - -Parent groups - +
"+" = 15% or greater increaseBlank = No significant correlation
" - " = 15% or greater decrease
Relationship Between Principal/School Characteristics and Perceived Barriers to Dismissal

51
In response to question 1, this study identified that principals cited “tenure”,
“effort required for documentation”, “union presence”, and “length of time required” as
the primary barriers to dismissal of incompetent or poor performing teachers. Survey
responses were closed-ended. No additional barriers could be offered other than the eight
responses available on the survey.
In response to question 2, principals who worked in districts where collective
bargaining and/or “meet and confer” relationships with unions existed were likely to cite
the presence of all barriers studied. Given that the primary barriers to dismissal are all
somewhat related to elements of due process, it is not surprising that the presence of the
primary group responsible for defending poor-performing or incompetent teachers would
increase the likelihood that barriers are encountered. There may be other implications as
well. Teachers working in states that require mandatory union negotiations may, by
design, be more supportive of unions than teachers who work in less unionized areas.
This could confound the barriers that principals cite encountering. In addition to the time
and effort, principals may simply not want the hassle of dealing with union proceedings
for dismissal.
Principals working in schools that are “on improvement” reported a higher
presence of three of the four barriers; all except “tenure”. Working in a low-performing
school often brings a set of challenges separate from dismissal of poor-performing
teachers. These schools may have a higher population of students from low socio-
economic backgrounds. They may be located in urban areas and have varied degrees of
52
parental support. Thus, the principal may be so occupied with quickly correcting the
school’s deficiencies that he/she simply doesn’t have the time, effort, or emotional energy
to take on lengthy non-renewal proceedings.
Generally speaking, the degree to which principals disliked their jobs was
positively correlated with the likelihood that they believed barriers to dismissal exist.
Principals who had dissatisfied staffs or wanted to transfer schools were more likely to
report facing three of the four barriers. Indicating that the principal lacked enthusiasm
increased the reporting of all barriers studied. It is not surprising that principals who self-
report that they are somehow dissatisfied also report encountering barriers to dismissal of
poor-performing teachers. Individuals who simply don’t want to come to work are
probably going to encounter barriers to everything they do regardless of other factors.
Unfortunately, the data does not show many variables that universally predict a
decrease in the likelihood that barriers to dismissal exist. Only participation in
professional development and Curriculum Specialists’ involvement in teacher evaluation
resulted in a decrease of barriers being cited in three of the four studied. As mentioned,
we don’t have specific information as to the type of professional development offered.
Perhaps districts that are more likely to extend professional learning to principals are also
likely to have other supports in place that may mitigate the effects of barriers to non-
renewal. Types of specific support from Curriculum Specialists is also an unknown in
this work, however, the reality is the simple likelihood that having another administrator
who is an expert in curriculum decreases the workload for the principal. Sharing in the

53
evaluation process surely reduces the sheer number of evaluations, allowing principals
more time and effort to address deficiencies as needed.
This study offers answers to the aforementioned research questions so that
educational leaders can make informed decisions about the individuals they choose to
serve as school principals. This is essential in order to ensure high levels of performance
from our students as well as appropriate opportunity to meet state and federal
accountability measures. Both proponents and critics of No-Child-Left-Behind would
agree that many changes to our educational model have occurred due to this legislation.
Education Secretary Arne Duncan recently commented to a group of school
Superintendents: “I’ll always give credit to NCLB for exposing achievement gaps and
advancing standards-based reform. But better than anyone, you know [the law’s]
shortcomings. NCLB allows, even encourages states to lower their standards. In too
many classrooms, it encourages teachers to narrow the curriculum. It relies too much on
bubble tests in a couple of subjects. It mislabels schools, even when they are showing
progress on important measures. NCLB requires you to intervene in schools in a
prescribed way, and the accountability system didn’t measure growth. It didn’t
differentiate between a school in a little bit of trouble with a handful of students and a
school that was in educational meltdown.”
Research has outlined the fact that good teachers positively impact students. As
the people primarily responsible for the evaluation of teachers, principals hold a great
deal of power when impacting the achievement students demonstrate. Thus, when faced
54
with determining whether or not to renew the contract of a poor performing or
incompetent teacher, principals must make difficult decisions. Although they may
encounter barriers, they must work to decrease or overcome these barriers. By
considering the predicting variables in this work, school districts may be more successful
at selecting and retaining principals who are less likely to view barriers to dismissal.
Although few characteristics were associated with a decrease in the perceived
presence of barriers, there are still important policy implications to be considered.
Barriers to dismissal of incompetent or poor performing teachers might be reduced
through a system of district support that includes participation in professional
development and support from curriculum specialists. Most importantly, it was found that
principals who were tired, un-motivated, or wanted to leave education were most likely to
report encountering barriers to dismissal. Districts should consider policy which reduces
the presence of those characteristics which increase the likelihood that principals report
barriers.
Ultimately, to address the problems caused by tolerating poor-performing and
incompetent teachers, district leaders must work to hire and support principals who can
affect classroom instruction by maintaining the highest-quality teaching staff possible.
Educational accomplishment cannot be had while perpetuating a cycle of sacrificing
outcomes for students due to tolerance of poor performance. By identifying causes for
this tolerance and analyzing the characteristics that relate to non-renewal barriers, school

55
officials can take a more proactive approach to training principals and hopefully
preventing the repetition of this behavior.

56
b. Limitations and Need for Future Study
As of early December 2011, a new round of Schools and Staffing Surveys has been
circulated to school administrators. Although the survey questionnaires are not yet
available on the National Center for Educational Statistics website, it will be interesting
to see whether questions are included relating to principal’s perceptions of teacher quality
and the rate at which teacher contracts are renewed. Probably the greatest limitation of
this work is that it was not able to account for the actual number of poor-performing
teachers who were non-renewed due to their administrator’s belief that they were, in fact,
“poor-performing” or “incompetent”.
Through the course of this project, it was hoped to collect data on principal
perception of the number of teachers in each school who fall into one of four
performance categories (Outstanding, Good, Fair, Unsatisfactory). In fact, this data was
collected as part of the 2007-2008 Schools and Staffing Survey. However, when
beginning first runs with the SASS datasets, variables measuring the numbers of teachers
in each performance category were left out of the tables by NCES. Finding this to be
unusual, we called the NCES and were told that following survey collection, they select
principals to participate in an interview process referred to as “cognitive testing”.
Essentially, principals are asked about their thought process used when answering
different questions on the survey. If principals indicate that the questions seemed biased,
or other factors contributed to their responses, NCES must determine if the questions

57
remain valid components of the data set. In the case of the teacher quality questions, they
were deemed not valid.
Interestingly, during the cognitive testing phase, principals indicated that
responses to the teacher performance questions were easy to give, but would differ with
the documentation which actually exists in each teacher’s personnel file. Thus, they
acknowledged that providing honest data on a survey would be easy but would show bias
if compared with the daily practice of teacher evaluation. Due to this realization, the
National Center for Education Statistics reportedly decided not to release data on these
survey items. This very issue drives the concerning fact that poor-performing teachers
continue to work with students while principals do not always respond constructively to
the incompetence. Hopefully, future iterations of the Schools and Staffing Survey will
reflect data on the performance levels of teachers and frequency of non-renewal. This
could then be combined to determine which barriers most impact principals who
admittedly continue the contracts of poor-performing teachers.
Because the data was not able to indicate the frequency of non-renewal of poor
performing teachers, we do not know which barriers were cited by those who non-renew
contracts more or less frequently. When a Principal or District Administrator completes a
Schools and Staffing Survey, he or she must determine which barriers were issues when
considering non-renewal of teachers who were “poor performing”. Given the admitted
inconsistencies with the way in which principals responded and the infrequency of
accurate evaluations, it is clear that the survey data does not always represent reality.

58
Another limitation is the fact that there were surely instances in the data where a
teacher was considered “poor performing” but may have caused the principal to face few
barriers to dismissal. For example, if a teacher is non-renewed for “insubordination” or
“negligence” (typically resulting from an isolated incident), that non-renewal may have
been barrier-free. Thus, principal reports on the barriers to dismissal may or may not be
reflective of whether or not any teachers were successfully non-renewed for reasons of
poor performance.
Although the Schools and Staffing Survey includes a very wide scope of data
available for analysis, the depth of some variables may beg for additional research. For
example, the question that asks principals to cite barriers of dismissal allows for
respondents to only select given answers. Principals may have specific, personal reasons
for tolerating low-performance that do not fit into one of the given responses. Thus,
additional customized surveying could be used to investigate reasons more deeply. This
survey could also address the barriers principals faced but overcame when successfully
non-renewing teachers for poor-performance.
Future research should be conducted focusing on individual principal
characteristics and the barriers they suggest to be present outside of a given list. Creating
a survey, or building a qualitative interview protocol that will yield individual data would
more accurately answer some questions on the school-level. Principals should be asked
which barriers they face, and how each of the barriers actually impact the process of non-

59
renewal. Means for decreasing the barriers cited should be discussed. Data could be
collected qualitatively from a subset of principals represented here.
A qualitative study surveying district leaders should ask leaders about supports put
into place in order to reduce the presence of barriers for principals. This study should
focus on the presence of items shown here to reduce or increase presence of barriers;
specifically, involvement in professional development, presence of curriculum
specialists, and means of increasing principal job satisfaction. Collecting narrative on the
methods used to support principals may give specific instances of district actions that
reduce the presence of barriers to dismissal of poor-performing or incompetent teachers.
Future research should also consider the characteristics of district leaders that make them
more likely to tolerate poor-performing principals. As a largely non-tenured group who
are deemed to be directly responsible for the success or failure of students measured as a
school unit, many administrators may have been non-renewed due to chronic low student
achievement or other instances of poor performance. In many circumstances, principals
clearly responded to the Schools and Staffing Survey by stating that they were dissatisfied
with their jobs, schools, and districts and were generally unenthused about doing the
work. In these cases, the biggest problem isn’t the willingness to non-renew but the fact
that there are principals practicing who clearly are not interested in doing what is best for
kids. It seems intuitive to assume that the same district expectation of a relationship
between student achievement and teacher contract decisions would extend even more
strongly to school administrators. Additional inquiry should be given to the processes
60
used to terminate administrators who have yielded low-performance in the ways
described above.

61
Works Cited
Alexander, K., & Alexander, M. D. (2009). American public school law (7th ed.).
Belmont, CA:Wadsworth.
Board of Regents v. Roth, 408 U.S. 564, 92 S.Ct. 2701, 33 L.Ed.2d 548 (1972).
Bolich, A. (2001). Reduce your losses: Help new teachers become veteran teachers.
Southern Region Education Board. http://www.sreb.org.
Braun, H. (2005). Using Student Progress to Evaluate Teachers: A Primer on Value-
Added Models. Educational Testing Service.
Bridges, E. (1992). The Incompetent Teacher. London: Routledge Falmer.
Brill, Steven. (2009). The Rubber Room: The Battle Over New York City's Worst
Teachers. The New Yorker.
http://www.newyorker.com/reporting/2009/08/31/090831fa_fact_brill.
Brown, K. (2002). Labor Relations, Trends and Issues. ERIC Clearinghouse on
Educational Management
Carini, Robert M. (2008). Is Collective Bargaining Detrimental to Student Achievement?:
Evidence from a National Study. Journal of Collective Negotiations 32:193-213.
Chetty, R; Friedman, J; and Rockoff, J. (2012) The Long-Term Impacts of Teachers:
Teacher Value-Added and Student Outcomes in Adulthood. NBER Working Paper
No. 17699
Coleman, J.; Green, M.; Molinaro, L.; Green, M. (2006). Tenure: An Important Due
62
Process Right or a Hindrance to Change in the Schools? Journal of Personnel
Evaluation in Education. 18: 219-231.
Colorado statute.
http://www.state.co.us/gov_dir/leg_dir/olls/colorado_revised_statutes.htm
Crisafulli, T. (2006). No Educator Left Unscathed: How No Child Left Behind Threatens
Educators’ Careers. Bringham Young University Education and Law Journal, 613.
Danielson, C. (2002). Enhancing student achievement: A framework for school
improvement. Alexandria, VA: Association for Supervision and Curriculum
Development.
Darling-Hammond, L. (1997). Doing what Matters Most: Investing in Quality Teaching.
New York: National Commission on Teaching and America’s Future.
Dawson, T. C., & Billingsley, K. L. (2000). Unsatisfactory performance: How
California's K-12 education system protects mediocrity and how teacher quality
can be improved. San Francisco, CA: Pacific Research Institute for Public Policy.
Duncan, Arne. (2010) American Association of School Administrators’ National
Conference on Education.
Ferchen, M. (2011). Teacher (In)Competence: An Analysis and Comparison of the
Educational, Legal, and Practical Definitions. (Doctoral Dissertation).
Ferguson, R. (1991). Paying for Public Education: New Evidence on How and Why
Money Matters. Harvard Journal on Legislation, 28(2), 465-498.
Figlio, D. and Kenny, L. (2007). Individual Teacher Incentives and Student Performance.
63
Journal of Public Economics. Volume 91, Issues 5-6. Pages 901-914.
Fullan, M. (2001). The New Meaning of Educational Change. Teachers College Press
and Routledge Falmer. New York.
Gergen, D. (1997). Chasing Better Schools. U.S. News and World Report, 123, 100.
Gillett v. U.S.D. No. 276. (1980) 227 Kan. 71, 78, 605 P.2d 105.
Haddock v. Board of Education. (1983). No. 54,325, Supreme Court of Kansas, 233 Kan.
66; 661 P.2d 368; 1983 Kan. LEXIS 284
Hallinan, M. (2008). Teacher Influences on Students’ Attachment to School. Sociology of
Education. 81: 271-283.
Hanushek, Erik A. (2009) "Teacher Deselection." In Creating a New Teaching
Profession, ed. Dan Goldhaber and Jane Hannaway: 163-180. Washington, D.C.:
Urban Institute Press.
Hanushek, E., Kain, J. & Rivkin, S. Do Higher Salaries Buy Better Teachers? (April \
1999). NBER Working Paper No. W7082
Hess, F. and Kelly, A. (2007) Learning to Lead: What Gets Taught in Principal-
Preparation Programs. Teachers College Record. Volume 109 Number 1, p. 244-
274.
Houghton Mifflin. (2005). Labor Unions.
http://college.hmco/history/readerscomp/women/html.
Ingersoll, Richard M. (2005). The Anomaly of Educational Organizations and the Study

64
Of Organizational Control. Pp. 91-110 in The Social Organization of Schooling,
edited by Larry V. Hedges and Barbara Schneider. New York, NY: Russell Sage
Foundation.
Jacob, B. & Lefgren, L. 2008. Can Principals Identify Effective Teachers? Evidence on
Subjective Performance Evaluation in Education. Journal of Labor Economics 26
no. 1.
Jacob, B. (2010). Do Principals Fire the Worst Teachers?. National Bureau of Economic
Research. http://www.nber.org/papers/w15715.
Johnson, S. (1984). Teacher Unions in Schools. Temple University Press, Philedelphia.
Johnson, S. (2010). Why Teachers Must Have an Effective Evaluation System. American
Federation of Teachers. http://aftma.net/educator-resources/teacher-evaluation/
Kan. State Bd. of Educ. v. Marsh, No. 87,553 , Supreme Court of Kansas, 274 Kan. 245;
50 P.3d 9; 2002 Kan. LEXIS 456, July 12, 2002
Kansas Statute. http://www.kslegislature.org/legsrvstatutes/getStatute.do?number=30134
Lucksinger, L. (2000). Teachers: Can We Get Them and Keep Them? The Delta Kappa
Gamma Bulletin, 67(1), 11-15.
Lavely, C., Berger, N., & Follman, J. (1992). Actual incidence of incompetent teacher.
Educational Research Quarterly, 15 (2), 11-14.
Marzano, R. and Waters, T. (2009). District Leadership that Works. Bloomington:
Solution Tree Press.
McCarthy, M., & Cambron-McCabe, N. H. (1987). Public school law: Teachers' and

65
students' rights (2nd ed.). Boston: Allyn Bacon.
McMillen v. USD 380, 855 P.2d 896 (Kan. 1993).
Menuey, Brenda, (2007). Teachers’ Perceptions of Professional Incompetence
and Barriers to the Dismissal Process. Springer Science and Business Media.
Meyer, J. and Rowan, B. (1977). Institutionalized Organizations: Formal Structure as
Myth and Ceremony. American Journal of Sociology 83:340-63.
Militello, M., et. al., (2009). If They Knew, They Would Change: How Legal Knowledge
Impacts Principals' Practice. NASSP Bulletin v. 93 no. 1: 27-52.
Mintzberg, Henry. (1983). System of Politics. Pp. 171-217 in Power in and around
Organizations. Englewood Cliffs, NJ: Prentice-Hall.
National Education Association. (2004). NEA and Academe through the Years.
http://nea.orghe/roots.html.
New Mexico statute.
http://www.conwaygreene.com/nmsu/lpext.dll?f=templates&fn=main-h.htm&2.0
Oklahoma statute. http://www.lsb.state.ok.us/
Painter, S. (2000). Principals’ Perceptions of Barriers to Teacher Dismissal. Journal of
Personnel Evaluation in Education 14, 3.
Peterson, K. (2002). The Professional Development of Principals: Innovations and
Opportunities. Educational Administration Quarterly, 38: 213.
Perry v. Sindermann, 408 U.S. 593, 92 S. Ct 2694, 33 L.Ed.2d 570 (1972).
Powers v. Mancos School Dist. RE-6, 539 F.2d at 43-44. (10th Cir. 1976).
66
Pruett v. Dumas, 914 F.Supp. 133 (N.D.Miss.1996).
Robinson, V.; Lloyd, C.; Rowe, K. (2008). The Impact of Leadership on Student
Outcomes: An Analysis of the Differential Effects of Leadership Types.
Educational Administration Quarterly, 44: 635 - 674.
Sanders, W.L. & Horn, S.P. (1998). Research Findings from the Tennessee Value-Added
Assessment System (TVAAS) Database: Implications for Educational Evaluation
and Research. Journal of Personnel Evaluation in Education 12, 247–256.
Scheer v. Independent School District no. I-26, Ottawa County, Oklahoma, 1997 OK115,
948 P.2d 275.
Scriven, M. (1967). The methodology of evaluation. In R. W. Tyler, R. M. Gagne, & M.
Scriven (Eds.), Perspectives of curriculum evaluation, 39-83. Chicago, IL: Rand
McNally.
Toch, T. (1996). Why Teachers don’t Teach. U.S. News and World Report, 120, 62-66.
Tucker, P. (2001). Helping struggling teachers. Educational Leadership, 58 (5), 52-55.
Tucker, P. D., & Kindred, K. (1997). Legal context for teacher evaluation (pp. 59-90). In
J. H. Stronge (Ed.), Evaluating teachers: A guide to current thinking and
implications for practice. Thousand Oaks, CA: Corwin Press.
Tucker, P. and Stronge, J. (2005). Linking Teacher Evaluation and Student Learning.
Alexandria, VA: Association for Supervision and Curriculum Development.
United States Department of Education. (2003). No Child Left Behind A Parent’s Guide.
http://www.ed.gov/parents/academic/involve/nclbguide/parentsguide.pdf
67
United States Department of Education. "Public School District, Public School, Public
School Principal data files," National Center for Education Statistics, Schools and
Staffing Survey. 2007–08.
United States Department of Education. (2010) A Blueprint for Reform.
http://www2.ed.gov/policy/elsec/leg/blueprint/blueprint.pdf.
U.S.D. No. 434 v. Hubbard. (1993). 19 Kan. App. 2d 323, 326, 868 P.2d 1240 255 Kan.
1007.
U.S.D. No. 500 v. Robinson. (1996). 22 Kan. App. 2d 892, 924 P.2d 651.
Utah statute. http://le.utah.gov/~code/code.htm
Wachter, M. (2003). Judging Unions? Future Using a Historical Perspective: The Public
Policy Choice between Competition and Unionization. Journal of Labor Research,
24(2), 339-357.
Weick, Karl. (1976). Educational Organizations as Loosely-Coupled Systems.
Administrative Science Quarterly 21:1-19.
Weisberg, D., Sexton, S., Mulhern, J., & Keeling, D. (2009). The Widget Effect: Our
National Failure to Acknowledge and Act on Differences in Teacher
Effectiveness. http://widgeteffect.org/downloads/TheWidgetEffect.pdf.
Wenglinsky, H. (2000). How Teaching Matters: Bringing the Classroom Back into
Discussions of Teacher Quality. Educational Testing Service, Princeton, NJ.
White, K. A. (1997). In Push for Accountability, Tenure Becomes Target. Education
Week, 16 (39), 10-11.

68
Williams, J. (2003). Why Great Teachers Stay. Educational Leadership, 60(8), 71-74.
Wright, S.P., Horn, S.P., & Sanders, W.L. (1997). Teacher and Classroom Context
Effects on Student Achievement: Implications for Teacher Evaluation. Journal of
Personnel Evaluation in Education 11, 57–67.
Wyoming statute. http://legisweb.state.wy.us/titles/statutes.htm.

69
Table 9: Variable names and purpose
Dependent variable: Barriers to dismissal of poor performing teachers Code (s-School, a-Principal) Variable description, Name Format Purpose as predicting variable a0208 Time required Y(1)/N(0) Length of time required for termination process a0209 Effort required Y(1)/N(0) Effort required for documentation a0211 Tenure Y(1)/N(0) Specifies unsatisfactory "Tenured" teachers a0212 Union presence Y(1)/N(0) Teacher associations or unions
School/demographic variables Code Variable description, Name Format Purpose as predicting variable School ID (sc_ncsid) # 9003 State (StID) Varies s0217 Free/reduced meal status (mealstat) # Number of K-12 "free/reduced" lunch students.
s0217/s0039 Free/reduced meal status (perc_mealstat) % Percent of K-12 "free/reduced" lunch students.
Independent (predicting) variables Code Variable description, Name Format Purpose as predicting variable
a228 Presence of collective bargaining or meet and confer relationship (collectbarg_meetconfer) Y(1)/N(0)
This variable may indicate the strength and type of relationship between the local teacher's union and the school district. Vander Weele (1994) notes that principals would non-renew more than 20% of teachers if it were not for the stress and cost of hearings. Another recent study by Jacob (2010) shares a practical change in the CPS where non-tenured teachers are able to be non-renewed without restriction by a collective-bargaining agreement.
a0030 Participate in training for aspiring Principals? (prin_training) Y(1)/N(0)
Question asks: Before you became a principal, did you participate in any district or school training or development program for ASPIRING school principals? Marzano and Waters (2009) describe the essential relationship between district and building-level administration. Perceptions of principal competence are positively correlated with district training.
a0034 Participate in pd - past 12 months? (prin_pd) Y(1)/N(0) Question asks: In the past 12 months, have you participated in any professional development activities?
a0027 Number of years principal spent teaching (prinyrsteach) #
Number of years each principal taught may imply a level of instructional competence or at least, knowledge. So, are principals with many years of classroom experience more or less likely to non-renew poor performing teachers?
a0025 Years as Principal - Total (yearsasprin_tot) #
Explains whether the most experienced principals are more or less likely to tolerate poor-performing teachers. Jacob (2010) notes that older principals are less likely than younger principals to dismiss teachers.
a0026 Years as Principal - This school (yearsasprin_school) #
Does the amount of time a principal spends at a particular school influence non-renewal rates the same or differently as overall tenure?
a0031
Before you became a principal, did you have any management experience outside of the field of education? (manage_exp) Y(1)/N(0)
Principals with previous managerial experience may be more apt to non-renew poor performing teachers.
a0032 Highest degree earned by Principal (highestdegree) 1,2,3,4,5,6
Explains a relationship between high degree and likelihood to non-renew. Would be measured at the district-level. Mitiello, et. al. (2009) notes that additional research is necessary to determine why many principals are uninformed or misinformed about student and teacher rights. Education is likely the most direct path to increased knowledge in these areas. Other

70
research notes that Principals from more competitive colleges are less likely to dismiss teachers (Jacob, 2010).
a0033 Master's degree or higher in Ed Admin? (degree_edadmin) Y(1)/N(0)
Those with advanced training may be less likely to deal with non-renewal barriers due to academic preparation.
a0216 School AYP status (aypstatus) Y(1)/N(0) Determines whether or not school met performance target.
a0217 School "on improvement" status (schloni) Y(1)/N(0)
Determines if sanctions are potentially in place due to failure to met performance targets. Although non-renewal frequencies will be calculated at the district level, data will show the number of poor performing teachers in schools that both made and didn't make AYP. This will test the well-researched "power of the classroom teacher" (Hallinan, 2008). Jacob (2010) notes that teacher demographics showed statistical variation particularly in low-performing schools. For example, male teachers were non-renewed at a higher frequency in low-performing elementary schools.
a0126 Number of total suspensions during the past year (stu_suspensions) #
Represents school demographics and may speak to principal behaviors as well.
a0225 Total number of weekly hours worked by Principal (hrsworked) #
Number of hours each Principal reports working in an average week. Suggests overall job effort.
a229
The stress and disappointments involved in serving as principal at this school aren’t really worth it (stress)
Likert scale recoded as binary (Strongly agree:1 - Strongly disagree:0)
Explains a number of predicting variables related to the job efficacy of each principal
a230
The faculty and staff at this school like being here; I would describe them as a satisfied group (staff_satis)
Likert scale recoded as binary (Strongly agree:1 - Strongly disagree:0)
a231 I like the way things are run in this district (like_dist)
Likert scale recoded as binary (Strongly agree:1 - Strongly disagree:0)
a232 If I could get a higher paying job I’d leave education as soon as possible (leave_ed)
Likert scale recoded as binary (Strongly agree:1 - Strongly disagree:0)
a234
I don’t seem to have as much enthusiasm now as I did when I began my career as a principal (prin_enthu)
Likert scale recoded as binary (Strongly agree:1 - Strongly disagree:0)
a233 I think about transferring to another school (trans_schl)
Likert scale recoded as binary (Strongly agree:1 - Strongly disagree:0)
a235 I think about staying home from school because I’m just too tired to go (prin_tired)
Likert scale recoded as binary (Strongly agree:1 - Strongly disagree:0)
a0065 Various groups' influence on teacher evaluation - State Department (evalinflu_stateboard)
Likert scale (No influence:1 -Major influence:4)
This variable may give an indication of the autonomy a principal has to evaluate a teacher. Bridges (1994) notes that “supervisor ratings and observations” is the most frequently reported tool that school districts use to identify incompetent teachers. Other research suggests “…if principals had greater autonomy with regard to hiring and promotion decisions, there is some evidence that they would be able to distinguish between the most and least effective teachers in their buildings (Jacob and Lefgren 2008). Fullan (2001) notes that the purpose of teacher evaluation is to produced shared knowledge through interaction, so that teachers can solve real-world problems.
a0066 Various groups' influence on teacher evaluation - School Board (evalinflu_schoolboard)
Likert scale (No influence:1 -Major influence:4)
This variable may give an indication of the autonomy a principal has to evaluate a teacher.

71
a0067 Various groups' influence on teacher evaluation - District staff (evalinflu_districtstaff)
Likert scale (No influence:1 -Major influence:4)
This variable may give an indication of the autonomy a principal has to evaluate a teacher.
a0068 Various groups' influence on teacher evaluation - Principals (evalinflu_principal)
Likert scale (No influence:1 -Major influence:4)
This variable may give an indication of the autonomy a principal has to evaluate a teacher.
a0069 Various groups' influence on teacher evaluation - Teachers (evalinflu_teachers)
Likert scale (No influence:1 -Major influence:4)
This variable may give an indication of the autonomy a principal has to evaluate a teacher.
a0070 Various groups' influence on teacher evaluation - Curriculum Specialist (evalinflu_currspecial)
Likert scale (No influence:1 -Major influence:4)
This variable may give an indication of the autonomy a principal has to evaluate a teacher.
a0071 Various groups' influence on teacher evaluation - Parent groups (evalinflu_parents)
Likert scale (No influence:1 -Major influence:4)
This variable may give an indication of the autonomy a principal has to evaluate a teacher.
Principal and School variables Principal job satisfaction Influence on Evaluation