PRINCIPAL INVESTIGATOR: Fengshan Liu, Ph.D., … · PRINCIPAL INVESTIGATOR: Fengshan Liu, Ph.D.,...
57
AD_________________ Award Number: W81XWH-09-1-0062 TITLE: Image Based Biomarker of Breast Cancer Risk: Analysis of Risk Disparity among Minority Populations PRINCIPAL INVESTIGATOR: Fengshan Liu, Ph.D., Xiquan Shi, Ph.D., Charlie Wilson, Ph.D. , Dragoljub Pokrajac, Ph.D., Predrag Bakic, Ph.D., Andrew Maidment, Ph.D. , CONTRACTING ORGANIZATION: Delaware State University Dover, DE 19901 REPORT DATE: March 2013 TYPE OF REPORT: Annual PREPARED FOR: U.S. Army Medical Research and Materiel Command Fort Detrick, Maryland 21702-5012 DISTRIBUTION STATEMENT: (Check one) ■ Approved for public release; distribution unlimited The views, opinions and/or findings contained in this report are those of the author(s) and should not be construed as an official Department of the Army position, policy or decision unless so designated by other documentation.
Transcript of PRINCIPAL INVESTIGATOR: Fengshan Liu, Ph.D., … · PRINCIPAL INVESTIGATOR: Fengshan Liu, Ph.D.,...
AD_________________
Award Number: W81XWH-09-1-0062
TITLE: Image Based Biomarker of Breast Cancer Risk: Analysis of
Risk Disparity among Minority Populations
PRINCIPAL INVESTIGATOR: Fengshan Liu, Ph.D., Xiquan Shi, Ph.D., Charlie Wilson, Ph.D. ,
Dragoljub Pokrajac, Ph.D., Predrag Bakic, Ph.D., Andrew Maidment, Ph.D.
,
CONTRACTING ORGANIZATION: Delaware State University
Dover, DE 19901
REPORT DATE: March 2013
TYPE OF REPORT: Annual
PREPARED FOR: U.S. Army Medical Research and Materiel Command
Fort Detrick, Maryland 21702-5012
DISTRIBUTION STATEMENT: (Check one)
■ Approved for public release; distribution unlimited
The views, opinions and/or findings contained in this report are
those of the author(s) and should not be construed as an official
Department of the Army position, policy or decision unless so
designated by other documentation.

REPORT DOCUMENTATION PAGE Form Approved
OMB No. 0704-0188 Public reporting burden for this collection of information is estimated to average 1 hour per response, including the time for reviewing instructions, searching existing data sources, gathering and maintaining the data needed, and completing and reviewing this collection of information. Send comments regarding this burden estimate or any other aspect of this collection of information, including suggestions for reducing this burden to Department of Defense, Washington Headquarters Services, Directorate for Information Operations and Reports (0704-0188), 1215 Jefferson Davis Highway, Suite 1204, Arlington, VA 22202-4302. Respondents should be aware that notwithstanding any other provision of law, no person shall be subject to any penalty for failing to comply with a collection of information if it does not display a currently valid OMB control number. PLEASE DO NOT RETURN YOUR FORM TO THE ABOVE ADDRESS. 1. REPORT DATE March 2013
2. REPORT TYPEAnnual
3. DATES COVERED 1 March 2012 – 28 February 2013
4. TITLE AND SUBTITLE
5a. CONTRACT NUMBER
Image Based Biomarker of Breast Cancer Risk: Analysis of Risk Disparity among Minority Populations
5b. GRANT NUMBER W81XWH-09-1-0062
5c. PROGRAM ELEMENT NUMBER
6. AUTHOR(S)
5d. PROJECT NUMBER
Fengshan Liu, Xiquan Shi, Charlie, Wilson, Dragoljub Pokrajac, Predrag Bakic, Andrew Maidment
5e. TASK NUMBER
E-Mail: [email protected]
5f. WORK UNIT NUMBER
7. PERFORMING ORGANIZATION NAME(S) AND ADDRESS(ES)
8. PERFORMING ORGANIZATION REPORT NUMBER
Delaware State University Dover, DE 19901
9. SPONSORING / MONITORING AGENCY NAME(S) AND ADDRESS(ES) 10. SPONSOR/MONITOR’S ACRONYM(S)U.S. Army Medical Research and Materiel Command Fort Detrick, Maryland 21702-5012 11. SPONSOR/MONITOR’S REPORT
NUMBER(S) 12. DISTRIBUTION / AVAILABILITY STATEMENT Approved for Public Release; Distribution Unlimited 13. SUPPLEMENTARY NOTES
14. ABSTRACT This year we continue our partnership between Delaware State University and University of Pennsylvania. We finalized ACRIN data transfer on MIRC and resolved issues with various batch transfers. We performed a preliminary query of the ACRIN data aimed at identifying the prevalence of women with incomplete visualization of the breast. We developed a code to estimate the breast cancer risks using the demographic metadata information from the ACRIN cases. We estimated breast densities for GE mammograms from the ACRIN database, using the software developed at the University of Pennsylvania. A novel breast image registration method is proposed to obtain a composite mammogram from several images with partial breast coverage, for the purpose of accurate breast density estimation. We designed a method to improve thickness control of the Cooper’s ligaments in the simulation algorithm by reducing “dents” on the ligaments’ surface.
15. SUBJECT TERMS Breast Cancer, Risk Disparity, Minority Population, Image-Based Biomarker, Training Program
16. SECURITY CLASSIFICATION OF:
17. LIMITATION OF ABSTRACT
18. NUMBER OF PAGES
19a. NAME OF RESPONSIBLE PERSONUSAMRMC
a. REPORT U
b. ABSTRACT U
c. THIS PAGEU
UU
47
19b. TELEPHONE NUMBER (include area code)
Table of Contents
Page
1. Introduction …………………………………………………….……….………..….. 1
2. Body …………………………………………………………….…………………….. 1
2.1 Objective 1 ....................................…….....………………….…………….…….. 1
2.2 Objective 2 ....................................…….....………………….…………….…….. 3
2.3 Objective 3 .............................................................................................................. 17
3. Important Findings ...................................................................................................... 18
4. Reportable Outcomes…………………………………………………………...…… 18
5. Conclusion……………………………………………………...…………………… 19
6. References……………………………………………………....…………………… 20
7. Appendices…………………………………………………...………………………. 20
1
1. Introduction
This year we continue our partnership between Delaware State University and University of Pennsylvania. We
finalized ACRIN data transfer on MIRC and resolved issues with various batch transfers. We performed a
preliminary query of the ACRIN data aimed at identifying the prevalence of women with incomplete
visualization of the breast. We developed a code to estimate the breast cancer risks using the demographic
metadata information from the ACRIN cases. We estimated breast densities for GE mammograms from the
ACRIN database, using the software developed at the University of Pennsylvania. A novel breast image
registration method is proposed to obtain a composite mammogram from several images with partial breast
coverage, for the purpose of accurate breast density estimation. We designed a method to improve thickness
control of the Cooper’s ligaments in the simulation algorithm by reducing “dents” on the ligaments’ surface.
2. Body
With this funded project, we will enhance DSU breast cancer research resources by: improving our expertise in
translational and clinical breast cancer research; developing methods for computing image-based biomarkers for
breast cancer risk, as well as methods for biomarker analysis of risk disparity; developing a database of clinical
biomarkers computed from images of minority women; refining the existing and developing novel data mining
techniques to determine the relationship between risk and image-based biomarkers. The improvement will
support further growth of a sustained breast cancer research program at DSU and help establish us as a
mid-Atlantic center for analysis of breast cancer risk and risk disparity among minority women.
The specific objectives of this training program include: (1) extending the skills of a select cadre of DSU
faculty, so that they may become accomplished, influential and competitive breast cancer researchers; (2)
establishing an independent breast cancer research program at DSU by performing a joint DSU–UPENN
research project focused on breast cancer risk disparity in minority populations; and (3) producing a corpus of
high quality published work and develop a portfolio of independently funded research grants at DSU to support
a sustained breast cancer research program.
2.1 Objective 1
Extend the skills of a select cadre of Delaware State University (DSU) faculty, so that we may become
accomplished, influential, and competitive breast cancer researchers.
Organize specific training for selected DSU faculty, aimed at complementing our individual scientific
background. (Y1-4); and
2
Augment the faculty training by frequent communications with collaborating mentors and other
renowned breast cancer researchers, by: (Y1-4)
2.1.1 Seminars and Conferences attended
On July 8-11, 2012, Dr. Pokrajac and Mr. Chen attended and presented the IWDM 2012, the 11th
International Workshop on Breast Imaging, in Philadelphia, PA.
The first presentation entitled “Toward Breast Anatomy Simulation using GPU” (co-authored by
J. Chu, D. Pokrajac, A. D. Maidment, P. Bakic) described the development of highly-parallel
GPU simulation of software breast phantoms.
The second presentation entitled “Simulation of Three Materials Partial Volume
Averaging in a Software Breast Phantom” (co-authored by F. Chen, D. Pokrajac, X. Shi, F. Liu,
A. D. Maidment, P. Bakic) described the development of simulation for voxels containing three
different materials in a software phantom.
These two presentations are also published in Springer Lecture Notes in Computer Science 7361, edited by
Gavenonis, Sara, Bakic, Predrag R. and Maidment, Andrew D.A., 2012.
On February 9-14, 2013, Dr. Pokrajac attended and presented the 2013 SPIE Medical Imaging
conference in Orlando, FL.
The first presentation entitled “Breast image registration by using non-linear local affine
transformation” (co-authored by F. Chen, P. Zheng, P. Xu, D. Pokrajac, P. R. Bakic, Andrew D.
A. Maidment, F. Liu, X. Shi) discusses a novel method for registration of mammograms.
The second presentation entitled “Two methods for simulation of dense tissue distribution in
software breast phantoms,” (co-authored by J. Chui, R. Zeng, D. Pokrajac, S. Park, K. J. Myers,
A. D. A. Maidment, P. R. Bakic) described the comparison of two techniques for simulation of
dense tissue distribution with the distribution from clinical images.
These two presentations are also published in Proceedings of SPIE Volume 8668, 2013.
3
2.1.2 DSUPENN Breast Cancer Seminar
Task-based strategy for optimized contrast enhanced breast imaging: Analysis of six imaging techniques for
mammography and tomosynthesis, January 17, 2013
Speaker:
Lynda Ikejimba,
Medical Physics Graduate Program
Ravin Advanced Imaging Laboratories
Duke University
2.2 Objective 2
Establish an independent breast cancer research program at DSU by performing a joint DSU/Penn
research project focused on breast cancer risk disparity in minority populations
Obtain appropriate IRB approvals for the proposed research. (months 1-6 of Y1)
Included in Year 1 Report.
Develop a database of anonymized clinical mammograms and patient metadata, obtained retrospectively
from ACRIN DMIST and Penn PPG trials. (Y1-Y2)
Included in Year 2 Report.
Exploratory study (Drs. Wilson, Pokrajac, and Liu) Explore potential racial differences
in genetic determinants of breast density. (Y2-Y4)
2.2.1 Analysis of Mammographic Images and Clinical Metadata of All Minority Women and the Age-
Matched Caucasian Controls from the ACRIN DMIST Database
We finalized ACRIN data transfer on MIRC and resolved issues with various batch transfers. During the
transfer some of the studies from ACRIN data were reported as having ‘invalid’ images, related to problems
with encoding in the MIRC database. Some cases did not get merged in the correct MIRC folders. Those cases
were reviewed and if needed pushed manually to ensure correct uploading. In addition, the DICOM import
service periodically got interrupted, which required to restart the MIRC automatic importing service. VB script
problem: XML files from ACRIN Data occasionally did not get parsed correctly.
We performed a preliminary query of the ACRIN data aimed at identifying the prevalence of women with
incomplete visualization of the breast. Here is the summary of the results from this query:
The total number of uploaded cases with more than 4 Dicoms images is 3845; 267 of them are
aggregated duplicates (files belong to the same patient but were divided in various folders);
4
The number of cases with multiple images (>4) and no aggregation is 3578;
About 30% of the cases have been checked manually to confirm partial visualization;
If the number of DICOMs is less than 9, partial visualization is present in about 10% of the cases;
Our estimation is that that about 500-550 out of 3845 cases have partial breast visualization which is
approximately 5-8% of all cases.
There are 4406 patients who have four or less DICOM images with MLO-position. The algorithm we
employed to compute density is more suitable for MLO-position images than CC-position.
We have also developed a code to estimate the breast cancer risks using the demographic metadata information
from the ACRIN cases. The risk estimation is based upon the Gail risk model, currently used by the National
Cancer Institute. Our code has been developed as a wrapper script around the Java software for the Gail risk
estimation (downloaded from the hughesriskapps.net). The risk estimation method uses as its input the patient's
age, the age of the menarche, the age of the first live-birth, the number of biopsies, the number of first-degree
relatives with cancer; the information about previous biopsies with hyperplasia, and the race. See Figure 7 and
Figure 8.
These corresponding information was read from the metadata accompanying the ACRIN database of images. In
cases of missing information, we followed the instructions in the Gail risk model and used the “UNKNOWN”
entry.
We estimated breast densities for GE mammograms from the ACRIN database, using the software developed at
the University of Pennsylvania. The total number of processed images (both MLO and CC) was 24945. For the
same images, we calculated risk estimation using the Gail model.
For patients with 2 MLO paired images (left and right) we performed and computed:
Comparison of Histograms of average and minimal densities for different racial group
Correlations between estimated minimal and average densities and the lifetime risk estimated by GAIL
model for all the samples, and for racial groups
Scatter plots of estimated densities on left and right breast for all the samples, and for racial groups
Correlations of estimated densities on L and R images with demographic variables all the samples
Correlations of estimated densities on L and R images with demographic variables for different racial
groups when density was <80%

5
For patients with more than 2MLO images:
Correlations between estimated minimal and average densities and the lifetime risk estimated by GAIL
model
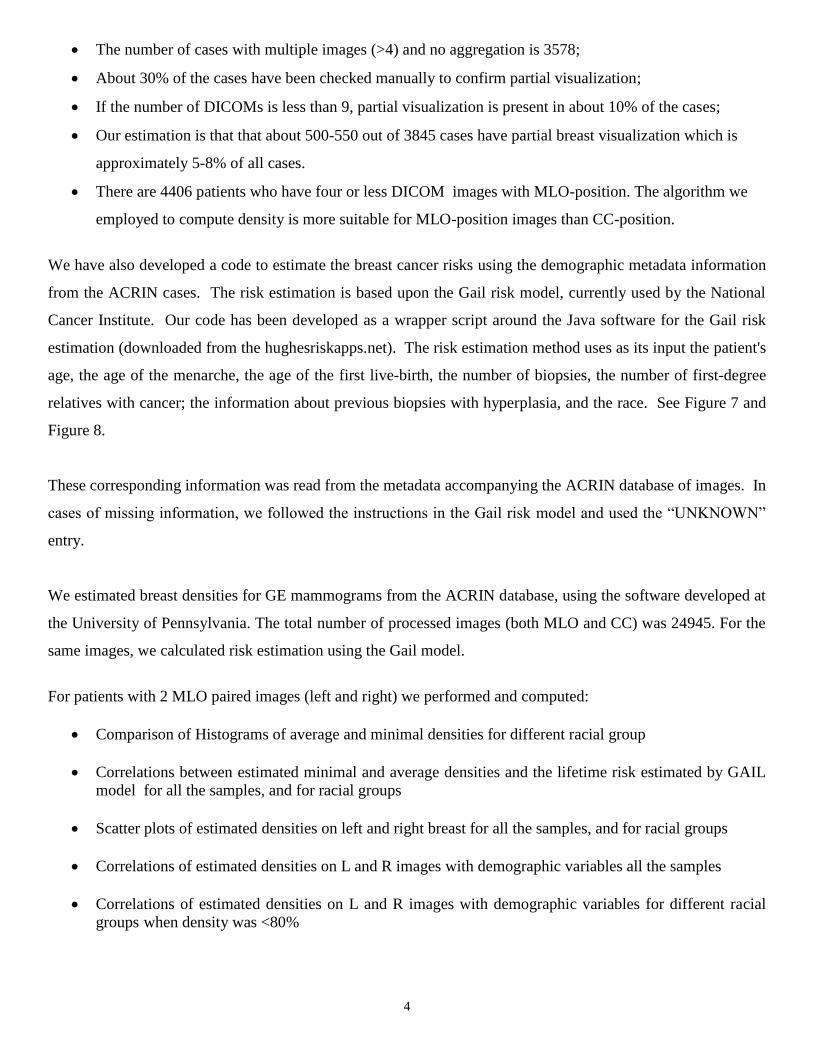
The preliminary results indicated that there is no sufficient statistical evidence that the distribution of breast
densities in African-Americans population differs from the distribution in Caucasian population, see Figure 1 to
Figure 4. And the breast density distribution does not vary with age groups, see Figure 5 and Figure 6. The
obtained correlations between estimated minimal and average densities and the lifetime risk estimated by GAIL
model were small but statistically significant both for general population and for African-Americans, see Figure
7 and Figure 8. Correlations between estimated densities on left and right breasts were high and statistically
significant.
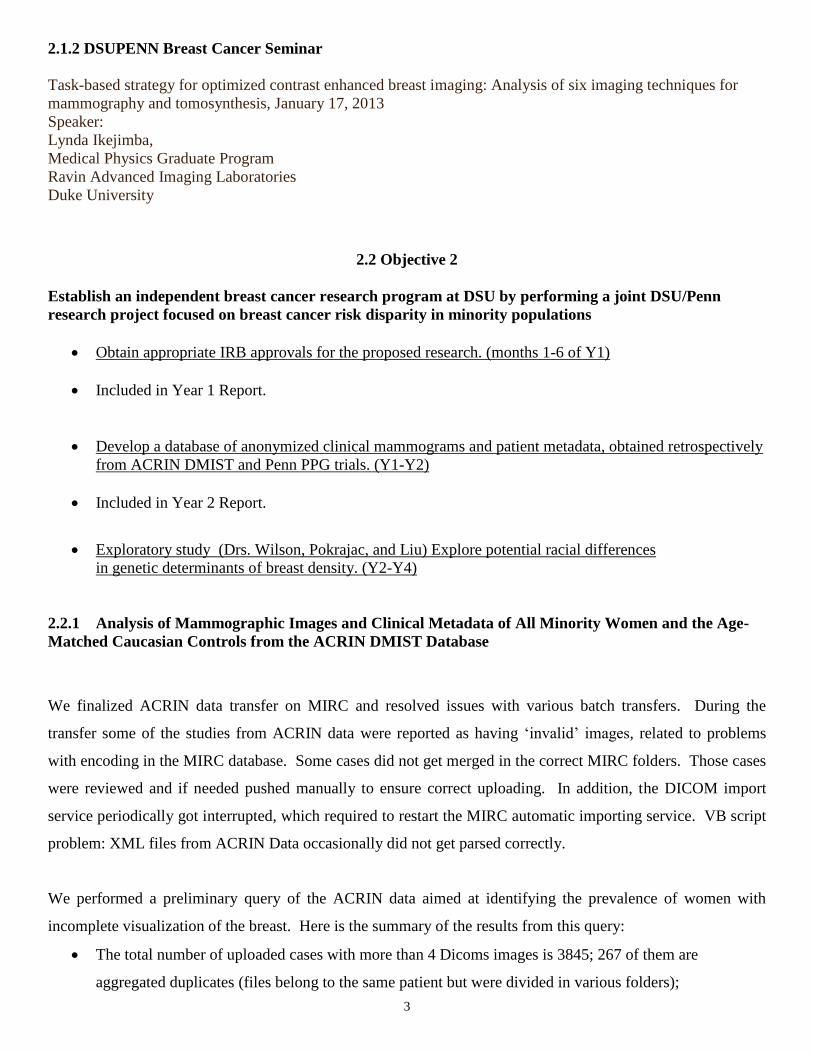
If we treat women’s breast density as a random variable, after we normalize the frequency and perform interpolation on
the histogram graph (see Figure 1), we obtain this probability distribution of breast density (see Figure 2). From the
figures, we can see that it is most common that women’s breast density is around 25%, and it is unlikely a woman’s
breast density is around 0%, 80% or 100%. The significance of this plot is to help medical doctors to establish a profile
about breast density in order to tell whether a given density case is “normal”, “abnormal”, “common” or “rare”. All of the
above show that the probability distribution of breast density, unlike breast volume, remains relatively independent of
race and age (see Figure 6).
Figure 1 The histogram of breast density computed from all 4406 MLO-position images.

6
Figure 2 The probability distribution of breast density.
Figure 3 The histogram of breast density for African American. Sample size=1568. It looks similar to Fig 1 for all
races combined.
7
Figure 4 The probability distribution of breast density for African American.
Figure 5 The histogram of breast density of women over 60 years old. Sample size=1147.

8
Figure 6 The probability distribution of breast density for women over 60 years old.
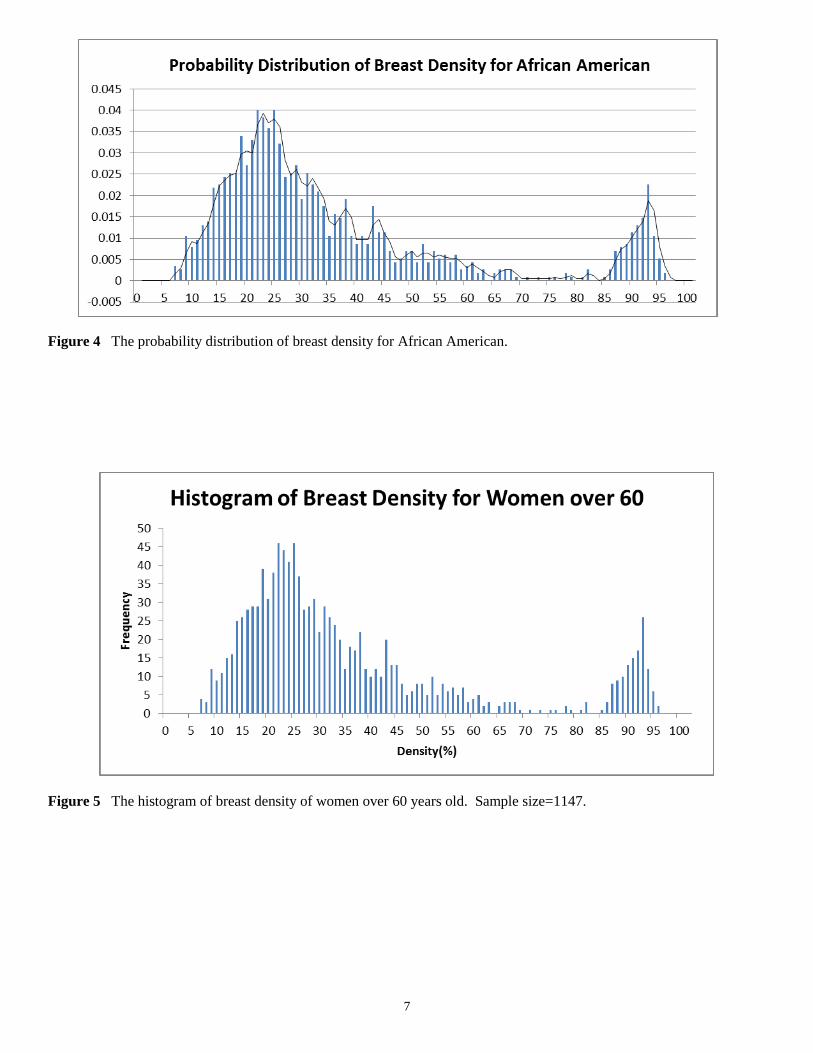
Figure 7 This figure shows that, for all 4406 MLO-position samples, the breast density and the life-time breast cancer
risk estimated by using the Gail’s model are weakly but significantly correlated to each other .
9
Figure 8 The correlation is slightly weaker for African Americans.
In Figure 1, the second peak in the range (85%, 96%) seems unnatural, and about 10% of patients have this
“suspiciously unnatural” density. This percentage is roughly the percentage of women in the same age window
in USA who have plastic surgery of breast. It is also known that the implants affect mammogram in some
degree. Therefore, the plastic surgery could be the reason for this “suspicious” peak in the probability
distribution. However, we see this peak for all races and all age groups(some are shown below). Therefore, it
remains uncertain if the second peak is unnatural.
2.2.2 Mammogram Image Registration/Fusion
A novel breast image registration method is proposed to obtain a composite mammogram from several images
with partial breast coverage, for the purpose of accurate breast density estimation. The breast percent density
estimated as a fractional area occupied by fibroglandular tissue has been shown to be correlated with breast
cancer risk. Some mammograms, however, do not cover the whole breast area, which makes the interpretation
of breast density estimates ambiguous. One solution is to register and merge mammograms, yielding complete
breast coverage. Due to elastic properties of breast tissue and differences in breast positioning and deformation
during the acquisition of individual mammograms, the use of linear transformations does not seem appropriate
for mammogram registration. Non-linear transformations are limited by the changes in the mammographic
projections pixel intensity with different positions of the focal spot. We propose a novel method based upon
non-linear local affine transformations. Our algorithm requires that feature points be extracted prior to
registration, and the result of registration will depend on the reliability and accuracy of the extracted features.
Automatic identification and extraction of feature points is difficult due to the non-linear compression
10
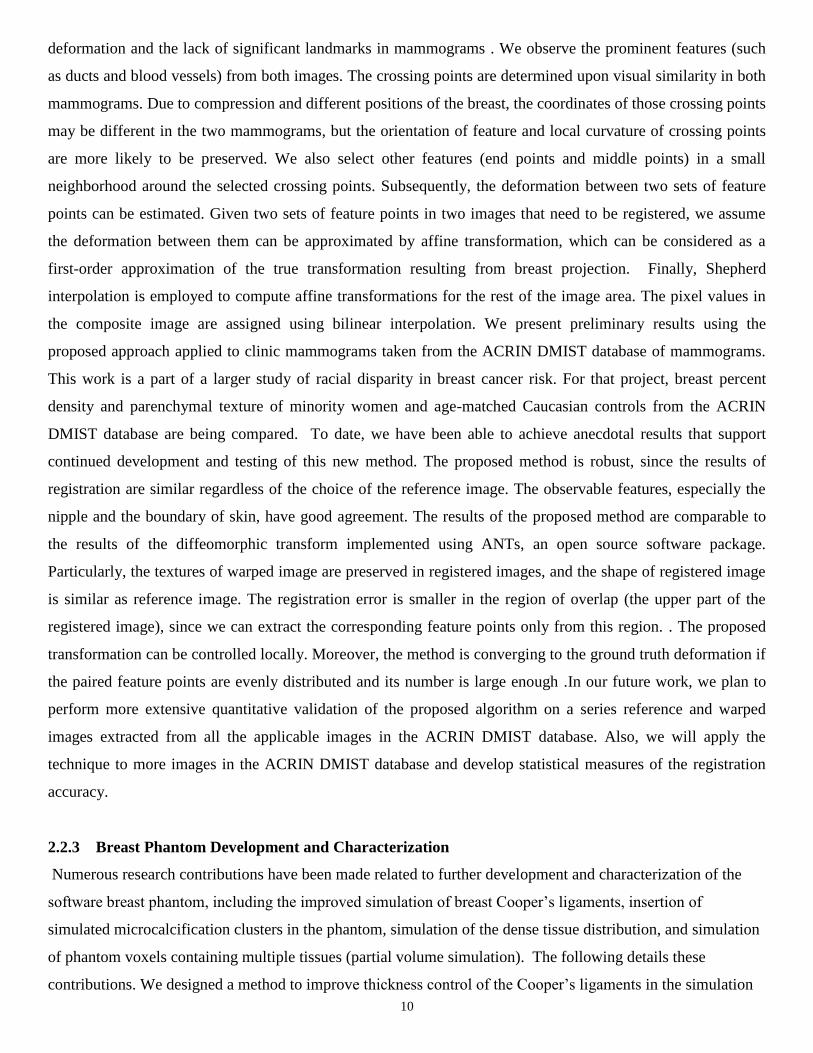
deformation and the lack of significant landmarks in mammograms . We observe the prominent features (such
as ducts and blood vessels) from both images. The crossing points are determined upon visual similarity in both
mammograms. Due to compression and different positions of the breast, the coordinates of those crossing points
may be different in the two mammograms, but the orientation of feature and local curvature of crossing points
are more likely to be preserved. We also select other features (end points and middle points) in a small
neighborhood around the selected crossing points. Subsequently, the deformation between two sets of feature
points can be estimated. Given two sets of feature points in two images that need to be registered, we assume
the deformation between them can be approximated by affine transformation, which can be considered as a
first-order approximation of the true transformation resulting from breast projection. Finally, Shepherd
interpolation is employed to compute affine transformations for the rest of the image area. The pixel values in
the composite image are assigned using bilinear interpolation. We present preliminary results using the
proposed approach applied to clinic mammograms taken from the ACRIN DMIST database of mammograms.
This work is a part of a larger study of racial disparity in breast cancer risk. For that project, breast percent
density and parenchymal texture of minority women and age-matched Caucasian controls from the ACRIN
DMIST database are being compared. To date, we have been able to achieve anecdotal results that support
continued development and testing of this new method. The proposed method is robust, since the results of
registration are similar regardless of the choice of the reference image. The observable features, especially the
nipple and the boundary of skin, have good agreement. The results of the proposed method are comparable to
the results of the diffeomorphic transform implemented using ANTs, an open source software package.
Particularly, the textures of warped image are preserved in registered images, and the shape of registered image
is similar as reference image. The registration error is smaller in the region of overlap (the upper part of the
registered image), since we can extract the corresponding feature points only from this region. . The proposed
transformation can be controlled locally. Moreover, the method is converging to the ground truth deformation if
the paired feature points are evenly distributed and its number is large enough .In our future work, we plan to
perform more extensive quantitative validation of the proposed algorithm on a series reference and warped
images extracted from all the applicable images in the ACRIN DMIST database. Also, we will apply the
technique to more images in the ACRIN DMIST database and develop statistical measures of the registration
accuracy.
2.2.3 Breast Phantom Development and Characterization
Numerous research contributions have been made related to further development and characterization of the
software breast phantom, including the improved simulation of breast Cooper’s ligaments, insertion of
simulated microcalcification clusters in the phantom, simulation of the dense tissue distribution, and simulation
of phantom voxels containing multiple tissues (partial volume simulation). The following details these
contributions. We designed a method to improve thickness control of the Cooper’s ligaments in the simulation

11
algorithm by reducing “dents” on the ligaments’ surface. The method is based on more accurate determination
of the ligament closest to the cubic region and utilization of the exact distance to the ligament instead of the
linear approximation. The method is currently under test, see Figure 9.
Figure 9 (a) Dent-shaped artifacts visible on a section of 100μm phantom; (b) The novel algorithm eliminates the dent-
shaped artifact; (c) Measurement of Cooper’s ligament thickness; and (d) Target and measured average thicknesses of the
ligaments for various phantom resolutions and voxel sizes.
We developed and preliminary tested a method for automatic insertion of simulated calcifications into a
voxelized phantom, see Figure 10. Also, we developed an algorithm for insertion of calcifications into an oct-
tree based phantom, see Figure 11. We worked on replacement of commercial software for phantom
deformation (Abaqus) with open-source and in-house solutions.
(a) (b) (c) Figure 10 (a) An example of a malignant a calcification cluster extracted from clinical images. Details of synthetic
images of a phantom with an embedded cluster: (b) DM; and (c) a reconstructed DBT image.

12
Figure 11 (a) 2D illustration of a calcification cluster binary image (black circles), minimal bounding rectangle (dashed)
and the sub-volume corresponding to an octree node of the phantom (bold); (b) Octree corresponding to the cluster; (c)
The selected phantom node for cluster placement (black circle); (d) Octree of the phantom with the cluster after insertion.
We have compared two methods for simulation of dense tissue distribution in a software breast phantom: (1) the
previously used Gaussian distribution centered at the phantom nipple point, and (2) the combination of two Beta
functions, one modeling the dense tissue distribution along the chest wall-to-nipple direction, and the other
modeling the radial distribution in each coronal section of the phantom, see Figure 12. Dense tissue
distributions obtained using these methods have been compared with distributions reported in the literature
estimated from the analysis of breast CT images. Qualitatively, the two methods produced rather similar dense
tissue distributions. The simulation based upon the use of Beta functions provides more control over the
simulated distributions through the selection of the various Beta function parameters. Both methods showed
good agreement to the clinical data, suggesting both provide a high level of realism, see Figure 13. Preliminary
results have been published in [Chui et al., SPIE 2013; listed in Section 4 as Ref. #4].
a) b) c)
Figure 12 Probability maps of compartments labeled as dense tissues: a) Gaussian b) Beta1 and c) Beta 2.
…
…
…
… … …
…
… … …
…
… (a) (b) (c) (d)

13
a) b)
Figure 13 Profiles of average normalized covariance matrices in a) posterior-to-anterior direction; and b) top-to-bottom
direction from simulated data created with Beta1 method and clinical data (modified from Freed et al. [11]). FWHMs
measured from clinical data are 0.450(posterior-to-anterior) and 0.466 (top-to-bottom). FWHMs measured from simulated
data using Beta1 are 0.433 (posterior-to-anterior) and 0.366 (top-to-bottom).
Further modification to our simulation algorithm is proposed, in order to improve the quality of simulated
projections generated using software breast phantoms. Anthropomorphic software breast phantoms have
been used for quantitative validation of breast imaging systems. Previously, we developed a novel algorithm for
breast anatomy simulation, which did not account for the partial volume (PV) of various tissues in a voxel, see
Figure 14; instead, each phantom voxel was assumed to contain single tissue type. As a result, phantom
projection images displayed notable artifacts near the borders between regions of different materials,
particularly at the skin-air boundary. These artifacts diminished the realism of phantom images. One solution is
to simulate smaller voxels. Reducing voxel size, however, extends the phantom generation time and increases
memory requirements. We achieved an improvement in image quality without reducing voxel size by the
simulation of PV in voxels containing more than one simulated tissue type, see Figure 15. The linear x-ray
attenuation coefficient of each voxel is calculated by combining attenuation coefficients proportional to the
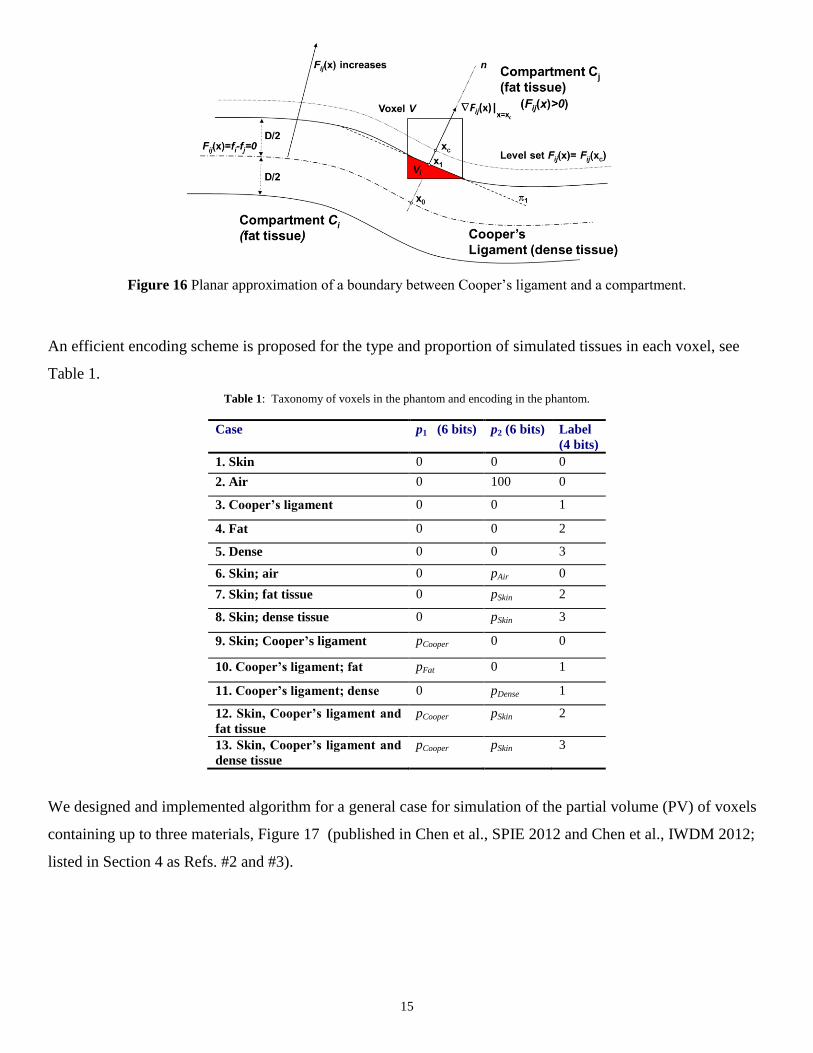
voxel subvolumes occupied by the various tissues. A local planar approximation of the boundary surface is
employed, see Figure 16, and the partial volume in each voxel is computed by decomposition into simple
geometric shapes.

14
Figure 14 Possible cases of voxels containing multiple materials (partial volume voxels) in a breast phantom.
(a) (b) (c) (d)
Figure 15 Simulated projections of (a) a phantom with 400μm voxels and no PV; (b) the phantom from (a) with simulated
PV; and (c) the same phantom generated at 200 μm voxels and no PV. (d) The difference between (a) and (b); the image
contrast was enhanced for display purposes.
15
Figure 16 Planar approximation of a boundary between Cooper’s ligament and a compartment.
An efficient encoding scheme is proposed for the type and proportion of simulated tissues in each voxel, see
Table 1.
Table 1: Taxonomy of voxels in the phantom and encoding in the phantom.
Case p1 (6 bits) p2 (6 bits) Label
(4 bits)
1. Skin 0 0 0
2. Air 0 100 0
3. Cooper’s ligament 0 0 1
4. Fat 0 0 2
5. Dense 0 0 3
6. Skin; air 0 pAir 0
7. Skin; fat tissue 0 pSkin 2
8. Skin; dense tissue 0 pSkin 3
9. Skin; Cooper’s ligament pCooper 0 0
10. Cooper’s ligament; fat pFat 0 1
11. Cooper’s ligament; dense 0 pDense 1
12. Skin, Cooper’s ligament and
fat tissue
pCooper pSkin 2
13. Skin, Cooper’s ligament and
dense tissue
pCooper pSkin 3
We designed and implemented algorithm for a general case for simulation of the partial volume (PV) of voxels
containing up to three materials, Figure 17 (published in Chen et al., SPIE 2012 and Chen et al., IWDM 2012;
listed in Section 4 as Refs. #2 and #3).

16
Figure 17 Partial volume Vi of the voxel V above planes 1 and 2 and containing vertex v. S1, S2 and S3(here S3=0) are
surface areas of parts of the volume boundary belonging to voxel sides 1, 2 and 3 that do not contain the vertex v.
We developed a method for validation of partial volume computation based on the Monte Carlo simulation and
demonstrated that the accuracy of the computation is close to one determined by the discretization error. We
also studied computation of partial volumes based on the Monte Carlo and developed technique to determine
the parameters of the Monte Carlo simulation in order to achieve a specified accuracy.
We worked on improving linear approximation of the distance between a voxel and the surface of the Cooper’s
ligaments. We derived an exact formula for the gradient of the surface of the ligament. The preliminary results
demonstrated improvements in computed partial volumes due to utilization of the improved linear
approximation.
We developed a highly-parallel implementation of the algorithm based on GPU architecture in order to reduce
the time needed to generate software breast phantoms. The rapid generation of high resolution phantoms is
needed to support virtual clinical trials of breast imaging systems. We compared the performance of GPU
implementation with the single- and multi-threaded CPU C/C++ implementation and observed significant
speedups, see Figure18 which made it possible to generate phantoms at the resolutions of 12.5 μm. The results
of the parallel implementation have been published in [Chui et al., SPIE 2012 and Chui et al., IWDM 2012;
listed in Section 4 as Refs. #1 and #5].

17
(a) (b) (c) Figure 18 (a) Cross-sections of a simulated 25μm phantom; (b) Projection of a simulated 200μm phantom; (c) Average simulation times expressed as a function of voxel size for different implementations of the octree-based algorithm.
We worked on theoretical properties of the proposed oct-tree based recursive partitioning simulation algorithm.
Currently, we are working on proving its quadratic computational complexity and asymptotic optimality using
the fractal theory.
Prepare peer-review publications on the results of the proposed research. (Y3-Y4)
While working on the current research, we have prepared several publications about our results. These
publications are listed in the section on “Reportable Outcomes”.
Validate success of the research training program by annual teleconferences with and bi-annual visits by
external Advisory Committee.
DSU faculty had by-monthly teleconference during 2012 year. The teleconferences will be continued in 2013.
Our collaborative work (particularly during Dr. Pokrajac's sabbatical leave from DSU to work with
Dr. Maidment and Dr. Bakic in Fall semester of 2011) generated an NIH R01 grant proposal in Spring 2012 to
the RFA on the Continued Development of Biomedical Software (PAR-11-028).
2.3 Objective 3
Produce a corpus of high-quality published work and develop a portfolio of independently funded
research grants at DSU to support a sustained breast cancer program
See Reportable outcomes for publications

18
In June 2012, we submitted an NIH R01 grant proposal to the RFA on the Continued Development of
Biomedical Software (PAR-11-028): http://grants.nih.gov/grants/guide/pa-files/PAR-11-028.html),
P. Bakic, D. Pokrajac, A. Maidment, entitled “Continued Development and Maintenance of Computer
Simulation of Breast Anatomy”. The proposal was scored at 41%. We plan to resubmitted in July 2013.
3. Important Findings
We finalized ACRIN data transfer on MIRC and resolved issues with various batch transfers;
We performed a preliminary query of the ACRIN data aimed at identifying the prevalence of women
with incomplete visualization of the breast;
We developed a code to estimate the breast cancer risks using the demographic metadata information
from the ACRIN cases;
We estimated breast densities for GE mammograms from the ACRIN database, using the software
developed at the University of Pennsylvania;
A novel breast image registration method is proposed to obtain a composite mammogram from several
images with partial breast coverage, for the purpose of accurate breast density estimation;
We developed and validated several modifications and novel features to breast anatomy simulation
methods, used for generating software breast phantoms, including: (1) a method to improve thickness
control of the Cooper’s ligaments in the simulation algorithm by reducing “dents” on the ligaments’
surface; (2) a method for insertion of simulated microcalcification clusters in the software breast
phantom; (3) a method for simulating the dense tissue distribution in the software phantom; and (4) a
method for reducing quantization artifacts in phantom images by simulating partial volume in voxels
containing several simulated tissue types. The listed novel features have resulted in further
improvement of the image quality in synthetic breast images generated using the software phantom.
4. Reportable Outcomes
Publications (journal papers and conference proceedings):
1. J. Chu, D. Pokrajac, A. D. Maidment, P. Bakic, “Toward Breast Anatomy Simulation using GPU,” Proc.
Breast Imaging (IWDM), Lecture Notes in Computer Science 7361, pp. 508-515, 2012.
2. F. Chen, D. Pokrajac, X. Shi, F. Liu, A. D. Maidment, P. Bakic, “Simulation of Three
Materials Partial VolumeAveraging in a Software Breast Phantom,” Proc. Breast Imaging (IWDM), Lecture
Notes in Computer Science 7361, pp. 151-158, 2012.

19
3. F. Chen, P. Zheng, P. Xu, D. Pokrajac, P. R. Bakic, Andrew D. A. Maidment, F. Liu, X. Shi, “Breast
image registration by using non-linear local affine transformation,” Proc. of SPIE 8668, in press.
4. J. Chui, R. Zeng, D. Pokrajac, S. Park, K. J. Myers, A. D. A. Maidment, P. R. Bakic, “Two methods for
simulation of dense tissue distribution in software breast phantoms,” Proc. of SPIE 8668, in press.
5. Chui, J.H., Pokrajac, D.D., Maidment, A.D.A., Bakic, P.R.: “Roadmap for Efficient Parallelization of Breast
Anatomy Simulation,” In Physics of Medical Imaging, Proc. SPIE 8313, edited by N.J. Pelc, R.M.
Nishikawa 2012.
Presentations:
1. D. Pokrajac made a presentation at the IWDM 2012, the 11th International Workshop on Breast Imaging, in
Philadelphia, PA. on July 8-11, 2012, “Toward Breast Anatomy Simulation using GPU” (co-authored by J.
Chu, D. Pokrajac, A. D. Maidment, P. Bakic)
2. F. Chen made a presentation at the IWDM 2012, the 11th International Workshop on Breast Imaging, in
Philadelphia, PA. On July 8-11, 2012, “Simulation of Three Materials Partial Volume
Averaging in a Software Breast Phantom” (co-authored by F. Chen, D. Pokrajac, X. Shi, F. Liu, A. D.
Maidment, P. Bakic)
Grant Applications:
Submitted an NIH R01 grant proposal to the RFA on the Continued Development of Biomedical
Software (PAR-11-028): http://grants.nih.gov/grants/guide/pa-files/PAR-11-028.html) P. Bakic, D.
Pokrajac, A. Maidment. Grant scored at 41 percentile, not funded. Resubmission for July 2013 in
preparation.
5. Conclusion
This year we submitted an NIH R01 grant proposal to the RFA. We organized DSUPENN seminars, attended
and presented at national and international conferences. We held by-monthly teleconferences with DSU and
UPENN. We finalized ACRIN data transfer on MIRC and resolved issues with various batch transfers. We
performed a preliminary query of the ACRIN data aimed at identifying the prevalence of women with
incomplete visualization of the breast. We developed a code to estimate the breast cancer risks using the
demographic metadata information from the ACRIN cases. We estimated breast densities for GE mammograms
from the ACRIN database, using the software developed at the University of Pennsylvania. A novel breast
image registration method is proposed to obtain a composite mammogram from several images with partial

20
breast coverage, for the purpose of accurate breast density estimation. We designed a method to improve
thickness control of the Cooper’s ligaments in the simulation algorithm by reducing “dents” on the ligaments’
surface.
6. References
N/A
7. Appendices
1. J. Chu, D. Pokrajac, A. D. Maidment, P. Bakic, “Toward Breast Anatomy Simulation using GPU,” Proc.
Breast Imaging (IWDM), Lecture Notes in Computer Science 7361, pp. 508-515, 2012.
2. F. Chen, D. Pokrajac, X. Shi, F. Liu, A. D. Maidment, P. Bakic, “Simulation of Three
Materials Partial Volume Averaging in a Software Breast Phantom,” Proc. Breast Imaging (IWDM),
Lecture Notes in Computer Science 7361, pp. 151-158, 2012.
3. F. Chen, P. Zheng, P. Xu, D. Pokrajac, P. R. Bakic, Andrew D. A. Maidment, F. Liu, X. Shi, “Breast image
registration by using non-linear local affine transformation,” Proc. of SPIE 8668, in press.
4. J. Chui, R. Zeng, D. Pokrajac, S. Park, K. J. Myers, A. D. A. Maidment, P. R. Bakic, “Two methods for
simulation of dense tissue distribution in software breast phantoms,” Proc. of SPIE 8668, in press.

A.D.A. Maidment, P.R. Bakic, and S. Gavenonis (Eds.): IWDM 2012, LNCS 7361, pp. 506–513, 2012. © Springer-Verlag Berlin Heidelberg 2012
Towards Breast Anatomy Simulation Using GPUs
Joseph H. Chui1, David D. Pokrajac2, Andrew D.A. Maidment3, and Predrag R. Bakic4
1 Department of Radiology, University of Pennsylvania, Philadelphia PA 19104 {Joseph.Chui,Andrew.Maidment,Predrag.Bakic}@uphs.upenn.edu 2 Applied Mathematics Research Center, Delaware State University, Dover, DE 19901
Abstract. We have developed a method for massively parallelized breast anat-omy simulation and a corresponding GPU implementation using OpenCL. The simulation method utilizes an octree data structure for recursively splitting the simulated tissue volume. Several strategies to optimize the GPU utilization were proposed and evaluated, including the use of synchronization constructs in the language and minimization of buffer allocations. The task of tissue classifi-cation was separated from the voxelization to further improve the balance of the control flow. The proposed anatomy simulation method provides for fast gener-ation of high-resolution anthropomorphic breast phantoms. Currently, it is possible to generate an octree representation of 450 ml breasts with 50 μm vox-el size on a AMD Radeon 6950 GPU with 2GB of memory at a rate of 7 phan-toms per minute, 32 times faster than a multithreaded C++ implementation.
Keywords: Digital mammography, anthropomorphic breast phantom, Paralleli-zation, GPU.
1 Introduction
Breast tissue simulation is of great importance for pre-clinical testing and optimization of imaging systems or image analysis methods. Currently, the standard for imaging systems validation includes pre-clinical evaluation performed with simple geometric phantoms, followed up by clinical imaging trials involving large numbers of patients and repeated imaging using different acquisition conditions. Such an approach fre-quently causes delays in technology dissemination, due to the duration and cost of these trials. In addition, there are many factors which place strict limitations on the number of test conditions, such as the use of radiation in x-ray imaging trials.
Use of software anthropomorphic phantoms for pre-clinical evaluations offers a valuable alternative approach which can reduce the burden of clinical trials. In this paper, we present a GPU (Graphical Processing Unit) implementation of a method for generating software anthropomorphic breast phantoms. The breast anatomy simula-tion method is based upon recursive partitioning of the simulated volume utilizing octrees. The octree-based algorithm allows generation and processing of octree nodes at the same tree level independently (i.e., in any arbitrary order), which makes the
Towards Breast Anatomy Simulation Using GPUs 507
algorithm a good candidate for parallelization. Using profiler analysis we have iden-tified the bottleneck steps in the CPU implementation of the algorithm and developed a corresponding GPU implementation using OpenCL. The performances of the GPU and CPU implementations were compared in terms of the time needed for generating phantoms of various voxel sizes. The effects of several implementation parameters are discussed.
2 Methods
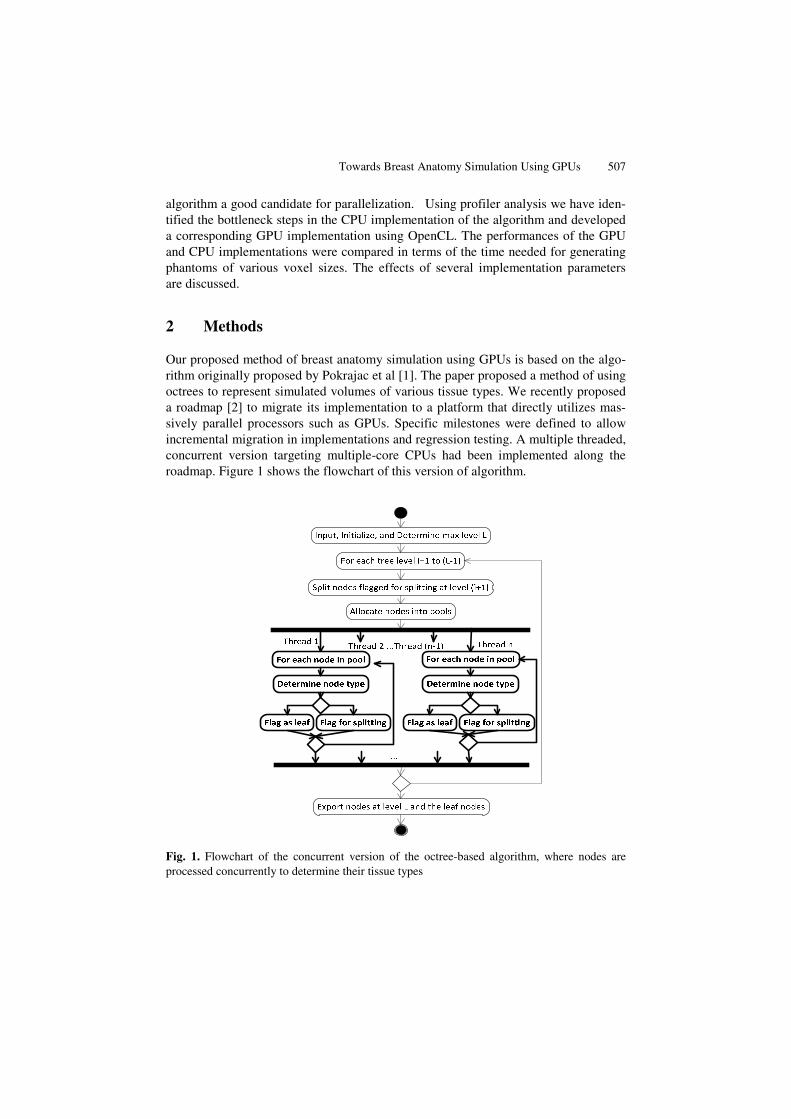
Our proposed method of breast anatomy simulation using GPUs is based on the algo-rithm originally proposed by Pokrajac et al [1]. The paper proposed a method of using octrees to represent simulated volumes of various tissue types. We recently proposed a roadmap [2] to migrate its implementation to a platform that directly utilizes mas-sively parallel processors such as GPUs. Specific milestones were defined to allow incremental migration in implementations and regression testing. A multiple threaded, concurrent version targeting multiple-core CPUs had been implemented along the roadmap. Figure 1 shows the flowchart of this version of algorithm.
Fig. 1. Flowchart of the concurrent version of the octree-based algorithm, where nodes are processed concurrently to determine their tissue types
508 J.H. Chui et al.
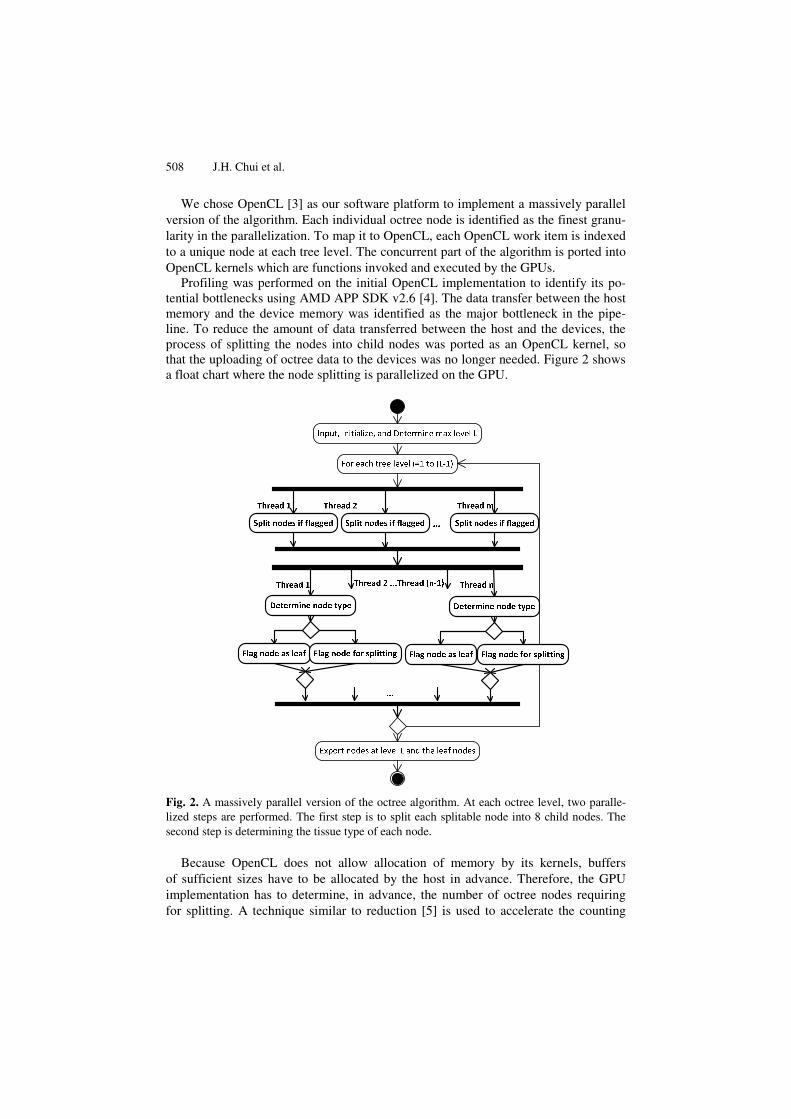
We chose OpenCL [3] as our software platform to implement a massively parallel version of the algorithm. Each individual octree node is identified as the finest granu-larity in the parallelization. To map it to OpenCL, each OpenCL work item is indexed to a unique node at each tree level. The concurrent part of the algorithm is ported into OpenCL kernels which are functions invoked and executed by the GPUs.
Profiling was performed on the initial OpenCL implementation to identify its po-tential bottlenecks using AMD APP SDK v2.6 [4]. The data transfer between the host memory and the device memory was identified as the major bottleneck in the pipe-line. To reduce the amount of data transferred between the host and the devices, the process of splitting the nodes into child nodes was ported as an OpenCL kernel, so that the uploading of octree data to the devices was no longer needed. Figure 2 shows a float chart where the node splitting is parallelized on the GPU.
Fig. 2. A massively parallel version of the octree algorithm. At each octree level, two paralle-lized steps are performed. The first step is to split each splitable node into 8 child nodes. The second step is determining the tissue type of each node.
Because OpenCL does not allow allocation of memory by its kernels, buffers of sufficient sizes have to be allocated by the host in advance. Therefore, the GPU implementation has to determine, in advance, the number of octree nodes requiring for splitting. A technique similar to reduction [5] is used to accelerate the counting

Towards Breast Anatomy Simulation Using GPUs 509
process. The implementation first counts the number of nodes which require splitting in each work group using a counter in local memory. Next, the counts of each workgroup are accumulated so that the accumulation result multiplied by 8 would be the index where each workgroup starts splitting its nodes in parallel. Figure 3 shows an example of the parallelized splitting process.
……………………………….
…………0..7 0..7 0..7
i‐th level
(i+1)‐th level
……………………………….Threads
Leaf node
Non‐leaf node
0..7
Workgroup 0 Workgroup n
0 23
Fig. 3. Illustration of GPU threads splitting its each node into eight nodes in parallel. In this example, workgroup 0 has 3 nodes (0, 6, and 7) requiring splitting. Indexes 0 to 23 (= 3 x 8 - 1) are reserved for workgroup 0, while the next workgroup splits the nodes into child nodes start-ing from index 24.
Built-in OpenCL atomic functions atom_inc() and atom_add() were utilized to increment and add the counters on multiple threads to guard against a race condi-tion.
During software profiling, several other GPU-specific bottlenecks were also identi-fied. First, buffer allocations on GPUs require significant time. Secondly, excessive use of flow control in the kernels running on the GPUs slows down the execution of work groups.
To address the buffer allocation problem, instead of re-allocating new buffers for every level of octrees, buffers were retained on the devices until the current ones were no longer big enough for the next tree level. This was especially effective for phan-toms of high resolution, where the buffers created for an octree section could often be reused for subsequent sections.
To tackle the issue of excessive use of flow control, the OpenCL kernels imple-mented in this study were refactored manually. Programming methods using branch-ing that are designed for sequential computation are often unsuitable for parallel computation [6]. Instead, costly functions called on different control paths can be consolidated into a single call on the main path.
Our concurrent, non-parallel version of the algorithm conditionally voxelizes vo-lumes on some of its control paths based on each node’s tissue types. The whole workgroup is blocked when there is a work item in this group requires voxelization of
510 J.H. Chui et al.
its octree node. To improve the utilization of the GPU, the voxelization was separated from the kernel that determines each node’s tissue type.
We validated the implementation by comparing the generated octrees with the ones generated by previous implementations using the same set of parameters. In order to assess the performances of various implementations, the simulation times at different target resolutions were compared. We also measured the effects of workgroup sizes on the performance. Performances of the implementations were assessed by their duration times on a desktop PC with Intel® Core™ i7-2600K CPU @ 3.40GHz and 16GB of RAM and Radeon 6950 GPU with 2GB of VRAM.
3 Results
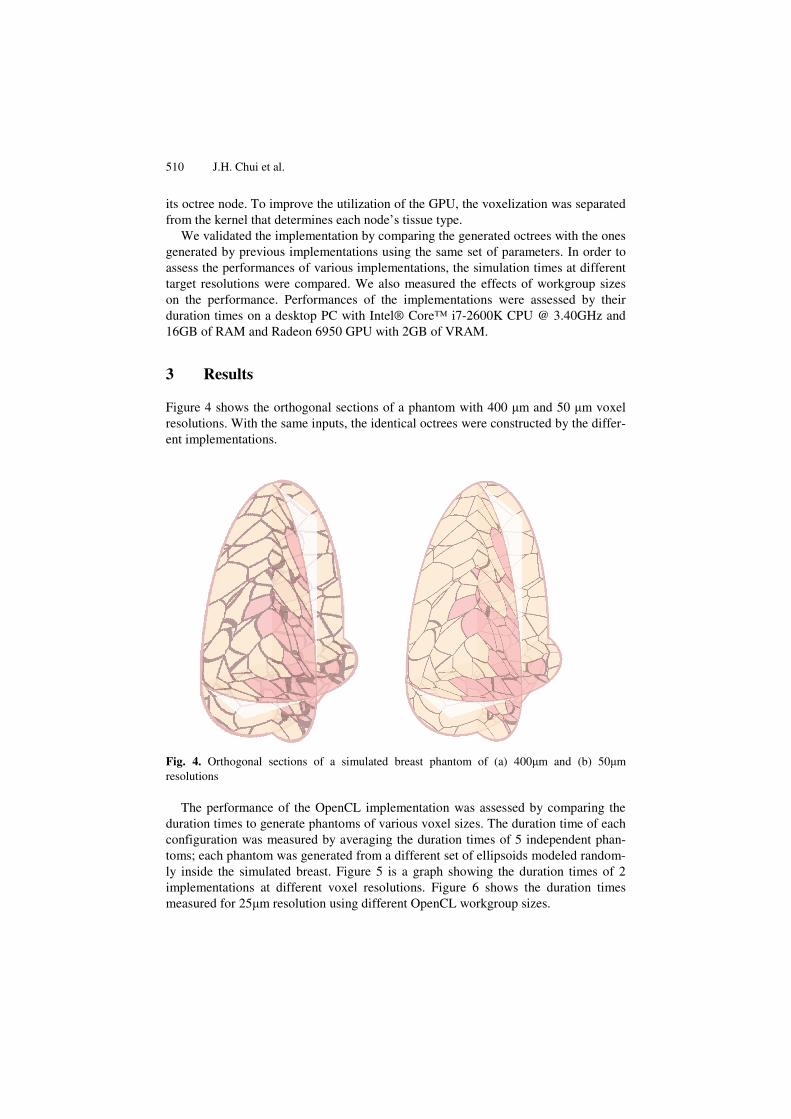
Figure 4 shows the orthogonal sections of a phantom with 400 μm and 50 μm voxel resolutions. With the same inputs, the identical octrees were constructed by the differ-ent implementations.
Fig. 4. Orthogonal sections of a simulated breast phantom of (a) 400μm and (b) 50μm resolutions
The performance of the OpenCL implementation was assessed by comparing the duration times to generate phantoms of various voxel sizes. The duration time of each configuration was measured by averaging the duration times of 5 independent phan-toms; each phantom was generated from a different set of ellipsoids modeled random-ly inside the simulated breast. Figure 5 is a graph showing the duration times of 2 implementations at different voxel resolutions. Figure 6 shows the duration times measured for 25μm resolution using different OpenCL workgroup sizes.

Towards Breast Anatomy Simulation Using GPUs 511
Fig. 5. Average duration times of different implementations of the octree-based algorithm for various voxel sizes (12.5, 25, 50, 100 and 200 μm)
Fig. 6. The duration times using different OpenCL workgroup sizes (16, 32, 64, 128, and 256)
y = 658714x-1.986
y = 4621.9x-1.568
1
10
100
1000
10000D
urat
ion
(sec
onds
)
Voxel Size (microns)
CPU (8 threads)
GPU
12.5 25 50 100 200
0.00
20.00
40.00
60.00
16 32 64 128 256
Dur
atio
n Ti
me
(sec
onds
)
Work Group Size

512 J.H. Chui et al.
4 Discussion and Conclusions
We have successfully implemented an efficient parallelized version of an algorithm to simulate the breast anatomy for anthropomorphic phantoms by utilizing some of the strategies targeted for GPUs such as reuse of buffers and reduction of flow control. We measured, on average, a 32-fold improvement for the GPU implementation over the multi-threaded CPU implementation when simulating 50 μm phantoms.
Based on the measured duration times using different workgroup sizes, a workgroup of 64 yielded the best performance. Since the GPU used in this study has a wavefront size of 64 work items, any work group size less than 64 may underutilize the GPUs. On the other hand, a workgroup of more than 64 items would increase the memory contention among the units. Since the optimal workgroup size is hardware dependent, benchmarking on individual hardware is required to determine the optimal work group size.
The performance of the implementation is sufficient to create phantoms of reason-ably high resolution in near real time. By generating and storing the data on the GPU, it becomes feasible to develop real time visualization software that interoperates with the same set of data on the GPU. This arises, in part, because the octree data structure offers a superior memory footprint compared to a 3D voxel representation. Therefore, an octree is an ideal data structure for storage on GPUs (that are typically available with limited memory). For simulations requiring higher resolution, the simulated phantom can be subdivided into sub-volumes small enough for the individual GPUs.
We observed a CPU usage of 2% by the application when the octrees are generated on the GPU. Thus, porting the code to the GPU not only resulted in the performance being significantly improved, but shifting the processing from the CPU to the GPU frees the CPU for other operations such as voxelization, data compression and I/O. Our GPU implementation can be further enhanced by operating it upon multiple GPUs; a feature supported by most mainstream performance computing hardware. It is noteworthy that it is more feasible to assemble hardware with multiple GPUs than hardware with multiple CPUs.
Our latest profiling results indicate that further improvements in performance can be achieved by extending the parallelization to the evaluation of shape functions for each octree. Please note that the estimated slope of the dependence of the computa-tion time vs. voxel size for the GPU implementation (Fig. 5) is less than two. The computation time consists of two components. The first component, related to build-ing and maintaining the octree structure of the phantom, is believed to be quadratic function of the inverse voxel size [1]. The second component includes overhead of initializing the OpenCL kernels that has linear or constant complexity as a function of the inverse voxel size. For larger voxel sizes, this linear component becomes domi-nant, influencing the estimate slope of the regression line.
It is further observed that when the resolution is sufficiently high, the duration in-creased slightly more than a quadratic as a function of the inverse voxel size. This is caused mainly by the overhead of the data transfers between the host and the devices, which accrue a cost proportional to the cube of the inverse voxel size. For simulations that require resolutions higher than 25 μm, further investigations of performance

Towards Breast Anatomy Simulation Using GPUs 513
improvement are needed. Such work should emphasize the reduction of the cost of operations for each sub-volume, such as voxelization and communication between the host and devices. Finally, the frequency of buffer allocation on the devices can be reduced if an accurate maximum buffer size can be estimated in advance for different sets of parameters.
Acknowledgements. This work was supported in part by the US Department of De-fense Breast Cancer Research Program (HBCU Partnership Training Award BC083639), and the US National Institutes of Health (grant 1R01CA154444). The content is solely the responsibility of the authors and does not necessarily represent the official views of the funding agency.
References
1. Pokrajac, D.D., Maidment, A.D.A., Bakic, P.R.: Optimized generation of high resolution breast anthropomorphic software phantoms. Medical Physics 39(4), 2290–2302 (2012)
2. Chui, J.H., Pokrajac, D.D., Maidment, A.D.A., Bakic, P.R.: Roadmap for efficient paralleli-zation of breast anatomy simulation. In: Pelc, N.J., Nishikawa, R.M., Whiting, B.R. (eds.) Proc. of SPIE, Medical Imaging 2012: Physics of Medical Imaging, vol. 8313, pp. 83134T-1–83134T-10, SPIE, Bellingham (2012)
3. OpenCL 1.2 Specification, Khronos Group, http://www.khronos.org/registry/cl/specs/opencl-1.2.pdf
4. AMD APP SDK v2.6, http://developer.amd.com/sdks/AMDAPPSDK/downloads/Pages/ default.aspx
5. Harris, M.: Optimizing parallel reduction in CUDA, http://developer.download.nvidia.com/compute/cuda/1_1/ Website/projects/reduction/doc/reduction.pdf
6. AMD Accelerated Parallel Processing OpenCL Programming Guide (v1.3f), http://developer.amd.com/sdks/AMDAPPSDK/assets/ AMD_Accelerated_Parallel_Processing_OpenCL_ Programming_Guide.pdf
Simulation of Three Material Partial Volume Averaging
in a Software Breast Phantom
Feiyu Chen1, David D. Pokrajac
1, Xiquan Shi
1, Fengshan Liu
1,
Andrew D.A. Maidment2, Predrag R. Bakic
2
1Delaware State University, 1200 N DuPont Hwy, Dover DE 19904;
[email protected];{DPokrajac,XShi,FLiu}@desu.edu;
2University of Pennsylvania, 3400 Spruce Street, Philadelphia, PA 19104
{Predrag.Bakic,Andrew.Maidment}@uphs.upenn.edu
Abstract. A general case for simulation of partial volume (PV) averaging in
software breast phantoms is presented. PV simulation could improve the quali-
ty of phantom images by reducing quantization artifacts near borders between
different materials. The validity of phantom studies depends on the realism of
simulated images, which is affected by the size of phantom voxels. Large
voxels may cause notable quantization artifacts; small voxels, however, extend
the generation time and increase the memory requirements. An improvement in
image quality without reducing voxel size is achievable by the simulation of PV
averaging in voxels containing more than one simulated tissue type; the linear
x-ray attenuation coefficient of such voxels is represented by a combination of
attenuation coefficients proportional to voxel subvolumes occupied by different
tissues. In this paper, we present results of simulated PV in the general case of
voxels containing up to three materials.
Keywords: Digital mammography, computer breast phantom, partial volume
simulation, computational geometry.
1 Introduction
This study is motivated by the desire to improve the quality of synthetic images gen-
erated using software breast phantoms. The partial volume (PV) averaging can help
reduce the quantization artifacts on boundaries of regions with different simulated
materials. The software phantoms in this study have been generated based upon the
recursive partitioning of the phantom volume using octrees [1]. In this paper, we pro-
pose a solution for a general PV case with up to three simulated materials in a voxel.
This work represents the first PV simulation in software phantoms generated based
upon the rules for simulating anatomical structures [1-4]. PV simulation has been
indirectly reported in a method for generating phantoms based upon the CT images of
mastectomy specimen [5]. In that method, the values of each reconstructed breast CT
image voxel were scaled and interpreted as the percentage of adipose breast tissue in
the voxel.
In this paper, we present an overview of the PV simulation method including de-
tails of a planar approximation and the PV computation. The improvement of image
quality is qualitatively validated. The results are shown in the form of slices and sim-
ulated X-ray projections of phantoms with and without PV.
2 Method
The effective linear x-ray attenuation in a voxel which contains more than one simu-
lated material can be calculated as:
ii iii iV pV
V
1; %100
V
Vp
i
i, (1)
where |V| is the voxel volume, |Vi| is the subvolume of material i with the linear x-ray
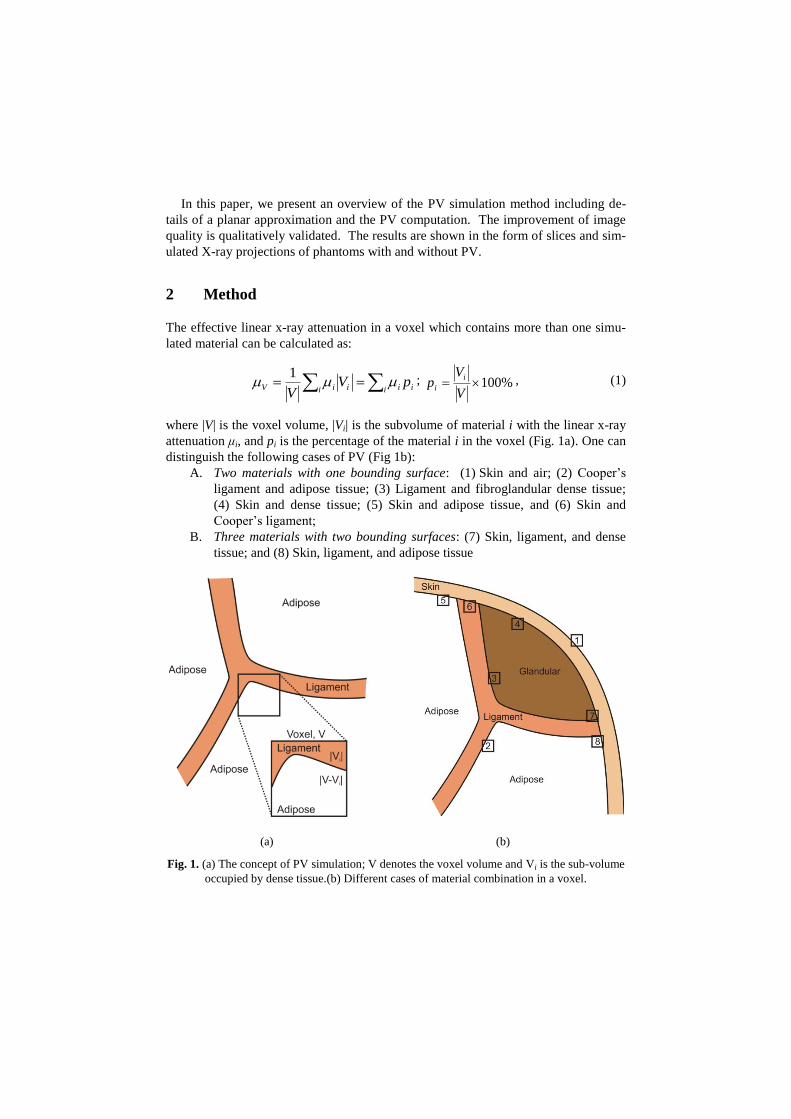
attenuation μi, and pi is the percentage of the material i in the voxel (Fig. 1a). One can
distinguish the following cases of PV (Fig 1b):
A. Two materials with one bounding surface: (1) Skin and air; (2) Cooper’s
ligament and adipose tissue; (3) Ligament and fibroglandular dense tissue;
(4) Skin and dense tissue; (5) Skin and adipose tissue, and (6) Skin and
Cooper’s ligament;
B. Three materials with two bounding surfaces: (7) Skin, ligament, and dense
tissue; and (8) Skin, ligament, and adipose tissue
(a) (b)
Fig. 1. (a) The concept of PV simulation; V denotes the voxel volume and Vi is the sub-volume
occupied by dense tissue.(b) Different cases of material combination in a voxel.
The simulation of PV case (1) has been reported previously [6]; it can be easily ex-
tended to cases (2)-(6). In this abstract we present a general case of PV simulation
based upon the planar approximation of up to two bounding surfaces in a voxel, ad-
dressing cases (7)-(8).
The planar approximation for the boundary between Cooper’s ligaments and adi-
pose tissue, as simulated in our software breast phantom [1], can be obtained as fol-
lows. Adipose compartments Ci and Cj, which may be given by shape functions fi and
fj, determine a Cooper’s ligament between them as the locus of points within a dis-
tance of D/2 from a surface Fij(x)= fi(x)- fj(x), see Fig. 2. Consider a voxel V with
center xc. We define a planar approximation of the boundary between the Cooper’s
ligament and the compartment Cj as
0: 11 cijcij FFsign xxxx , (2)
where
.2/Dc1
cij
cij
cij
cij
cijF
F
F
FFsign
x
x
x
xxxx
(3)
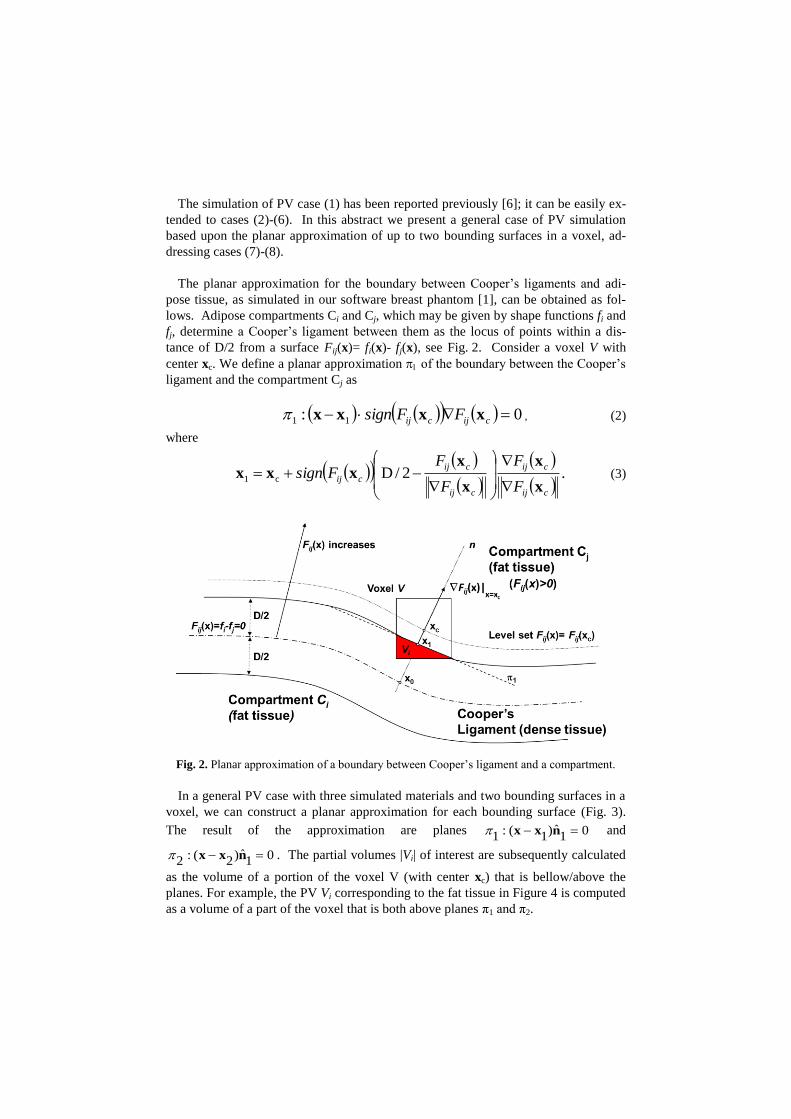
Fig. 2. Planar approximation of a boundary between Cooper’s ligament and a compartment.
In a general PV case with three simulated materials and two bounding surfaces in a
voxel, we can construct a planar approximation for each bounding surface (Fig. 3).
The result of the approximation are planes 01ˆ)1(:1 nxx and
01ˆ)2(:2 nxx . The partial volumes |Vi| of interest are subsequently calculated
as the volume of a portion of the voxel V (with center xc) that is bellow/above the
planes. For example, the PV Vi corresponding to the fat tissue in Figure 4 is computed
as a volume of a part of the voxel that is both above planes π1 and π2.

The PV Vi in a voxel shown in Fig. 3 has been computed using planar approxima-
tions as follows. Consider a voxel of linear size x, with a vertex v located above
planes 1 and 2. (If no such vertex exists, the PV should be zero).
Fig. 3. A voxel containing skin, Cooper’s ligament and fat tissue and planar approximations 1
and 2 of the tissue boundaries.
The divergence (or Gauss-Ostrogradsky) theorem [7] is employed to compute the
partial volume |Vi| of the voxel above planes 1 and 2, where the volume Vi is bound-
ed by planes 1 and 2 and at most 6 sides of the voxel. The divergence theorem can
be described as the following integral equation:
dSFdVFiV S )()( n . (4)
The left side is a volume integral over the partial volume Vi of voxel, the right side
is the surface integral over the boundary of the volume Vi, and n is the outward point-
ing unit normal vector of the boundary.
After the appropriate choice of the vector field function inside the integral at left
side, i.e., F(x) = x, the whole quantity at the left side becomes 3|Vi|, and the right side
can be rewritten as:
1 2 3 1 1 2 2S S S x A d A d , (5)
where Si, i=1,3 are surface areas of the boundary formed by the voxel sides 1 ,2 and
3, that do not contain the vertex v; A1 and A2 are surface areas of the boundary of
Vi belonging to planes 1 and 2.
Skin
boundary
xc
n2
n1
Fat tissue
Cooper’s ligament
Voxel V
2
1
x2
V1
Skin
x1
xc
Ligament-fat
boundary

Subsequently, the PV can be calculated as:
3
)( 2211321 dAdAxSSSVi
, (6)
where 111
ˆ)( nxv d , and 222
ˆ)( nxv d are distances of the vertex v to planes 1
and 2.
Fig. 4. Partial volume Vi of the voxel V above planes 1 and 2 and containing vertex v. S1, S2
and S3(here S3=0) are surface areas of parts of the volume boundary belonging to voxel sides
1, 2 and 3 that do not contain the vertex v.
3 Results and Discussion
Fig. 5 illustrates the PV simulation in a 450ml software breast phantom with 400m
voxels. Shown is the segmentation of phantom detail into air and voxels containing
one, two or three materials. For the corresponding phantom detail, shown also are the
equivalent linear x-ray attenuations, and percentages of ligament tissue and skin tis-
sue.
Fig. 5 suggests that the PV simulation on the ligaments-fat boundary was qualita-
tively correct. The voxels containing two materials are detected at the boundaries of
two materials (e.g., skin, compartment). Similarly, the three material voxels are de-
tected where the skin meets Cooper’s ligaments and a compartment. Fig. 5b indicates
that the PV helped smooth the appearance of boundaries between regions with differ-
ent x-ray attenuations. The computed percentages of ligament and skin tissues in a
voxel (Figs. 5c, 5d) suggest the correctness of the applied algorithm. The voxels in
the interior of skin/ligaments contain 100% of the corresponding tissues, while the
percentages gradually decrease at the boundaries.

Fig. 5. Detail of a 450ml phantom with 400m voxel size: (a) Segmentation of a phantom into
air and voxels containing one (light gray), two (dark gray) or three (black) materials; (b) Simu-
lated linear attenuation coefficients of voxels in (a) (in cm-1, assuming monoenergetic x-ray
beam at 20 keV); and percentage of (c) ligament tissue and (d) skin tissue in voxels from (a).
Fig. 6 shows simulated x-ray projections of phantoms with and without simulated
PV. The simulated acquisition assumed a monoenergetic x-ray beam (at 20 keV) and
parallel x-ray propagation, without scatter or quantum noise. The projections corre-
spond to three phantoms with identical distributions of compartments: the phantom
with 400m voxels and no PV (Fig. 6a); the 400m phantom with simulated PV (Fig.
6b); and the phantom with 200m voxels and no PV (Fig. 6c). Shown also is the
difference between the projections with and without simulated PV (Fig. 6d).
In a projection of the phantom with PV in Fig. 6b, the skin and Cooper’s ligaments
appear thinner (as compared to the phantom without PV, Fig. 6a). We believe this is
caused by the reduction in the effective x-ray attenuations of voxels on the liga-
ment/adipose tissue boundaries, which are lower than the x-ray attenuation of dense
tissue (see Fig. 5b). Further, the characteristic stair-step quantization artifacts on
tissue boundaries were noticeably reduced with simulated PV, as seen in the differ-
ence between PV and non PV projections (Fig 6d). Comparison of Figs. 6b and 6c
indicates similar appearance of a phantom with PV simulated at a lower resolution
(400μm) to a phantom simulated at a higher resolution (200μm) with no simulated
PV. Hence, the application of PV may lead to an improvement in image quality with-
out reducing voxel size.
a b c
(a)
(c) (d)
(b)

(a) (b) (c) (d)
Fig. 6. Simulated projections of (a) a phantom with 400μm voxels and no PV; (b) the phantom
from (a) with simulated PV; and (c) the same phantom generated at 200 μm voxels and no PV.
(d) The difference between (a) and (b); the image contrast was enhanced for display purposes.
4 Conclusion
We have developed and qualitatively assessed a method for PV simulation of phan-
tom voxels containing up to three simulated materials. The percentage of simulated
tissues was estimated based upon the use of the Gauss-Ostrogradsky theorem. Cross-
section and projections of phantoms with and without PV simulation were visually
compared. PV simulation can improve the quality of phantom images by reducing the
quantization artifacts caused by large voxel sizes.
Acknowledgements. This work was supported in part by the US Department of De-
fense Breast Cancer Research Program (HBCU Partnership Training Award
#BC083639), the US National Institutes of Health (R01 grant #CA154444), the US
National Science Foundation (CREOSA grant #HRD-0630388), and the US Depart-
ment of Defense/Department of Army (45395-MA-ISP, #54412-CI-ISP). The authors
would like to thank Ms. Susan Ng from Real-Time Tomography (Villanova, PA) for
processing the simulated projection images.

References
1. D. D. Pokrajac, A. D. A. Maidment, and P. R. Bakic, "Optimized generation of high reso-
lution breast anthropomorphic software phantoms," Medical Physics, vol. 39, pp. 2290-
2302, 2012.
2. P. R. Bakic, C. Zhang, and A. D. A. Maidment, "Development and Characterization of an
Anthropomorphic Breast Software Phantom Based upon Region-Growing Algorithm,"
Medical Physics, vol. 38, pp. 3165-3176, 2011.
3. K. Bliznakova, S. Suryanarayanan, A. Karellas, and N. Paiilikarakis, "Evaluation of an
improved algorithm for producing realistic 3D breat software phantoms: Application for
mammography," Medical Physics, vol. 37, pp. 5604-5617, 2010.
4. B. Chen, J. Shorey, R. S. J. Saunders, S. Richard, J. Thompson, L. W. Nolte, and E. Samei,
"An anthropomorphic breast model for breast imaging simulation and optimization," Aca-
demic Radiology, vol. 18, pp. 536-546, 2011.
5. J. M. O'Connor, M. Das, C. Didier, M. Mah'D, and S. J. Glick, "Comparison of two meth-
ods to develop breast models for simulation of breast tomosynthesis and CT," in Digital
Mammography (IWDM), vol. 5116, Lecture Notes in Computer Science, E. A. Krupinski,
Ed. Berlin-Heidelberg: Springer-Verlag, 2008, pp. 417-425.
6. F. Chen, D. D. Pokrajac, X. Shi, F. Liu, A. D. A. Maidment, and P. R. Bakic, "Partial Vol-
ume Simulation in Software Breast Phantoms," in Physics of Medical Imaging. San Diego,
CA: SPIE, 2012.
7. G. B. Folland, Advanced Calculus. Upper Saddle River, NJ: Prentice-Hall, Inc., 2002.
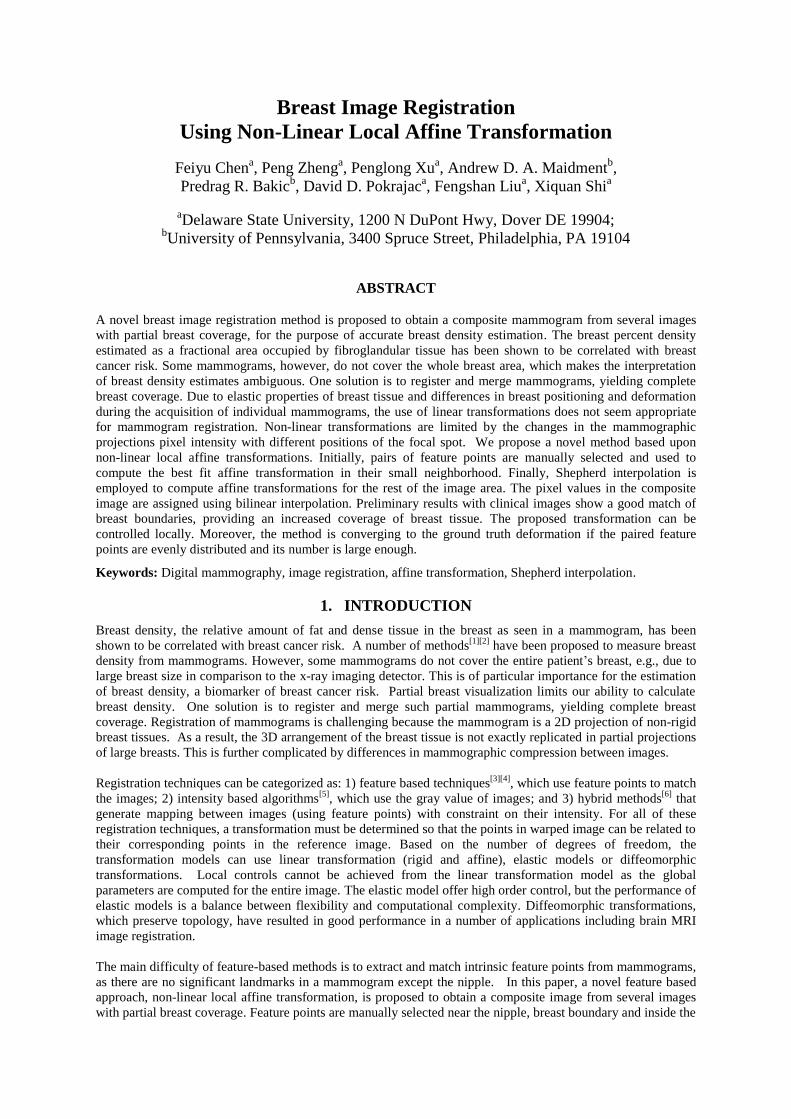
Breast Image Registration
Using Non-Linear Local Affine Transformation
Feiyu Chena, Peng Zheng
a, Penglong Xu
a, Andrew D. A. Maidment
b,
Predrag R. Bakicb, David D. Pokrajac
a, Fengshan Liu
a, Xiquan Shi
a
aDelaware State University, 1200 N DuPont Hwy, Dover DE 19904;
bUniversity of Pennsylvania, 3400 Spruce Street, Philadelphia, PA 19104
ABSTRACT
A novel breast image registration method is proposed to obtain a composite mammogram from several images
with partial breast coverage, for the purpose of accurate breast density estimation. The breast percent density
estimated as a fractional area occupied by fibroglandular tissue has been shown to be correlated with breast
cancer risk. Some mammograms, however, do not cover the whole breast area, which makes the interpretation
of breast density estimates ambiguous. One solution is to register and merge mammograms, yielding complete
breast coverage. Due to elastic properties of breast tissue and differences in breast positioning and deformation
during the acquisition of individual mammograms, the use of linear transformations does not seem appropriate
for mammogram registration. Non-linear transformations are limited by the changes in the mammographic
projections pixel intensity with different positions of the focal spot. We propose a novel method based upon
non-linear local affine transformations. Initially, pairs of feature points are manually selected and used to
compute the best fit affine transformation in their small neighborhood. Finally, Shepherd interpolation is
employed to compute affine transformations for the rest of the image area. The pixel values in the composite
image are assigned using bilinear interpolation. Preliminary results with clinical images show a good match of
breast boundaries, providing an increased coverage of breast tissue. The proposed transformation can be
controlled locally. Moreover, the method is converging to the ground truth deformation if the paired feature
points are evenly distributed and its number is large enough.
Keywords: Digital mammography, image registration, affine transformation, Shepherd interpolation.
1. INTRODUCTION
Breast density, the relative amount of fat and dense tissue in the breast as seen in a mammogram, has been
shown to be correlated with breast cancer risk. A number of methods[1][2]
have been proposed to measure breast
density from mammograms. However, some mammograms do not cover the entire patient’s breast, e.g., due to
large breast size in comparison to the x-ray imaging detector. This is of particular importance for the estimation
of breast density, a biomarker of breast cancer risk. Partial breast visualization limits our ability to calculate
breast density. One solution is to register and merge such partial mammograms, yielding complete breast
coverage. Registration of mammograms is challenging because the mammogram is a 2D projection of non-rigid
breast tissues. As a result, the 3D arrangement of the breast tissue is not exactly replicated in partial projections
of large breasts. This is further complicated by differences in mammographic compression between images.
Registration techniques can be categorized as: 1) feature based techniques[3][4]
, which use feature points to match
the images; 2) intensity based algorithms[5]
, which use the gray value of images; and 3) hybrid methods[6]
that
generate mapping between images (using feature points) with constraint on their intensity. For all of these
registration techniques, a transformation must be determined so that the points in warped image can be related to
their corresponding points in the reference image. Based on the number of degrees of freedom, the
transformation models can use linear transformation (rigid and affine), elastic models or diffeomorphic
transformations. Local controls cannot be achieved from the linear transformation model as the global
parameters are computed for the entire image. The elastic model offer high order control, but the performance of
elastic models is a balance between flexibility and computational complexity. Diffeomorphic transformations,
which preserve topology, have resulted in good performance in a number of applications including brain MRI
image registration.
The main difficulty of feature-based methods is to extract and match intrinsic feature points from mammograms,
as there are no significant landmarks in a mammogram except the nipple. In this paper, a novel feature based
approach, non-linear local affine transformation, is proposed to obtain a composite image from several images
with partial breast coverage. Feature points are manually selected near the nipple, breast boundary and inside the
breast based upon visual similarity in both mammograms. Affine transformations between sets of feature points
are then computed. Finally, Shepherd interpolation [7]
is used to extend affine transformations to the entire
breast. The pixel values in the composite image are assigned using the average of different images. Results with
clinical images show that the resulting image cover different parts of original images, and the same texture from
both registered images has a good agreement in composite image.
Qualitative testing is presented on selected images from the ACRIN DMIST database[8]
. This work was tested
with anonymized images obtained about IRB ethical review. A clinical image was split into two overlapping
partial images; one partial image was transformed (the warped image), while another was not modified (the
reference image). Those images were treated as a pair of mammograms with different coverage.
2. METHODOLOGY
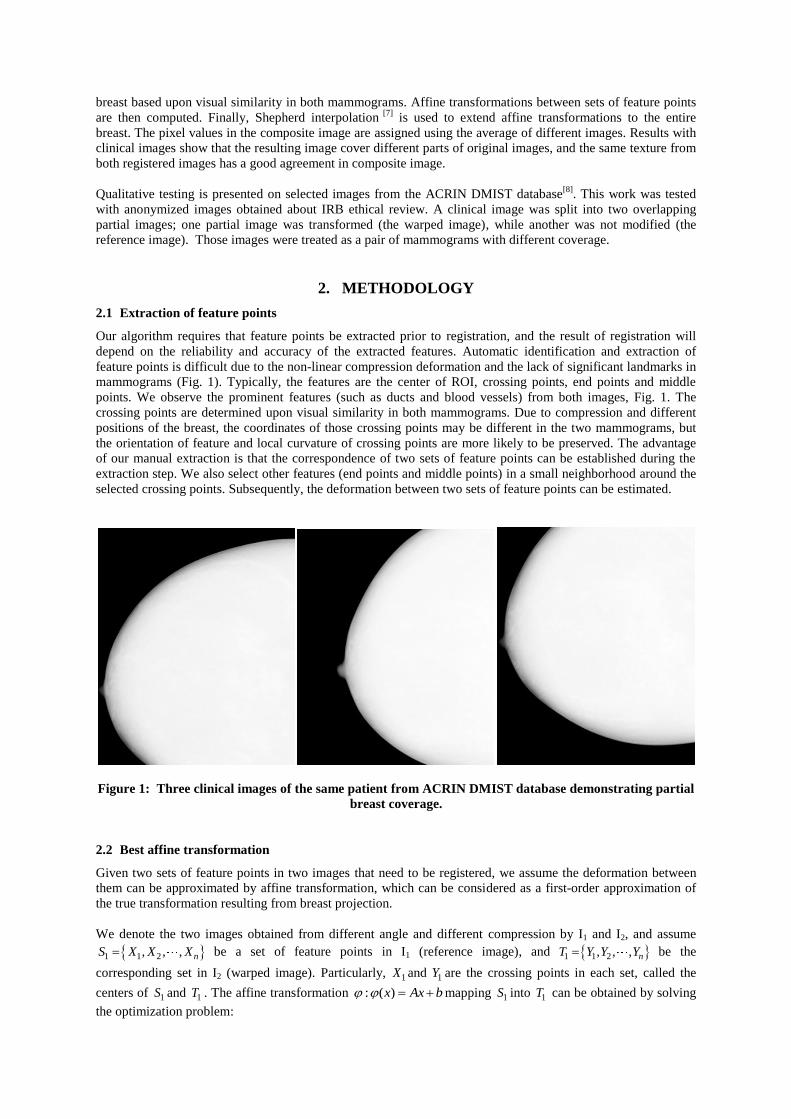
2.1 Extraction of feature points
Our algorithm requires that feature points be extracted prior to registration, and the result of registration will
depend on the reliability and accuracy of the extracted features. Automatic identification and extraction of
feature points is difficult due to the non-linear compression deformation and the lack of significant landmarks in
mammograms (Fig. 1). Typically, the features are the center of ROI, crossing points, end points and middle
points. We observe the prominent features (such as ducts and blood vessels) from both images, Fig. 1. The
crossing points are determined upon visual similarity in both mammograms. Due to compression and different
positions of the breast, the coordinates of those crossing points may be different in the two mammograms, but
the orientation of feature and local curvature of crossing points are more likely to be preserved. The advantage
of our manual extraction is that the correspondence of two sets of feature points can be established during the
extraction step. We also select other features (end points and middle points) in a small neighborhood around the
selected crossing points. Subsequently, the deformation between two sets of feature points can be estimated.
Figure 1: Three clinical images of the same patient from ACRIN DMIST database demonstrating partial
breast coverage.
2.2 Best affine transformation
Given two sets of feature points in two images that need to be registered, we assume the deformation between
them can be approximated by affine transformation, which can be considered as a first-order approximation of
the true transformation resulting from breast projection.
We denote the two images obtained from different angle and different compression by I1 and I2, and assume
1 1 2, , , nS X X X be a set of feature points in I1 (reference image), and 1 1 2, , , nT Y Y Y be the
corresponding set in I2 (warped image). Particularly, 1X and 1Y are the crossing points in each set, called the
centers of 1S and 1T . The affine transformation : ( )x Ax b mapping 1S into 1T can be obtained by solving
the optimization problem:
2 2 2
2
1,
arg minn
j jjA R R b R
AX b Y
(1)
where A is a 2x2 matrix including scaling and rotation, 2b R is a translation vector.
The solution of the above optimization problem can be expressed as: 1
2
3 3 32 3 3 3
[ , ] [ ]1 1 1
T T
n
n n n
X X XA b Y
(2)
where 1 2, , , nX X X X and 1 2, , , nY Y Y Y .
Similarly, for each corresponding pairs of feature sets 1 1 2 2( , ),( , ), ,( , )k kS T S T S T , we can also obtain the best
affine transformations 1 2, , k , that minimize the least square error. Note that if we consider i as a
basis, then for an arbitrary point in I1, we can find its affine transformation by combining the basis with different
non-linear weights [see equation (3) below].
2.3 Non-linear Local Affine Transformation
The Shepard interpolation [7]
, which is a simple case of inverse distance weighting to assign value to unknown
points based on given points, is employed to compute the local affine transformation for each non-feature
point in the image.
Assume iX and iY are the centers of iS and iT , i.e., the affine transformation of iX is i , obtained from
equation (2). For any other point Z in I1, its corresponding local non-linear affine transformation is defined
as:
-
1
-
1
if ( )=
if
k
i iiik
ii
i i
di Z X
Z d
i Z X
(3)
where i id X Z is the Euclidean distance between iX and Z . Note that non-linear deformation mapping is
continuous since lim ( )i
iZ X
Z
. Moreover, the partial derivatives with respect to two coordinates of exist
at all the points if 1 . We choose the default value of as 2 for convenience of computation. The function
( )Z can be considered as the first order approximation of the ground truth deformation in a small neighbor of
Z . It will converge to the ground truth deformation when the number of neighbors k is large enough and the
feature points are evenly distributed. Note also that can be expressed locally as a linear combination of affine
transformations. Moreover, local controls can be achieved if we add or delete feature sets in the region of
interest.
The purpose of our image registration is mapping both I1 and I2 into same region to get composite image, say Ic.
I1 can be mapped to Ic by a translation transformation; while the non linear local affine transformation was
used to estimate the mapping between I2 and Ic, which will change the shape of image Ic.
In order to initialize the size of Ic, we have to determine the maximum and minimum value of I2 under the local
affine transformation ( )x , where x can be represented by linear combination of four corner points jc of I2.
4
1
j j
j
x w c
4 4
1 1
( ) ( ) ( )j j j j
j j
x w c w c
. (4)
According to equation (3), we know that ( )x , the local affine transformation at point x, is the linear average of
i with weight 1, therefore:
max ( ) max(max ( )), min ( ) min(min ( )).i j i jx i jx i j
x c x c (5)
Now we can classify Ic into four different regions R1: the points x that have only inverse image y in I1; R2: the
points x with inverse image z only from I2; R3: the points x that have inverse images y both in I1 and in I2; R4:

the points that do not have any inverse image. The following strategy is used to assign gray values to the points
in Ic.
1 1
2 2
1 23
4
( )
( )
( ) .( ) ( )
2
0
c
I y x R
I z x R
I x I y I zx R
x R
(6)
2.4 Image validation method
The simplest validation is obtained from examination of the pixel-wise brightness difference between the
reference image and the transformed warped image. However, such technique does not provide good
performance for mammogram registration due to the 3D various projections of the breast tissues. Even if the
positions of the image features are matched in the warped image and the reference image, the pixel brightness of
same features will be different since the path of X-ray is different.
As an initial validation, individual clinical images were transformed to mimic partial coverage as illustrated in
Fig. 2. A clinical image is split into two overlapping partial images. One partial image was transformed (the
warped image) and another was not modified (the reference image). Those images were treated as a pair of
mammograms with different coverage. The registration error can be computed as the difference between the
original image and the composite image after the registration.
Figure 2: Original image and partial images (1 and 2) for validation.
3. RESULTS
In this section we present preliminary results using the proposed approach applied to clinic mammograms taken
from the ACRIN DMIST database of mammograms. This work is a part of a larger study of racial disparity in
breast cancer risk. For that project, breast percent density and parenchymal texture of minority women and age-
matched Caucasian controls from the ACRIN DMIST database[8]
are being compared.
Fig. 3 (a,b) illustrates the registration of two images from a large breast using the proposed non-linear local
affine transformation with 9 pairs of feature sets. The effect of the choice of reference image is shown. Fig. 3c
shows the composition of 3 partial views that covers the whole breast.
Fig. 4 illustrates the qualitative comparison of the proposed method with the result of Advanced Normalization
Tools[9]
, (ANTs) that computes the unsupervised optimal diffeomorphic transformation by minimizing the
similarity measure between warped image and reference image. The registered image of the warped image (Fig.
4a) and reference image (Fig. 4b) is shown in Fig. 4c. Fig. 4c illustrates the result of ANTs.
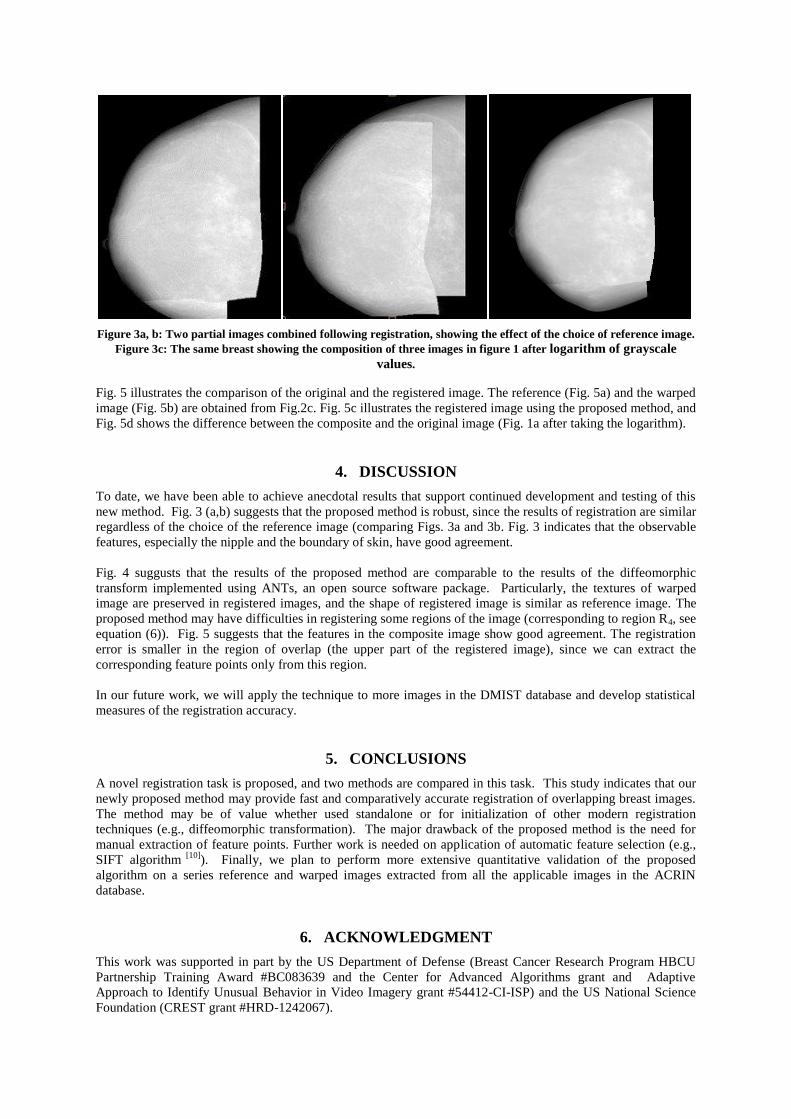
Figure 3a, b: Two partial images combined following registration, showing the effect of the choice of reference image.
Figure 3c: The same breast showing the composition of three images in figure 1 after logarithm of grayscale
values.
Fig. 5 illustrates the comparison of the original and the registered image. The reference (Fig. 5a) and the warped
image (Fig. 5b) are obtained from Fig.2c. Fig. 5c illustrates the registered image using the proposed method, and
Fig. 5d shows the difference between the composite and the original image (Fig. 1a after taking the logarithm).
4. DISCUSSION
To date, we have been able to achieve anecdotal results that support continued development and testing of this
new method. Fig. 3 (a,b) suggests that the proposed method is robust, since the results of registration are similar
regardless of the choice of the reference image (comparing Figs. 3a and 3b. Fig. 3 indicates that the observable
features, especially the nipple and the boundary of skin, have good agreement.
Fig. 4 suggusts that the results of the proposed method are comparable to the results of the diffeomorphic
transform implemented using ANTs, an open source software package. Particularly, the textures of warped
image are preserved in registered images, and the shape of registered image is similar as reference image. The
proposed method may have difficulties in registering some regions of the image (corresponding to region R4, see
equation (6)). Fig. 5 suggests that the features in the composite image show good agreement. The registration
error is smaller in the region of overlap (the upper part of the registered image), since we can extract the
corresponding feature points only from this region.
In our future work, we will apply the technique to more images in the DMIST database and develop statistical
measures of the registration accuracy.
5. CONCLUSIONS
A novel registration task is proposed, and two methods are compared in this task. This study indicates that our
newly proposed method may provide fast and comparatively accurate registration of overlapping breast images.
The method may be of value whether used standalone or for initialization of other modern registration
techniques (e.g., diffeomorphic transformation). The major drawback of the proposed method is the need for
manual extraction of feature points. Further work is needed on application of automatic feature selection (e.g.,
SIFT algorithm [10]
). Finally, we plan to perform more extensive quantitative validation of the proposed
algorithm on a series reference and warped images extracted from all the applicable images in the ACRIN
database.
6. ACKNOWLEDGMENT
This work was supported in part by the US Department of Defense (Breast Cancer Research Program HBCU
Partnership Training Award #BC083639 and the Center for Advanced Algorithms grant and Adaptive
Approach to Identify Unusual Behavior in Video Imagery grant #54412-CI-ISP) and the US National Science
Foundation (CREST grant #HRD-1242067).

Figure 4: Warped image (a), reference image (b) and the result using the proposed method (c) and Advanced
Normalization Tools (ANTs)[9] (d).
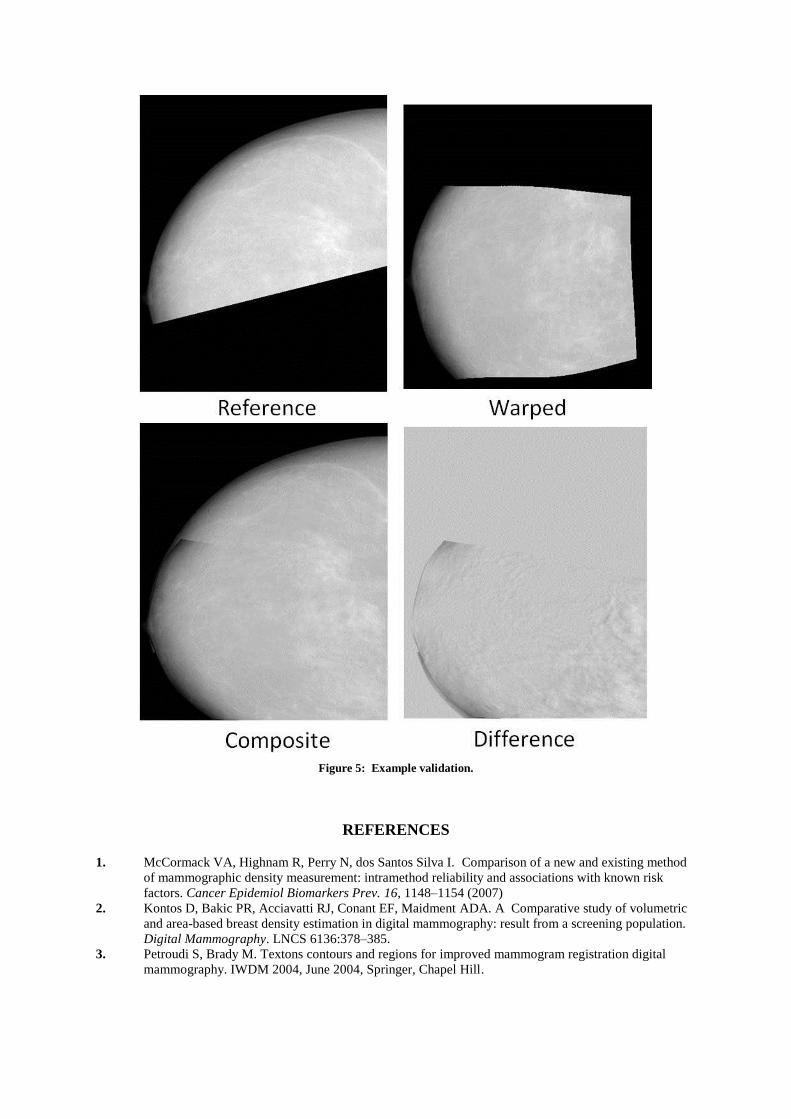
Figure 5: Example validation.
REFERENCES
1. McCormack VA, Highnam R, Perry N, dos Santos Silva I. Comparison of a new and existing method
of mammographic density measurement: intramethod reliability and associations with known risk
factors. Cancer Epidemiol Biomarkers Prev. 16, 1148–1154 (2007)
2. Kontos D, Bakic PR, Acciavatti RJ, Conant EF, Maidment ADA. A Comparative study of volumetric
and area-based breast density estimation in digital mammography: result from a screening population.
Digital Mammography. LNCS 6136:378–385.
3. Petroudi S, Brady M. Textons contours and regions for improved mammogram registration digital
mammography. IWDM 2004, June 2004, Springer, Chapel Hill.

4. Marti R, Zwiggelaar R, Rubin CME. Automatic mammographic registration: towards the detection of
abnormalities. Detection of linear structures in mammographic images. Medical image understanding
analysis. (2001) 5. Brzakovic D, Vujovic N, Neskovicand M, Brzakovic P, Fogerty K (1996) Mammogram analysis by
comparison with previous screenings. In: Doi K, Giger ML, Nishikawa RM,
Schmidt RA (eds) Digital Mammogrphy’96, Elsevier, Amsterdam
6. Wirth MA, Narhan J, Gray D (2002) Nonrigid mammogram registration using mutual information.
Proc SPIE 4684:562–573.
7. Shepard, D. (1968) A two-dimensional interpolation function for irregularly-spaced data, Proc. 23rd
National Conference ACM, ACM, 517-524.
8. Pisano ED, Gatsonis C, Hendrick E, et al. Diagnostic Performance of Digital versus Film
Mammography for Breast-Cancer Screening. NEJM 2005; 353:1773-1783.
9. Avants BB, Tustison, N.J., Song, G., Gee, J.C., 2009. ANTS: Advanced Open-Source Normalization
Tools for Neuroanatomy. Penn Image Computing and Science Laboratory.
10. Lowe DG, Object recognition from local scale-invariant features. Proceedings of the International
Conference on Computer Vision. 2. pp. 1150–1157.

Two Methods for Simulation of Dense Tissue Distribution in Software Breast Phantoms
Joseph H. Chui, Rongping Zeng*, David D. Pokrajac†, Subok Park*,
Kyle J. Myers*, Andrew D. A. Maidment, and Predrag R. Bakic
University of Pennsylvania, Department of Radiology, Philadelphia, PA * Center for Devices and Radiological Health, Food and Drug Administration, Silver Spring, MD
† Computer and Information Sciences Department, Delaware State University, Dover, DE
{Joseph.Chui | Andrew.Maidment | Predrag.Bakic}@uphs.upenn.edu [email protected] {Rongping.Zeng | Subok.Park | Kyle.Myers}@fda.hhs.gov
ABSTRACT Software breast phantoms have been developed for use in evaluation of novel breast imaging systems. Software phantoms are flexible allowing the simulation of wide variations in breast anatomy, and provide ground truth for the simulated tissue structures. Different levels of phantom realism are required depending on the intended application. Realistic simulation of dense (fibroglandular) tissue is of particular importance; the properties of dense tissue – breast percent density and the spatial distribution – have been related to the risk of breast cancer. In this work, we have compared two methods for simulation of dense tissue distribution in a software breast phantom previously developed at the University of Pennsylvania. The methods compared are: (1) the previously used Gaussian distribution centered at the phantom nipple point, and (2) the proposed combination of two Beta functions, one modeling the dense tissue distribution along the chest wall-to-nipple direction, and the other modeling the radial distribution in each coronal section of the phantom. Dense tissue distributions obtained using these methods have been compared with distributions reported in the literature estimated from the analysis of breast CT images. Qualitatively, the two methods produced rather similar dense tissue distributions. The simulation based upon the use of Beta functions provides more control over the simulated distributions through the selection of the various Beta function parameters. Both methods showed good agreement to the clinical data, suggesting both provide a high level of realism.
Keywords: Breast cancer imaging, anthropomorphic breast phantoms, software breast phantoms, validation, fibroglandular tissue distribution, Beta functions.
1. INTRODUCTION Virtual Clinical Trials (VCTs) are emerging as a preclinical complement to clinical trials of breast imaging systems which are often longer and more expensive. In VCT, the simulations of breast anatomy, image acquisition, and model observers are combined to form a simulation pipeline. Realistic simulation of dense tissue is of particular importance since several properties of dense tissue may be used as imaging biomarkers of breast cancer risk. In this paper, we consider improvements to the glandular tissue distribution of the breast anatomy simulation component of the pipeline. The 2D and volumetric fractional amount of dense tissue (called breast percent density) and the spatial distribution of dense tissue (called parenchymal texture) are known to correlate with cancer risk [1-7]. In this work we have compared two methods for simulation of dense tissue distribution in our software breast phantom design. The simulated distributions have been compared with distributions reported in the literature estimated from the analysis of breast CT images [8]. Covariance profiles estimated from phantom images, created with different methods for dense tissue simulation, are also compared to clinical data reported in the literature [11].
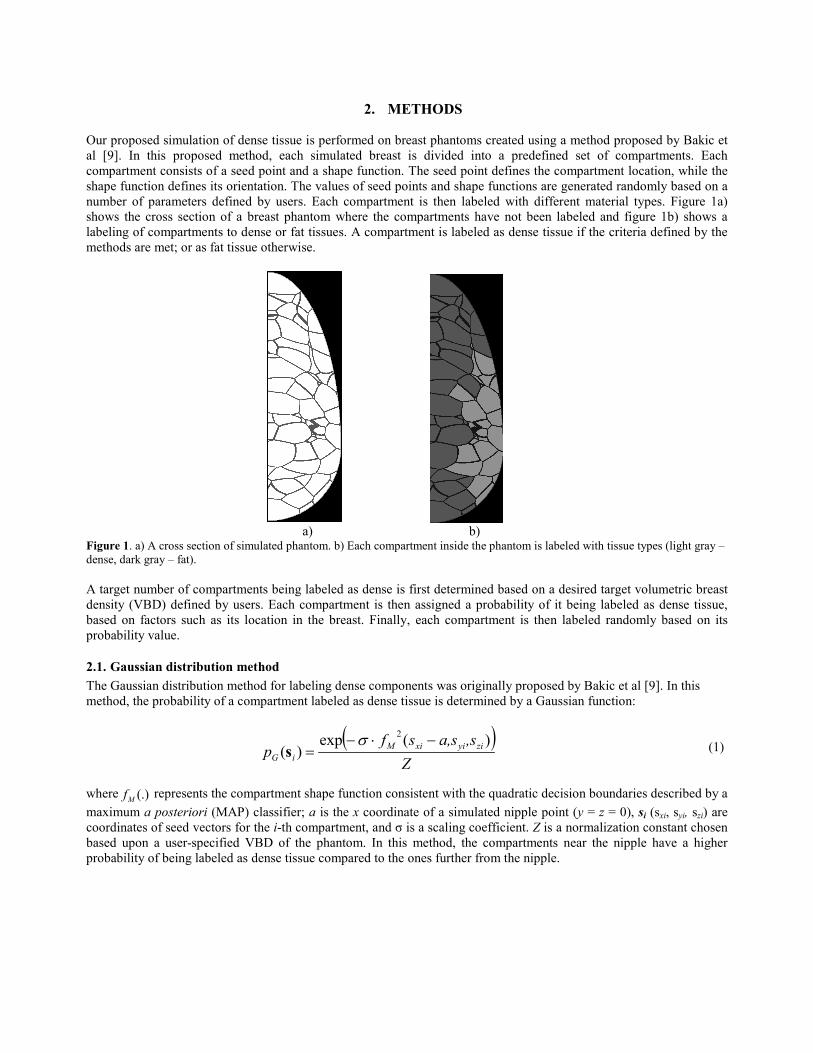
2. METHODS Our proposed simulation of dense tissue is performed on breast phantoms created using a method proposed by Bakic et al [9]. In this proposed method, each simulated breast is divided into a predefined set of compartments. Each compartment consists of a seed point and a shape function. The seed point defines the compartment location, while the shape function defines its orientation. The values of seed points and shape functions are generated randomly based on a number of parameters defined by users. Each compartment is then labeled with different material types. Figure 1a) shows the cross section of a breast phantom where the compartments have not been labeled and figure 1b) shows a labeling of compartments to dense or fat tissues. A compartment is labeled as dense tissue if the criteria defined by the methods are met; or as fat tissue otherwise.
a) b) Figure 1. a) A cross section of simulated phantom. b) Each compartment inside the phantom is labeled with tissue types (light gray – dense, dark gray – fat). A target number of compartments being labeled as dense is first determined based on a desired target volumetric breast density (VBD) defined by users. Each compartment is then assigned a probability of it being labeled as dense tissue, based on factors such as its location in the breast. Finally, each compartment is then labeled randomly based on its probability value.
2.1. Gaussian distribution method The Gaussian distribution method for labeling dense components was originally proposed by Bakic et al [9]. In this method, the probability of a compartment labeled as dense tissue is determined by a Gaussian function: (1) where (.)Mf represents the compartment shape function consistent with the quadratic decision boundaries described by a maximum a posteriori (MAP) classifier; a is the x coordinate of a simulated nipple point (y = z = 0), si (sxi, syi, szi) are coordinates of seed vectors for the i-th compartment, and σ is a scaling coefficient. Z is a normalization constant chosen based upon a user-specified VBD of the phantom. In this method, the compartments near the nipple have a higher probability of being labeled as dense tissue compared to the ones further from the nipple.
( )Z
,sa,ssfp ziyixiM
iG
)(exp)(
2 −⋅−=
σs

2.2. Beta distribution method In the Beta distribution method, the probability of a compartment labeled as dense tissue is determined by a function given by the product of two separate Beta functions: (2) where:
𝐵𝑒𝑡𝑎(𝑥; 𝑝, 𝑞) − 1𝐵(𝑝,𝑞)
𝑥𝑝−1(1 − 𝑥)𝑞−1, 0 ≤ 𝑥 ≤ 1,𝐵(𝑝, 𝑞) = ∫ 𝑡𝑝−110 (1 − 𝑡)𝑞−1𝑑𝑡,
sxi is the distance of i-th seed point from the chest wall in posterior to anterior direction; ri is the radial distance of seed point from center of its coronal slice; and Ri is the maximum radius of the coronal plane containing the i-th seed point. Since these two beta functions are functions of distance in different directions, the distributions of dense tissue can be controlled separately in the chest wall to nipple direction and radial direction. Moreover, the shape of the beta function changes with different (p, q) values. Figure 2 shows two examples of beta function where the shapes are one-sided or two-sided depending on the values of (p, q).
a) b)
Figure 2: Beta distributions of two different (p, q) values: a) p = 2, q = 3.5; b) p = 1.0, q = 0.75.
2.3. Simulated acquisition of phantom images Simulated mammograms are generated using software phantoms in a 2-step procedure. First, the breast deformation due to clinical mammographic compression is simulated by a finite element model [10]. The finite element model is implemented, using Abaqus (version 6.10-EF; Dessault Systèmes Americas, Waltham, MA), assuming a hyperelastic, almost incompressible material model for breast tissue, and 50% reduction in phantom thickness. Second, projection images of compressed phantoms are simulated using a ray-tracing method. The x-ray image acquisition model assumes a mono-energetic x-ray beam with the energy of 20 keV and an ideal detector with 100µm pixel size. The quantum noise is simulated by Poisson random variations and added to all simulated images.
2.4. Statistical analysis of phantom data
2.4.1. Analysis of dense tissue distributions The dense tissue simulated using different methods are quantified using metrics defined in Huang et al [8], called Radial Glandular Fraction (RGF) and Coronal Glandular Fraction (CGF). RGF and CGF are defined as
𝑅𝐺𝐹𝑛(𝑟) = �𝑁𝐷(𝑟, 𝑥)
𝑁𝐷(𝑟, 𝑥) + 𝑁𝐴(𝑟, 𝑥)�𝑥𝜖𝑛
(3)
𝐶𝐺𝐹(𝑥) =𝑁𝐷(𝑥)
𝑁𝐷(𝑥) + 𝑁𝐴(𝑥) (4)
Z
qpRrBetaqp
asBeta
p i
ixi
iB
),;(),;()(
2211 ×=s
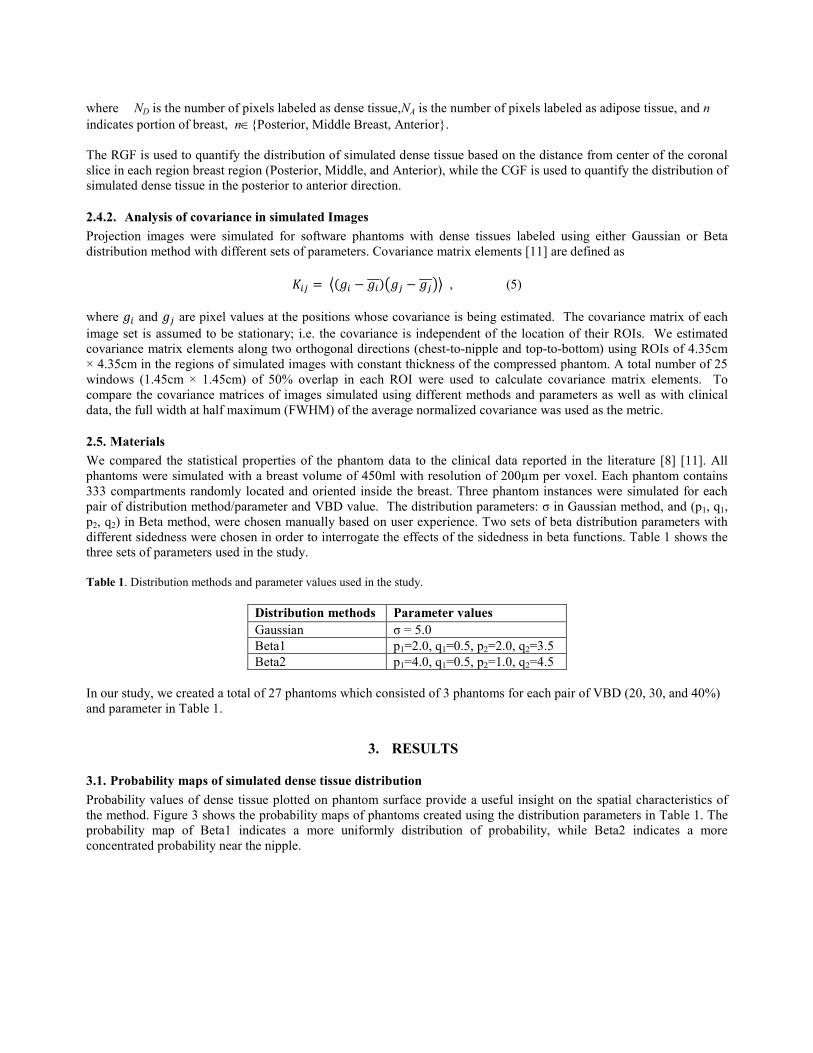
where ND is the number of pixels labeled as dense tissue,NA is the number of pixels labeled as adipose tissue, and n indicates portion of breast, n∈{Posterior, Middle Breast, Anterior}. The RGF is used to quantify the distribution of simulated dense tissue based on the distance from center of the coronal slice in each region breast region (Posterior, Middle, and Anterior), while the CGF is used to quantify the distribution of simulated dense tissue in the posterior to anterior direction.
2.4.2. Analysis of covariance in simulated Images Projection images were simulated for software phantoms with dense tissues labeled using either Gaussian or Beta distribution method with different sets of parameters. Covariance matrix elements [11] are defined as
𝐾𝑖𝑗 = �(𝑔𝑖 − 𝑔𝑖)�𝑔𝑗 − 𝑔𝑗�� , (5)
where 𝑔𝑖 and 𝑔𝑗 are pixel values at the positions whose covariance is being estimated. The covariance matrix of each image set is assumed to be stationary; i.e. the covariance is independent of the location of their ROIs. We estimated covariance matrix elements along two orthogonal directions (chest-to-nipple and top-to-bottom) using ROIs of 4.35cm × 4.35cm in the regions of simulated images with constant thickness of the compressed phantom. A total number of 25 windows (1.45cm × 1.45cm) of 50% overlap in each ROI were used to calculate covariance matrix elements. To compare the covariance matrices of images simulated using different methods and parameters as well as with clinical data, the full width at half maximum (FWHM) of the average normalized covariance was used as the metric.
2.5. Materials We compared the statistical properties of the phantom data to the clinical data reported in the literature [8] [11]. All phantoms were simulated with a breast volume of 450ml with resolution of 200µm per voxel. Each phantom contains 333 compartments randomly located and oriented inside the breast. Three phantom instances were simulated for each pair of distribution method/parameter and VBD value. The distribution parameters: σ in Gaussian method, and (p1, q1, p2, q2) in Beta method, were chosen manually based on user experience. Two sets of beta distribution parameters with different sidedness were chosen in order to interrogate the effects of the sidedness in beta functions. Table 1 shows the three sets of parameters used in the study. Table 1. Distribution methods and parameter values used in the study.
Distribution methods Parameter values Gaussian σ = 5.0 Beta1 p1=2.0, q1=0.5, p2=2.0, q2=3.5 Beta2 p1=4.0, q1=0.5, p2=1.0, q2=4.5
In our study, we created a total of 27 phantoms which consisted of 3 phantoms for each pair of VBD (20, 30, and 40%) and parameter in Table 1.
3. RESULTS
3.1. Probability maps of simulated dense tissue distribution Probability values of dense tissue plotted on phantom surface provide a useful insight on the spatial characteristics of the method. Figure 3 shows the probability maps of phantoms created using the distribution parameters in Table 1. The probability map of Beta1 indicates a more uniformly distribution of probability, while Beta2 indicates a more concentrated probability near the nipple.

a) b) c) Figure 3: Probability maps of compartments labeled as dense tissues: a) Gaussian b) Beta1 and c) Beta 2.
3.2. Dense tissue simulation Based on the probability values, calculated for each phantom compartment using the selected simulated method, the compartments are randomly labeled as containing dense or adipose tissue. Figure 4 shows the examples of phantoms of the same definition of compartment locations and orientations with dense tissue simulated using three sets of distribution parameters in Table 1. Compared to Gaussian and Beta2, dense tissue simulated using Beta1 are more distributed inside the breast. a) b) c) Figure 4: Phantoms with dense tissue simulated using a) Gaussian; b) Beta1; and c) Beta2.
3.3. RGF The analysis of RGF is intended to compare dense tissue distributions simulated using different methods and parameters to clinical data, based on the radial distance from the center of the coronal plane. In order to have a close comparison with the clinical data, each breast phantom was divided into three equal thickness regions (Posterior, Middle, and Anterior). The RGFs were then measured separately in each of these three regions. Figure 5 a) to c) show the average RGFs of simulated phantoms using the three pre-defined parameters. Figure 5 d) to f) (the dash lines) show the average RGFs measured from the clinical data by Huang et al [8]. It was observed that the RGFs of the three distribution parameters in Table 1 result in similar trend as clinical data. Among the three distribution parameters, Beta2 method results in the best fit to the clinical data qualitatively.
1.0
0.0

a)
b)
c) f)
Figure 5: Average RGFs estimated from the simulated and clinical data. a)–c) The average RGFs in anterior, middle and posterior regions of simulated data, respectively. d)—f) The average RGFs in the respective regions, estimated from clinical data; (reprinted with permission from Huang et al. [8]). The total and 25-75 percentile regions are indicated by dark and bright colors, respectively. The mean and median values are indicated by dash and solid lines, respectively.
d)
e)

3.4. CGF The analysis of CGF is intended to compare dense tissue distributions simulated using different methods and parameters to clinical data, based on the distance from the chest wall. Figure 6 a) shows the average CGFs measured from simulated distribution parameters in Table 1, and the dash line in Figure 6 b) shows the average CGFs measured from clinical data. Similar to the clinical data, the average CGFs measured from the simulated data increases with the coronal distance from the chest wall.
a) b) Figure 6: a) Average CGFs estimated from simulated data. b) Average CGFs (dash line) estimated from clinical data; (reprinted with permission from Huang et al [8].)
3.5. Simulated phantom images Software phantoms created with different distribution methods and parameters are deformed to simulate breast compression during mammography acquisitions. Figure 7 shows the simulated acquisitions of phantoms with dense tissue created using the parameters in Table 1. Compared to Gaussian and Beta2, the dense tissue is more widely distributed in the image simulated using Beta1.
a) b) c) Figure 7: Simulated x-ray acquisition of phantoms using a) Gaussian method; b) Beta1 method; and c) Beta2 method.

3.6. Covariance analysis of simulated images Average normalized covariance matrices measured from simulated acquisitions are shown in Figure 8 as function of the relative distance. The relative distance is equal to the spatial distance normalized by the window size used for estimating the covariance in the simulated images. Two windows are completely overlapped when the relative distance is 0, while only one row or column of pixels are overlapped when the relative distance is 1 or -1. The FWHMs of the average normalized covariance matrices are 0.381 (Gaussian), 0.433 (Beta1) and 0.344 (Beta2) for posterior-to-anterior direction; and 0.296 (Gaussian), 0.366 (Beta1) and 0.237 (Beta2) for top-to-bottom direction.
a) d)
b) e)
c) f) Figure 8: The profiles of average normalized covariance matrix measured from simulated acquisitions. Figure a) to c) are the profiles in posterior-to-anterior direction measured from a) Gaussian method; b) Beta1; and c) Beta2 method. Figures d) to f) are the respective profiles in top-to-bottom direction.
-0.2
0
0.2
0.4
0.6
0.8
1
-1 0 1
Nor
m. C
ovar
ianc
e
Relative Distance
-0.2
0
0.2
0.4
0.6
0.8
1
-1 0 1
Nor
m. C
ovar
ianc
e Relative Distance
-0.2
0
0.2
0.4
0.6
0.8
1
-1 0 1
Nor
m. C
ovar
ianc
e
Relative Distance -0.2
0
0.2
0.4
0.6
0.8
1
-1 0 1
Nor
m. C
ovar
ianc
e
Relative Distance
-0.2
0
0.2
0.4
0.6
0.8
1
-1 0 1
Nor
m. C
ovar
ianc
e
Relative Distance -0.2
0
0.2
0.4
0.6
0.8
1
-1 0 1
Nor
m. C
ovar
ianc
e
Relative Distance
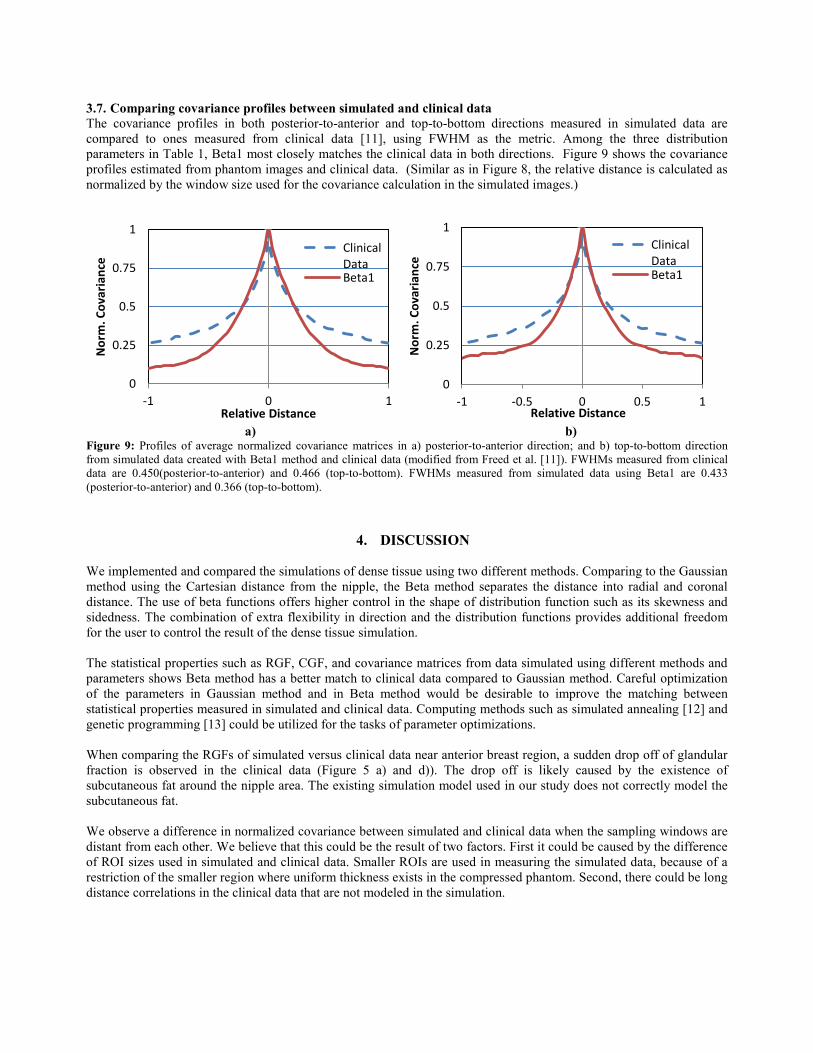
3.7. Comparing covariance profiles between simulated and clinical data The covariance profiles in both posterior-to-anterior and top-to-bottom directions measured in simulated data are compared to ones measured from clinical data [11], using FWHM as the metric. Among the three distribution parameters in Table 1, Beta1 most closely matches the clinical data in both directions. Figure 9 shows the covariance profiles estimated from phantom images and clinical data. (Similar as in Figure 8, the relative distance is calculated as normalized by the window size used for the covariance calculation in the simulated images.)
a) b) Figure 9: Profiles of average normalized covariance matrices in a) posterior-to-anterior direction; and b) top-to-bottom direction from simulated data created with Beta1 method and clinical data (modified from Freed et al. [11]). FWHMs measured from clinical data are 0.450(posterior-to-anterior) and 0.466 (top-to-bottom). FWHMs measured from simulated data using Beta1 are 0.433 (posterior-to-anterior) and 0.366 (top-to-bottom).
4. DISCUSSION
We implemented and compared the simulations of dense tissue using two different methods. Comparing to the Gaussian method using the Cartesian distance from the nipple, the Beta method separates the distance into radial and coronal distance. The use of beta functions offers higher control in the shape of distribution function such as its skewness and sidedness. The combination of extra flexibility in direction and the distribution functions provides additional freedom for the user to control the result of the dense tissue simulation.
The statistical properties such as RGF, CGF, and covariance matrices from data simulated using different methods and parameters shows Beta method has a better match to clinical data compared to Gaussian method. Careful optimization of the parameters in Gaussian method and in Beta method would be desirable to improve the matching between statistical properties measured in simulated and clinical data. Computing methods such as simulated annealing [12] and genetic programming [13] could be utilized for the tasks of parameter optimizations. When comparing the RGFs of simulated versus clinical data near anterior breast region, a sudden drop off of glandular fraction is observed in the clinical data (Figure 5 a) and d)). The drop off is likely caused by the existence of subcutaneous fat around the nipple area. The existing simulation model used in our study does not correctly model the subcutaneous fat. We observe a difference in normalized covariance between simulated and clinical data when the sampling windows are distant from each other. We believe that this could be the result of two factors. First it could be caused by the difference of ROI sizes used in simulated and clinical data. Smaller ROIs are used in measuring the simulated data, because of a restriction of the smaller region where uniform thickness exists in the compressed phantom. Second, there could be long distance correlations in the clinical data that are not modeled in the simulation.
0
0.25
0.5
0.75
1
-1 0 1
Nor
m. C
ovar
ianc
e
Relative Distance
ClinicalDataBeta1
0
0.25
0.5
0.75
1
-1 -0.5 0 0.5 1N
orm
. Cov
aria
nce
Relative Distance
ClinicalDataBeta1

5. CONCLUSION We have proposed a novel method to assign dense compartments based upon Beta distributions. The new method offers better user control in spatial directions and shape of distribution function. We compared the simulated results with clinical images using CGF and RGF, and showed qualitative agreement. Future work includes quantitative evaluation of the agreement and selection of optimal distribution parameters.
ACKNOWLEDGEMENT This work was supported in part by the US Department of Defense Breast Cancer Research Program (HBCU Partnership Training Award #BC083639), the US National Institutes of Health (R01 grant #CA154444), the US National Science Foundation (CREOSA grant #HRD-0630388), and the US Department of Defense/Department of Army (45395-MA-ISP, #54412-CI-ISP). The authors are grateful to Dr. Ingrid Reiser for fruitful discussions.
REFERENCES
[1] Wolfe, J.N.: Breast patterns as an index of risk for developing breast cancer. American Journal of Roentgenology 126, 1130-1139 (1976).
[2] Wolfe, J.N.: Risk for breast cancer development determined by mammographic parenchymal pattern. Cancer 37, 2486-2492 (1976).
[3] Boyd, N.F., Rommens, J.M., Vogt, K., Lee, V., Hopper, J.L., Yaffe, M.J. and Paterson, A.D.: Mammographic breast density as an intermediate phenotype for breast cancer. Lancet Oncol 6, 798-808 (2005).
[4] Li, H., Giger, M.L., Olopade, O.I., Margolis, A., Lan, L., Chinander, M.R.: Computerized texture analysis of mammographic parenchymal patterns of digitized mammograms. Academic Radiology 12, 863-873 (2005).
[5] Huo, Z., Giger, M.L., Olopade, O.I., Wolverton, D.E., Weber, B.L., Metz, C.E. and Zhong, W., Cummings, S.A.: Computerized analysis of digitized mammograms of brca1 and brca2 gene mutation carriers. Radiology 225, 519-526 (2002)
[6] Torres-Mejia, G., De, S.B., Allen, D.S., Perez-Gavilan, J.J., Ferreira, J.M., Fentiman, I.S. and Dos, S.S. I.: Mammographic features and subsequent risk of breast cancer: A comparison of qualitative and quantitative evaluations in the Guernsey prospective studies. Cancer Epidemiol Biomarkers Prev 14,1052-1059 (2005)
[7] Bakic, P.R., Carton, A.K., Kontos, D., Zhang, C., Troxel, A.B. and Maidment, A.D.: Breast percent density estimation from mammograms and central tomosynthesis projections. Radiology 2009-252(1):40-9.
[8] Huang, S.Y., Boone, J.M., Yang, K., Packard, N.J., McKenney, S.E., Prionas, N. D., Lindfors, K.K., Yaffe, M.J., The characterization of breast anatomical metrics using dedicated breast CT. Medical Physics 384, 2180-91 (2011).
[9] Pokrajac, D.D., Maidment, A.D.A., and Bakic, P.R. "Optimized generation of high resolution breast anthropomorphic software phantoms," Medical Physics, vol. 39, 2290-2302 (2012).
[10] Ruiter, N.V., Zhang, C., Bakic, P.R., Carton, A.-K., Kuo, J., Maidment, A.D.A.: “Simulation of tomosynthesis images based on an anthropomorphic breast tissue software phantom,” In Visualization, Image-guided Procedures, and Modeling, Proc. SPIE 6918, edited by M.I. Miga, K.R. Cleary (2008).
[11] Freed, M., Badal, A., Jennings, R.J., De Las Heras, H., Myers, K. J., Badano, A., "X-ray properties of an anthropomorphic breast phantom for MRI and x-ray imaging," Phys Med Biol., vol. 56, 3513-33 (2011).
[12] Kirkpatrick, S., Gelatt, C. D., Vecchi, M. P., "Optimization by Simulated Annealing," Science, vol. 220, no. 4598, 671–680 (1983).
[13] Banzhaf, W., Nordin, P., Keller, R.E., and Francone, F.D., Genetic Programming: An Introduction: On the Automatic Evolution of Computer Programs and Its Applications, Morgan Kaufmann (1998).