
Principal aspects taken into account in PRISM model: 1.Relationship between precipitation and...
14
Principal aspects taken into account in PRISM model: 1. Relationship between precipitation and elevation: • Precipitation increases with elevation, with a maximum in mountain crests • Relationship between precipitation and elevation can be described by a linear function 2. Spatial scale of orographic precipitation (orographic elevation) • Mismatch in scale when using actual elevation of stations • “Orographic” elevation estimation in order to avoid this mismatch • The orographic scale depends on the scale of the prevailing storm type • 5 min-DEM appears to approximate the scale of orographic effects explained by available data 3. Spatial patterns of orographic precipitation (facets)
-
Upload
gregory-poole -
Category
Documents
-
view
216 -
download
1
Transcript of Principal aspects taken into account in PRISM model: 1.Relationship between precipitation and...

Principal aspects taken into account in PRISM model:
1. Relationship between precipitation and elevation:
• Precipitation increases with elevation, with a maximum in mountain crests
• Relationship between precipitation and elevation can be described by a linear function
2. Spatial scale of orographic precipitation (orographic elevation)
• Mismatch in scale when using actual elevation of stations• “Orographic” elevation estimation in order to avoid this mismatch• The orographic scale depends on the scale of the prevailing storm
type• 5 min-DEM appears to approximate the scale of orographic effects
explained by available data
3. Spatial patterns of orographic precipitation (facets)
• PRISM divides the mountainous areas into “facets “• Each “facet” is a contiguous area of constant slope orientation

PRISM components:
1. FACET2. PRISM3. GRADIENT
FACET:
• A contiguous area with a constant slope orientation• FACET assigns a slope orientation to each DEM cell by
estimating elevation gradients W to E and S to N.
*
o o o
o o
o o o
(i,j)
(i,j+1)
(i,j-1)
(i-1,j) (i+1,j)
(i-1,j+1)
(i+1,j+1)
(i-1,j-1) (i+1,j-1)
column i, row j
W-E gradient:
elev(i-1, j) – elev(i+1, j)
S-N gradient:
elev(i, j-1) – elev(i, j+1)

• The slope is flat if: WE and SN gradient <= MINSTP• If slope is NOT flat: cell is categorized facing: N, S, E, or W
• To define a facet, important: number of data points (stations)• In many cases, number of points is very small a 5-point filter
applied (then, the spatial extent of a facet can be broadened):Unfiltered DEM, 8 filtering passes, 16, 24, 33 and 40 passes
Assimilations:• At least 2 grids needed to define a facet (if there is a single, is
assimilated into surrounding facets)• For narrow facets at the crest (net slope flat): precipitation at
crest is more similar to that of windward side than leeward (W and S)
FACET:

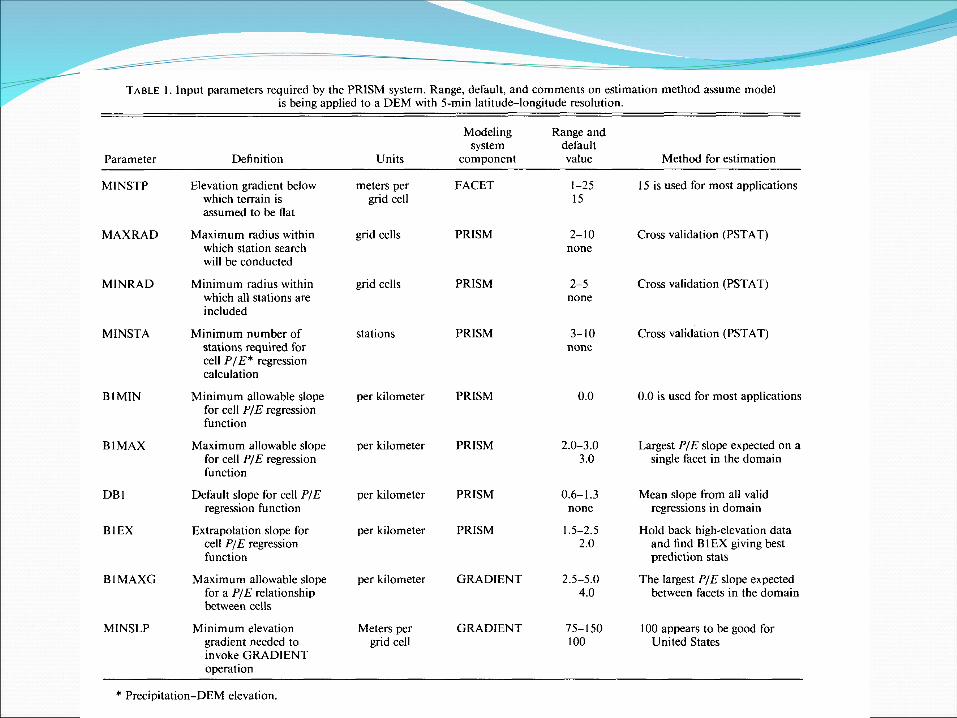

PRISM:
1. Estimation of “orographic” elevations for each precipitation station:
a. Locating the DEM grid cell center nearest to stationb. Find 4 surrounding grid cellsc. Calculate the weightd mean elevation of the 5 DEM cells
(each cell weighted inversely by its distance from the station)
o o
o o
o
o
o o o
*

2. Station retrieval:
Stations <= MAXRAD (maximum radius from DEM grid cell)
If station does not fall on cell’s facet: omittedIf station have same but a separate facet: ommitedIf number of stations < MINSTA (minimum number), then use filtered FACET grid until MINSTA is reachedIf NO station is available even with filtering, the ONE station nearest to DEM grid cell is selected (regardless of facet)
3. Precipitation-DEM elevation regression functions
Monthly and annual linear functions are generated using the station
data retrieved.Condition: MIN and MAX slope of the calculated regression lines ( B1MIN, B1MAX)

If slope falls outside the bounds: model tries to find an outlier station. If outlier station is found: is deletedIf it is not found: the slope is set to a prescribed value (DB1)If only one station is in the regression dataset: DB1 is used.
Regression slopes are not expressed in units. They are expressed as
a proportion of average precipitation
4. Precipitation estimation:
Monthly or annual precipitation is estimated at each grid cell:
Pij = b0ij + b1ijEij

5. Vertical extrapolation adjustment for coarse-grid simulations
• Smoothed DEM reduce the height of narrow or isolated mountains
• Algorithm to adjust precipitation estimates for locally high elevations:
Change the slope of the function to a prescribed value B1EX. The
new function begins on the old regression line at the elevation of
the highest station6. Estimation of prediction intervals
Degree of uncertainty, 95% prediction intervals
GRADIENT:
Check slopes of regressions to avoid discontinuities in predictions
between adjacent facets

PRISM APPLICATIONS (1994)
1. Willamette River Basin (Oregon)
• Most precipitation produced by cyclonic storms (fall, winter, spring)
• Dataset: annual precipitation 1982-88 at 52 stations (15 from SNOTEL and 37 from NWS)
SNOTEL: Soil conservation Service, USDA
• 5-min DEM (NGDC)

2. Northern Oregon
• Different orographic regimes and extreme spatial gradients in precipitation
• Dataset: 181 stations (more than 20 years of record) of monthly and annual precipitation, 130 from MWS and 51 from SNOTEL
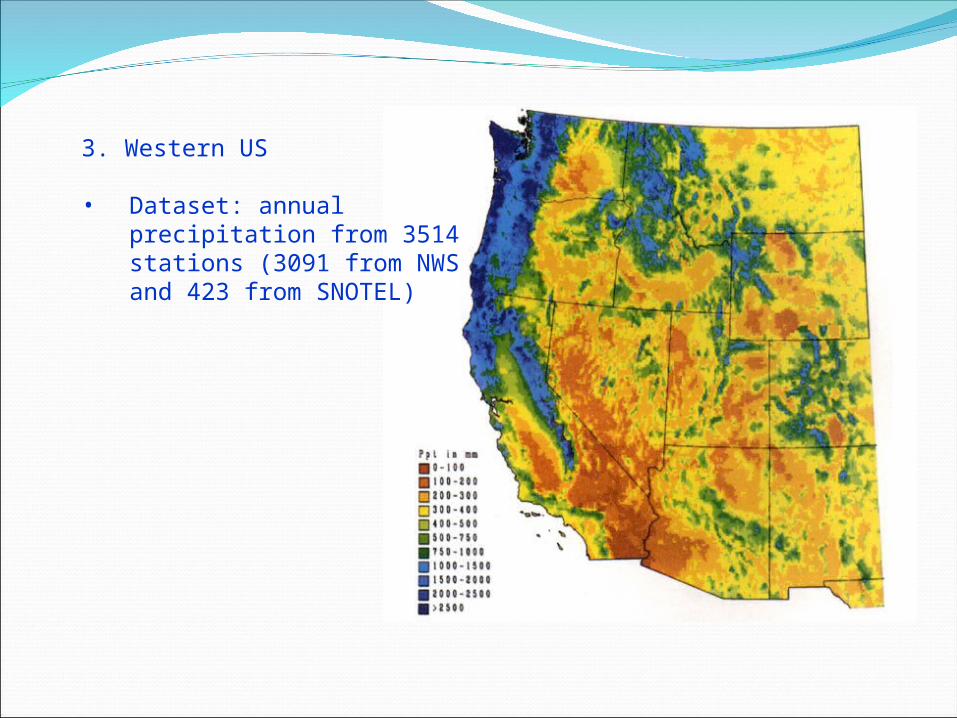
3. Western US
• Dataset: annual precipitation from 3514 stations (3091 from NWS and 423 from SNOTEL)

Limitations• The NWS and SNOTEL data have not been
subjected to rigorous checks for quality or accuracy
• The use of a coarse-grid DEM oversmoothes the elevations of sharply regions
• However and “optimal” DEM resolution presents a problem of scale matching (different orographic scales and limitation of available data)
• Assumption that maximum precipitation occurs at the crest of the mountains

CHANGES IN PAPER 2002
A KNOWLEDGE-BASED SYSTEM:
• Relationship precipitation-elevation• Topographic facets (can be defined at different
scales)• Coastal effects (proximity to ocean)• Two-layer atmosphere: if moist boundary layer is
shallow relative to terrain height, then the max precip is mid-slope)
• Orographic effectiveness of terrain