Primero bmo conference presentation 2015 final v2
44
TSX P I NYSE PPP I BMO 2015 GLOBAL METALS & MINING CONFERENCE February 22-25, 2015
-
Upload
primeromining -
Category
Investor Relations
-
view
80 -
download
2
Transcript of Primero bmo conference presentation 2015 final v2

TSX P I NYSE PPP I
BMO 2015 GLOBAL METALS & MINING CONFERENCE February 22-25, 2015

TSX P I NYSE PPP I
This presentation may contain “forward-looking” statements within the meaning of Canadian securities legislation and the United States Private Securities Litigation Reform Act of 1995. Forward-looking statements relate to future events or the anticipated performance of the Company and reflect management’s expectations or beliefs regarding such future events and anticipated performance. In certain cases, forward-looking statements can be identified by the use of words such as “plans”, “expects”, “is expected”, “budget”, “scheduled”, ”estimates”, ”forecasts”, ”intends”, ”anticipates” or “believes”, or variations of such words and phrases or statements that certain actions, events or results “may”, ”could”, “would”, ”might”, or “will be taken”, “occur” or “be achieved”, or the negative of these words or comparable terminology. By their very nature forward-looking statements involve known and unknown risks, uncertainties and other factors which may cause the actual performance of the Company to be materially different from any anticipated performance expressed or implied by the forward-looking statements. Such factors include various risks related to the Company’s operations, including, without limitation, fluctuations in spot and forward markets for gold, silver and other metals, fluctuations in currency markets, changes in national and local governments in Mexico and the speculative nature of mineral exploration and development, risks associated with obtaining necessary exploitation and environmental licenses and permits, and the presence of laws that may impose restrictions on mining. A complete list of risk factors are described in the Company’s annual information form and will be detailed from time to time in the Company’s continuous disclosure, all of which are, or will be available, for review on SEDAR at www.sedar.com. This presentation uses the terms “measured resources”, “indicated resources” and “inferred resources”. The Company advises readers that although these terms are recognized and required by Canadian regulations (under National Instrument 43-101 Standards of Disclosure for Mineral Projects (“NI 43-101”), the United States Securities and Exchange Commission does not recognize them. Readers are cautioned not to assume that any part or all of the mineral deposits in these categories will ever be converted in to reserves. In addition, “inferred resources” have a great amount of uncertainty as to their existence, and economic and legal feasibility. It cannot be assumed that all or any part of an inferred mineral resource will ever be upgraded to a higher category. Under Canadian rules, estimates of inferred mineral resources may not form the basis of feasibility or pre-feasibility studies, or economic studies, except for a Preliminary Assessment as defined under NI43-101. Investors are cautioned not to assume that part or all of an inferred resource exists, or is economically or legally mineable. Although the Company has attempted to identify important factors that could cause actual performance to differ materially from that described in forward-looking statements, there may be other factors that cause its performance not to be as anticipated. The Company neither intends nor assumes any obligation to update these forward-looking statements or information to reflect changes in assumptions or circumstances other than required by applicable law. There can be no assurance that forward-looking statements will prove to be accurate, as actual results and future events could differ materially from those currently anticipated. Accordingly, readers should not place undue reliance on forward-looking statements. Unless otherwise indicated, all dollar values herein are in US$.
Cautionary Statement
2
TSX P I NYSE PPP I 3
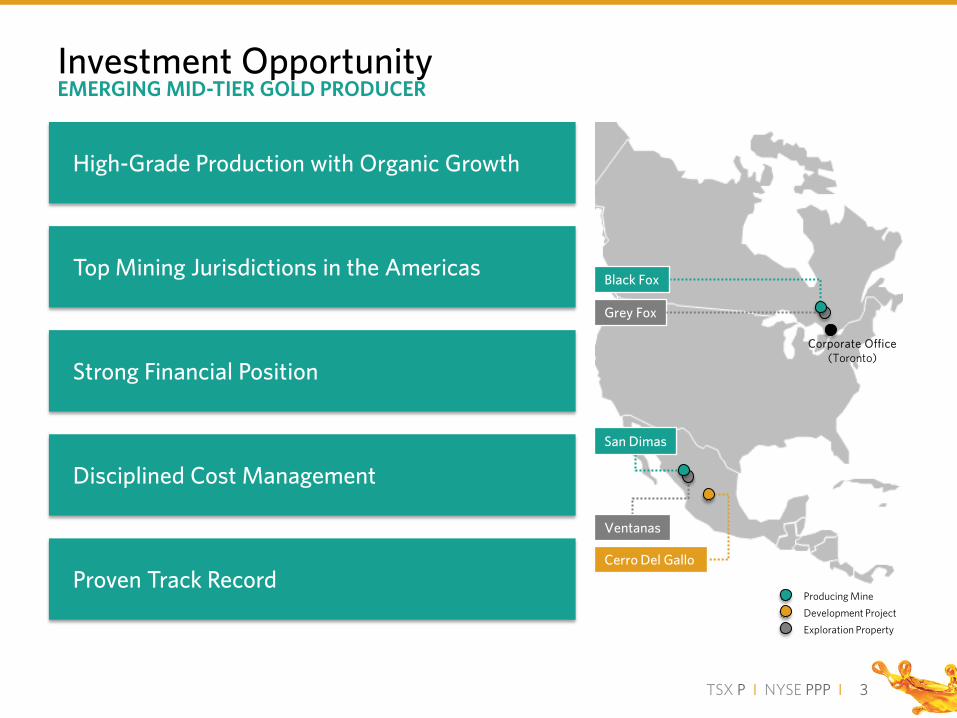
Investment Opportunity EMERGING MID-TIER GOLD PRODUCER
High-Grade Production with Organic Growth
Top Mining Jurisdictions in the Americas
Strong Financial Position
Disciplined Cost Management
Proven Track Record
Corporate Office (Toronto)
Producing Mine Development Project Exploration Property
Black Fox
Grey Fox
San Dimas
Cerro Del Gallo
Ventanas

TSX P I NYSE PPP I
2014 Achievements and 2015 Objectives
Reduced All Injury Frequency Rate by 36%
Met guidance and increased production by 57% to a record 225,100 AuEq oz
Diversified with acquisition of Black Fox operating mine
Expanded San Dimas to 2,500 TPD and announced further expansion to 3,000 TPD
Reinvested in asset expansion and optimization, resulting in all-in sustaining costs of $1,222/oz
Maintained strong balance sheet
4
INCREASED PRODUCTION BY 57%
Zero fatalities and reduce All Injury Frequency Rate by 15%
Increase production ~20% to 250,000 to 270,000 AuEq oz
Continue to grow gold reserves
Advance 3,000 TPD San Dimas expansion and operate Black Fox underground at 1,000 TPD
Optimize operations to achieve $1,100/oz or below all-in sustaining costs
Maintain strong balance sheet
2014 ACHIEVEMENTS 2015 OBJECTIVES

TSX P I NYSE PPP I
111
143 161
180 190
215 64
80
100
100
2012 2013 2014 2015E 2016E 2017E
Black Fox San Dimas
High-Grade Production with Organic Growth HIGHEST RESERVE GRADE AMONGST PEERS
Source: Company disclosure, based on available data.
300-350
250-270
280-300
Targeted Production Growth Profile (AuEq koz) 1,2
225
Average Gold Reserve Grade (g/t)
5
1.61
1.15 1.14 1.13
0.70
0.56 0.54
P AGI BTO AUQ NGD AR TMM
Peer Average
3
*See final slide for footnotes.

TSX P I NYSE PPP I
Top Mining Jurisdictions in the Americas
6
DIVERSIFIED, STABLE, MINING FRIENDLY JURISDICTIONS
Corporate Office TORONTO, ONTARIO
Producing Mine Development Project Exploration Property
Black Fox Mine TIMMINS, ONTARIO
Grey Fox Exploration Property TIMMINS, ONTARIO
San Dimas Mine SINALOA-DURANGO BORDER
Cerro Del Gallo Project GUANAJUATO
Ventanas Exploration Property DURANGO
Operating in attractive mining jurisdictions with: Long mining history Stable Government Established permitting process
Located in areas with: Existing infrastructure Skilled local workforce Suppliers Community support
70% MEXICO
30% CANADA
2015E PRODUCTION
BY REGION

TSX P I NYSE PPP I
Strong Financial Position
Exchanges TSX: P NYSE: PPP
Balance Sheet (December 31, 2014 – Pro Forma Convertible Debt Financing)
Cash
Line of Credit5
Total Liquidity
Convertible Debenture (6.5%, due Mar. 2016, US$14 conversion)
Convertible Debenture (5.75%, due Feb. 2020, US$6.55 conversion)
Line of Credit Draw Down5 (Due May 2017)
Total Debt4
$99 million
$35 million
~$134 million
$48 million
$75 million
$40 million
$163 million
Capital Structure
Common Shares Outstanding 6
Fully Diluted 7
Market Cap. At Feb. 19, 2015
162 million
192 million
C$656 million Source: 2015E-2016E Operating Cash Flow – Capital IQ consensus CFPS multiplied by current 162 million shares outstanding.
$134M
STRONG Liquidity
$163M4
PRUDENT Debt Level
December 31, 2014 – Pro Forma Convertible Debt Financing
Consensus Estimated Operating Cash Flow ($ millions)
7
$72 $74 $96
$128
$0
$50
$100
$150
2013 2014 2015E 2016E
*See final slide for footnotes.
SUFFICIENT LIQUIDITY TO DELIVER ORGANIC GROWTH

TSX P I NYSE PPP I
2014A OperatingEfficiencies
LowerSustaining
Capital
DecreasedG&A
2015E
$1,222
$1,050
$500
$600
$700
$800
$900
Disciplined Cost Management
8
2015 Cash Costs Guidance Range (US$/oz Au)*
*Cash costs are net of by-product credits. Based on available company disclosure and data from SNL Metals & Mining. See final slide for footnotes.
Corporate: o Rationalizing offices (closing Vancouver and
Mexico City offices) o Focused on reducing G&A San Dimas: o Expansion to 2,500 TPD increased
efficiencies of scale o Increased long-hole mining reduced dilution
by 30% o Expansion to 3,000 TPD expected to
reduce costs by a further ~$50/oz Black Fox: o Ongoing mining optimization program o Contractors reduced o Initiated 24-hour open-pit mining o Increasing long-hole stope inventory o Training to improve productivity and quality
control
Primero 2015 AISC Guidance vs. 2014 Results (US$/oz Au)8
FOCUSED ON INCREASING PRODUCTIVITY TO REDUCE COSTS

TSX P I NYSE PPP I
1.9
1.5
1.1
0.7
2011 2012 2013 2014
505
660
870 870
712 712
538
2011 2012 2013E 2014E*
Black FoxCerro del GalloSan Dimas
102 111
143 161
180
64
80
2011 2012 2013 2014 2015E
Black Fox
San Dimas
Proven Track Record
9
HISTORY OF DELIVERING RESULTS
155% GROWTH 320% GROWTH
*Gold Reserves as of December 31, 2013.
1,582
225
250-270
2,120
Production (AuEq koz)1,2 Gold Reserves (Au koz) Total Reportable Injury Frequency Rate
63% REDUCTION
3
*See final slide for footnotes.

TSX P I NYSE PPP I
Asset Overview PIPELINE OF ORGANIC GROWTH
10
San Dimas Platform
PRODUCTION PRODUCTION
EXPANSION Grey Fox & CDG
DEVELOPMENT
Black Fox Optimization
San Dimas 3,000 TPD

TSX P I NYSE PPP I
World Class Platform Asset
11
SAN DIMAS
*See final slide for footnotes.
Mineral Resources and Mineral Reserves (DECEMBER 31, 2013, MINERAL RESOURCES INCLUDE MINERAL RESERVES)
CLASSIFICATION TONNAGE (M TONNES)
GOLD GRADE (G/T)
CONT. GOLD (K OUNCES)
Mineral Reserves
Proven & Probable 4.9 5.5 870 Mineral Resources (includes Mineral Reserves)
Measured & Indicated 4.3 7.2 997
Inferred 7.3 4.2 998
Location Sinaloa-Durango, Mexico Ownership 100% (silver stream1)
Metals Gold & Silver Mining Underground Capacity 2,500 TPD Production1 175,000-185,000 AuEq oz
Costs8 $590-$640/AuEq oz

TSX P I NYSE PPP I
1,600
1,800
2,000
2,200
2,400
2,600
2,800
3,000
3,200
tonn
es p
er d
ay
ActualForecast
Expansion Plan
12
SAN DIMAS
Mill Expansion
Base Production
Mine Production to 2,150 tpd
Mine Production to 2,500 tpd
Mill Expansion
Mine Production to 2,900 tpd
2011 2012 2013 2014 2015 2016
Current Nameplate Capacity
Target 3,000 TPD Capacity
o Begin expansion to 3,000 TPD9
o Increase access to high-grade Victoria vein
o Implement 7 day, 12-hour shifts to optimize mine throughput
2014 o Increased reserve grade by 23%
o Expanded mill to 2,500 TPD
o Discovered new high-grade veins and extension of top producing veins
o Achieved record production of 161,000 AuEq oz
o Complete expansion to 3,000 TPD
o Increase mined grade to current gold reserve grade of 5.5 g/t
2015 2016

TSX P I NYSE PPP I
Proven History of Reserve & Resource Growth
505
660
870
577
780
997
704
762
998
2011 2012 2013
P&P Reserves ( Au Koz)
M&I Resources (Au Koz)
Inferred Resources (Au Koz)
(M&I Resources Include Mineral Reserves)
See slides 35, 36, 37, & 38
Significant Exploration Upside with Low Finding Costs o Completed 80,000 metres of drilling 2014, 2014 reserves and
resources to be released in Q1 2015 o 1H 2015: $6.4 million, 25,000 metres of drilling
SAN DIMAS
Low Finding Cost Per Ounce
247 311
$53.0
$34.7
2012 2013
P&P Reserves Discovered (Koz Au)P&P Discovery Cost(US$/oz Au)
13

TSX P I NYSE PPP I
Note: Based on public data, average depth of listed mines is 1,633 metres.
Established Jurisdiction with Proven Depth Potential Over 200 Million Ounces of Historical Production
BLACK FOX
14
TSX P I NYSE PPP I
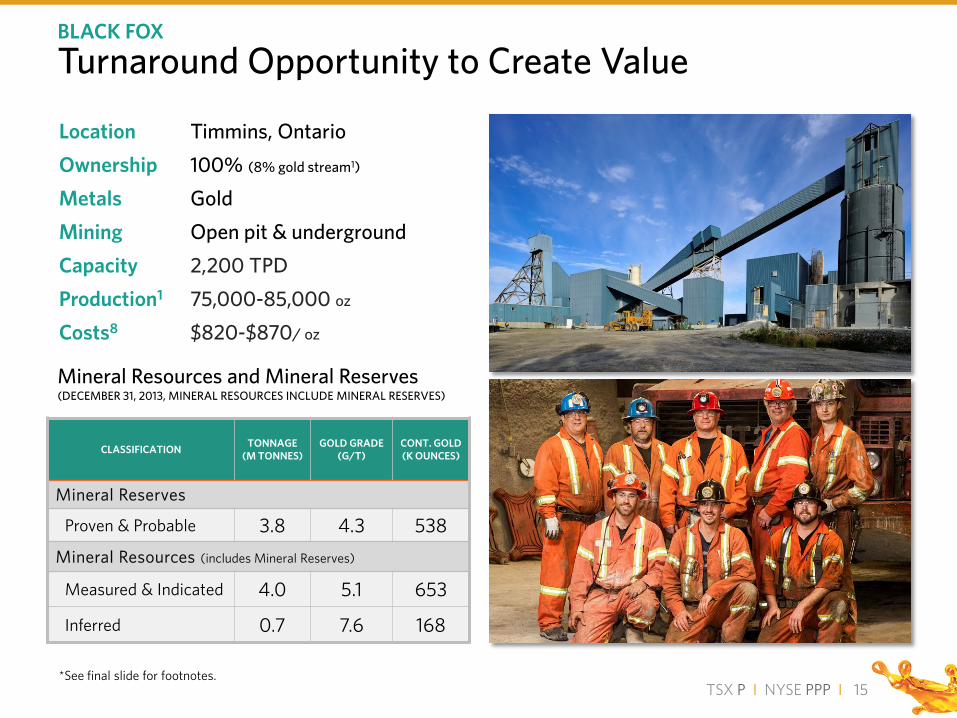
Turnaround Opportunity to Create Value
15
BLACK FOX
*See final slide for footnotes.
Location Timmins, Ontario Ownership 100% (8% gold stream1)
Metals Gold Mining Open pit & underground Capacity 2,200 TPD Production1 75,000-85,000 oz
Costs8 $820-$870/ oz
Mineral Resources and Mineral Reserves (DECEMBER 31, 2013, MINERAL RESOURCES INCLUDE MINERAL RESERVES)
CLASSIFICATION TONNAGE (M TONNES)
GOLD GRADE (G/T)
CONT. GOLD (K OUNCES)
Mineral Reserves
Proven & Probable 3.8 4.3 538 Mineral Resources (includes Mineral Reserves)
Measured & Indicated 4.0 5.1 653
Inferred 0.7 7.6 168

TSX P I NYSE PPP I
Optimization Program
o Acquisition and integration of Black Fox Complex o Commenced optimization program, focused on cost
reduction o Increased underground exploration and development o Discovered high-grade intercepts at depths up to 800
metres
o Build underground long-hole stope inventory o Finalize mill and tailings optimization o Continue in-fill drilling of lower central and east zones o Goal of identifying resources to depth of 1,000 metres
o Review the concept of sinking a shaft to access deep
mineralization o Complete detailed economic analysis to potentially
include Grey Fox as part of long term development at the Black Fox Complex
16
BLACK FOX
2014
2015
2016
Recent Black Fox Core

TSX P I NYSE PPP I
Focused on Reserve & Resource Development Lateral & Depth Expansion
BLACK FOX

TSX P I NYSE PPP I 18
0
Legend
Metal Factor Grade (g/t Au) x width (metres)
> 200
9800
9600
9400
9200
0 100m 200 m
Metal Factor (grade x width) BLACK FOX

TSX P I NYSE PPP I
Grey Fox
Promising Exploration Project GREY FOX
Location Ownership
4 km from Black Fox, Ontario 100% (no stream)
Measured & Indicated Gold Resources (koz) (5.3M tonnes at 3.3 g/t)
558
Inferred Gold Resources (koz) (1.6M tonnes at 4.4 g/t)
219
o Completed 76,000 metres of drilling in 2014.
o Planned another 50,000 metres in 2015.
o Positive exploration results announced to date from underground and open pit targets.

TSX P I NYSE PPP I
Catalysts and News Flow
Q3 2014 San Dimas Operating at 2,500 TPD Increases annual production rate to 165,000AuEq oz
Q1 2015 Reserve and Resource Update Including 226,000 metres of 2014 drilling
Q1 2015 Black Fox Complex Exploration Update Drilling from 520 metre level exploration drift at depth
Q3 2014 San Dimas 3,000 TPD Decision Expansion decision announced
Q4 2015 Grey Fox Scoping Study
Q4 2014 San Dimas Exploration Update Extended top producing veins
20
2014 Q1 2015 2015
REGULAR EXPLORATION UPDATES

TSX P I NYSE PPP I
$650 - 700 /oz
TOTAL CASH COST8
Disciplined Cost Management
250 – 270 koz
MEXICO & CANADA1,3
Producing in America’s Top Mining Jurisdictions
21
Positioned to Outperform DELIVERING SUPERIOR RETURNS
1.6 g/t
RESERVE GOLD GRADE
Highest Reserve Grade in Peer Group
$134 million
CASH & AVAILABLE CREDIT5
Strong Financial Position
+225 years
INDUSTRY EXPERIENCE
Experienced Board and Management
+35 %
VS. TSX GLOBAL GOLD
Proven Track Record
*See final slide for footnotes.
(100%)
(40%)
20%
80%
140%
Primero Mining Corp. S&P/TSX Global Gold Index
January 2012 to Present
Delivering Superior Returns to Primero Shareholders
APPENDICES

TSX P I NYSE PPP I 23
2015 Guidance
2014 Black Fox San Dimas Outlook 2015
Attributable gold equivalent production1 (gold equivalent ounces)
225,100 75,000-85,000 175,000-185,000 250,000-270,000
Gold Production (ounces) 190,000 75,000-85,000 145,000-155,000 220,000-240,000
Silver Production1 (million ounces) 6.15 6.5-7.5 6.5-7.5
Total cash costs8,10 (per gold equivalent ounce) $687 $820-$870 $590-$640 $650-$700
All-in Sustaining Costs8,10 (per gold ounce) $1,222 $1,075-$1,125 $840-$890 $1,000-$1,100
Capital Expenditures ($ millions) $80.5 $22.6 $41.4 $66.7
Exploration ($ millions) $34.3 $12.3 $6.4 $19.1
*See final slide for footnotes.
FURTHER 20% PRODUCTION GROWTH EXPECTED

TSX P I NYSE PPP I
2014 Financial Results
(US$ thousands, except per share amounts) 2014 2013
Revenues 274,612 200,326
Earnings from Mine Operations 52,663 76,004
Net income (loss) (224,384) (4,250)
EPS ($ per share)
(1.48) (0.04)
Adjusted net income11 5,365 38,668
Adjusted EPS11 ($ per share)
0.04 0.36
Operating cash flows12 before changes in working capital
73,658 72,396
CFPS12 ($ per share)
0.48 0.67 -
50
100
150
200
250
300
2013 2014
Revenues ($millions)
+37%
*See final slide for footnotes.
24

TSX P I NYSE PPP I
2014 Consolidated Production
Operating Results 2014 2013
Gold equivalent production1
(gold equivalent ounces) 225,054 143,114
Gold production (ounces)
189,943 111,983
Silver production1 (million ounces)
6.15 6.05
All-in Sustaining Costs8 ($ per gold ounce)
$1,222 $1,077
Cash cost8 ($ per AuEq ounce)
$687 $599
Cash cost8– by-product ($ per gold ounce)
$579 $389
*See final slide for footnotes.
-
50,000
100,000
150,000
200,000
250,000
2013 2014
+57%
Production (AuEq ounces)
25

TSX P I NYSE PPP I
2014 San Dimas Operating Results
2014 2013
Mill Throughput13
(tonnes per day) 2,463 2,101
Gold equivalent production1
(gold equivalent ounces) 161,170 143,114
Gold production (ounces)
126,059 111,983
Silver production1 (million ounces)
6.15 6.05
Gold grade (grams per tonne)
4.63 4.67
Silver grade (grams per tonne)
232 258
All-in Sustaining Costs8 ($ per gold ounce)
$826 $858
Cash cost8 ($ per AuEq ounce)
$628 $599
Cash cost8– by-product ($ per gold ounce)
$448 $389
San Dimas Production (AuEq ounces)
*See final slide for footnotes.
10,000
30,000
50,000
70,000
90,000
110,000
130,000
150,000
170,000
2013 2014
+13%
26

TSX P I NYSE PPP I
Q4 2014
2014 (March 5 –
December 31)
Mill Throughput13
(tonnes per day) 2,403 2,306
Gold Production (gold ounces) 20,334 63,884
Gold Grade (grams per tonne )
3.00 3.00
All-in Sustaining Costs8 ($ per gold ounce)
$1,374 $1,428
Cash cost8 ($ per gold ounce)
$799 $837
Black Fox Production (Au ounces)
*Prior to Primero’s acquisition. See final slide for footnotes.
2014 Black Fox Operating Results
-
5,000
10,000
15,000
20,000
25,000
Q12014*
Q22014
Q32014
Q42014
27

TSX P I NYSE PPP I
Lower 2015 Capital Expenditures 2015 GUIDANCE
28
Capital Expenditures Estimated 2015 Costs
San Dimas Underground Development $15.2 million
San Dimas Sustaining Capital $10.8 million
San Dimas Projects $15.4 million
San Dimas Sub Total $41.4 million
Black Fox Underground Development $13.4 million
Black Fox Sustaining Capital $4.5 million
Black Fox Projects $3.4 million
Grey Fox Development Studies $1.3 million
Black Fox Sub Total $22.6 million
Cerro del Gallo Development $2.7 million
Total $66.7 million
2014 Capital Expenditure $80.5million Note: Figures may not add due to rounding.

TSX P I NYSE PPP I
Exploration Expenditures Estimated 2015 Costs
San Dimas Diamond Drilling $3.1 million
San Dimas Drifting $1.9 million
San Dimas Regional Diamond Drilling $0.9 million
Ventanas Regional Diamond Drilling *$0.5 million
San Dimas Sub Total $6.4 million
Black Fox Diamond Drilling $5.0 million
Grey Fox & Regional Exploration $7.3 million
Black Fox Complex Sub Total $12.3 million
Cerro del Gallo Geology Mapping $0.4 million
Total $19.1 million
2014 Exploration $34.3 million
Continuing to Invest in Exploration 2015 GUIDANCE
29
Note: Ventanas Regional Drilling is expected to be treated as an exploration expense. Figures may not add due to rounding.

TSX P I NYSE PPP I
Stock Performance & Significant Events
30
0
10
20
30
-80%
-60%
-40%
-20%
0%
20%
40%
60%
80%
8/13/2010 2/13/2011 8/13/2011 2/13/2012 8/13/2012 2/13/2013 8/13/2013 2/13/2014 8/13/2014 2/13/2015
Vol
ume
(Mill
ions
)
P-T Volume
Primero Mining Corp.
S&P/TSX Global Gold Index
Primero IPO, Begins Trading on the TSX, and Finalizes San Dimas Acquisition
Primero Announces Brigus Gold Acquisition
Primero Added to S&P/TSX Composite Index Primero
Announces San Dimas Expansion Plan Phase 1
Primero Begins Trading on the NYSE Primero Announces
Acquisition of Cerro Del Gallo
Primero Announces APA Ruling
Spot Gold Hits 4-Year Low

TSX P I NYSE PPP I 31
Summary of Debt & Tradable Securities
Primero Warrants TSX: P.WT
Convertible Debentures TSX: P.DB.U
Revolving Line of Credit Facility
Convertible Debentures TSX:P.DB.V
Face Value n/a $48.1 million Drawn at Dec. 31, 2014: $40.0 million $75.0 million
Maturity / Expiry July 20, 2015 March 31, 2016 May 23, 2017 February 28, 2020
Interest Rate n/a 6.5% Floating Rate (see below) 5.75%
Payable n/a Semi-Annually Monthly Semi-Annually
Conversion / Strike C$8.00 US$14.00 n/a US$6.55
Additional Notes CUSIP: 74164W114 Provision for forced conversion if the market price of the Primero’s shares is at least 125% of the conversion price
CUSIP: 74164WAA4
The floating interest rate was approximately 4.75% per annum during the year ended December 31, 2014
Not redeemable prior to Feb. 2018
Provision for early redemption if the market price of the Primero’s shares is at least 125% of the conversion price
CUSIP: 74164WAB2
TSX P I NYSE PPP I
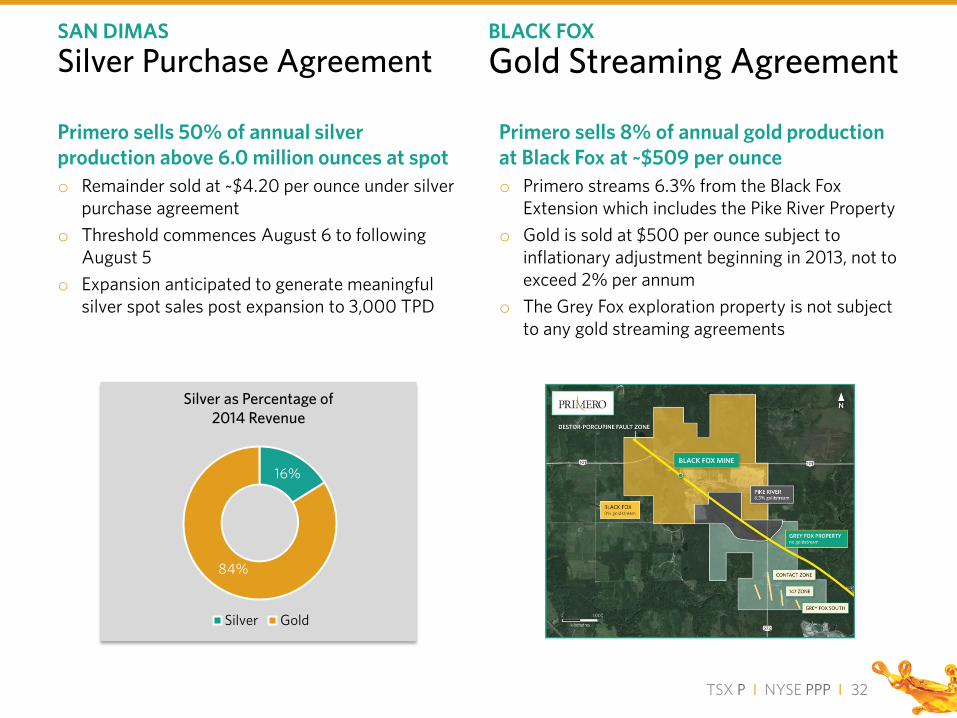
Silver Purchase Agreement
Primero sells 50% of annual silver production above 6.0 million ounces at spot o Remainder sold at ~$4.20 per ounce under silver
purchase agreement o Threshold commences August 6 to following
August 5 o Expansion anticipated to generate meaningful
silver spot sales post expansion to 3,000 TPD
Primero sells 8% of annual gold production at Black Fox at ~$509 per ounce o Primero streams 6.3% from the Black Fox
Extension which includes the Pike River Property o Gold is sold at $500 per ounce subject to
inflationary adjustment beginning in 2013, not to exceed 2% per annum
o The Grey Fox exploration property is not subject to any gold streaming agreements
SAN DIMAS BLACK FOX
Gold Streaming Agreement
16%
84%
Silver Gold
Silver as Percentage of 2014 Revenue
32

TSX P I NYSE PPP I
Focus on Responsible Mining
HEALTH AND SAFETY o We understand that our most important assets are
our people and their safety is our number one priority
o We maintain world-class health and safety policies
ENVIRONMENT o San Dimas is certified as “Clean Industry” by
PROFEPA (Mexican EPA)
o We utilize sustainable green technologies where possible - Primero’s own hydroelectric dam supplies the majority of San Dimas Mine’s power
COMMUNITY o We treat our local communities as our partners
o We focus on understanding our local communities goals and providing local opportunities
o We promote local education with awards for the local technical college in San Dimas
33

TSX P I NYSE PPP I
District-Wide Exploration Potential SAN DIMAS
SW NE 3,000 m.
2,000 m.
1,000 m.
Source: San Dimas Geology Office
WEST BLOCK 2015 Exploration
SAN ANTONIO Mined 1987-2002
CENTRAL BLOCK Mined 2002-Current
TAYOLTITA BLOCK Mined 1975-Current
ARANA HANGING WALL
SINALOA GRABEN
Mined 2012-Current
2015 EXPLORATION PROGRAM Drilling for Extensions of Known Veins
Longitudinal Cross Section
3,000 m.
2,000 m.
1,000 m.
Mineralization – Ore Bodies
Extension of the Favorable Horizon
Potential
Intrusive
Faults
LEGEND Kilometers
0 1 2
34

TSX P I NYSE PPP I
Project Summary
Location Guanajuato State, Mexico Ownership 100% Metals Gold, silver, & copper Mining Open pit, heap leach and/or conventional mill Stage Feasibility Study published May 2012 on Heap Leach scenario
Established Infrastructure: Active mining district, skilled local workforce, grid power, water, sealed roads, equipment suppliers and established transport routes.
Supportive Community: District has produced 1.14 billion oz of silver and 6.5 million oz of gold over its 450 year mining history.
Construction Decision: Contingent on the project achieving a 15% IRR at $1,100/oz gold
Potential for an Additional 95,000 AuEq oz
CERRO DEL GALLO
First Stage Heap Leach DFS – Operational Data (May 2012)1
Avg LOM Gold Grade 0.69 g/t
Avg LOM Annual Throughput 4.5 Mt
Gold Equivalent Production 95 koz /yr
Gold Production 68 koz /yr
Silver Production 1,072 koz /yr
Copper Production 1,113 t/year
Estimated Cash Costs2 ~$700/oz
Proven & Probable Gold Reserves (3.2M tonnes at 0.69 g/t)
710koz
Measured & Indicated Gold Resources (Exclusive of Reserves) (47.9M tonnes at 0.60 g/t)
920koz
Inferred Gold Resources (20M tonnes at 0.3 g/t)
190koz
Mine Life (Stage 1) 7.2 years
(1) “Technical Report First Stage Heap Leach Feasibility Study, Cerro del Gallo Gold
Silver Project, Guanajuato, Mexico” June 2012 . Effective date May 11th 2012 (2) Cash cost is a non-IFRS measurement.
Large Gold Domain
Feasibility Study Results
35

TSX P I NYSE PPP I
Classification Tonnage (Million Tonnes) Gold Grade (G/T) Silver Grade
(G/T) Contained Gold (000 Ounces)
Contained Silver (000 Ounces)
Mineral Reserves Proven & Probable 4.893 5.5 315 870 49,479
Mineral Resources Measured & Indicated 4.282 7.2 419 997 57,713
Inferred 7,333 4.2 310 998 72,647 Notes to Mineral Reserve Statement: Cutoff grade of 2.7 grams per tonne (”g/t”) gold equivalent (“AuEq”) based on total operating cost of US$104.97/t. Metal prices assumed are gold US$1,250 per troy ounce and silver US$20 per troy ounce. Silver supply contract obligations have been referenced in determining overall vein reserve estimate viability. Processing recovery factors for gold and silver of 97% and 94% assumed. Exchange rate assumed is 13 pesos/US$1.00. The Mineral Reserve estimates were prepared under the supervision of Mr. Gabriel Voicu P.Geo., Vice President, Geology and Exploration, Primero and a QP for the purposes of National Instrument 43-101 (“NI 43-101”). Notes to Mineral Resource Statement: Mineral Resources are total and include those resources converted to Mineral Reserves. A 2.0g/t AuEq cutoff grade is applied and the gold equivalent is calculated at a gold price of US$1,300 per troy ounce and a silver price of US$20 per troy ounce. A constant bulk density of 2.7 tonnes/m3 has been used. The Mineral Resource estimates were prepared by Mr. Rodney Webster MAusIMM, MAIG and Mr. J. Morton Shannon P.Geo., both of AMC Mining Consultants (Canada) Ltd. and a QP for the purposes of NI 43-101.
Additional exploration potential was estimated at 6-10 million tonnes at grade ranges of 3-5 grams per tonne of gold and 200-400 grams per tonne of silver as of December 31, 2011. It should be noted that these targets are conceptual in nature. There has been insufficient exploration to define an associated Mineral Resource and it is uncertain if further exploration will result in the target being delineated as a Mineral Resource.
Mineral Resources and Mineral Reserves (December 31, 2013, Mineral Resources include Mineral Reserves)
SAN DIMAS
36

TSX P I NYSE PPP I
Notes to Black Fox Mineral Reserve estimate: 1. Mineral Reserves stated as at December 31, 2013. 2. Open pit cut-off grade of 1.0 g/t Au and underground cut-off grade of 3.4 g/t. 3. Gold price assumed is US$1,250 per troy ounce. 4. Processing gold recovery factor 94% assumed. 5. Harold Brisson, PhD, Eng. is the Qualified Person for the Black Fox Complex Mineral Resource estimates. Notes to Black Fox Mineral Resource estimate: 1. Mineral Reserves stated as at December 31, 2013. 2. Open pit cut-off grade of 0.9 g/t Au and underground cut-off grade of 3.0 g/t. 3. Gold price assumed is US$1,300 per troy ounce and exchange rate of US$1.00=C$1.10 was used in the gold cut-off grade calculations. 4. Detailed footnotes can be found in the NI 43-101 Technical Report titled “TECHNICAL REPORT ON THE MINERAL RESOURCE AND MINERAL RESERVE ESTIMATES FOR
THE BLACK FOX COMPLEX”, dated June 30, 2014 and filed on www.sedar.com.
Classification Tonnage (Tonnes)
Gold Grade (G/T)
Cont. Gold (Ounces)
Proven & Probable Reserves Open Pit 1,468,500 3.7 173,900 Underground 1,663,900 6.3 339,100 Stockpile 716,200 1.1 24,700 Total 3,848,700 4.3 537,700 Measured & Indicated Resources, Including Reserves Open Pit 1,423,900 4.0 182,518 Underground 1,852,800 7.5 445,336 Stockpile 716,200 1.1 24,706 Total 3,992,800 5.1 652,560 Inferred Resources Open Pit 364,100 5.8 67,897 Underground 326,300 9.5 99,889 Total 690,400 7.6 167,786
Mineral Resources and Mineral Reserves (December 31, 2013, Mineral Resources include Mineral Reserves)
BLACK FOX
37
TSX P I NYSE PPP I
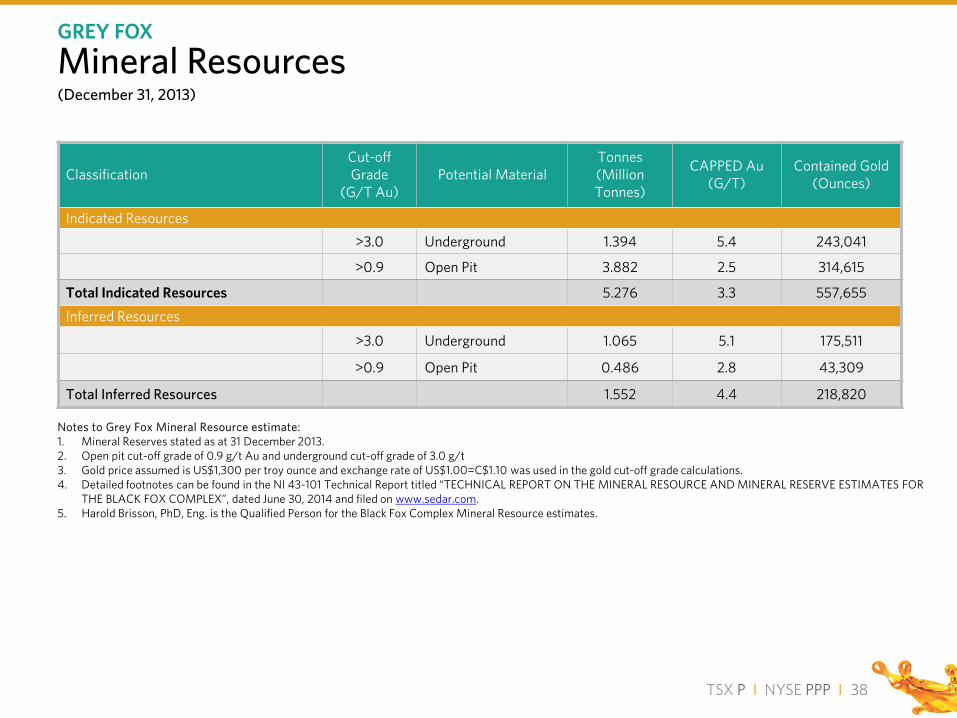
Classification Cut-off Grade
(G/T Au) Potential Material
Tonnes (Million Tonnes)
CAPPED Au (G/T)
Contained Gold (Ounces)
Indicated Resources >3.0 Underground 1.394 5.4 243,041
>0.9 Open Pit 3.882 2.5 314,615
Total Indicated Resources 5.276 3.3 557,655
Inferred Resources
>3.0 Underground 1.065 5.1 175,511
>0.9 Open Pit 0.486 2.8 43,309
Total Inferred Resources 1.552 4.4 218,820
Notes to Grey Fox Mineral Resource estimate: 1. Mineral Reserves stated as at 31 December 2013. 2. Open pit cut-off grade of 0.9 g/t Au and underground cut-off grade of 3.0 g/t 3. Gold price assumed is US$1,300 per troy ounce and exchange rate of US$1.00=C$1.10 was used in the gold cut-off grade calculations. 4. Detailed footnotes can be found in the NI 43-101 Technical Report titled “TECHNICAL REPORT ON THE MINERAL RESOURCE AND MINERAL RESERVE ESTIMATES FOR
THE BLACK FOX COMPLEX”, dated June 30, 2014 and filed on www.sedar.com. 5. Harold Brisson, PhD, Eng. is the Qualified Person for the Black Fox Complex Mineral Resource estimates.
Mineral Resources (December 31, 2013)
GREY FOX
38
TSX P I NYSE PPP I
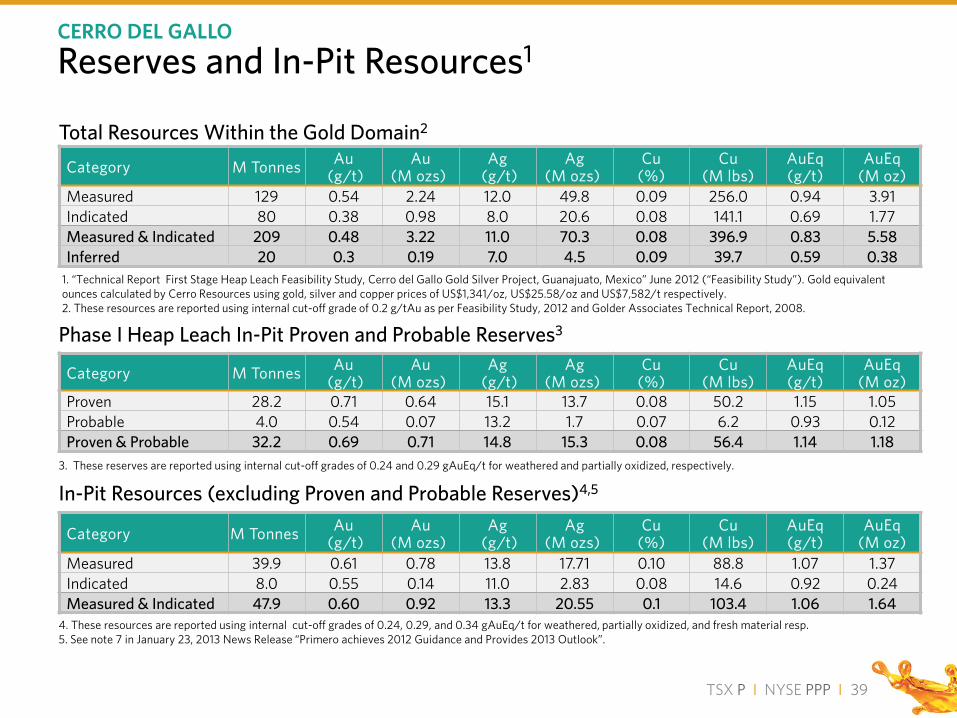
Category M Tonnes Au (g/t)
Au (M ozs)
Ag (g/t)
Ag (M ozs)
Cu (%)
Cu (M lbs)
AuEq (g/t)
AuEq (M oz)
Proven 28.2 0.71 0.64 15.1 13.7 0.08 50.2 1.15 1.05 Probable 4.0 0.54 0.07 13.2 1.7 0.07 6.2 0.93 0.12 Proven & Probable 32.2 0.69 0.71 14.8 15.3 0.08 56.4 1.14 1.18
Category M Tonnes Au (g/t)
Au (M ozs)
Ag (g/t)
Ag (M ozs)
Cu (%)
Cu (M lbs)
AuEq (g/t)
AuEq (M oz)
Measured 39.9 0.61 0.78 13.8 17.71 0.10 88.8 1.07 1.37 Indicated 8.0 0.55 0.14 11.0 2.83 0.08 14.6 0.92 0.24 Measured & Indicated 47.9 0.60 0.92 13.3 20.55 0.1 103.4 1.06 1.64
Total Resources Within the Gold Domain2
Phase I Heap Leach In-Pit Proven and Probable Reserves3
In-Pit Resources (excluding Proven and Probable Reserves)4,5
Category M Tonnes Au (g/t)
Au (M ozs)
Ag (g/t)
Ag (M ozs)
Cu (%)
Cu (M lbs)
AuEq (g/t)
AuEq (M oz)
Measured 129 0.54 2.24 12.0 49.8 0.09 256.0 0.94 3.91 Indicated 80 0.38 0.98 8.0 20.6 0.08 141.1 0.69 1.77 Measured & Indicated 209 0.48 3.22 11.0 70.3 0.08 396.9 0.83 5.58 Inferred 20 0.3 0.19 7.0 4.5 0.09 39.7 0.59 0.38
1. “Technical Report First Stage Heap Leach Feasibility Study, Cerro del Gallo Gold Silver Project, Guanajuato, Mexico” June 2012 (“Feasibility Study”). Gold equivalent ounces calculated by Cerro Resources using gold, silver and copper prices of US$1,341/oz, US$25.58/oz and US$7,582/t respectively. 2. These resources are reported using internal cut-off grade of 0.2 g/tAu as per Feasibility Study, 2012 and Golder Associates Technical Report, 2008.
3. These reserves are reported using internal cut-off grades of 0.24 and 0.29 gAuEq/t for weathered and partially oxidized, respectively.
4. These resources are reported using internal cut-off grades of 0.24, 0.29, and 0.34 gAuEq/t for weathered, partially oxidized, and fresh material resp. 5. See note 7 in January 23, 2013 News Release “Primero achieves 2012 Guidance and Provides 2013 Outlook”.
CERRO DEL GALLO
Reserves and In-Pit Resources1
39
TSX P I NYSE PPP I
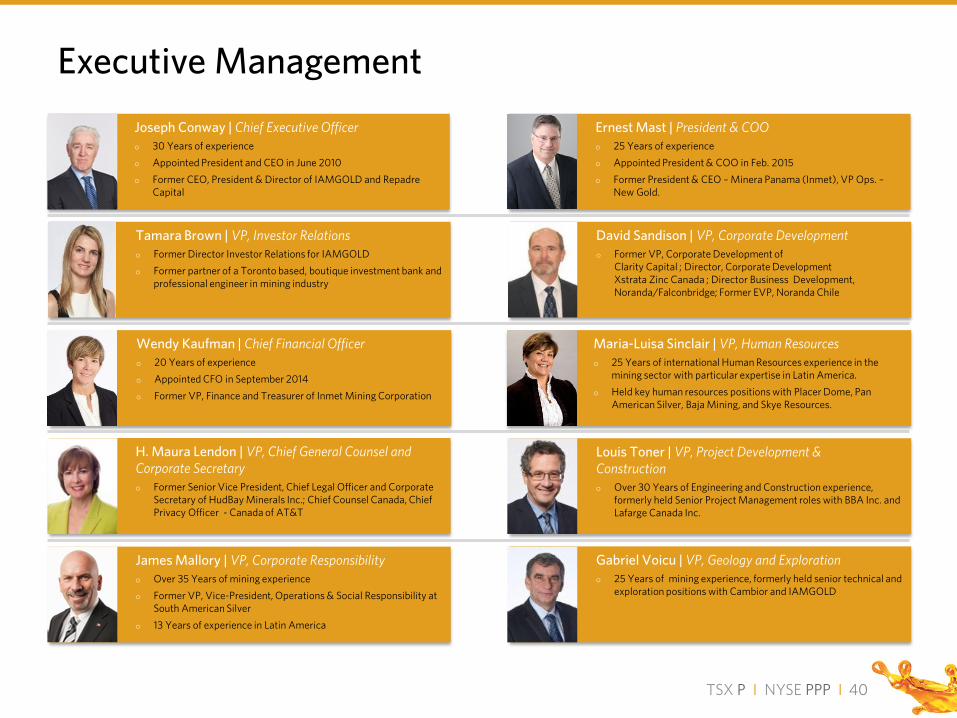
Tamara Brown | VP, Investor Relations Former Director Investor Relations for IAMGOLD Former partner of a Toronto based, boutique investment bank and
professional engineer in mining industry
H. Maura Lendon | VP, Chief General Counsel and Corporate Secretary Former Senior Vice President, Chief Legal Officer and Corporate
Secretary of HudBay Minerals Inc.; Chief Counsel Canada, Chief Privacy Officer - Canada of AT&T
David Sandison | VP, Corporate Development Former VP, Corporate Development of
Clarity Capital ; Director, Corporate Development Xstrata Zinc Canada ; Director Business Development, Noranda/Falconbridge; Former EVP, Noranda Chile
Louis Toner | VP, Project Development & Construction Over 30 Years of Engineering and Construction experience,
formerly held Senior Project Management roles with BBA Inc. and Lafarge Canada Inc.
Gabriel Voicu | VP, Geology and Exploration 25 Years of mining experience, formerly held senior technical and
exploration positions with Cambior and IAMGOLD
James Mallory | VP, Corporate Responsibility Over 35 Years of mining experience Former VP, Vice-President, Operations & Social Responsibility at
South American Silver 13 Years of experience in Latin America
Joseph Conway | Chief Executive Officer 30 Years of experience Appointed President and CEO in June 2010 Former CEO, President & Director of IAMGOLD and Repadre
Capital
Wendy Kaufman | Chief Financial Officer 20 Years of experience Appointed CFO in September 2014 Former VP, Finance and Treasurer of Inmet Mining Corporation
Executive Management
40
Ernest Mast | President & COO 25 Years of experience Appointed President & COO in Feb. 2015 Former President & CEO – Minera Panama (Inmet), VP Ops. –
New Gold.
Maria-Luisa Sinclair | VP, Human Resources 25 Years of international Human Resources experience in the
mining sector with particular expertise in Latin America. Held key human resources positions with Placer Dome, Pan
American Silver, Baja Mining, and Skye Resources.

TSX P I NYSE PPP I
Robert Quartermain | Director 2,3
Founder and President & CEO, Pretivm Resources Former President and CEO of Silver Standard
Brad Marchant | Director 1
Co-founder of Triton Mining Corporation Founder of BioteQ Environmental Technologies Inc.
Michael Riley | Director 2,5
Chartered accountant with more than 26 years of accounting experience
Chair of Primero Audit Committee
Eduardo Luna | Director 1
Former EVP & President, Mexico. Former Chairman and CEO of Silver Wheaton, Executive VP of Goldcorp and Luismin S.A. de C.V. (San Dimas) and President of Mexican Mining Chamber and the Silver Institute
Rohan Hazelton | Director 1
VP, Strategy, Goldcorp Formerly with Wheaton River and Deloitte & Touche
LLP
Grant Edey | Director 3,4,5
President & CEO, Khan Resources Inc. Former Director of Breakwater Resources, former
director of Queenstake Resources, Santa Cruz Gold Former CFO, IAMGOLD
David Demers | Director 2,3,4,5
Founder, CEO and Director Westport Innovations Director of Cummins Westport and
Juniper Engines
Wade Nesmith | Chairman Founder of Primero Founding and current director of Silver Wheaton
Board of Directors
41 Board Committees: 1. Health, Safety and Environment 2. Human Resources 3. Governance and Nominating 4. Lead Director 5. Audit
Joseph Conway | Director see Executive Management

TSX P I NYSE PPP I
This presentation has been prepared in accordance with the requirements of Canadian provincial securities laws which differ from the requirements of U.S. securities laws. Unless otherwise indicated, all mineral reserve and resource estimates included in this presentation have been prepared in accordance with Canadian National Instrument 43-101 Standards of Disclosure for Mineral Projects (“NI 43-101”) and the Canadian Institute of Mining, Metallurgy and Petroleum classification systems. NI 43-101 is a rule developed by the Canadian Securities Administrators that establishes standards for all public disclosure an issuer makes of scientific and technical information concerning mineral projects. These standards differ significantly from the requirements of the United States Securities and Exchange Commission (the “SEC”), and reserve and resource estimates disclosed in this presentation may not be comparable to similar information disclosed by U.S. companies. The mineral reserve estimates in this presentation have been calculated in accordance with NI 43-101, as required by Canadian securities regulatory authorities. For United States reporting purposes, SEC Industry Guide 7 under the United States Securities Exchange Act of 1934, as amended, as interpreted by Staff of the SEC, applies different standards in order to classify mineralization as a reserve. As a result, the definition of “probable reserves” used in NI 43-101 differs from the definition in the SEC Industry Guide 7. Under SEC standards, mineralization may not be classified as a “reserve” unless the determination has been made that the mineralization could be economically and legally produced or extracted at the time the reserve determination is made. Among other things, all necessary permits would be required to be in hand or issuance imminent in order to classify mineralized material as reserves under the SEC standards. Accordingly, mineral reserve estimates contained in this presentation may not qualify as “reserves” under SEC standards. In addition, this presentation uses the terms “indicated resources” and “inferred resources” to comply with the reporting standards in Canada. The Company advises United States investors that while those terms are recognized and required by Canadian regulations, the SEC does not recognize them. United States investors are cautioned not to assume that any part or all of the mineral deposits in these categories will ever be converted into mineral reserves. Further, “inferred resources” have a great amount of uncertainty as to their existence and as to whether they can be mined legally or economically. Therefore, United States investors are also cautioned not to assume that all or any part of the “inferred resources” exist. In accordance with Canadian securities laws, estimates of “inferred resources” cannot form the basis of feasibility or other economic studies. It cannot be assumed that all or any part of “indicated resources” or “inferred resources” will ever be upgraded to a higher category or are economically or legally mineable. In addition, disclosure of “contained ounces” is permitted disclosure under Canadian securities laws; however, the SEC only permits issuers to report mineralization as in place tonnage and grade without reference to unit measures. NI 43-101 also permits the inclusion of disclosure regarding the potential quantity and grade, expressed as ranges, of a target for further exploration provided that the disclosure (i) states with equal prominence that the potential quantity and grade is conceptual in nature, that there has been insufficient exploration to define a mineral resource and that it is uncertain if further exploration will result in the target being delineated as a mineral resources, and (ii) states the basis on which the disclosed potential quantity and grade has been determined. Disclosure regarding exploration potential has been included in this presentation. United States investors are cautioned that disclosure of such exploration potential is conceptual in nature by definition and there is no assurance that exploration will result in any category of NI 43-101 mineral resources being identified.
Notes to Investors Regarding the Use of Resources
42

TSX P I NYSE PPP I
Footnotes
43
1. “Gold equivalent ounces” include silver ounces produced at San Dimas, and converted to a gold equivalent based on a ratio of the average commodity prices realized for each period. Silver production is subject to a silver purchase agreement. The silver purchase agreement dictates that until August 6, 2014 Primero will deliver to Silver Wheaton a per annum amount equal to the first 3.5 million ounces of silver produced at San Dimas and 50% of any excess at $4.16 per ounce (increasing by 1% per year). Thereafter Primero will deliver to Silver Wheaton a per annum amount equal to the first 6.0 million ounces of silver produced at San Dimas and 50% of any excess at $4.20 per ounce (increasing by 1% per year). The Company will receive silver spot prices only after the annual threshold amount has been delivered. Black Fox is subject to a gold purchase agreement under which Sandstorm is entitled to 8% of production at the Black Fox mine and 6.3% at the Black Fox Extension.
2. Assumes San Dimas operates at least at 3,000 TPD from end of Q2 2016; and Primero management estimates for Black Fox production, based on 2,200-2,300 TPD operation and underground throughput increasing to 1,000 TPD by the end of 2015.
3. Based on 2015 Guidance. 4. $48.1 million senior unsecured convertible debenture (acquired from Brigus, with a 6.5% coupon an effective conversion price of US$14.00 and an
expiry of March 2016); US$75 million convertible, unsecured, subordinated debentures; and $40 million draw down from line of credit. Excludes capital leases.
5. The Company closed a $75 million line of credit on May 23, 2014 and has drawn down $40 million as of December 31, 2014. 6. During the year ended December 31, 2014, the Company issued 41,340,347 common shares as consideration for the acquisition of Brigus, 1,921,744
common shares upon the exercise of stock options; and 2,481,482 common shares pursuant to two flow through agreements. 7. Fully diluted shares include 20.8 million warrants with an exercise price of C$8.00 per share, expiring on July 20, 2015; and 9.3 million options with
an average exercise price of C$6.17. 8. Cash costs and All-in Sustaining Costs are non-GAAP measures. Refer to the Company’s 2014 MD&A for a reconciliation to operating expenses.
Note the calculation of all-in sustaining costs at San Dimas changed with the acquisition of a second producing asset and subsequently do not include corporate G&A.
9. The Company currently estimates that expanding the San Dimas mill to 3,000 TPD will require approximately $26.4 million of capital investment, with approximately $6 million expenditure expected in 2014 and the remainder spread over the following eighteen months. As a result of the preliminary nature of the capital assessment a contingency factor of 30% has been included in the capital estimate.
10. Major assumptions include a flat gold price per ounce of $1,300, a flat silver price per ounce of $22. 11. Adjusted net income/earnings and adjusted net income/earnings per share are non-GAAP measures. Neither of these non-GAAP performance
measures has any standardized meaning and is therefore unlikely to be comparable to other measures presented by other issuers. The Company believes that, in addition to conventional measures prepared in accordance with GAAP, the Company and certain investors use this information to evaluate the Company’s performance. Accordingly, it is intended to provide additional information and should not be considered in isolation or as a substitute for measures of performance prepared in accordance with GAAP. Refer to the Company’s 2014 MD&A for a reconciliation of adjusted net income/earnings to reported net income.
12. “Operating cash flow” is operating cash flow before working capital changes. This and operating cash flows before working capital changes per share (CFPS) are non-GAAP measures which the Company believes provides a better indicator of the Company’s ability to generate cash flow from its mining operations. See the Company’s 2014 MD&A for a reconciliation of operating cash flows to GAAP.
13. Based on 365 days per year.

TSX P I NYSE PPP I
PRIMERO MINING CORP. 79 Wellington St. West, Suite 2100 Toronto, ON M5K 1H1 T 416 814 3160 TF 877 619 3160 www.primeromining.com
Tamara Brown Vice President, Investor Relations T 416 814 3168 [email protected]
BMO 2015 GLOBAL METALS & MINING CONFERENCE February 22-25, 2015