Primeras pag AE 2016 - AAFAF9 producto bruto y producto interno bruto a-18 9 gross product and gross...
104
Transcript of Primeras pag AE 2016 - AAFAF9 producto bruto y producto interno bruto a-18 9 gross product and gross...


APÉNDICE ESTADÍSTICO INFORME ECONÓMICO AL GOBERNADOR
Y A LA ASAMBLEA LEGISLATIVA
STATISTICAL APPENDIX OF THE ECONOMIC REPORT TO THE GOVERNOR
AND TO THE LEGISLATIVE ASSEMBLY
2016
María del C. Gordillo Pérez Presidenta - Chairperson
Programa de Planifi cación Económica y Social Program of Economic and Social Planning
Alejandro Díaz Marrero Director - Director
Subprograma de Análisis EconómicoSubprogram of Economic Analysis
Luis Avilés Rivera Director - Director
Arte Gráfi co - Graphic ArtNancy Más Marrero
Gobierno de Puerto Rico Ofi cina del Gobernador Junta de Planifi cación
Government of Puerto Rico Offi ce of the Governor
Planning Board
Marzo - March 2017
APÉNDICE ESTADÍSTICO • STATISTICAL APPENDIXINFORME ECONÓMICO AL GOBERNADOR 2016 • ECONOMIC REPORT TO THE GOVERNOR 2016

Subprograma de Análisis EconómicoSubprogram of Economic Analysis
Luis Avilés Rivera ([email protected]) Director – Director
Personal Administrador de Sistemas de Ofi cinaOffi ce Systems Management Staff
Carmen S. Carrasquillo Cuesta
Unidad de Estadísticas de la ConstrucciónConstruction Statistics Unit
Lester Álvarez TorresHéctor Crespo Cordero
Frank Matos Ramos
Unidad de Ingreso NetoNet Income Unit
Juan Cruz UrbinaCarmen Jiménez Franco Ivonne Narváez RiveraWanda Rivera Montes
Maribel Santiago TorresYajaira Soliveras Morales
Unidad de Producto BrutoGross Product Unit
Alejandro Díaz MarreroRené Reyes Medina
Unidad Resto del MundoBalance of Payments Unit
William Galindo IrizarryGlorimar Morales Rivera
Gerardo Sánchez Duvergé
Subprograma de Estadísticas Subprogram of Statistics
Marielí Alvarez Ulloa

PREFACIO
La ley 75 de 24 de junio de 1975, según enmendada, ordena a la Junta de Planifi cación a preparar un Informe Económico al Gobernador y a la Asamblea Legislativa. Este documento constituye una herramienta valiosa en la toma de decisiones sobre política pública y es un instrumento de utilidad para los interesados en el desarrollo económico de Puerto Rico.
La Junta de Planifi cación de Puerto Rico publica anualmente el Apéndice Estadístico del Informe Económico al Gobernador y a la Asamblea Legislativa como un adelanto de la información estadística disponible más adelante en el Informe Económico al Gobernador. Este Apéndice Estadístico contiene las cifras socioeconómicas de Puerto Rico más importantes para el año fi scal 2016 así como de años previos.
Esta publicación esta dividida en dos secciones. La primera incluye las 35 gráfi cas junto con las 36 tablas de información desde los años fi scales 2007 a 2016. En la segunda sección, se incluyen las 26 tasas que presentan las tasas de crecimiento.
Agradecemos a las entidades públicas y privadas que proveyeron los datos utilizados para preparar este apéndice estadístico y exhortamos a los usuarios a incorporar en su respectivo análisis económico y social de la Isla el Informe Económico al Gobernador 2016.
JUNTA DE PLANIFICACION / PLANNING BOARD A - iii
APÉNDICE ESTADÍSTICO • STATISTICAL APPENDIXINFORME ECONÓMICO AL GOBERNADOR 2016 • ECONOMIC REPORT TO THE GOVERNOR 2016

JUNTA DE PLANIFICACIÓN / PLANNING BOARDA - iv
PREFACE
Public law 75 of 24 of June of 1975 as amended, compels the Puerto Rico Planning Board to publish an Economic Report to the Governor and the Legislative Assembly. This document is an important decision – making tool for public policy and is an instrument of interest for the economic development of Puerto Rico.
Each year, the Puerto Rico Planning Board publishes the Statistical Appendix of the Economic Report to the Governor and the Legislative Assembly as an advance of the statistical information that will be available in the Economic Report to the Governor. This Statistical Appendix contains Puerto Rico’s most important socioeconomic fi gures for fi scal year 2016 as well as for previous years.
This publication has two sections. The fi rst section includes 35 graphs and 36 tables of information from fi scal years 2007 through 2016. In the second section, we include 26 growth rate tables.
We acknowledge those public agencies and private organizations, which provided the information, used in this report. We urge users to incorporate into their respective economic and social analysis the valuable insight provided by the Economic Report to the Governor 2016.
APÉNDICE ESTADÍSTICO • STATISTICAL APPENDIXINFORME ECONÓMICO AL GOBERNADOR 2016 • ECONOMIC REPORT TO THE GOVERNOR 2016

TABLA DE CONTENIDOTABLE of CONTENTS


A-vii JUNTA DE PLANIFICACIÓN / PLANNING BOARD
APÉNDICE ESTADÍSTICO • STATISTICAL APPENDIXINFORME ECONÓMICO AL GOBERNADOR 2016 • ECONOMIC REPORT TO THE GOVERNOR 2016
Tabla Página Table Page
1 SERIE SELECCIONADAS DE INGRESO Y PRODUCTO A-1 1 SELECTED SERIES OF INCOME AND PRODUCT, TOTAL A-1 TOTAL Y PER CAPITA AND PER CAPITA
2 PRODUCTO BRUTO A-4 2 GROSS PRODUCT A-4
3 PRODUCTO BRUTO A PRECIOS CONSTANTES DE 1954 A-6 3 GROSS PRODUCT IN CONSTANT 1954 DOLLARS A-6
4 ÍNDICES IMPLÍCITOS DE PRECIOS PARA DEFLACIONAR A-8 4 IMPLICIT PRICE DEFLATORS FOR GROSS PRODUCT A-8 EL PRODUCTO BRUTO
5 GASTOS DE CONSUMO PERSONAL POR TIPO PRINCIPAL A-10 5 PERSONAL CONSUMPTION EXPENDITURES BY MAJOR A-10 DE PRODUCTO TYPE OF PRODUCT
6 GASTOS DE CONSUMO PERSONAL POR TIPO PRINCIPAL A-12 6 PERSONAL CONSUMPTION EXPENDITURES BY MAJOR A-12 DE PRODUCTO, A PRECIOS CONSTANTES DE 1954 TYPE OF PRODUCT, IN CONSTANT 1954 DOLLARS
7 ÍNDICES IMPLÍCITOS DE PRECIOS PARA DEFLACIONAR A-14 7 IMPLICIT PRICE DEFLATORS FOR PERSONAL CONSUMPTION A-14 LOS GASTOS DE CONSUMO PERSONAL POR TIPO EXPENDITURES BY MAJOR TYPE OF PRODUCT PRINCIPAL DE PRODUCTO 8 INVERSIÓN INTERNA BRUTA DE CAPITAL FIJO A-16 8 GROSS DOMESTIC FIXED INVESTMENT A-16
9 PRODUCTO BRUTO Y PRODUCTO INTERNO BRUTO A-18 9 GROSS PRODUCT AND GROSS DOMESTIC PRODUCT BY A-18 POR SECTOR INDUSTRIAL PRINCIPAL MAJOR INDUSTRIAL SECTOR
10 INGRESO NETO POR SECTOR INDUSTRIAL PRINCIPAL A-20 10 NET INCOME BY MAJOR INDUSTRIAL SECTOR A-20
11 DISTRIBUCIÓN FUNCIONAL DEL INGRESO NETO A-22 11 FUNCTIONAL DISTRIBUTION OF NET INCOME BY MAJOR A-22 POR SECTOR INDUSTRIAL PRINCIPAL INDUSTRIAL SECTOR
12 INGRESO INTERNO NETO DE LA MANUFACTURA A-24 12 NET MANUFACTURING DOMESTIC INCOME A-24
13 INGRESO BRUTO AGRÍCOLA A-26 13 GROSS FARM INCOME A-26
14 RELACIÓN ENTRE EL PRODUCTO BRUTO, 14 RELATION BETWEEN GROSS PRODUCT, EL INGRESO NETO Y EL INGRESO PERSONAL A-28 NET INCOME, AND PERSONAL INCOME A-28
TABLA DE CONTENIDO TABLE OF CONTENTS

A-viii JUNTA DE PLANIFICACIÓN / PLANNING BOARD
APÉNDICE ESTADÍSTICO • STATISTICAL APPENDIXINFORME ECONÓMICO AL GOBERNADOR 2016 • ECONOMIC REPORT TO THE GOVERNOR 2016
Tabla Página Table Page
15 INGRESO PERSONAL A-30 15 PERSONAL INCOME A-30
16 ACTIVOS FINANCIEROS DE LAS PERSONAS A-32 16 PERSONAL FINANCIAL ASSETS A-32
17 DEUDA DE LOS CONSUMIDORES A-34 17 CONSUMERS’ DEBT A-34
18 BALANZA DE PAGOS A-36 18 BALANCE OF PAYMENTS A-36
19 NÚMERO Y GASTOS DE VISITANTES EN PUERTO RICO A-38 19 NUMBER AND EXPENDITURES OF VISITORS IN PUERTO RICO A-38
20 GASTOS NETOS DE FUNCIONAMIENTO DE LAS A-40 20 NET OPERATING EXPENDITURES OF FEDERAL AGENCIES IN PUERTO RICO A-40 AGENCIAS FEDERALES EN PUERTO RICO
21 TRANSFERENCIAS ENTRE PUERTO RICO Y EL GOBIERNO FEDERAL, A-41 21 TRANSFERS BETWEEN PUERTO RICO AND THE FEDERAL GOVERNMENT, A-41 GOBIERNOS ESTATALES Y OTROS NO RESIDENTES STATE GOVERMENTS, AND OTHER NONRESIDENTS 22 APORTACIONES FEDERALES AL GOBIERNO DE PUERTO RICO A-44 22 FEDERAL GRANTS TO THE GOVERNMENT OF PUERTO RICO A-44 23 EXPORTACIONES DE MERCANCIA REGISTRADA POR SISTEMA A-46 23 EXPORTS OF REGISTERED MERCHANDISE BY THE NORTH AMERICAN A-46 DE CLASIFICACIÓN INDUSTRIAL DE AMERICA DEL NORTE (SCIAN) INDUSTRY CLASSIFICATION SYSTEM (NAICS)
24 IMPORTACIONES DE MERCANCIA REGISTRADA POR SISTEMA A-47 24 IMPORTS OF REGISTERED MERCHANDISE BY THE NORTH AMERICAN A-47 DE CLASIFICACIÓN INDUSTRIAL DE AMERICA DEL NORTE (SCIAN) INDUSTRY CLASSIFICATION SYSTEM (NAICS) 25 BALANCE COMERCIAL A-48 25 TRADE BALANCE A-48
26 CLASIFICACIÓN ECONÓMICA DE LAS IMPORTACIONES A-50 26 ECONOMIC CLASSIFICATION OF ADJUSTED MERCHANDISE IMPORTS A-50 DE MERCANCIA AJUSTADA
27 RENTAS PERIÓDICAS NETAS DEL GOBIERNO DE PUERTO RICO A-52 27 PUERTO RICO’S NET RECURRENT REVENUES A-52
28 INGRESOS NETOS AL FONDO GENERAL DEL GOBIERNO A-55 28 PUERTO RICO’S GENERAL FUND NET REVENUES A-55 DE PUERTO RICO
TABLA DE CONTENIDO (Cont.) TABLE OF CONTENTS (Cont.)

A-ix JUNTA DE PLANIFICACIÓN / PLANNING BOARD
APÉNDICE ESTADÍSTICO • STATISTICAL APPENDIXINFORME ECONÓMICO AL GOBERNADOR 2016 • ECONOMIC REPORT TO THE GOVERNOR 2016
Tabla Página Table Page
29 DEUDA PÚBLICA BRUTA DE PUERTO RICO A-57 29 GROSS PUBLIC DEBT OF PUERTO RICO A-57
30 ARBITRIOS Y GALONES MEDIDAS DE BEBIDAS ALCOHÓLICAS A-59 30 EXCISE TAX AND GALLONS OF ALCOHOLIC BEVERAGES A-59 EN PUERTO RICO IN PUERTO RICO 31 ESTADÍSTICAS DEMOGRÁFICAS SELECCIONADAS A-60 31 SELECTED DEMOGRAPHIC STATISTICS A-60
32 ESTADO DE EMPLEO DE LAS PERSONAS DE 16 AÑOS DE EDAD Y MÁS A-62 32 EMPLOYMENT STATUS OF PERSONS 16 YEARS OF AGE AND OLDER A-62 33 NÚMERO DE PERSONAS EMPLEADAS POR SECTOR A-65 33 NUMBER OF EMPLOYED PERSONS BY MAJOR INDUSTRIAL SECTOR A-65 INDUSTRIAL PRINCIPAL 34 NÚMERO DE PERSONAS EMPLEADAS EN ESTABLECIMIENTOS A-68 34 NUMBER OF EMPLOYED PERSONS IN ESTABLISHMENTS A-68 POR SECTOR INDUSTRIAL PRINCIPAL BY MAJOR INDUSTRIAL SECTOR
TABLA DE CONTENIDO (Cont.) TABLE OF CONTENTS (Cont.)

A-x JUNTA DE PLANIFICACIÓN / PLANNING BOARD
APÉNDICE ESTADÍSTICO • STATISTICAL APPENDIXINFORME ECONÓMICO AL GOBERNADOR 2016 • ECONOMIC REPORT TO THE GOVERNOR 2016
Gráfi ca Página Graph Page
TASA DE INFLACIÓN A-3 INFLATION RATE A-3
INGRESO PERSONAL PER CÁPITA A PRECIOS CONSTANTES A-3 PERSONAL PER CAPITA INCOME AT CONSTANT PRICES A-3
INGRESO PERSONAL PROMEDIO POR FAMILIA A PRECIOS CORRIENTES A-3 AVERAGE PERSONAL INCOME PER FAMILY AT CURRENT PRICES A-3
ÍNDICE DE PRECIOS AL CONSUMIDOR PARA TODAS LAS FAMILIAS A-3 CONSUMER’S PRICE INDEX FOR ALL FAMILIES A-3
PRODUCTO BRUTO A-5 GROSS PRODUCT A-5
INVERSIÓN INTERNA BRUTA DE CAPITAL FIJO A PRECIOS CONSTANTES A-7 GROSS DOMESTIC FIXED INVESTMENT IN CONSTANT PRICES A-7 CRECIMIENTO ANUAL DEL PRODUCTO BRUTO REAL A-7 GROSS PRODUCT INGREASE IN CONSTANT PRICES A-7
ÍNDICES IMPLÍCITOS DE PRECIOS PARA DEFLACIONAR EL PRODUCTO A-9 IMPLICIT PRICE DEFLACTORS INCREASE FOR GROSS A-9 BRUTO Y LOS GASTOS DE CONSUMO PERSONAL PRODUCT AND PERSONAL CONSUMPTION EXPENDITURES
RELACIÓN ENTRE EL INGRESO PERSONAL DISPONIBLE A-11 RELATION BETWEEN DISPOSABLE PERSONAL INCOME A-11 Y LOS GASTOS DE CONSUMO PERSONAL AND PERSONAL CONSUMPTION EXPENDITURES
GASTOS DE CONSUMO PERSONAL A-13 PERSONAL CONSUMPTION EXPENDITURES A-13
ÍNDICES IMPLÍCITOS DE PRECIOS PARA DEFLACCIONAR A-15 IMPLICIT PRICE DEFLATORS FOR SELECTED TYPE OF PRODUCT A-15 TIPO PRINCIPAL DE PRODUCTOS SELECCIONADOS
VALOR DE LA ACTIVIDAD DE LA CONSTRUCCIÓN A-17 CONSTRUCTION ACTIVITY VALUE A-17
PRODUCTO BRUTO Y PRODUCTO INTERNO BRUTO A-19 GROSS PRODUCT AND GROSS DOMESTIC PRODUCT A-19
INGRESO NETO E INGRESO INTERNO NETO A-21 NET INCOME AND NET DOMESTIC INCOME A-21
INGRESO INTERNO NETO DE LA MANUFACTURA A-25 NET MANUFACTURING DOMESTIC INCOME A-25
INGRESO BRUTO AGRÍCOLA A-27 GROSS FARM INCOME A-27
TABLA DE CONTENIDO (Cont.) TABLE OF CONTENTS (Cont.)

A-xi JUNTA DE PLANIFICACIÓN / PLANNING BOARD
APÉNDICE ESTADÍSTICO • STATISTICAL APPENDIXINFORME ECONÓMICO AL GOBERNADOR 2016 • ECONOMIC REPORT TO THE GOVERNOR 2016
Gráfi ca Página Graph Page
RELACIÓN ENTRE PRODUCTO BRUTO, A-29 RELATION BETWEEN GROSS PRODUCT, A-29 INGRESO NETO E INGRESO PERSONAL NET INCOME AND PERSONAL INCOME
INGRESO PERSONAL A-31 PERSONAL INCOME A-31
ACTIVOS FINANCIEROS DE LAS PERSONAS A-33 PERSONAL FINANCIAL ASSETS A-33
RELACIÓN ENTRE ACTIVOS Y DEUDA DE LOS CONSUMIDORES A-35 RATIO BETWEEN CONSUMERS’ ASSETS AND DEBT A-35
BALANZA DE PAGOS A-37 BALANCE OF PAYMENTS A-37
NÚMERO Y GASTOS DE VISITANTES A-39 NUMBER AND EXPENDITURES OF VISITORS A-39 TRANSFERENCIAS ENTRE PUERTO RICO Y EL A-43 TRANSFERS BETWEEN PUERTO RICO AND THE A-43 GOBIERNO FEDERAL A INDIVIDUOS FEDERAL GOVERNMENT TO INDIVIDUALS BALANCE COMERCIAL A-49 TRADE BALANCE A-49
CLASIFICACIÓN ECONÓMICA DE LAS IMPORTACIONES DE MERCANCIA A-51 ECONOMIC CLASSIFICATION OF ADJUSTED MERCHADISE IMPORTS A-51 AJUSTADAS
RENTAS PERIÓDICAS NETAS DEL GOBIERNO DE PUERTO RICO A-54 GOVERNMENT OF PUERTO RICO NET RECURRENT REVENUES A-54
DEUDA PÚBLICA BRUTA DE PUERTO RICO A-58 GROSS PUBLIC DEBT OF PUERTO RICO A-58
TASAS DE NATALIDAD Y MORTALIDAD POR CADA MIL HABITANTES A-61 BIRTH AND DEATH RATES FOR EVERY 1,000 POPULATION A-61
POBLACIÓN DE PUERTO RICO AL 1RO DE JULIO A-61 POPULATION OF PUERTO RICO AS OF THE 1ST OF JULY A-61
TASA DE DESEMPLEO A-63 UNEMPLOYMENT RATE A-63
TABLA DE CONTENIDO (Cont.) TABLE OF CONTENTS (Cont.)

A-xii JUNTA DE PLANIFICACIÓN / PLANNING BOARD
APÉNDICE ESTADÍSTICO • STATISTICAL APPENDIXINFORME ECONÓMICO AL GOBERNADOR 2016 • ECONOMIC REPORT TO THE GOVERNOR 2016
Gráfi ca Página Graph Page
TASA DE PARTICIPACIÓN A-64 PARTICIPATION RATE A-64
EMPLEO TOTAL A-66 TOTAL EMPLOYMENT A-66
GRUPO TRABAJADOR A-67 LABOR FORCE A-67
NÚMERO DE PERSONAS EMPLEADAS A-67 NUMBER OF EMPLOYED PERSONS A-67
TABLA DE CONTENIDO (Cont.) TABLE OF CONTENTS (Cont.)

A-xiii JUNTA DE PLANIFICACIÓN / PLANNING BOARD
APÉNDICE ESTADÍSTICO • STATISTICAL APPENDIXINFORME ECONÓMICO AL GOBERNADOR 2016 • ECONOMIC REPORT TO THE GOVERNOR 2016
Tasas de Crecimiento Página Rates of Growth Page
INTERPRETACIÓN DE LOS CUADROS DE TASAS A-71 INTERPRETATION OF THE ANNUAL A-71DE CRECIMIENTO ANUAL GROWTH RATES TABLES
1 PRODUCTO BRUTO A-74 1 GROSS PRODUCT A-74
2 PRODUCTO BRUTO PER CAPITA A-74 2 PER CAPITA GROSS PRODUCT A-74
3 GASTOS DE CONSUMO PERSONAL A-75 3 PERSONAL CONSUMPTION EXPENDITURES A-75
4 GASTOS DE CONSUMO PERSONAL PER CAPITAL A-75 4 PER CAPITAL PERSONAL CONSUMPTION EXPENDITURES A-75
5 GASTOS DE CONSUMO PERSONAL DE BIENES DURADEROS A-76 5 PERSONAL CONSUMPTION EXPENDITURES OF DURABLE GOODS A-76
6 GASTOS DE CONSUMO PERSONAL DE BIENES NO DURADEROS A-76 6 PERSONAL CONSUMPTION EXPENDITURES OF NON DURABLE GOODS A-76
7 GASTOS DE CONSUMO PERSONAL DE SERVICIOS A-77 7 PERSONAL CONSUMPTION EXPENDITURES OF SERVICES A-77
8 GASTOS DE CONSUMO DEL GOBIERNO A-77 8 GOVERNMENT CONSUMPTION EXPENDITURES A-77
9 INVERSIÓN INTERNA BRUTA DE CAPITAL FIJO A-78 9 GROSS DOMESTIC FIXED INVESTMENT A-78
10 INVERSIÓN EN CONSTRUCCIÓN A-78 10 CONSTRUCTION INVESTMENT A-78
11 INVERSIÓN EN CONSTRUCCIÓN DE VIVIENDA PRIVADA A-79 11 PRIVATE HOUSING CONSTRUCTION INVESTMENT A-79
12 INVERSIÓN EN MAQUINARIA Y EQUIPO A-79 12 MACHINERY AND EQUIPMENT INVESTMENT A-79
13 PRODUCTO INTERNO BRUTO A-80 13 GROSS DOMESTIC PRODUCT A-80
14 PRODUCTO INTERNO BRUTO PER CÁPITA A-80 14 PER CAPITA GROSS DOMESTIC PRODUCT A-80
15 INGRESO PERSONAL A-81 15 PERSONAL INCOME A-81
16 INGRESO PERSONAL PER CÁPITA A-81 16 PER CAPITA PERSONAL INCOME A-81
TABLA DE CONTENIDO (Cont.) TABLE OF CONTENTS (Cont.)

A-xiv JUNTA DE PLANIFICACIÓN / PLANNING BOARD
APÉNDICE ESTADÍSTICO • STATISTICAL APPENDIXINFORME ECONÓMICO AL GOBERNADOR 2016 • ECONOMIC REPORT TO THE GOVERNOR 2016
TABLA DE CONTENIDO (Cont.) TABLE OF CONTENTS (Cont.)
Tasas de Crecimiento Página Rates of Growth Page
17 INGRESO PERSONAL DISPONIBLE A-82 17 DISPOSABLE PERSONAL INCOME A-82
18 INGRESO PERSONAL DISPONIBLE PER CAPITA A-82 18 DISPOSABLE PERSONAL INCOME PER CAPITA A-82
19 INGRESO NETO A-83 19 NET INCOME A-83
20 INGRESO NETO PER CAPITA A-83 20 PER CAPITA NET INCOME A-83
21 ÍNDICE IMPLÍCITO DE PRECIOS PARA DEFLACIONAR A-84 21 IMPLICIT PRICE TO DEFLATORS FOR A-84 EL PRODUCTO BRUTO GROSS PRODUCT
22 ÍNDICE IMPLÍCITO DE PRECIOS PARA DEFLACIONAR A-84 22 IMPLICIT PRICE DEFLATORS FOR PERSONAL A-84 LOS GASTOS DE CONSUMO PERSONAL CONSUMPTION EXPEDIATURES
23 EMPLEO A-85 23 EMPLOYMENT A-85
24 DESEMPLEO A-85 24 UNEMPLOYMENT A-85
25 POBLACIÓN A-86 25 POPULATION A-86
26 DEUDA PÚBLICA BRUTA DE PUERTO RICO A-86 26 GROSS PUBLIC DEBT OF PUERTO RICO A-86

TABLAS Y GRÁFICASTABLES and GRAPHS

A-v
ii JU
NTA
DE P
LANI
FICA
CIÓN
/ PL
ANNI
NG B
OARDA
PÉ
ND
ICE
ES
TAD
ÍST
ICO
• S
TAT
IST
ICA
L A
PP
EN
DIX
INFO
RME
ECO
NÓ
MIC
O A
L G
OBE
RNA
DO
R 20
16 •
EC
ON
OM
IC R
EPO
RT T
O T
HE G
OVE
RNO
R 20
16

A-1 JUNTA DE PLANIFICACIÓN / PLANNING BOARD
APÉNDICE ESTADÍSTICO • STATISTICAL APPENDIXINFORME ECONÓMICO AL GOBERNADOR 2016 • ECONOMIC REPORT TO THE GOVERNOR 2016
TABLA 1 - SERIES SELECCIONADAS DE INGRESO Y PRODUCTO, TOTAL Y PER CAPITA: AÑOS FISCALES TABLE 1 - SELECTED SERIES OF INCOME AND PRODUCT, TOTAL AND PER CAPITA: FISCAL YEARS
2007 2008 2009 2010 2011 2012 2013 2014r 2015r 2016p
Total a precios corrientes Total in current dollars (En millones de dólares) (In millions of dollars)
Producto bruto 60,642.7 62,703.1 63,617.9 64,294.6 65,720.7 68,085.7 68,944.9 68,797.5 69,570.2 70,134.5 Gross productIngreso neto 49,254.4 50,030.6 49,986.4 50,245.8 51,037.6 54,207.0 55,390.4 55,378.6 55,669.6 55,457.1 Net incomeIngreso personal 53,232.7 57,161.9 59,031.2 59,983.2 61,178.7 62,227.1 64,159.7 63,115.7 63,854.4 63,877.5 Personal incomeIngreso personal disponible 49,874.1 54,112.6 56,107.3 57,110.6 58,716.7 59,865.4 61,865.5 60,781.0 61,333.7 61,633.7 Disposable personal incomeGastos de consumo personal 52,086.6 54,553.8 55,122.1 56,783.8 58,154.8 60,897.0 62,477.6 61,899.4 61,598.3 61,180.8 Personal consumption expendituresProducto interno bruto 89,524.1 93,639.3 96,385.6 98,381.3 100,351.7 101,564.8 102,450.0 102,445.8 103,143.5 105,034.5 Gross domestic productInversión interna bruta de capital fijo 11,674.4 10,974.3 9,699.0 8,918.5 9,605.1 10,356.1 9,672.7 9,031.3 8,663.9 8,262.7 Gross domestic fixed investment
Total a precios constantes de 1954 Total at constant 1954 dollars (En millones de dólares) (In millions of dollars)
Producto bruto 7,261.6 7,054.2 6,784.2 6,541.8 6,431.7 6,466.2 6,457.6 6,343.9 6,301.2 6,233.9 Gross productIngreso personal (1) 9,893.1 10,024.4 9,951.6 9,958.3 10,068.2 10,015.5 10,235.3 9,846.0 9,763.1 9,670.9 Personal income (1)Ingreso personal disponible (1) 9,268.9 9,489.7 9,458.7 9,481.4 9,663.0 9,635.4 9,869.3 9,481.8 9,377.7 9,331.2 Disposable personal income (1)Gastos de consumo personal 9,680.1 9,567.1 9,292.6 9,427.1 9,570.5 9,801.5 9,967.0 9,656.3 9,418.1 9,262.6 Personal consumption expenditures Producto interno bruto 11,088.4 10,883.9 10,671.4 10,627.3 10,589.2 10,592.3 10,559.8 10,434.1 10,318.0 10,049.1 Gross domestic productInversión interna bruta de capital fijo 1,797.7 1,632.3 1,428.0 1,336.6 1,464.8 1,542.3 1,424.0 1,337.3 1,259.1 1,241.8 Gross domestic fixed investment
Per cápita a precios corrientes Per capita at current dollars (En dólares) (In dollars)
Producto bruto 15,984 16,623 16,960 17,233 17,762 18,618 19,077 19,303 19,855 20,376 Gross productIngreso neto 12,982 13,264 13,326 13,467 13,794 14,823 15,327 15,538 15,887 16,112 Net incomeIngreso personal 14,031 15,154 15,737 16,077 16,535 17,016 17,753 17,709 18,223 18,558 Personal incomeIngreso personal disponible 13,146 14,346 14,958 15,307 15,869 16,370 17,118 17,054 17,504 17,906 Disposable personal incomeGastos de consumo personal 13,729 14,463 14,695 15,219 15,718 16,652 17,288 17,368 17,579 17,775 Personal consumption expendituresProducto interno bruto 23,596 24,825 25,696 26,369 27,122 27,773 28,348 28,745 29,436 30,516 Gross domestic product
Per cápita a precios constantes Per capita at constant de 1954 (En dólares) 1954 dollars (In dollars)
Producto bruto 1,914 1,870 1,809 1,753 1,738 1,768 1,787 1,780 1,798 1,811 Gross productIngreso personal 2,608 2,658 2,653 2,669 2,721 2,739 2,832 2,763 2,786 2,810 Personal incomeIngreso personal disponible 2,443 2,516 2,522 2,541 2,612 2,635 2,731 2,660 2,676 2,711 Disposable personal incomeGastos de consumo personal 2,551 2,536 2,477 2,527 2,587 2,680 2,758 2,709 2,688 2,691 Personal consumption expendituresProducto interno bruto 2,923 2,885 2,845 2,848 2,862 2,896 2,922 2,928 2,945 2,920 Gross domestic product
(Continúa - Continue)
A-2 JUNTA DE PLANIFICACIÓN / PLANNING BOARD
APÉNDICE ESTADÍSTICO • STATISTICAL APPENDIXINFORME ECONÓMICO AL GOBERNADOR 2016 • ECONOMIC REPORT TO THE GOVERNOR 2016
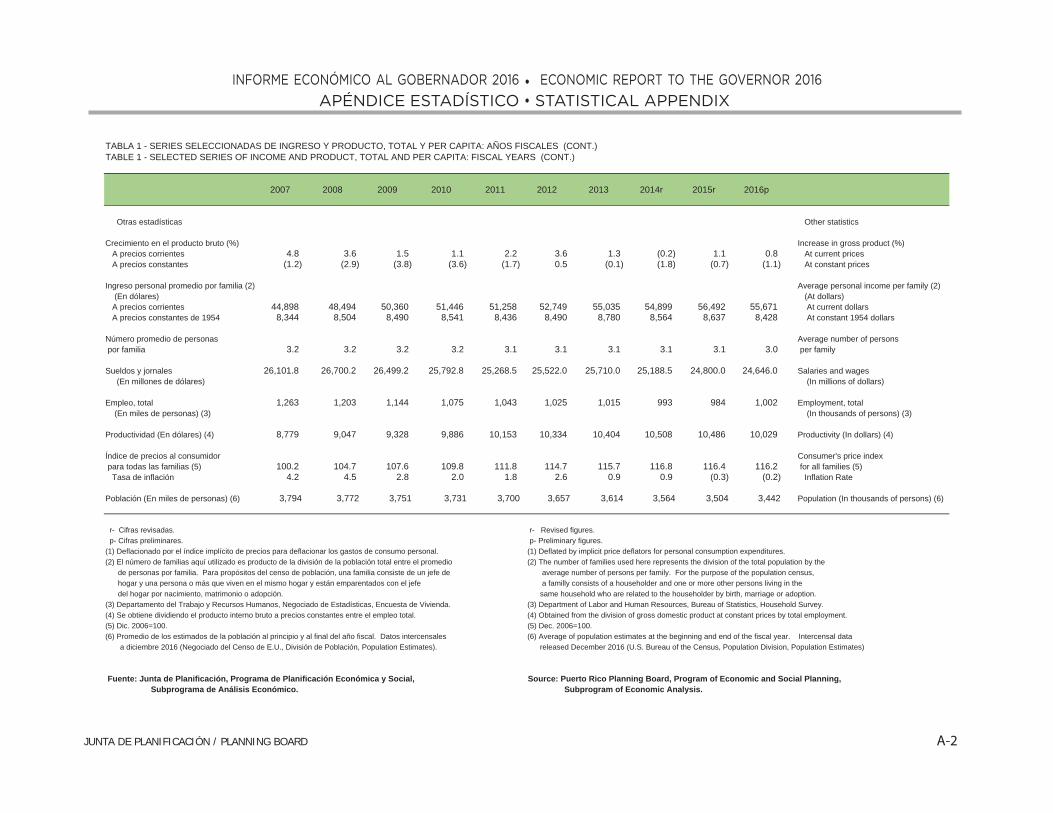
TABLA 1 - SERIES SELECCIONADAS DE INGRESO Y PRODUCTO, TOTAL Y PER CAPITA: AÑOS FISCALES (CONT.) TABLE 1 - SELECTED SERIES OF INCOME AND PRODUCT, TOTAL AND PER CAPITA: FISCAL YEARS (CONT.)
2007 2008 2009 2010 2011 2012 2013 2014r 2015r 2016p
Otras estadísticas Other statistics
Crecimiento en el producto bruto (%) Increase in gross product (%) A precios corrientes 4.8 3.6 1.5 1.1 2.2 3.6 1.3 (0.2) 1.1 0.8 At current prices A precios constantes (1.2) (2.9) (3.8) (3.6) (1.7) 0.5 (0.1) (1.8) (0.7) (1.1) At constant prices
Ingreso personal promedio por familia (2) Average personal income per family (2) (En dólares) (At dollars) A precios corrientes 44,898 48,494 50,360 51,446 51,258 52,749 55,035 54,899 56,492 55,671 At current dollars A precios constantes de 1954 8,344 8,504 8,490 8,541 8,436 8,490 8,780 8,564 8,637 8,428 At constant 1954 dollars
Número promedio de personas Average number of persons por familia 3.2 3.2 3.2 3.2 3.1 3.1 3.1 3.1 3.1 3.0 per family
Sueldos y jornales 26,101.8 26,700.2 26,499.2 25,792.8 25,268.5 25,522.0 25,710.0 25,188.5 24,800.0 24,646.0 Salaries and wages (En millones de dólares) (In millions of dollars)
Empleo, total 1,263 1,203 1,144 1,075 1,043 1,025 1,015 993 984 1,002 Employment, total (En miles de personas) (3) (In thousands of persons) (3)
Productividad (En dólares) (4) 8,779 9,047 9,328 9,886 10,153 10,334 10,404 10,508 10,486 10,029 Productivity (In dollars) (4)
Índice de precios al consumidor Consumer's price index para todas las familias (5) 100.2 104.7 107.6 109.8 111.8 114.7 115.7 116.8 116.4 116.2 for all families (5) Tasa de inflación 4.2 4.5 2.8 2.0 1.8 2.6 0.9 0.9 (0.3) (0.2) Inflation Rate
Población (En miles de personas) (6) 3,794 3,772 3,751 3,731 3,700 3,657 3,614 3,564 3,504 3,442 Population (In thousands of persons) (6)
r- Cifras revisadas. r- Revised figures. p- Cifras preliminares. p- Preliminary figures.(1) Deflacionado por el índice implícito de precios para deflacionar los gastos de consumo personal. (1) Deflated by implicit price deflators for personal consumption expenditures.(2) El número de familias aquí utilizado es producto de la división de la población total entre el promedio (2) The number of families used here represents the division of the total population by the de personas por familia. Para propósitos del censo de población, una familia consiste de un jefe de average number of persons per family. For the purpose of the population census, hogar y una persona o más que viven en el mismo hogar y están emparentados con el jefe a familly consists of a householder and one or more other persons living in the del hogar por nacimiento, matrimonio o adopción. same household who are related to the householder by birth, marriage or adoption.(3) Departamento del Trabajo y Recursos Humanos, Negociado de Estadísticas, Encuesta de Vivienda. (3) Department of Labor and Human Resources, Bureau of Statistics, Household Survey.(4) Se obtiene dividiendo el producto interno bruto a precios constantes entre el empleo total. (4) Obtained from the division of gross domestic product at constant prices by total employment.(5) Dic. 2006=100. (5) Dec. 2006=100.(6) Promedio de los estimados de la población al principio y al final del año fiscal. Datos intercensales (6) Average of population estimates at the beginning and end of the fiscal year. Intercensal data a diciembre 2016 (Negociado del Censo de E.U., División de Población, Population Estimates). released December 2016 (U.S. Bureau of the Census, Population Division, Population Estimates)
Fuente: Junta de Planificación, Programa de Planificación Económica y Social, Source: Puerto Rico Planning Board, Program of Economic and Social Planning, Subprograma de Análisis Económico. Subprogram of Economic Analysis.

A-3 JUNTA DE PLANIFICACIÓN / PLANNING BOARD
APÉNDICE ESTADÍSTICO • STATISTICAL APPENDIXINFORME ECONÓMICO AL GOBERNADOR 2016 • ECONOMIC REPORT TO THE GOVERNOR 2016
TASA DE INFLACIÓNINFLATION RATE
1.8
2.6
0.9 0.9
-0.3 -0.2-0.5
0.0
0.5
1.0
1.5
2.0
2.5
3.0
2011 2012 2013 2014r 2015r 2016p
Porc
ient
o -P
erce
ntag
e
Años fiscales- Fiscal years
r- Cifras revisadas. p- Cifras preliminares.r- Revised figures. p- Preliminary figures.
Fuente: Junta de Planificación, Programa de Planificación Económica y Social, Subprograma de Análisis Económico. Source: Puerto Rico Planning Board, Program of Economic and Social Planning, Subprogram of Economic Analysis.
INGRESO PERSONAL PER CÁPITA A PRECIOS CONSTANTESPERSONAL PER CAPITA INCOME AT CONSTANT PRICES
2,7212,739
2,832
2,7632,786
2,810
2,6602,6802,7002,7202,7402,7602,7802,8002,8202,8402,860
2011 2012 2013 2014r 2015r 2016p
Mill
ones
de
dóla
res
Mill
ions
of d
olla
rs
Años fiscales- Fiscal years
r- Cifras revisadas. p- Cifras preliminares.r- Revised figures. p- Preliminary figures.
Fuente: Junta de Planificación, Programa de Planificación Económica y Social, Subprograma de Análisis Económico. Source: Puerto Rico Planning Board, Program of Economic and Social Planning, Subprogram of Economic Analysis.
INGRESO PERSONAL PROMEDIO POR FAMILIA A PRECIOS CORRIENTESAVERAGE PERSONAL INCOME PER FAMILY AT CURRENT PRICES
51,25852,749
55,035 54,89956,492 55,671
35,000
40,000
45,000
50,000
55,000
60,000
2011 2012 2013 2014r 2015r 2016p
Mill
ones
de
dóla
res
Mill
ions
of d
olla
rs
Años fiscales- Fiscal years
r- Cifras revisadas. p- Cifras preliminares.r- Revised figures. p- Preliminary figures.
Fuente: Junta de Planificación, Programa de Planificación Económica y Social, Subprograma de Análisis Económico. Source: Puerto Rico Planning Board, Program of Economic and Social Planning, Subprogram of Economic Analysis.
ÍNDICE DE PRECIOS AL CONSUMIDOR PARA TODAS LAS FAMILIASCONSUMER’S PRICE INDEX FOR ALL FAMILIES
111.8114.7 115.7 116.8 116.4 116.2
80.0
85.0
90.0
95.0
100.0
105.0
110.0
115.0
120.0
2011 2012 2013 2014r 2015r 2016p
Índi
ce -
inde
x
Años fiscales- Fiscal years
r- Cifras revisadas. p- Cifras preliminares.r- Revised figures. p- Preliminary figures.
Fuente: Junta de Planificación, Programa de Planificación Económica y Social, Subprograma de Análisis Económico. Source: Puerto Rico Planning Board, Program of Economic and Social Planning, Subprogram of Economic Analysis.
A-4 JUNTA DE PLANIFICACIÓN / PLANNING BOARD
APÉNDICE ESTADÍSTICO • STATISTICAL APPENDIXINFORME ECONÓMICO AL GOBERNADOR 2016 • ECONOMIC REPORT TO THE GOVERNOR 2016
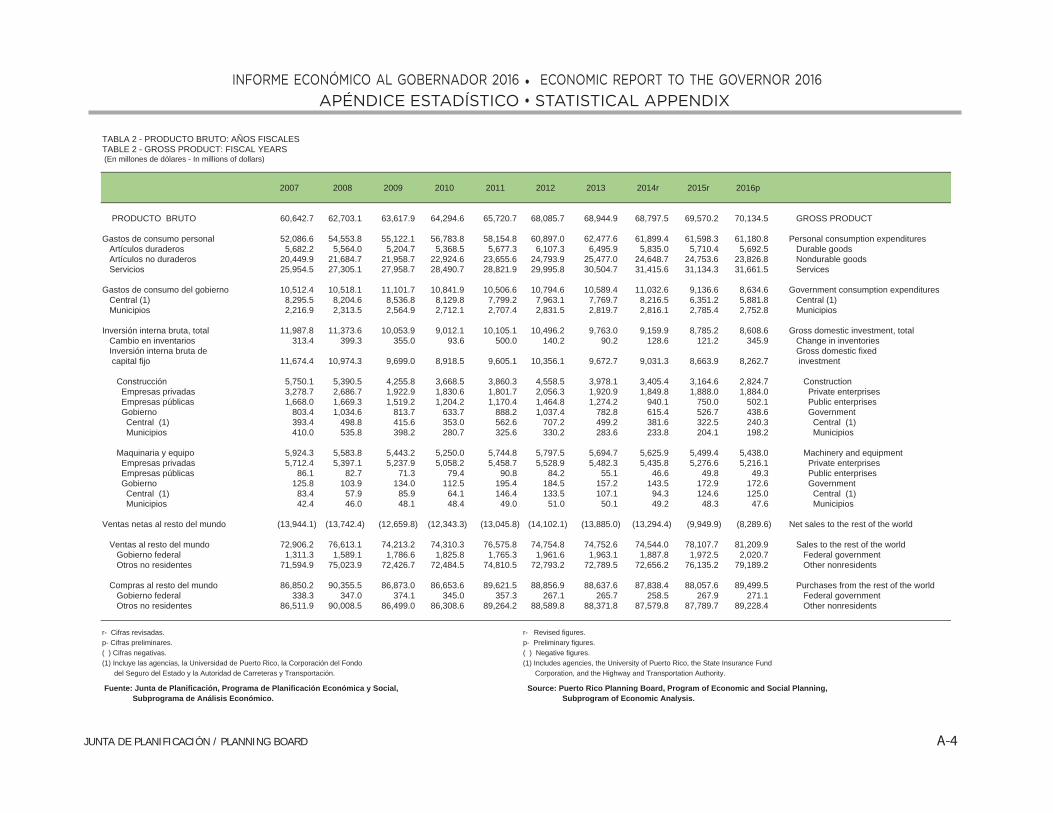
TABLA 2 - PRODUCTO BRUTO: AÑOS FISCALES TABLE 2 - GROSS PRODUCT: FISCAL YEARS (En millones de dólares - In millions of dollars)
2007 2008 2009 2010 2011 2012 2013 2014r 2015r 2016p
PRODUCTO BRUTO 60,642.7 62,703.1 63,617.9 64,294.6 65,720.7 68,085.7 68,944.9 68,797.5 69,570.2 70,134.5 GROSS PRODUCT
Gastos de consumo personal 52,086.6 54,553.8 55,122.1 56,783.8 58,154.8 60,897.0 62,477.6 61,899.4 61,598.3 61,180.8 Personal consumption expenditures Artículos duraderos 5,682.2 5,564.0 5,204.7 5,368.5 5,677.3 6,107.3 6,495.9 5,835.0 5,710.4 5,692.5 Durable goods Artículos no duraderos 20,449.9 21,684.7 21,958.7 22,924.6 23,655.6 24,793.9 25,477.0 24,648.7 24,753.6 23,826.8 Nondurable goods Servicios 25,954.5 27,305.1 27,958.7 28,490.7 28,821.9 29,995.8 30,504.7 31,415.6 31,134.3 31,661.5 Services
Gastos de consumo del gobierno 10,512.4 10,518.1 11,101.7 10,841.9 10,506.6 10,794.6 10,589.4 11,032.6 9,136.6 8,634.6 Government consumption expenditures Central (1) 8,295.5 8,204.6 8,536.8 8,129.8 7,799.2 7,963.1 7,769.7 8,216.5 6,351.2 5,881.8 Central (1) Municipios 2,216.9 2,313.5 2,564.9 2,712.1 2,707.4 2,831.5 2,819.7 2,816.1 2,785.4 2,752.8 Municipios
Inversión interna bruta, total 11,987.8 11,373.6 10,053.9 9,012.1 10,105.1 10,496.2 9,763.0 9,159.9 8,785.2 8,608.6 Gross domestic investment, total Cambio en inventarios 313.4 399.3 355.0 93.6 500.0 140.2 90.2 128.6 121.2 345.9 Change in inventories Inversión interna bruta de Gross domestic fixed capital fijo 11,674.4 10,974.3 9,699.0 8,918.5 9,605.1 10,356.1 9,672.7 9,031.3 8,663.9 8,262.7 investment
Construcción 5,750.1 5,390.5 4,255.8 3,668.5 3,860.3 4,558.5 3,978.1 3,405.4 3,164.6 2,824.7 Construction Empresas privadas 3,278.7 2,686.7 1,922.9 1,830.6 1,801.7 2,056.3 1,920.9 1,849.8 1,888.0 1,884.0 Private enterprises Empresas públicas 1,668.0 1,669.3 1,519.2 1,204.2 1,170.4 1,464.8 1,274.2 940.1 750.0 502.1 Public enterprises Gobierno 803.4 1,034.6 813.7 633.7 888.2 1,037.4 782.8 615.4 526.7 438.6 Government Central (1) 393.4 498.8 415.6 353.0 562.6 707.2 499.2 381.6 322.5 240.3 Central (1) Municipios 410.0 535.8 398.2 280.7 325.6 330.2 283.6 233.8 204.1 198.2 Municipios
Maquinaria y equipo 5,924.3 5,583.8 5,443.2 5,250.0 5,744.8 5,797.5 5,694.7 5,625.9 5,499.4 5,438.0 Machinery and equipment Empresas privadas 5,712.4 5,397.1 5,237.9 5,058.2 5,458.7 5,528.9 5,482.3 5,435.8 5,276.6 5,216.1 Private enterprises Empresas públicas 86.1 82.7 71.3 79.4 90.8 84.2 55.1 46.6 49.8 49.3 Public enterprises Gobierno 125.8 103.9 134.0 112.5 195.4 184.5 157.2 143.5 172.9 172.6 Government Central (1) 83.4 57.9 85.9 64.1 146.4 133.5 107.1 94.3 124.6 125.0 Central (1) Municipios 42.4 46.0 48.1 48.4 49.0 51.0 50.1 49.2 48.3 47.6 Municipios
Ventas netas al resto del mundo (13,944.1) (13,742.4) (12,659.8) (12,343.3) (13,045.8) (14,102.1) (13,885.0) (13,294.4) (9,949.9) (8,289.6) Net sales to the rest of the world
Ventas al resto del mundo 72,906.2 76,613.1 74,213.2 74,310.3 76,575.8 74,754.8 74,752.6 74,544.0 78,107.7 81,209.9 Sales to the rest of the world Gobierno federal 1,311.3 1,589.1 1,786.6 1,825.8 1,765.3 1,961.6 1,963.1 1,887.8 1,972.5 2,020.7 Federal government Otros no residentes 71,594.9 75,023.9 72,426.7 72,484.5 74,810.5 72,793.2 72,789.5 72,656.2 76,135.2 79,189.2 Other nonresidents
Compras al resto del mundo 86,850.2 90,355.5 86,873.0 86,653.6 89,621.5 88,856.9 88,637.6 87,838.4 88,057.6 89,499.5 Purchases from the rest of the world Gobierno federal 338.3 347.0 374.1 345.0 357.3 267.1 265.7 258.5 267.9 271.1 Federal government Otros no residentes 86,511.9 90,008.5 86,499.0 86,308.6 89,264.2 88,589.8 88,371.8 87,579.8 87,789.7 89,228.4 Other nonresidents
r- Cifras revisadas. r- Revised figures.p- Cifras preliminares. p- Preliminary figures.( ) Cifras negativas. ( ) Negative figures.(1) Incluye las agencias, la Universidad de Puerto Rico, la Corporación del Fondo (1) Includes agencies, the University of Puerto Rico, the State Insurance Fund del Seguro del Estado y la Autoridad de Carreteras y Transportación. Corporation, and the Highway and Transportation Authority.
Fuente: Junta de Planificación, Programa de Planificación Económica y Social, Source: Puerto Rico Planning Board, Program of Economic and Social Planning, Subprograma de Análisis Económico. Subprogram of Economic Analysis.

A-5 JUNTA DE PLANIFICACIÓN / PLANNING BOARD
APÉNDICE ESTADÍSTICO • STATISTICAL APPENDIXINFORME ECONÓMICO AL GOBERNADOR 2016 • ECONOMIC REPORT TO THE GOVERNOR 2016
PRODUCTO BRUTOGROSS PRODUCT
65,720.768,085.7 68,944.9 68,797.5 69,570.2 70,134.5
50,000.0
55,000.0
60,000.0
65,000.0
70,000.0
75,000.0
2011 2012 2013 2014r 2015r 2016p
Mill
ones
de
dóla
res
Mill
ions
of d
olla
rs
Años fiscales- Fiscal years
r- Cifras revisadas. p- Cifras preliminares.r- Revised figures. p- Preliminary figures.
Fuente: Junta de Planificación, Programa de Planificación Económica y Social, Subprograma de Análisis Económico. Source: Puerto Rico Planning Board, Program of Economic and Social Planning, Subprogram of Economic Analysis.

A-6 JUNTA DE PLANIFICACIÓN / PLANNING BOARD
APÉNDICE ESTADÍSTICO • STATISTICAL APPENDIXINFORME ECONÓMICO AL GOBERNADOR 2016 • ECONOMIC REPORT TO THE GOVERNOR 2016
TABLA 3 - PRODUCTO BRUTO A PRECIOS CONSTANTES DE 1954: AÑOS FISCALES TABLE 3 - GROSS PRODUCT IN CONSTANT 1954 DOLLARS: FISCAL YEARS (En millones de dólares - In millions of dollars)
2007 2008 2009 2010 2011 2012 2013 2014r 2015r 2016p
PRODUCTO BRUTO 7,261.6 7,054.2 6,784.2 6,541.8 6,431.7 6,466.2 6,457.6 6,343.9 6,301.2 6,233.9 GROSS PRODUCT
Gastos de consumo personal 9,680.1 9,567.1 9,292.6 9,427.1 9,570.5 9,801.5 9,967.0 9,656.3 9,418.1 9,262.6 Personal consumption expenditures Artículos duraderos 1,745.3 1,665.7 1,626.3 1,609.9 1,703.3 1,788.7 1,859.0 1,645.7 1,713.2 1,664.1 Durable goods Artículos no duraderos 3,769.7 3,732.7 3,541.4 3,554.7 3,795.3 3,897.7 3,968.4 3,696.6 3,571.8 3,347.0 Nondurable goods Servicios 4,165.1 4,168.7 4,124.9 4,262.5 4,071.9 4,115.1 4,139.5 4,314.0 4,133.1 4,251.5 Services
Gastos de consumo del gobierno 1,910.3 1,820.7 1,866.5 1,803.8 1,764.8 1,787.0 1,748.8 1,877.4 1,686.2 1,605.1 Government consumption expenditure Central (1) 1,437.7 1,344.0 1,365.3 1,282.9 1,248.3 1,259.7 1,230.0 1,358.5 1,174.0 1,103.1 Central (1) Municipios 472.6 476.7 501.1 520.9 516.4 527.3 518.8 519.0 512.2 502.0 Municipios
Inversión interna bruta, total 1,851.8 1,705.8 1,492.7 1,376.6 1,488.3 1,574.3 1,434.9 1,348.5 1,358.3 1,386.0 Gross domestic investment, total Cambio en inventarios 54.1 73.6 64.7 40.0 23.5 32.0 10.9 11.2 99.1 144.2 Change in inventories Inversión interna bruta de Gross domestic fixed capital fijo 1,797.7 1,632.2 1,428.0 1,336.6 1,464.8 1,542.3 1,424.0 1,337.3 1,259.1 1,241.8 investment
Construcción 702.3 636.0 494.8 425.1 435.7 503.7 429.0 357.5 327.8 294.1 Construction Empresas privadas 400.4 317.0 223.6 212.1 203.4 227.2 207.2 194.2 195.6 196.2 Private enterprises Empresas públicas 203.7 196.9 176.6 139.5 132.1 161.9 137.4 98.7 77.7 52.3 Public enterprises Gobierno 98.1 122.1 94.6 73.4 100.3 114.6 84.4 64.6 54.6 45.7 Government Central (1) 48.0 58.8 48.3 40.9 63.5 78.1 53.8 40.1 33.4 25.0 Central (1) Municipios 50.1 63.2 46.3 32.5 36.8 36.5 30.6 24.5 21.1 20.6 Municipios
Maquinaria y equipo 1,095.4 996.3 933.1 911.5 1,029.0 1,038.6 995.0 979.9 931.3 947.7 Machinery and equipment Empresas privadas 1,056.2 963.0 898.0 878.2 977.8 990.5 957.9 946.8 893.6 909.0 Private enterprises Empresas públicas 15.9 14.8 12.2 13.8 16.3 15.1 9.6 8.1 8.4 8.6 Public enterprises Gobierno 23.3 18.5 23.0 19.5 35.0 33.1 27.5 25.0 29.3 30.1 Government Central (1) 15.4 10.3 14.7 11.1 26.2 23.9 18.7 16.4 21.1 21.8 Central (1) Municipios 7.8 8.2 8.2 8.4 8.8 9.1 8.8 8.6 8.2 8.3 Municipios
Ventas netas al resto del mundo (6,180.6) (6,039.3) (5,867.6) (6,065.7) (6,391.9) (6,696.6) (6,693.1) (6,538.4) (6,161.3) (6,019.8) Net sales to the rest of the world
Ventas al resto del mundo 7,036.8 6,946.9 6,698.9 6,439.6 6,380.0 5,956.3 5,839.8 5,718.6 5,952.3 6,143.9 Sales to the rest of the world Gobierno federal 243.7 278.7 301.2 303.1 290.5 315.7 313.2 294.5 301.6 305.9 Federal government Otros no residentes 6,793.2 6,668.2 6,397.7 6,136.5 6,089.5 5,640.5 5,526.6 5,424.1 5,650.7 5,837.9 Other nonresidents
Compras al resto del mundo 13,217.4 12,986.3 12,566.4 12,505.3 12,772.0 12,652.8 12,532.9 12,257.0 12,113.6 12,163.7 Purchases from the rest of the world Gobierno federal 62.9 60.9 63.1 57.3 58.8 43.0 42.4 40.3 41.0 41.0 Federal government Otros no residentes 13,154.5 12,925.4 12,503.4 12,448.1 12,713.2 12,609.9 12,490.5 12,216.6 12,072.6 12,122.6 Other nonresidents
r- Cifras revisadas. r- Revised figures. p- Cifras preliminares. p- Preliminary figures. ( ) Cifras negativas. ( ) Negative figures. (1) Incluye las agencias, la Universidad de Puerto Rico, (1) Includes agencies, the University of Puerto Rico, la Corporación del Fondo del Seguro del Estado the State Insurance Fund Corporation, y la Autoridad de Carreteras y Transportación. and the Highway and Transportation Authority.
Fuente: Junta de Planificación, Programa de Planificación Económica y Social, Source: Puerto Rico Planning Board, Program of Economic and Social Planning,Subprograma de Análisis Económico. Subprogram of Economic Analysis.

A-7 JUNTA DE PLANIFICACIÓN / PLANNING BOARD
APÉNDICE ESTADÍSTICO • STATISTICAL APPENDIXINFORME ECONÓMICO AL GOBERNADOR 2016 • ECONOMIC REPORT TO THE GOVERNOR 2016
INVERSIÓN INTERNA BRUTA DE CAPITAL FIJO A PRECIOS CONSTANTESGROSS FIXED DOMESTIC INVESTMENT AT CONSTANT PRICES
435.7503.7
429.0357.5 327.8 294.1
1,029.0 1,038.6 995.0 979.9 931.3 947.7
200.0300.0400.0500.0600.0700.0800.0900.0
1,000.01,100.0
2011 2012 2013 2014r 2015r 2016p
Mill
ones
de
dóla
res
Mill
ions
of d
olla
rs
Años fiscales- Fiscal years
CONSTRUCCION: CONSTRUCTION
MAQUINARIA Y EQUIPO: MACHINERY ANDEQUIPMENT
r- Cifras revisadas. p- Cifras preliminares.r- Revised figures. p- Preliminary figures.
Fuente: Junta de Planificación, Programa de Planificación Económica y Social, Subprograma de Análisis Económico. Source: Puerto Rico Planning Board, Program of Economic and Social Planning, Subprogram of Economic Analysis.
CRECIMIENTO ANUAL DEL PRODUCTO BRUTO REALGROSS PRODUCT INCREASE AT CONSTANT PRICES
-1.7
0.5
-0.1
-1.8-0.7 -1.1
-5.0-4.0-3.0-2.0-1.00.01.02.03.04.05.0
2011 2012 2013 2014r 2015r 2016p
Porc
ient
o -P
erce
ntag
e
Años fiscales- Fiscal years
r- Cifras revisadas. p- Cifras preliminares.r- Revised figures. p- Preliminary figures.
Fuente: Junta de Planificación, Programa de Planificación Económica y Social, Subprograma de Análisis Económico. Source: Puerto Rico Planning Board, Program of Economic and Social Planning, Subprogram of Economic Analysis.

A-8 JUNTA DE PLANIFICACIÓN / PLANNING BOARD
APÉNDICE ESTADÍSTICO • STATISTICAL APPENDIXINFORME ECONÓMICO AL GOBERNADOR 2016 • ECONOMIC REPORT TO THE GOVERNOR 2016
TABLA 4 - ÍNDICES IMPLÍCITOS DE PRECIOS PARA DEFLACIONAR EL PRODUCTO BRUTO: AÑOS FISCALES TABLE 4 - IMPLICIT PRICE DEFLATORS FOR GROSS PRODUCT: FISCAL YEARS (En números índices - In index numbers: 1954 = 100)
2007 2008 2009 2010 2011 2012 2013 2014r 2015r 2016p
PRODUCTO BRUTO 835.1 889.5 937.7 982.8 1,021.8 1,052.9 1,067.7 1,084.5 1,104.1 1,125.1 GROSS PRODUCT
Gastos de consumo personal 538.1 570.2 593.2 602.3 607.6 621.3 626.8 641.0 654.0 660.5 Personal consumption expenditures Artículos duraderos 325.6 334.0 320.0 333.5 333.3 341.4 349.4 354.6 333.3 342.1 Durable goods Artículos no duraderos 542.5 580.9 620.1 644.9 623.3 636.1 642.0 666.8 693.0 711.9 Nondurable goods Servicios 623.1 655.0 677.8 668.4 707.8 728.9 736.9 728.2 753.3 744.7 Services
Gastos de consumo del gobierno 550.3 577.7 594.8 601.1 595.4 604.1 605.5 587.6 541.9 537.9 Government consumption expenditures Central (1) 577.0 610.5 625.2 633.7 624.8 632.2 631.7 604.8 541.0 533.2 Central (1) Municipios 469.1 485.4 511.8 520.6 524.3 536.9 543.5 542.6 543.8 548.4 Municipios
Inversión interna bruta, total 647.4 666.7 673.5 654.6 679.0 666.7 680.4 679.2 646.8 621.1 Gross domestic investment, total Cambio en inventarios --- --- --- --- --- --- --- --- --- --- Change in inventories Inversión interna bruta de Gross domestic fixed capital fijo 649.4 672.3 679.2 667.2 655.7 671.5 679.3 675.3 688.1 665.4 investment
Construcción 818.8 847.6 860.1 862.9 885.9 905.1 927.3 952.7 965.4 960.5 Construction Empresas privadas 818.8 847.6 860.1 862.9 885.9 905.1 927.3 952.7 965.4 960.5 Private enterprises Empresas públicas 818.8 847.6 860.1 862.9 885.9 905.1 927.3 952.7 965.4 960.5 Public enterprises Gobierno 818.8 847.6 860.1 862.9 885.9 905.1 927.3 952.7 965.4 960.5 Government Central (1) 818.8 847.6 860.1 862.9 885.9 905.1 927.3 952.7 965.4 960.5 Central (1) Municipios 818.8 847.6 860.1 862.9 885.9 905.1 927.3 952.7 965.4 960.5 Municipios
Maquinaria y equipo 540.8 560.5 583.3 576.0 558.3 558.2 572.3 574.2 590.5 573.8 Machinery and equipment Empresas privadas 540.8 560.5 583.3 576.0 558.3 558.2 572.3 574.2 590.5 573.8 Private enterprises Empresas públicas 540.8 560.5 583.3 576.0 558.3 558.2 572.3 574.2 590.5 573.8 Public enterprises Gobierno 540.8 560.5 583.3 576.0 558.3 558.2 572.3 574.2 590.5 573.8 Government Central (1) 540.8 560.5 583.3 576.0 558.3 558.2 572.3 574.2 590.5 573.8 Central (1) Municipios 540.8 560.5 583.3 576.0 558.3 558.2 572.3 574.2 590.5 573.8 Municipios
Ventas netas al resto del mundo 225.6 227.5 215.8 203.5 204.1 210.6 207.5 203.3 161.5 137.7 Net sales of goods and services
Ventas al resto del mundo 1,036.1 1,057.7 1,107.8 1,154.0 1,200.2 1,255.1 1,280.1 1,303.5 1,312.2 1,321.8 Sales to the rest of the world Gobierno federal 538.1 570.2 593.2 602.3 607.6 621.3 626.8 641.0 654.0 660.5 Federal government Otros no residentes 1,053.9 1,125.6 1,132.1 1,181.2 1,228.5 1,290.5 1,317.1 1,339.5 1,347.4 1,356.5 Other nonresidents
Compras al resto del mundo 657.1 677.6 691.3 692.9 701.7 702.3 707.2 716.6 726.9 735.8 Purchases from the rest of the world Gobierno federal 538.1 570.2 593.2 602.3 607.6 621.3 626.8 641.0 654.0 660.5 Federal government Otros no residentes 657.7 696.4 691.8 693.3 702.1 702.5 707.5 716.9 727.2 736.0 Other nonresidents
r- Cifras revisadas. r- Revised figures. p- Cifras preliminares. p- Preliminary figures. (1) Incluye las agencias, la Universidad de Puerto Rico, la Corporación (1) Includes agencies, the University of Puerto Rico, the State Insurance Fund del Fondo del Seguro del Estado y la Autoridad de Carreteras y Transportación. Corporation, and the Highway and Transportation Authority.
Fuente: Junta de Planificación, Programa de Planificación Económica y Social, Source: Puerto Rico Planning Board, Program of Economic and Social Planning, Subprograma de Análisis Económico. Subprogram of Economic Analysis.

A-9 JUNTA DE PLANIFICACIÓN / PLANNING BOARD
APÉNDICE ESTADÍSTICO • STATISTICAL APPENDIXINFORME ECONÓMICO AL GOBERNADOR 2016 • ECONOMIC REPORT TO THE GOVERNOR 2016
ÍNDICES IMPLÍCITOS DE PRECIOS PARA DEFLACIONAR EL PRODUCTO BRUTO Y LOS GASTOS DE CONSUMO PERSONAL
IMPLICIT PRICE DEFLATORS FOR GROSS PRODUCT AND PERSONAL CONSUMPTION EXPENDITURES
607.6 621.3 626.8 641.0 654.0 660.5
1,021.8 1,052.9 1,067.7 1,084.5 1,104.1 1,125.1
0.0200.0400.0600.0800.0
1,000.01,200.0
2011 2012 2013 2014r 2015r 2016p
Años fiscales- Fiscal years
GASTOS DE CONSUMO PERSONAL: PERSONALCONSUMPTION EXPENDITURES
r- Cifras revisadas. p- Cifras preliminares.r- Revised figures. p- Preliminary figures.
Fuente: Junta de Planificación, Programa de Planificación Económica y Social, Subprograma de Análisis Económico. Source: Puerto Rico Planning Board, Program of Economic and Social Planning, Subprogram of Economic Analysis.

A-10 JUNTA DE PLANIFICACIÓN / PLANNING BOARD
APÉNDICE ESTADÍSTICO • STATISTICAL APPENDIXINFORME ECONÓMICO AL GOBERNADOR 2016 • ECONOMIC REPORT TO THE GOVERNOR 2016
TABLA 5 - GASTOS DE CONSUMO PERSONAL POR TIPO PRINCIPAL DE PRODUCTO: AÑOS FISCALES TABLE 5 - PERSONAL CONSUMPTION EXPENDITURES BY MAJOR TYPE OF PRODUCT: FISCAL YEARS (En millones de dólares - In millions of dollars)
2007 2008 2009 2010 2011 2012 2013 2014r 2015r 2016p
GASTOS DE CONSUMO PERSONAL CONSUMPTION PERSONAL 52,086.6 54,553.8 55,122.1 56,783.8 58,154.8 60,897.0 62,477.6 61,899.4 61,598.3 61,180.8 EXPENDITURES
Alimentos 7,263.5 7,859.4 8,392.7 8,500.2 8,717.6 8,910.7 9,534.9 9,209.0 9,567.8 8,365.7 Food
Bebidas alcohólicas y Alcoholic beverages and productos de tabaco 1,783.1 1,704.7 1,786.4 1,980.6 1,979.0 1,910.5 1,899.9 1,923.5 1,856.3 1,811.0 tobacco products
Ropa y accesorios 3,528.0 3,530.7 3,561.0 3,326.6 3,634.3 3,652.1 3,833.3 3,472.2 3,178.9 2,933.2 Clothing and accessories
Cuidado personal 1,031.0 1,157.1 1,215.3 1,536.9 1,410.2 1,433.1 1,508.8 1,464.8 1,597.0 1,526.5 Personal care
Vivienda 8,131.2 8,411.1 8,696.2 8,989.4 9,190.7 9,660.6 9,978.5 10,318.7 10,717.1 11,413.9 Housing
Funcionamiento del hogar 6,579.6 6,879.0 6,763.2 7,404.2 7,154.3 7,553.3 7,504.6 7,368.7 7,531.8 7,592.0 Household operations
Servicios médicos y funerarios 8,434.8 9,394.4 10,139.5 10,372.3 10,299.3 11,226.3 11,608.7 11,673.1 12,515.0 13,503.8 Medical and funeral services
Servicios comerciales 3,103.0 3,021.7 3,005.5 2,818.0 2,846.6 2,845.5 2,733.7 2,770.8 2,739.5 2,644.2 Business services
Transportación 6,104.0 6,548.2 5,659.2 6,005.7 6,843.3 7,715.3 7,968.8 7,866.9 6,656.7 6,225.7 Transportation
Recreación 4,933.6 4,853.6 4,637.6 4,670.9 4,729.4 4,864.9 4,906.4 5,059.3 4,910.1 4,955.7 Recreation
Educación 1,776.6 1,826.3 1,928.6 2,001.9 2,016.1 2,056.6 2,078.7 2,065.1 1,988.9 1,868.3 Education
Instituciones religiosas y organizaciones Religious and nonprofit sin fines de lucro, no clasificadas organizations, not elsewhere anteriormente 439.2 435.4 410.0 345.6 349.8 381.1 368.6 360.7 342.2 335.8 classified
Viajes al exterior 1,616.9 1,653.9 1,277.4 1,070.0 1,090.5 1,046.8 1,024.3 974.9 939.4 975.5 Foreign travel
Compras misceláneas 819.5 858.4 860.9 972.3 1,036.5 833.2 838.9 810.4 882.7 1,014.3 Miscellaneous purchases
Gastos totales de consumo en Total consumption expenditures Puerto Rico de residentes y in Puerto Rico by residents no residentes 55,544.0 58,133.9 58,333.6 59,994.6 61,297.5 64,089.8 65,788.2 65,338.0 65,423.3 65,165.6 and nonresidents
Menos: Gastos en Puerto Rico Less: Expenditures in de no residentes 3,457.4 3,580.1 3,211.4 3,210.7 3,142.8 3,192.9 3,310.6 3,438.6 3,825.0 3,984.8 Puerto Rico by nonresidents
r- Cifras revisadas. r- Revised figures. p- Cifras preliminares. p- Preliminary figures.
Fuente: Junta de Planificación, Programa de Planificación Económica y Social, Source: Puerto Rico Planning Board, Program of Economic and Social Planning, Subprograma de Análisis Económico. Subprogram of Economic Analysis.

A-11 JUNTA DE PLANIFICACIÓN / PLANNING BOARD
APÉNDICE ESTADÍSTICO • STATISTICAL APPENDIXINFORME ECONÓMICO AL GOBERNADOR 2016 • ECONOMIC REPORT TO THE GOVERNOR 2016
RELACIÓN ENTRE EL INGRESO PERSONAL DISPONIBLE Y LOS GASTOS DE CONSUMO PERSONAL RELATIONSHIP BETWEEN DISPOSABLE PERSONAL INCOME AND PERSONAL
CONSUMPTION EXPENDITURES
58,7
16.7
59,8
65.4
61,8
65.5
60,7
81.0
61,3
33.7
61,6
33.7
58,1
54.8
60,8
97.0
62,4
77.6
61,8
99.4
61,5
98.3
61,1
80.8
35,000.0
40,000.0
45,000.0
50,000.0
55,000.0
60,000.0
65,000.0
2011 2012 2013 2014r 2015r 2016p
Mill
ones
de
dóla
res
Mill
ions
of d
olla
rs
Años fiscales- Fiscal years
INGRESO PERSONAL DISPONIBLE:DISPOSABLE PERSONAL INCOME
GASTOS DE CONSUMO PERSONAL:PERSONAL CONSUMPTION EXPENDITURES
r- Cifras revisadas. p- Cifras preliminares.r- Revised figures. p- Preliminary figures.
Fuente: Junta de Planificación, Programa de Planificación Económica y Social, Subprograma de Análisis Económico. Source: Puerto Rico Planning Board, Program of Economic and Social Planning, Subprogram of Economic Analysis.

A-12 JUNTA DE PLANIFICACIÓN / PLANNING BOARD
APÉNDICE ESTADÍSTICO • STATISTICAL APPENDIXINFORME ECONÓMICO AL GOBERNADOR 2016 • ECONOMIC REPORT TO THE GOVERNOR 2016
TABLA 6 - GASTOS DE CONSUMO PERSONAL POR TIPO PRINCIPAL DE PRODUCTO, A PRECIOS CONSTANTES DE 1954: AÑOS FISCALES TABLE 6 - PERSONAL CONSUMPTION EXPENDITURES BY MAJOR TYPE OF PRODUCT, AT CONSTANT 1954 DOLLARS: FISCAL YEARS (En millones de dólares - In millions of dollars)
2007 2008 2009 2010 2011 2012 2013 2014r 2015r 2016p
GASTOS DE CONSUMO PERSONAL CONSUMPTION PERSONAL 9,680.1 9,567.1 9,292.4 9,427.1 9,570.5 9,801.5 9,967.0 9,656.3 9,418.1 9,262.6 EXPENDITURES
Alimentos 609.9 627.9 594.1 600.0 599.3 581.7 601.6 565.7 591.9 505.0 Food
Bebidas alcohólicas y Alcoholic beverages and productos de tabaco 164.3 149.6 144.4 148.9 147.0 145.4 140.3 134.4 130.4 122.3 tobacco products
Ropa y accesorios 1,960.7 1,914.6 1,789.8 1,711.1 1,975.5 2,078.6 2,236.2 2,022.3 1,853.5 1,701.8 Clothing and accessories
Cuidado personal 228.4 264.8 269.6 314.7 287.6 288.4 287.9 277.2 302.9 275.3 Personal care
Vivienda 1,207.5 1,172.6 1,176.0 1,205.5 1,220.9 1,252.2 1,275.7 1,300.2 1,318.7 1,395.3 Housing
Funcionamiento del hogar 2,116.3 1,966.2 1,880.3 2,076.6 1,965.0 2,061.0 2,074.9 1,995.2 2,096.4 2,210.3 Household operations
Servicios médicos y funerarios 809.2 940.8 972.0 910.1 904.4 932.8 928.9 935.8 966.7 1,025.0 Medical and funeral services
Servicios comerciales 377.7 354.8 351.6 294.5 289.3 290.7 278.7 277.1 263.7 250.5 Business services
Transportación 904.3 891.5 833.4 859.4 890.2 911.0 931.6 898.9 827.5 820.2 Transportation
Recreación 1,148.0 1,133.6 1,132.6 1,159.8 1,134.9 1,132.1 1,099.0 1,147.6 1,002.5 900.5 Recreation
Educación 216.6 216.6 221.8 227.1 227.0 223.7 216.8 211.6 199.3 185.2 Education
Instituciones religiosas y organizaciones Religious and nonprofit sin fines de lucro, no clasificadas organizations, not elsewhere anteriormente 35.4 33.2 31.2 26.5 26.3 28.0 26.8 26.0 24.7 24.3 classified
Viajes al exterior 184.8 184.8 143.5 119.5 116.7 107.2 102.9 96.6 89.7 92.6 Foreign travel
Compras misceláneas 58.3 59.2 53.7 62.5 65.4 51.3 49.7 47.5 51.9 59.8 Miscellaneous purchases
Gastos totales de consumo en Total consumption expenditures Puerto Rico de residentes y in Puerto Rico by residents no residentes 10,021.3 9,910.2 9,593.8 9,716.1 9,849.4 10,084.0 10,250.9 9,936.3 9,719.8 9,568.2 and nonresidents
Menos: Gastos en Puerto Rico Less: Expenditures in de no residentes 341.2 343.1 301.4 288.9 278.9 282.5 283.9 280.0 301.7 305.5 Puerto Rico by nonresidents
r Cifras revisadas. r Revised figures.p Cifras preliminares. p Preliminary figures.
Fuente: Junta de Planificación, Programa de Planificación Económica y Social, Source: Puerto Rico Planning Board, Program of Economic and Social Planning, Subprograma de Análisis Económico. Subprogram of Economic Analysis.

A-13 JUNTA DE PLANIFICACIÓN / PLANNING BOARD
APÉNDICE ESTADÍSTICO • STATISTICAL APPENDIXINFORME ECONÓMICO AL GOBERNADOR 2016 • ECONOMIC REPORT TO THE GOVERNOR 2016
GASTOS DE CONSUMO PERSONALPERSONAL CONSUMPTION EXPENDITURES
58,154.8 60,897.0 62,447.6 61,899.4 61,598.3 61,180.8
9,570.5
9,801.5
9,967.0
9,656.3
9,418.19,262.6
8,800.0
9,000.0
9,200.0
9,400.0
9,600.0
9,800.0
10,000.0
10,200.0
5,000.0
15,000.0
25,000.0
35,000.0
45,000.0
55,000.0
65,000.0
2011 2012 2013 2014r 2015r 2016p
Mill
ones
de
dóla
res
Mill
ions
of d
olla
rs
Años fiscales- Fiscal years
PRECIOS CORRIENTES: AT CURRENT PRICES
PRECIOS CONSTANTES: AT CONSTANT PRICESr- Cifras revisadas. p- Cifras preliminares.r- Revised figures. p- Preliminary figures.
Fuente: Junta de Planificación, Programa de Planificación Económica y Social, Subprograma de Análisis Económico. Source: Puerto Rico Planning Board, Program of Economic and Social Planning, Subprogram of Economic Analysis.

A-14 JUNTA DE PLANIFICACIÓN / PLANNING BOARD
APÉNDICE ESTADÍSTICO • STATISTICAL APPENDIXINFORME ECONÓMICO AL GOBERNADOR 2016 • ECONOMIC REPORT TO THE GOVERNOR 2016
TABLA 7 - ÍNDICES IMPLÍCITOS DE PRECIOS PARA DEFLACIONAR LOS GASTOS DE CONSUMO PERSONAL POR TIPO PRINCIPAL DE PRODUCTO: AÑOS FISCALESTABLE 7 - IMPLICIT PRICE DEFLATORS FOR PERSONAL CONSUMPTION EXPENDITURES BY MAJOR TYPE OF PRODUCT: FISCAL YEARS (En números índices - In index numbers: 1954=100)
2007 2008 2009 2010 2011 2012 2013 2014r 2015r 2016p
GASTOS DE CONSUMO PERSONAL CONSUMPTION PERSONAL 538.1 570.2 593.2 602.3 607.6 621.3 626.8 641.0 654.0 660.5 EXPENDITURES
Alimentos 1,190.9 1,251.7 1,412.8 1,416.7 1,454.7 1,531.7 1,585.0 1,627.8 1,616.6 1,656.6 Food
Bebidas alcohólicas y Alcoholic beverages and productos de tabaco 1,085.4 1,139.3 1,237.2 1,330.5 1,346.3 1,314.1 1,354.6 1,430.7 1,423.8 1,480.8 tobacco products
Ropa y accesorios 179.9 184.4 199.0 194.4 184.0 175.7 171.4 171.7 171.5 172.4 Clothing and accessories
Cuidado personal 451.5 436.9 450.7 488.5 490.3 496.8 524.0 528.4 527.2 554.5 Personal care
Vivienda 673.4 717.3 739.5 745.7 752.8 771.5 782.2 793.6 812.7 818.0 Housing
Funcionamiento del hogar 310.9 349.9 359.7 356.6 364.1 366.5 361.7 369.3 359.3 343.5 Household operations
Servicios médicos y funerarios 1,042.4 998.6 1,043.2 1,139.7 1,138.8 1,203.5 1,249.7 1,247.3 1,294.6 1,317.4 Medical care and funeral expenses
Servicios comerciales 821.5 851.5 854.9 956.7 984.1 978.9 980.9 999.8 1,039.0 1,055.5 Business services
Transportación 675.0 734.5 679.1 698.8 768.8 846.9 855.4 875.1 804.4 759.1 Transportation
Recreación 429.8 428.2 409.5 402.8 416.7 429.7 446.5 440.9 489.9 550.3 Recreation
Educación 820.2 843.2 869.7 881.6 888.1 919.5 958.8 976.1 998.0 1,008.6 Education
Instituciones religiosas y organizaciones Religious and nonprofit sin fines de lucro, no clasificadas organizations, not elsewhere anteriormente 1,241.4 1,311.1 1,315.7 1,305.0 1,328.8 1,363.3 1,375.4 1,388.4 1,384.0 1,381.6 classified
Viajes al exterior 874.8 894.9 890.0 895.4 934.1 976.1 995.5 1,009.3 1,046.9 1,053.7 Foreign travel
Compras misceláneas 1,405.5 1,449.3 1,603.5 1,555.4 1,583.7 1,624.9 1,689.3 1,705.2 1,699.9 1,696.9 Miscellaneous purchases
Gastos totales de consumo en Total consumption expenditures Puerto Rico de residentes y in Puerto Rico by residents no residentes 554.3 586.6 608.0 617.5 622.3 635.6 641.8 657.6 673.1 681.1 and nonresidents
Menos: Gastos en Puerto Rico Less: Expenditures in de no residentes 1,013.4 1,043.4 1,065.5 1,111.3 1,126.7 1,130.2 1,166.1 1,228.1 1,268.0 1,304.2 Puerto Rico by nonresidents
r- Cifras revisadas. r- Revised figures. p- Cifras preliminares. p- Preliminary figures.
Fuente: Junta de Planificación, Programa de Planificación Económica y Social, Source: Puerto Rico Planning Board, Program of Economic and Social Planning, Subprograma de Análisis Económico. Subprogram of Economic Analysis.

A-15 JUNTA DE PLANIFICACIÓN / PLANNING BOARD
APÉNDICE ESTADÍSTICO • STATISTICAL APPENDIXINFORME ECONÓMICO AL GOBERNADOR 2016 • ECONOMIC REPORT TO THE GOVERNOR 2016
ÍNDICES IMPLÍCITOS DE PRECIOS PARA DEFLACIONAR TIPO PRINCIPAL DE PRODUCTOS SELECCIONADOS
IMPLICIT PRICE DEFLATORS FOR SELECTED TYPE OF PRODUCT(En números indices- In Index numbers: 1954 = 100
1,45
4.7
1,53
1.7
1,58
5.0
1,62
7.8
1,61
6.6
1,65
6.6
1,13
8.8
1,20
3.5
1,24
9.7
1,24
7.3
1,29
4.6
1,31
7.4
1,12
6.7
1,13
0.2
1,16
6.1
1,22
8.1
1,26
8.0
1,30
4.2
888.
1
919.
5
958.
8
976.
1
998.
0
1,00
8.6
0.0200.0400.0600.0800.0
1,000.01,200.01,400.01,600.01,800.0
2011 2012 2013 2014r 2015r 2016p
Mill
ones
de
dóla
res
Mill
ions
of d
olla
rs
Años fiscales- Fiscal years
ALIMENTOS:FOODSERVICIOS MÉDICOS Y FUNERARIOS: MEDICAL CARE AND FUNERAL EXPENSESGASTO DE CONSUMO DE NO RESIDENTES: EXPENDITURES IN PUERTO RICO BY NONRESIDENTSEDUCACIÓN:EDUCATION
r- Cifras revisadas. p- Cifras preliminares.r- Revised figures. p- Preliminary figures.
Fuente: Junta de Planificación, Programa de Planificación Económica y Social, Subprograma de Análisis Económico. Source: Puerto Rico Planning Board, Program of Economic and Social Planning, Subprogram of Economic Analysis.
A-16 JUNTA DE PLANIFICACIÓN / PLANNING BOARD
APÉNDICE ESTADÍSTICO • STATISTICAL APPENDIXINFORME ECONÓMICO AL GOBERNADOR 2016 • ECONOMIC REPORT TO THE GOVERNOR 2016
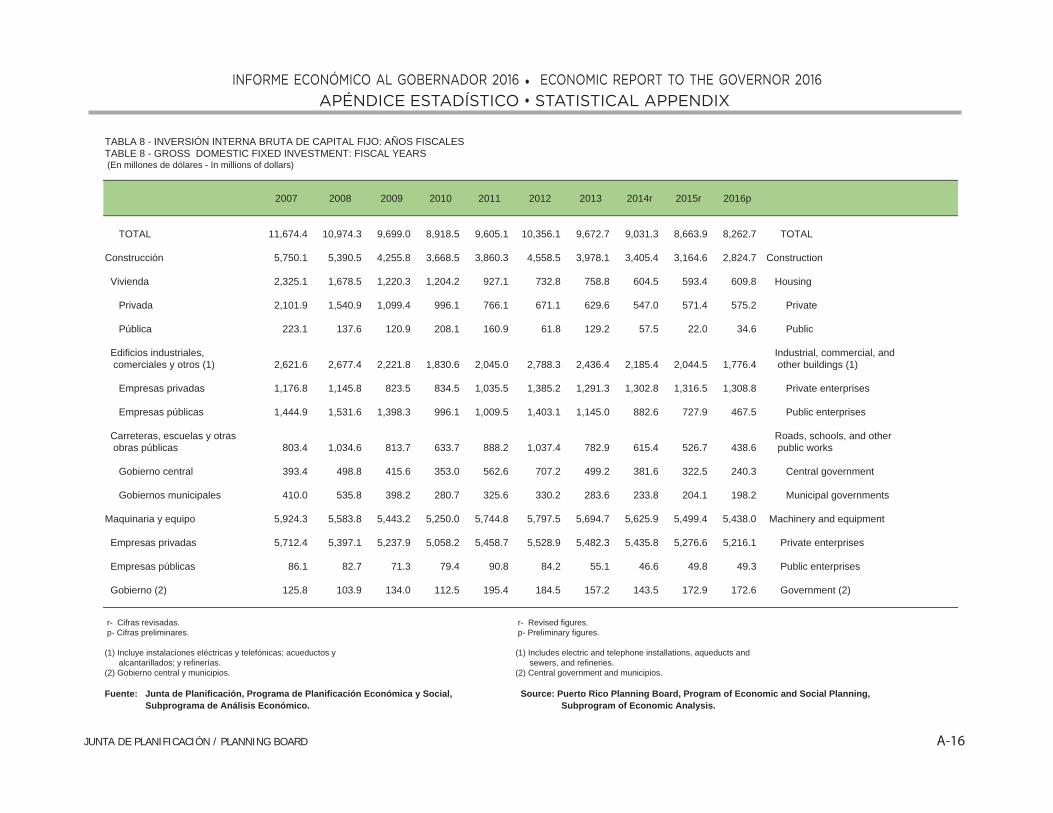
TABLA 8 - INVERSIÓN INTERNA BRUTA DE CAPITAL FIJO: AÑOS FISCALES TABLE 8 - GROSS DOMESTIC FIXED INVESTMENT: FISCAL YEARS (En millones de dólares - In millions of dollars)
2007 2008 2009 2010 2011 2012 2013 2014r 2015r 2016p
TOTAL 11,674.4 10,974.3 9,699.0 8,918.5 9,605.1 10,356.1 9,672.7 9,031.3 8,663.9 8,262.7 TOTAL
Construcción 5,750.1 5,390.5 4,255.8 3,668.5 3,860.3 4,558.5 3,978.1 3,405.4 3,164.6 2,824.7 Construction
Vivienda 2,325.1 1,678.5 1,220.3 1,204.2 927.1 732.8 758.8 604.5 593.4 609.8 Housing
Privada 2,101.9 1,540.9 1,099.4 996.1 766.1 671.1 629.6 547.0 571.4 575.2 Private
Pública 223.1 137.6 120.9 208.1 160.9 61.8 129.2 57.5 22.0 34.6 Public
Edificios industriales, Industrial, commercial, and comerciales y otros (1) 2,621.6 2,677.4 2,221.8 1,830.6 2,045.0 2,788.3 2,436.4 2,185.4 2,044.5 1,776.4 other buildings (1)
Empresas privadas 1,176.8 1,145.8 823.5 834.5 1,035.5 1,385.2 1,291.3 1,302.8 1,316.5 1,308.8 Private enterprises
Empresas públicas 1,444.9 1,531.6 1,398.3 996.1 1,009.5 1,403.1 1,145.0 882.6 727.9 467.5 Public enterprises
Carreteras, escuelas y otras Roads, schools, and other obras públicas 803.4 1,034.6 813.7 633.7 888.2 1,037.4 782.9 615.4 526.7 438.6 public works
Gobierno central 393.4 498.8 415.6 353.0 562.6 707.2 499.2 381.6 322.5 240.3 Central government
Gobiernos municipales 410.0 535.8 398.2 280.7 325.6 330.2 283.6 233.8 204.1 198.2 Municipal governments
Maquinaria y equipo 5,924.3 5,583.8 5,443.2 5,250.0 5,744.8 5,797.5 5,694.7 5,625.9 5,499.4 5,438.0 Machinery and equipment
Empresas privadas 5,712.4 5,397.1 5,237.9 5,058.2 5,458.7 5,528.9 5,482.3 5,435.8 5,276.6 5,216.1 Private enterprises
Empresas públicas 86.1 82.7 71.3 79.4 90.8 84.2 55.1 46.6 49.8 49.3 Public enterprises
Gobierno (2) 125.8 103.9 134.0 112.5 195.4 184.5 157.2 143.5 172.9 172.6 Government (2)
r- Cifras revisadas. r- Revised figures. p- Cifras preliminares. p- Preliminary figures.
(1) Incluye instalaciones eléctricas y telefónicas; acueductos y (1) Includes electric and telephone installations, aqueducts and alcantarillados; y refinerías. sewers, and refineries.(2) Gobierno central y municipios. (2) Central government and municipios.
Fuente: Junta de Planificación, Programa de Planificación Económica y Social, Source: Puerto Rico Planning Board, Program of Economic and Social Planning, Subprograma de Análisis Económico. Subprogram of Economic Analysis.

A-17 JUNTA DE PLANIFICACIÓN / PLANNING BOARD
APÉNDICE ESTADÍSTICO • STATISTICAL APPENDIXINFORME ECONÓMICO AL GOBERNADOR 2016 • ECONOMIC REPORT TO THE GOVERNOR 2016
VALOR DE LA ACTIVIDAD DE LA CONSTRUCCIÓNCONSTRUCTION ACTIVITY VALUE
1,80
1.7
2,05
6.3
1,92
0.9
1,84
9.8
1,88
8.0
1,88
4.0
2,05
8.6
2,50
2.2
2,05
7.1
1,55
5.5
1,27
6.6
940.
7
3,86
0.3
4,55
8.5
3,97
8.1
3,40
5.4
3,16
4.6
2,82
4.7
0.0
1,000.0
2,000.0
3,000.0
4,000.0
5,000.0
2011 2012 2013 2014r 2015r 2016p
Mill
ones
de
dóla
res
Mill
ions
of d
olla
rs
Años fiscales- Fiscal years
PRIVADA: PRIVATEPUBLICA: PUBLICTOTAL
r- Cifras revisadas. p- Cifras preliminares.r- Revised figures. p- Preliminary figures.
Fuente: Junta de Planificación, Programa de Planificación Económica y Social, Subprograma de Análisis Económico. Source: Puerto Rico Planning Board, Program of Economic and Social Planning, Subprogram of Economic Analysis.

A-18 JUNTA DE PLANIFICACIÓN / PLANNING BOARD
APÉNDICE ESTADÍSTICO • STATISTICAL APPENDIXINFORME ECONÓMICO AL GOBERNADOR 2016 • ECONOMIC REPORT TO THE GOVERNOR 2016
TABLA 9 - PRODUCTO BRUTO Y PRODUCTO INTERNO BRUTO POR SECTOR INDUSTRIAL PRINCIPAL: AÑOS FISCALES TABLE 9 - GROSS PRODUCT AND GROSS DOMESTIC PRODUCT BY MAJOR INDUSTRIAL SECTOR: FISCAL YEARS (En millones de dólares - In millions of dollars)
2007 2008 2009 2010 2011 2012 2013 2014r 2015r 2016p
PRODUCTO BRUTO 60,642.7 62,703.1 63,617.9 64,294.6 65,720.7 68,085.7 68,944.9 68,797.5 69,570.2 70,134.5 GROSS PRODUCT
Menos: Resto del mundo (28,881.4) (30,936.3) (32,767.7) (34,086.7) (34,631.0) (33,479.1) (33,505.2) (33,648.3) (33,573.4) (34,900.0) Less: Rest of the world
Gobierno federal 948.2 999.5 1,125.9 1,159.2 1,154.9 1,201.8 1,203.4 1,148.8 1,201.6 1,237.9 Federal government
Otros no residentes (29,829.6) (31,935.9) (33,893.6) (35,245.9) (35,785.9) (34,680.9) (34,708.5) (34,797.1) (34,775.0) (36,137.8) Other nonresidents
PRODUCTO INTERNO BRUTO 89,524.1 93,639.3 96,385.6 98,381.3 100,351.7 101,564.8 102,450.0 102,445.8 103,143.5 105,034.5 GROSS DOMESTIC PRODUCT
Agricultura 430.2 518.7 567.1 822.0 795.0 816.4 846.7 867.1 854.6 840.3 Agriculture
Minería 61.4 56.4 46.1 33.7 28.4 34.5 35.8 20.0 28.5 27.9 Mining
Utilidades 2,214.4 2,118.0 1,966.9 1,981.9 1,867.5 2,074.3 1,638.1 2,128.8 2,111.4 1,972.0 Utilities
Construcción 1,965.4 1,975.1 1,730.6 1,484.4 1,303.9 1,335.0 1,216.1 1,130.2 1,100.8 1,016.2 Construction
Manufactura 37,636.6 40,233.9 43,872.2 46,577.3 46,760.0 46,971.4 47,580.9 47,876.2 48,648.2 49,664.3 Manufacturing
Comercio al por mayor 2,751.6 2,950.9 2,845.7 2,993.1 2,909.1 2,819.1 2,662.3 2,818.9 2,832.4 2,813.7 Wholesalers Trade
Comercio al detal 4,471.4 4,569.4 4,467.1 4,472.8 4,787.2 4,808.5 4,963.3 5,030.4 4,971.7 5,152.4 Retail Trade
Transportación y Almacenamiento 968.3 978.5 894.9 941.0 897.8 946.5 937.1 912.8 933.0 985.2 Transportation and Warehousing
Informática 2,466.5 2,363.1 2,425.9 2,646.0 2,610.2 2,464.7 2,330.7 2,645.4 2,705.2 2,828.8 Information
Finanzas y Seguros 6,694.3 7,120.4 5,104.8 5,240.7 5,611.2 5,176.1 5,758.3 4,416.5 5,058.1 4,729.9 Finance and Insurance
Bienes Raíces y Renta 12,805.3 13,097.8 13,659.9 13,785.4 14,368.8 15,383.3 15,426.3 15,793.5 15,405.8 16,016.9 Real Estate and Rental
Servicios Profesionales Científicos y Técnicos 1,632.7 1,657.9 1,543.6 1,510.1 1,550.3 1,622.3 1,755.3 1,833.2 1,897.3 1,987.4 Professional, Scientific, and Technical Services
Administración de Compañías y Empresas 137.2 150.0 126.4 72.5 79.1 73.1 65.9 67.5 72.7 89.3 Management of Companies and Enterprises
Servicios Administrativos y de Apoyo 1,342.6 1,375.9 1,338.8 1,500.4 1,681.7 1,764.8 1,824.8 1,820.4 1,774.2 1,774.2 Administrative Services and Support
Servicios Educativos 703.2 743.1 773.1 721.3 683.9 704.5 658.0 701.2 675.3 653.7 Educational Services
Servicios de Salud y Servicios Sociales 2,889.3 3,043.1 3,332.7 3,293.9 3,394.0 3,379.8 3,606.2 3,720.4 3,830.9 3,845.2 Health Care and Social Services
Arte, Entretenimiento y Recreación 138.3 119.3 101.5 93.8 85.9 91.2 105.4 147.9 146.0 160.0 Art, Entertainment and Recreation
Alojamiento y Restaurantes 1,723.2 1,755.4 1,671.3 1,765.8 1,779.8 1,849.2 1,972.5 2,022.4 2,048.2 2,104.6 Accommodation and Food Services
Otros Servicios 371.6 362.7 389.6 389.5 383.2 395.4 423.9 432.8 431.2 438.7 Other Services
Gobierno 8,584.9 8,762.2 9,047.4 8,349.9 8,215.9 8,277.7 8,237.5 7,825.1 7,268.0 7,353.8 Government
Central (1) 7,280.6 7,350.5 7,567.1 6,861.7 6,703.1 6,740.4 6,664.9 6,285.5 5,740.8 5,804.0 Central (1)
Municipios 1,304.2 1,411.7 1,480.3 1,488.2 1,512.8 1,537.3 1,572.7 1,539.6 1,527.2 1,549.7 Municipios
Discrepancia estadística (464.2) (312.3) 480.0 (294.4) 558.9 577.3 405.0 235.3 350.1 580.2 Statistical discrepancy
r- Cifras revisadas. r- Revised figures. p- Cifras preliminares. p- Preliminary figures.( ) Cifras negativas. ( ) Negative figures.(1) Incluye las agencias, la Universidad de Puerto Rico, la Corporación del Fondo (1) Includes agencies, the University of Puerto Rico, the State Insurance Fund del Seguro del Estado y la Autoridad de Carreteras y Transportación. Corporation, and the Highway and Transportation Authority.
Fuente: Junta de Planificación, Programa de Planificación Económica y Social, Source: Puerto Rico Planning Board, Program of Economic and Social Planning, Subprograma de Análisis Económico. Subprogram of Economic Analysis.

A-19 JUNTA DE PLANIFICACIÓN / PLANNING BOARD
APÉNDICE ESTADÍSTICO • STATISTICAL APPENDIXINFORME ECONÓMICO AL GOBERNADOR 2016 • ECONOMIC REPORT TO THE GOVERNOR 2016
PRODUCTO BRUTO Y PRODUCTO INTERNO BRUTOGROSS PRODUCT AND GROSS DOMESTIC PRODUCT
65,720.7 68,085.7 68,944.9 68,797.5 69,570.2 70,134.5
100,351.7 101,564.8 102,450.0 102,445.8 103,143.5 105,034.5
40,000.0
50,000.0
60,000.0
70,000.0
80,000.0
90,000.0
100,000.0
110,000.0
2011 2012 2013 2014r 2015r 2016p
Mill
ones
de
dóla
res
Mill
ions
of d
olla
rs
Años fiscales- Fiscal years
PRODUCTO BRUTO: GROSS PRODUCT
PRODUCTO INTERNO BRUTO: GROSS DOMESTIC PRODUCTr- Cifras revisadas. p- Cifras preliminares.r- Revised figures. p- Preliminary figures.
Fuente: Junta de Planificación, Programa de Planificación Económica y Social, Subprograma de Análisis Económico. Source: Puerto Rico Planning Board, Program of Economic and Social Planning, Subprogram of Economic Analysis.

A-20 JUNTA DE PLANIFICACIÓN / PLANNING BOARD
APÉNDICE ESTADÍSTICO • STATISTICAL APPENDIXINFORME ECONÓMICO AL GOBERNADOR 2016 • ECONOMIC REPORT TO THE GOVERNOR 2016
TABLA 10 - INGRESO NETO POR SECTOR INDUSTRIAL PRINCIPAL: AÑOS FISCALES TABLE 10 - NET INCOME BY MAJOR INDUSTRIAL SECTOR: FISCAL YEARS(En millones de dólares -In millions of dollars)
2007 2008 2009 2010 2011 2012 2013 2014r 2015r 2016p
INGRESO NETO 49,254.4 50,030.6 49,986.4 50,245.8 51,037.6 54,207.0 55,390.4 55,378.6 55,669.6 55,457.1 NET INCOME
Menos: Resto del mundo (28,881.4) (30,936.3) (32,767.7) (34,086.7) (34,631.0) (33,479.1) (33,505.2) (33,648.3) (33,573.4) (34,900.0) Less: Rest of the world
Gobierno federal 948.2 999.5 1,125.9 1,159.2 1,154.9 1,201.8 1,203.4 1,148.8 1,201.6 1,237.9 Federal government
Otros no residentes (29,829.6) (31,935.8) (33,893.6) (35,245.9) (35,785.9) (34,680.9) (34,708.5) (34,797.1) (34,775.0) (36,137.8) Other nonresidents
INGRESO INTERNO NETO 78,135.8 80,966.9 82,754.1 84,332.5 85,668.6 87,686.2 88,895.6 89,027.0 89,242.9 90,357.1 NET DOMESTIC INCOME
Agricultura 432.0 518.8 567.7 823.8 798.3 819.0 847.6 870.2 859.5 845.3 Agriculture
Minería 44.2 36.0 28.6 21.3 14.0 22.9 23.0 13.0 21.8 20.2 Mining
Utilidades 1,745.4 1,620.7 1,433.1 1,404.3 1,183.5 1,406.9 1,028.6 1,487.2 1,443.6 1,324.5 Utilities
Construcción 1,711.0 1,661.1 1,437.5 1,205.9 1,029.2 1,096.5 1,047.4 923.9 896.7 805.5 Construction
Manufactura 35,223.4 37,299.0 40,687.7 43,291.6 43,356.8 43,574.7 44,178.1 44,417.1 45,126.6 46,040.0 Manufacturing
Comercio al por mayor 2,213.7 2,308.7 2,245.1 2,352.1 2,276.4 2,217.6 2,189.5 2,237.4 2,248.9 2,188.0 Wholesalers Trade
Comercio al detal 3,802.6 3,853.7 3,812.1 3,802.9 4,111.2 4,150.2 4,325.6 4,377.7 4,321.1 4,429.1 Retail Trade
Transportación y Almacenamiento 742.9 761.3 681.1 724.0 686.2 739.4 718.8 658.4 694.9 720.0 Transportation and Warehousing
Informática 1,290.8 1,235.3 1,347.2 1,243.7 1,183.4 1,108.6 1,100.4 1,303.6 1,345.2 1,346.0 Information
Finanzas y Seguros 5,039.5 4,944.0 2,796.0 2,410.1 3,201.4 3,385.8 3,861.8 2,879.9 3,371.3 3,229.3 Finance and Insurance
Bienes Raíces, Renta y Arrendamieto 9,585.3 9,998.9 10,626.0 10,689.3 11,322.9 12,354.9 12,300.0 12,679.3 12,178.1 12,533.5 Real Estate and Rental and Leasing
Servicios Profesionales, Científicos y Técnicos 1,531.8 1,545.3 1,430.2 1,396.2 1,436.5 1,514.4 1,646.8 1,732.7 1,792.2 1,867.0 Professional, Scientific, and Technical Services
Administración de Compañías y Empresas 132.6 145.9 120.7 62.2 65.2 58.9 54.1 57.8 62.4 76.4 Management of Companies and Enterprises
Servicios Administrativos y de Apoyo 1,222.8 1,259.5 1,216.9 1,351.3 1,525.9 1,595.0 1,647.4 1,653.8 1,612.7 1,598.4 Administrative Services and Support
Servicios Educativos 574.6 615.7 637.6 565.4 514.8 537.4 513.2 524.2 499.2 471.3 Educational Services
Servicios de Salud y Servicios Sociales 2,438.0 2,570.1 2,871.2 2,774.9 2,877.8 2,865.3 3,087.2 3,192.9 3,291.9 3,265.8 Health Care and Social Services
Arte, Entretenimiento y Recreación 93.7 84.1 68.9 61.7 58.7 66.3 78.8 119.1 117.5 127.8 Art, Entertainment and Recreation
Alojamiento y Restaurantes 1,403.6 1,428.8 1,357.8 1,468.1 1,477.9 1,552.0 1,645.7 1,702.0 1,721.0 1,742.7 Accommodation and Food Services
Otros Servicios 322.9 317.8 341.3 333.8 332.4 342.7 364.2 371.8 370.5 372.1 Other ServicesGobierno 8,584.9 8,762.2 9,047.4 8,349.9 8,215.9 8,277.7 8,237.5 7,825.1 7,268.0 7,353.8 Government
Central (1) 7,280.6 7,350.5 7,567.1 6,861.7 6,703.1 6,740.4 6,664.9 6,285.5 5,740.8 5,804.0 Central (1)
Municipios 1,304.2 1,411.7 1,480.3 1,488.2 1,512.8 1,537.3 1,572.7 1,539.6 1,527.2 1,549.7 Municipios
r Cifras revisadas. r Revised figures.p Cifras preliminares. p Preliminary figures.( ) Cifras negativas. ( ) Negative figures.(1) Incluye las agencias, la Universidad de Puerto Rico, la Corporación del Fondo (1) Includes agencies, the University of Puerto Rico, the Puerto Rico State Insurance Fund
del Seguro del Estado y la Autoridad de Carreteras y Transportación. Corporation, and the Highway and Transportation Authority.
Fuente: Junta de Planificación, Programa de Planificación Económica y Social, Source: Puerto Rico Planning Board, Program of Economic and Social Planning, Subprograma de Análisis Económico. Subprogram of Economic Analysis.

A-21 JUNTA DE PLANIFICACIÓN / PLANNING BOARD
APÉNDICE ESTADÍSTICO • STATISTICAL APPENDIXINFORME ECONÓMICO AL GOBERNADOR 2016 • ECONOMIC REPORT TO THE GOVERNOR 2016
INGRESO NETO E INGRESO INTERNO NETONET INCOME AND NET DOMESTIC INCOME
51,037.6 54,207.0 55,390.4 55,378.6 55,669.6 55,457.1
85,668.6 87,686.2 88,895.6 89,027.0 89,242.9 90,357.1
40,000.0
50,000.0
60,000.0
70,000.0
80,000.0
90,000.0
100,000.0
2011 2012 2013 2014r 2015r 2016p
Mill
ones
de
dóla
res
Mill
ions
of d
olla
rs
Años fiscales- Fiscal years
INGRESO NETO: NET INCOME
INGRESO INTERNO NETO: NET DOMESTIC INCOME
r- Cifras revisadas. p- Cifras preliminares.r- Revised figures. p- Preliminary figures.
Fuente: Junta de Planificación, Programa de Planificación Económica y Social, Subprograma de Análisis Económico. Source: Puerto Rico Planning Board, Program of Economic and Social Planning, Subprogram of Economic Analysis.

A-22 JUNTA DE PLANIFICACIÓN / PLANNING BOARD
APÉNDICE ESTADÍSTICO • STATISTICAL APPENDIXINFORME ECONÓMICO AL GOBERNADOR 2016 • ECONOMIC REPORT TO THE GOVERNOR 2016
TABLA 11 - DISTRIBUCIÓN FUNCIONAL DEL INGRESO NETO POR SECTOR INDUSTRIAL PRINCIPAL: AÑOS FISCALES TABLE 11 - FUNCTIONAL DISTRIBUTION OF NET INCOME BY MAJOR INDUSTRIAL SECTOR: FISCAL YEARS (En millones de dólares - In millions of dollars)
2007 2008 2009 2010 2011 2012 2013 2014r 2015r 2016p
INGRESO NETO 49,254.4 50,030.6 49,986.4 50,245.8 51,037.6 54,207.0 55,390.4 55,378.6 55,669.6 55,457.1 NET INCOME
Compensación a empleados 30,234.2 30,868.8 30,676.9 29,870.4 29,290.0 29,671.2 29,841.1 29,349.3 28,861.8 28,839.6 Employees' compensationIngresos procedentes de la propiedad (1) 19,020.2 19,161.8 19,309.5 20,375.4 21,747.6 24,535.9 25,549.3 26,029.4 26,807.7 26,617.4 Proprietors' income (1)
Menos: Resto del mundo (28,881.4) (30,936.3) (32,767.7) (34,086.7) (34,631.0) (33,479.1) (33,505.2) (33,648.3) (33,573.4) (34,900.0) Less: Rest of the world Compensación a empleados 946.4 999.4 1,124.2 1,157.2 1,151.7 1,200.3 1,201.9 1,146.0 1,200.0 1,233.3 Employees' compensation Ingresos procedentes de la propiedad (29,827.8) (31,935.7) (33,891.9) (35,243.9) (35,782.7) (34,679.4) (34,707.0) (34,794.4) (34,773.4) (36,133.3) Proprietors' income
INGRESO INTERNO NETO 78,135.8 80,966.9 82,754.1 84,332.5 85,668.6 87,686.2 88,895.6 89,027.0 89,242.9 90,357.1 NET DOMESTIC INCOME Compensación a empleados 29,287.8 29,869.4 29,552.7 28,713.2 28,138.2 28,470.9 28,639.2 28,203.2 27,661.8 27,606.3 Employees' compensation Ingresos procedentes de la propiedad 48,848.0 51,097.5 53,201.4 55,619.3 57,530.3 59,215.3 60,256.3 60,823.7 61,581.1 62,750.7 Proprietors' income
Agricultura 432.0 518.8 567.7 823.8 798.3 819.0 847.6 870.2 859.5 845.3 Agriculture Compensación a empleados 119.6 121.8 128.6 148.1 147.0 151.1 150.0 150.1 150.6 148.4 Employees' compensation Ingresos procedentes de la propiedad 312.4 396.9 439.1 675.6 651.3 667.9 697.6 720.1 708.9 696.9 Proprietors' income
Minería 44.2 36.0 28.6 21.3 14.0 22.9 23.0 13.0 21.8 20.2 Mining Compensación a empleados 28.5 28.6 22.8 18.0 16.3 17.2 17.1 14.4 22.9 21.1 Employees' compensation Ingresos procedentes de la propiedad 15.6 7.4 5.7 3.3 (2.2) 5.7 5.9 (1.4) (1.1) (0.9) Proprietors' income
Utilidades 1,745.4 1,620.7 1,433.1 1,404.3 1,183.5 1,406.9 1,028.6 1,487.2 1,443.6 1,324.5 Utilities Compensación a empleados 1,213.2 1,240.8 1,028.6 1,005.9 942.7 976.7 958.5 930.6 891.8 892.9 Employees' compensation Ingresos procedentes de la propiedad 532.2 379.9 404.5 398.4 240.8 430.2 70.1 556.6 551.8 431.6 Proprietors' income
Construcción 1,711.0 1,661.1 1,437.5 1,205.9 1,029.2 1,096.5 1,047.4 923.9 896.7 805.5 Construction Compensación a empleados 1,283.2 1,257.4 1,099.8 964.2 788.0 840.6 804.5 704.3 686.7 615.3 Employees' compensation Ingresos procedentes de la propiedad 427.8 403.8 337.7 241.8 241.2 255.9 242.9 219.5 210.0 190.2 Proprietors' income
Manufactura 35,223.4 37,299.0 40,687.7 43,291.6 43,356.8 43,574.7 44,178.1 44,417.1 45,126.6 46,040.0 Manufacturing Compensación a empleados 4,203.4 4,340.4 4,233.3 4,239.0 3,874.5 3,557.8 3,436.0 3,383.6 3,427.4 3,376.2 Employees' compensation Ingresos procedentes de la propiedad 31,019.9 32,958.6 36,454.4 39,052.6 39,482.3 40,016.9 40,742.1 41,033.5 41,699.3 42,663.9 Proprietors' income
Comercio al por mayor 2,213.7 2,308.7 2,245.1 2,352.1 2,276.4 2,217.6 2,189.5 2,237.4 2,248.9 2,188.0 Wholesalers Trade Compensación a empleados 1,499.4 1,530.0 1,476.8 1,479.9 1,475.5 1,445.7 1,472.4 1,485.7 1,470.1 1,428.2 Employees' compensation Ingresos procedentes de la propiedad 714.3 778.6 768.3 872.2 801.0 771.9 717.1 751.7 778.8 759.8 Proprietors' income
Comercio al detal 3,802.6 3,853.7 3,812.1 3,802.9 4,111.2 4,150.2 4,325.6 4,377.7 4,321.1 4,429.1 Retail Trade Compensación a empleados 2,380.0 2,394.3 2,435.3 2,436.1 2,664.2 2,760.3 2,820.1 2,843.7 2,813.5 2,869.7 Employees' compensation Ingresos procedentes de la propiedad 1,422.6 1,459.4 1,376.8 1,366.8 1,447.0 1,389.8 1,505.4 1,534.0 1,507.6 1,559.4 Proprietors' income
Transportación y Almacenamiento 742.9 761.3 681.1 724.0 686.2 739.4 718.8 658.4 694.9 720.0 Transportation and Warehousing Compensación a empleados 611.5 620.7 611.9 598.6 587.8 588.6 592.3 568.8 555.5 557.4 Employees' compensation Ingresos procedentes de la propiedad 131.4 140.7 69.1 125.4 98.4 150.8 126.5 89.6 139.4 162.6 Proprietors' income
Informática 1,290.8 1,235.3 1,347.2 1,243.7 1,183.4 1,108.6 1,100.4 1,303.6 1,345.2 1,346.0 Information Compensación a empleados 940.7 927.4 885.9 825.7 786.1 775.3 772.5 763.8 791.4 786.6 Employees' compensation Ingresos procedentes de la propiedad 350.1 307.9 461.3 418.0 397.3 333.4 327.9 539.8 553.7 559.5 Proprietors' income
A-23 JUNTA DE PLANIFICACIÓN / PLANNING BOARD
APÉNDICE ESTADÍSTICO • STATISTICAL APPENDIXINFORME ECONÓMICO AL GOBERNADOR 2016 • ECONOMIC REPORT TO THE GOVERNOR 2016
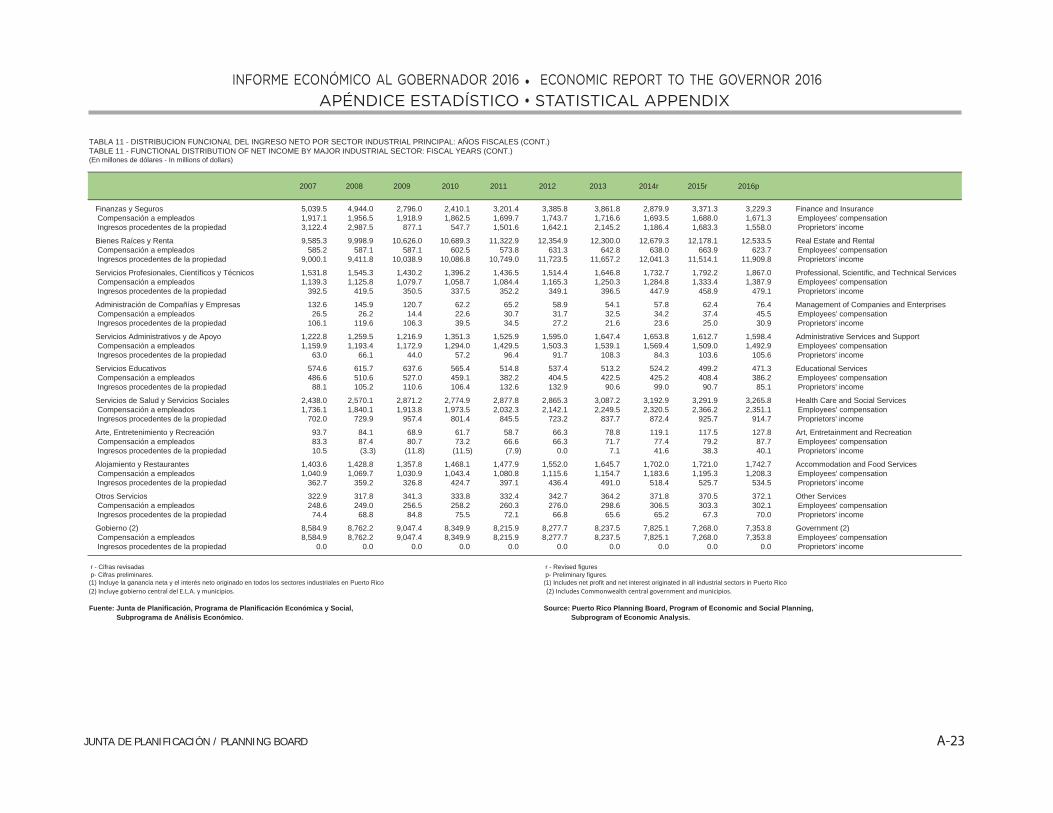
TABLA 11 - DISTRIBUCION FUNCIONAL DEL INGRESO NETO POR SECTOR INDUSTRIAL PRINCIPAL: AÑOS FISCALES (CONT.) TABLE 11 - FUNCTIONAL DISTRIBUTION OF NET INCOME BY MAJOR INDUSTRIAL SECTOR: FISCAL YEARS (CONT.)(En millones de dólares - In millions of dollars)
2007 2008 2009 2010 2011 2012 2013 2014r 2015r 2016p
Finanzas y Seguros 5,039.5 4,944.0 2,796.0 2,410.1 3,201.4 3,385.8 3,861.8 2,879.9 3,371.3 3,229.3 Finance and Insurance Compensación a empleados 1,917.1 1,956.5 1,918.9 1,862.5 1,699.7 1,743.7 1,716.6 1,693.5 1,688.0 1,671.3 Employees' compensation Ingresos procedentes de la propiedad 3,122.4 2,987.5 877.1 547.7 1,501.6 1,642.1 2,145.2 1,186.4 1,683.3 1,558.0 Proprietors' income
Bienes Raíces y Renta 9,585.3 9,998.9 10,626.0 10,689.3 11,322.9 12,354.9 12,300.0 12,679.3 12,178.1 12,533.5 Real Estate and Rental Compensación a empleados 585.2 587.1 587.1 602.5 573.8 631.3 642.8 638.0 663.9 623.7 Employees' compensation Ingresos procedentes de la propiedad 9,000.1 9,411.8 10,038.9 10,086.8 10,749.0 11,723.5 11,657.2 12,041.3 11,514.1 11,909.8 Proprietors' income
Servicios Profesionales, Científicos y Técnicos 1,531.8 1,545.3 1,430.2 1,396.2 1,436.5 1,514.4 1,646.8 1,732.7 1,792.2 1,867.0 Professional, Scientific, and Technical Services Compensación a empleados 1,139.3 1,125.8 1,079.7 1,058.7 1,084.4 1,165.3 1,250.3 1,284.8 1,333.4 1,387.9 Employees' compensation Ingresos procedentes de la propiedad 392.5 419.5 350.5 337.5 352.2 349.1 396.5 447.9 458.9 479.1 Proprietors' income
Administración de Compañías y Empresas 132.6 145.9 120.7 62.2 65.2 58.9 54.1 57.8 62.4 76.4 Management of Companies and Enterprises Compensación a empleados 26.5 26.2 14.4 22.6 30.7 31.7 32.5 34.2 37.4 45.5 Employees' compensation Ingresos procedentes de la propiedad 106.1 119.6 106.3 39.5 34.5 27.2 21.6 23.6 25.0 30.9 Proprietors' income
Servicios Administrativos y de Apoyo 1,222.8 1,259.5 1,216.9 1,351.3 1,525.9 1,595.0 1,647.4 1,653.8 1,612.7 1,598.4 Administrative Services and Support Compensación a empleados 1,159.9 1,193.4 1,172.9 1,294.0 1,429.5 1,503.3 1,539.1 1,569.4 1,509.0 1,492.9 Employees' compensation Ingresos procedentes de la propiedad 63.0 66.1 44.0 57.2 96.4 91.7 108.3 84.3 103.6 105.6 Proprietors' income
Servicios Educativos 574.6 615.7 637.6 565.4 514.8 537.4 513.2 524.2 499.2 471.3 Educational Services Compensación a empleados 486.6 510.6 527.0 459.1 382.2 404.5 422.5 425.2 408.4 386.2 Employees' compensation Ingresos procedentes de la propiedad 88.1 105.2 110.6 106.4 132.6 132.9 90.6 99.0 90.7 85.1 Proprietors' income
Servicios de Salud y Servicios Sociales 2,438.0 2,570.1 2,871.2 2,774.9 2,877.8 2,865.3 3,087.2 3,192.9 3,291.9 3,265.8 Health Care and Social Services Compensación a empleados 1,736.1 1,840.1 1,913.8 1,973.5 2,032.3 2,142.1 2,249.5 2,320.5 2,366.2 2,351.1 Employees' compensation Ingresos procedentes de la propiedad 702.0 729.9 957.4 801.4 845.5 723.2 837.7 872.4 925.7 914.7 Proprietors' income
Arte, Entretenimiento y Recreación 93.7 84.1 68.9 61.7 58.7 66.3 78.8 119.1 117.5 127.8 Art, Entretainment and Recreation Compensación a empleados 83.3 87.4 80.7 73.2 66.6 66.3 71.7 77.4 79.2 87.7 Employees' compensation Ingresos procedentes de la propiedad 10.5 (3.3) (11.8) (11.5) (7.9) 0.0 7.1 41.6 38.3 40.1 Proprietors' income
Alojamiento y Restaurantes 1,403.6 1,428.8 1,357.8 1,468.1 1,477.9 1,552.0 1,645.7 1,702.0 1,721.0 1,742.7 Accommodation and Food Services Compensación a empleados 1,040.9 1,069.7 1,030.9 1,043.4 1,080.8 1,115.6 1,154.7 1,183.6 1,195.3 1,208.3 Employees' compensation Ingresos procedentes de la propiedad 362.7 359.2 326.8 424.7 397.1 436.4 491.0 518.4 525.7 534.5 Proprietors' income
Otros Servicios 322.9 317.8 341.3 333.8 332.4 342.7 364.2 371.8 370.5 372.1 Other Services Compensación a empleados 248.6 249.0 256.5 258.2 260.3 276.0 298.6 306.5 303.3 302.1 Employees' compensation Ingresos procedentes de la propiedad 74.4 68.8 84.8 75.5 72.1 66.8 65.6 65.2 67.3 70.0 Proprietors' income
Gobierno (2) 8,584.9 8,762.2 9,047.4 8,349.9 8,215.9 8,277.7 8,237.5 7,825.1 7,268.0 7,353.8 Government (2) Compensación a empleados 8,584.9 8,762.2 9,047.4 8,349.9 8,215.9 8,277.7 8,237.5 7,825.1 7,268.0 7,353.8 Employees' compensation Ingresos procedentes de la propiedad 0.0 0.0 0.0 0.0 0.0 0.0 0.0 0.0 0.0 0.0 Proprietors' income
r - Cifras revisadas. r - Revised figures p- Cifras preliminares. p- Preliminary figures.(1) Incluye la ganancia neta y el interés neto originado en todos los sectores industriales en Puerto Rico. (1) Includes net profit and net interest originated in all industrial sectors in Puerto Rico(2) Incluye gobierno central del E.L.A. y municipios. (2) Includes Commonwealth central government and municipios.
Fuente: Junta de Planificación, Programa de Planificación Económica y Social, Source: Puerto Rico Planning Board, Program of Economic and Social Planning, Subprograma de Análisis Económico. Subprogram of Economic Analysis.
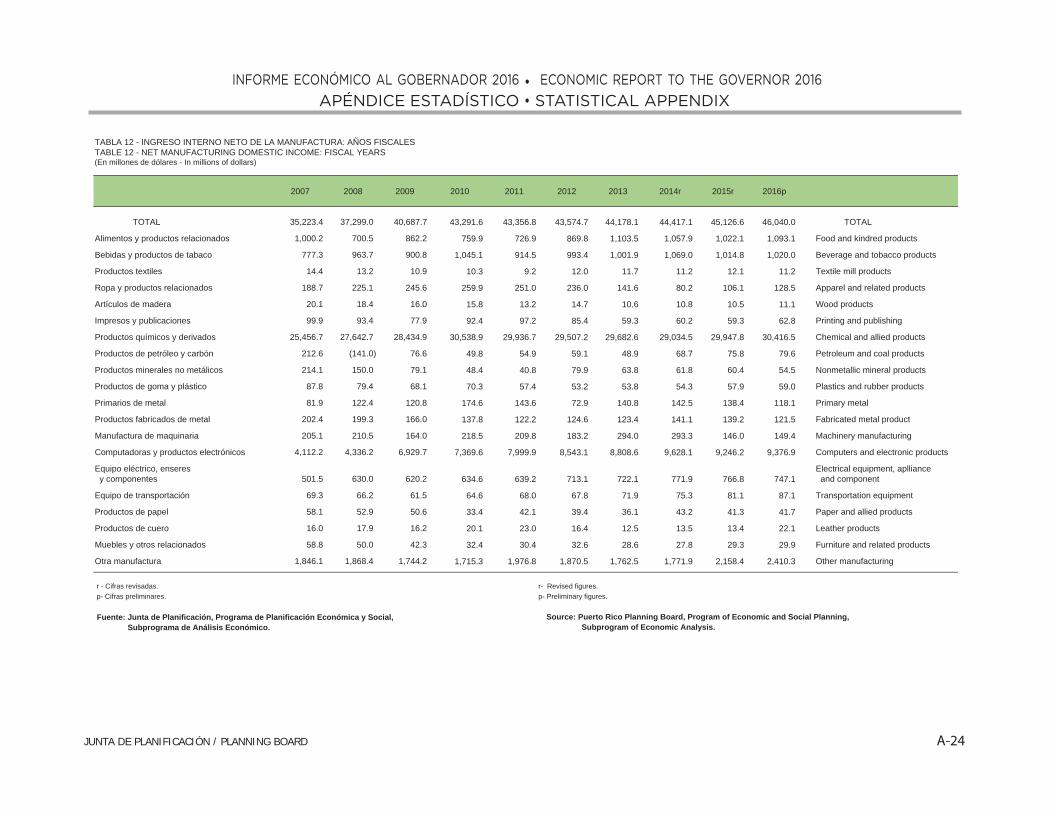
A-24 JUNTA DE PLANIFICACIÓN / PLANNING BOARD
APÉNDICE ESTADÍSTICO • STATISTICAL APPENDIXINFORME ECONÓMICO AL GOBERNADOR 2016 • ECONOMIC REPORT TO THE GOVERNOR 2016
TABLA 12 - INGRESO INTERNO NETO DE LA MANUFACTURA: AÑOS FISCALES TABLE 12 - NET MANUFACTURING DOMESTIC INCOME: FISCAL YEARS (En millones de dólares - In millions of dollars)
2007 2008 2009 2010 2011 2012 2013 2014r 2015r 2016p
TOTAL 35,223.4 37,299.0 40,687.7 43,291.6 43,356.8 43,574.7 44,178.1 44,417.1 45,126.6 46,040.0 TOTAL
Alimentos y productos relacionados 1,000.2 700.5 862.2 759.9 726.9 869.8 1,103.5 1,057.9 1,022.1 1,093.1 Food and kindred products
Bebidas y productos de tabaco 777.3 963.7 900.8 1,045.1 914.5 993.4 1,001.9 1,069.0 1,014.8 1,020.0 Beverage and tobacco products
Productos textiles 14.4 13.2 10.9 10.3 9.2 12.0 11.7 11.2 12.1 11.2 Textile mill products
Ropa y productos relacionados 188.7 225.1 245.6 259.9 251.0 236.0 141.6 80.2 106.1 128.5 Apparel and related products
Artículos de madera 20.1 18.4 16.0 15.8 13.2 14.7 10.6 10.8 10.5 11.1 Wood products
Impresos y publicaciones 99.9 93.4 77.9 92.4 97.2 85.4 59.3 60.2 59.3 62.8 Printing and publishing
Productos químicos y derivados 25,456.7 27,642.7 28,434.9 30,538.9 29,936.7 29,507.2 29,682.6 29,034.5 29,947.8 30,416.5 Chemical and allied products
Productos de petróleo y carbón 212.6 (141.0) 76.6 49.8 54.9 59.1 48.9 68.7 75.8 79.6 Petroleum and coal products
Productos minerales no metálicos 214.1 150.0 79.1 48.4 40.8 79.9 63.8 61.8 60.4 54.5 Nonmetallic mineral products
Productos de goma y plástico 87.8 79.4 68.1 70.3 57.4 53.2 53.8 54.3 57.9 59.0 Plastics and rubber products
Primarios de metal 81.9 122.4 120.8 174.6 143.6 72.9 140.8 142.5 138.4 118.1 Primary metal
Productos fabricados de metal 202.4 199.3 166.0 137.8 122.2 124.6 123.4 141.1 139.2 121.5 Fabricated metal product
Manufactura de maquinaria 205.1 210.5 164.0 218.5 209.8 183.2 294.0 293.3 146.0 149.4 Machinery manufacturing
Computadoras y productos electrónicos 4,112.2 4,336.2 6,929.7 7,369.6 7,999.9 8,543.1 8,808.6 9,628.1 9,246.2 9,376.9 Computers and electronic products
Equipo eléctrico, enseres Electrical equipment, aplliance y componentes 501.5 630.0 620.2 634.6 639.2 713.1 722.1 771.9 766.8 747.1 and component
Equipo de transportación 69.3 66.2 61.5 64.6 68.0 67.8 71.9 75.3 81.1 87.1 Transportation equipment
Productos de papel 58.1 52.9 50.6 33.4 42.1 39.4 36.1 43.2 41.3 41.7 Paper and allied products
Productos de cuero 16.0 17.9 16.2 20.1 23.0 16.4 12.5 13.5 13.4 22.1 Leather products
Muebles y otros relacionados 58.8 50.0 42.3 32.4 30.4 32.6 28.6 27.8 29.3 29.9 Furniture and related products
Otra manufactura 1,846.1 1,868.4 1,744.2 1,715.3 1,976.8 1,870.5 1,762.5 1,771.9 2,158.4 2,410.3 Other manufacturing
r - Cifras revisadas. r- Revised figures. p- Cifras preliminares. p- Preliminary figures.
Fuente: Junta de Planificación, Programa de Planificación Económica y Social, Source: Puerto Rico Planning Board, Program of Economic and Social Planning, Subprograma de Análisis Económico. Subprogram of Economic Analysis.

A-25 JUNTA DE PLANIFICACIÓN / PLANNING BOARD
APÉNDICE ESTADÍSTICO • STATISTICAL APPENDIXINFORME ECONÓMICO AL GOBERNADOR 2016 • ECONOMIC REPORT TO THE GOVERNOR 2016
43,356.8 43,574.7 44,178.1 44,417.1 45,126.6 46,040.0
29,936.7 29,507.2 29,682.6 29,034.5 29,947.8 30,416.5
20,000.0
25,000.0
30,000.0
35,000.0
40,000.0
45,000.0
50,000.0
2011 2012 2013 2014r 2015r 2016p
Mill
ones
de
dóla
res
Mill
ions
of d
olla
rs
Años fiscales- Fiscal years
INGRESO INTERNO NETO DE LA MANUFACTURA : NET MANUFACTURING DOMESTICINCOMEr- Cifras revisadas. p- Cifras preliminares.
r- Revised figures. p- Preliminary figures.
INGRESO INTERNO NETO DE LA MANUFACTURANET MANUFACTURING DOMESTIC INCOME
Fuente: Junta de Planificación, Programa de Planificación Económica y Social, Subprograma de Análisis Económico. Source: Puerto Rico Planning Board, Program of Economic and Social Planning, Subprogram of Economic Analysis.

A-26 JUNTA DE PLANIFICACIÓN / PLANNING BOARD
APÉNDICE ESTADÍSTICO • STATISTICAL APPENDIXINFORME ECONÓMICO AL GOBERNADOR 2016 • ECONOMIC REPORT TO THE GOVERNOR 2016
TABLA 13 - INGRESO BRUTO AGRICOLA: AÑOS FISCALESTABLE 13 - GROSS FARM INCOME: FISCAL YEARS(En millones de dólares - In millions of dollars)
2005 2006 2007 2008 2009 2010r 2011r 2012r 2013r 2014p
INGRESO BRUTO 793.6 801.6 782.4 772.6 792.1 829.2 782.4 715.8 832.7 929.7 GROSS INCOME
Cosechas tradicionales 33.9 52.8 49.3 36.5 29.2 25.5 29.6 22.4 20.4 26.4 Traditional crops
Café 33.9 52.8 49.3 36.5 29.2 25.5 29.6 22.4 20.4 26.3 Coffee
Arroz* 0.0 0.0 0.0 0.0 0.0 0.0 0.0 0.0 0.0 0.1 Rice*
Azúcar y mieles 0.0 0.0 0.0 0.0 0.0 0.0 0.0 0.0 0.0 0.0 Sugar and molasses
Productos pecuarios 384.4 383.7 404.3 377.9 400.1 393.7 379.0 399.0 388.4 400.1 Livestock products
Leche 184.6 185.2 186.8 183.9 224.0 214.2 221.7 230.2 219.0 214.0 Milk
Huevos 16.1 15.6 15.0 13.6 14.2 13.5 13.1 15.8 15.4 19.3 Eggs
Carne de res 30.0 29.7 31.1 30.1 27.3 24.5 25.6 26.3 28.4 29.2 Beef
Carne de cerdo 23.4 17.8 25.7 23.8 18.9 17.2 16.3 18.7 17.7 18.9 Pork
Aves 82.3 89.4 89.2 78.8 66.3 77.7 72.0 73.3 76.1 81.9 Poultry
Cabros y otras carnes 6.0 5.0 5.8 4.1 4.5 1.4 0.8 1.0 0.8 0.8 Goats and other meats
Otros 42.0 41.0 50.6 43.7 44.8 45.2 29.6 33.7 31.0 35.9 Others
Cambio en inventario de animales 16.7 22.9 30.8 25.0 24.8 24.7 24.8 (14.9) 84.8 71.4 Change in livestock inventory
Legumbres 1.5 1.1 0.6 1.0 1.2 1.4 0.4 0.3 0.2 0.4 Legumes
Frutas 46.2 41.3 30.2 27.7 29.4 21.1 20.3 22.0 26.2 32.0 Fruits
Vegetales farináceos 72.3 88.6 79.4 100.0 94.1 83.3 62.3 56.2 66.4 109.6 Starchy vegetables
Otros vegetales 39.1 35.2 33.3 45.7 33.5 55.5 42.8 22.1 28.1 50.2 Other vegetables
Plantas ornamentales 43.8 52.9 41.8 45.3 45.3 33.7 30.7 34.6 34.9 39.3 Ornamental plants
Otros productos 155.6 123.2 112.7 113.5 134.7 190.4 192.4 174.0 183.4 200.3 Other products
r- Cifras revisadas. r- Revised figures. p- Cifras preliminares. p- Preliminary figures.( ) Cifras negativas. ( ) Negative figures.* Para el 2014, la tabla incluye información de arroz no incluida anteriormente. * For 2014, the table includes rice information, not previously included. Para el 2015-2016, la información no está disponible. For 2015-2016, the information is not available.
Fuente: Departamento de Agricultura, Oficina de Estadísticas Agrícolas. Source: Department of Agriculture, Office of Agricultural Statistics.

A-27 JUNTA DE PLANIFICACIÓN / PLANNING BOARD
APÉNDICE ESTADÍSTICO • STATISTICAL APPENDIXINFORME ECONÓMICO AL GOBERNADOR 2016 • ECONOMIC REPORT TO THE GOVERNOR 2016
INGRESO BRUTO AGRICOLAGROSS FARM INCOME
792.1
829.2
782.4
715.8
832.7
929.7
700.0
740.0
780.0
820.0
860.0
900.0
940.0
2009 2010 2011 2012r 2013r 2014p
Mill
ones
de
dóla
res
Mill
ions
of d
olla
rs
Años fiscales- Fiscal years
Fuente: Departamento de Agricultura, Oficina de Estadísticas Agrícolas Source: Department of Agriculture, Office of Agriculture Statistics.
r- Cifras revisadas. p- Cifras preliminares. La información para el 2015-2016 no está disponible.r- Revised figures. p- Preliminary figures. The information for 2015-2016 is not available.

A-28 JUNTA DE PLANIFICACIÓN / PLANNING BOARD
APÉNDICE ESTADÍSTICO • STATISTICAL APPENDIXINFORME ECONÓMICO AL GOBERNADOR 2016 • ECONOMIC REPORT TO THE GOVERNOR 2016
TABLA 14 - RELACIÓN ENTRE EL PRODUCTO BRUTO, EL INGRESO NETO Y EL INGRESO PERSONAL: AÑOS FISCALES TABLE 14 - RELATION BETWEEN GROSS PRODUCT, NET INCOME, AND PERSONAL INCOME: FISCAL YEARS (En millones de dólares - In millions of dollars)
2007 2008 2009 2010 2011 2012 2013 2014r 2015r 2016p
PRODUCTO BRUTO 60,642.7 62,703.1 63,617.9 64,294.6 65,720.7 68,085.7 68,944.9 68,797.5 69,570.2 70,134.5 GROSS PRODUCT
Menos: Depreciación 6,268.5 6,618.4 6,819.5 7,205.1 7,231.3 7,103.6 6,906.4 7,161.3 7,291.3 6,982.5 Less: Depreciation
Igual a: Producto neto 54,374.2 56,084.7 56,798.4 57,089.5 58,489.4 60,982.1 62,038.5 61,636.2 62,278.9 63,152.0 Equals: Net product
Más: Subsidios 773.0 626.2 690.3 757.8 767.9 759.8 711.3 738.6 801.9 808.1 Plus: Subsidies
Menos: Contribuciones indirectas 4,616.1 4,691.5 4,641.3 4,913.5 5,093.0 5,059.9 4,983.4 5,204.1 5,332.6 6,453.1 Less: Indirect business taxes Transferencias de empresas 1,741.0 2,301.1 2,381.0 2,982.3 2,567.8 1,897.7 1,971.1 1,556.7 1,728.5 1,469.8 Business transfers Discrepancia estadística (464.2) (312.3) 480.0 (294.4) 558.9 577.3 405.0 235.3 350.1 580.2 Statistical discrepancy
IGUAL A: INGRESO NETO 49,254.4 50,030.6 49,986.4 50,245.8 51,037.6 54,207.0 55,390.4 55,378.6 55,669.6 55,457.1 EQUALS: NET INCOME
Menos: Aportaciones a sistemas de Less: Contributions for social seguridad social 5,295.3 5,233.4 5,381.0 5,240.4 4,954.2 5,256.0 5,286.9 5,371.2 5,275.7 5,377.8 insurance Empleados 2,221.2 2,167.5 2,233.0 2,207.6 1,951.7 2,155.3 2,150.9 2,236.8 2,190.6 2,163.4 Employees Patronos 3,074.1 3,066.0 3,147.9 3,032.8 3,002.4 3,100.6 3,136.0 3,134.4 3,085.1 3,214.4 Employers Ganancias sin distribuir Undistributed corporate de corporaciones 6,430.2 7,351.4 7,951.5 8,985.2 9,002.1 11,044.0 11,692.2 11,491.7 12,153.0 11,597.8 profits Contribución sobre ingresos Corporate income de corporaciones 2,002.7 1,565.5 1,375.6 1,682.3 1,677.3 1,460.4 1,286.5 1,914.3 1,843.5 1,663.6 tax Ganancias de empresas Profits of public públicas (108.2) (554.8) (748.6) (751.4) (962.4) (1,186.8) (1,200.2) (983.2) (1,213.5) (1,253.7) enterprises Interés recibido por el Interest received by gobierno (1) 397.2 300.3 108.9 206.7 270.2 461.6 136.8 357.1 171.6 130.4 government (1)
IGUAL A: INGRESO NETO QUE EQUALS: NET INCOME THAT AFLUYE A LAS PERSONAS 35,237.1 36,134.7 35,918.0 34,882.6 36,096.2 37,172.0 38,188.2 37,227.5 37,439.3 37,941.1 FLOWS TO PERSONS
Más: Pagos de transferencia 16,270.3 19,236.8 20,970.1 23,331.6 23,584.1 23,434.5 24,186.8 24,079.1 24,382.2 24,224.3 Plus: Transfer payments Gobierno 13,919.3 16,344.0 18,095.5 19,855.8 20,566.5 21,123.6 21,797.8 22,095.9 22,210.4 22,293.5 Government
Central y municipios 3,569.5 4,040.6 4,471.7 4,866.7 5,190.1 5,281.3 5,468.2 5,741.5 5,778.0 5,719.4 Central and municipios Federal 10,327.1 12,279.3 13,598.8 14,959.6 15,352.3 15,822.0 16,299.7 16,324.1 16,399.0 16,540.2 Federal Estatales de E.E.U.U. 22.7 24.1 25.0 29.4 24.1 20.2 29.9 30.3 33.5 33.9 U.S. state governments Empresas 1,741.0 2,301.1 2,381.0 2,982.3 2,567.8 1,897.7 1,971.1 1,556.7 1,728.5 1,469.8 Business Remesas personales 578.3 568.0 468.4 432.3 379.1 390.8 402.4 411.5 427.6 444.3 Private remittances Otros no residentes 31.7 23.7 25.2 61.3 70.8 22.4 15.6 15.0 15.7 16.7 Other nonresidents Interés pagado 1,725.3 1,790.5 2,143.0 1,769.0 1,498.4 1,620.6 1,784.7 1,809.1 2,032.9 1,712.0 Interest paid Gobierno (1) 47.7 (44.3) 271.0 205.4 11.8 32.4 352.0 512.6 508.9 497.2 Government (1) Personas 1,677.6 1,834.8 1,872.0 1,563.6 1,486.6 1,588.3 1,432.8 1,296.5 1,524.0 1,214.9 Persons
IGUAL A: INGRESO PERSONAL 53,232.7 57,161.9 59,031.2 59,983.2 61,178.7 62,227.1 64,159.7 63,115.7 63,854.4 63,877.5 EQUALS: PERSONAL INCOME
r- Cifras revisadas. r- Revised figures. p- Cifras preliminares.( ) Cifras negativas. ( ) Negative figures.(1) Incluye el gobierno central y los municipios. (1) Includes central government and municipios.
Fuente: Junta de Planificación, Programa de Planificación Económica Source: Puerto Rico Planning Board, Program of Economic and Social Planning, y Social, Subprograma de Análisis Económico. Subprogram of Economic Analysis.
p- Preliminary figures.

A-29 JUNTA DE PLANIFICACIÓN / PLANNING BOARD
APÉNDICE ESTADÍSTICO • STATISTICAL APPENDIXINFORME ECONÓMICO AL GOBERNADOR 2016 • ECONOMIC REPORT TO THE GOVERNOR 2016
RELACIÓN ENTRE PRODUCTO BRUTO, INGRESO NETO E INGRESO PERSONALRELATION BETWEEN GROSS PRODUCT, NET INCOME AND PERSONAL INCOME
65,720.768,085.7 68,944.9 68,797.5 69,570.2 70,134.5
51,037.654,207.0 55,390.4 55,378.6 55,669.6 55,457.1
61,178.7 62,227.164,159.7 63,115.7 63,854.4 63,877.5
45,000.0
50,000.0
55,000.0
60,000.0
65,000.0
70,000.0
75,000.0
2011 2012 2013 2014r 2015r 2016p
Mill
ones
de
dóla
res
Mill
ions
of d
olla
rs
Años fiscales- Fiscal years
PRODUCTO BRUTO: GROSS PRODUCTINGRESO L NETO: NET INCOMEINGRESO PERSONAL: PERSONAL INCOME
r- Cifras revisadas. p- Cifras preliminares.r- Revised figures. p- Preliminary figures.
Fuente: Junta de Planificación, Programa de Planificación Económica y Social, Subprograma de Análisis Económico. Source: Puerto Rico Planning Board, Program of Economic and Social Planning, Subprogram of Economic Analysis.

A-30 JUNTA DE PLANIFICACIÓN / PLANNING BOARD
APÉNDICE ESTADÍSTICO • STATISTICAL APPENDIXINFORME ECONÓMICO AL GOBERNADOR 2016 • ECONOMIC REPORT TO THE GOVERNOR 2016
TABLA 15 - INGRESO PERSONAL: AÑOS FISCALES TABLE 15 - PERSONAL INCOME: FISCAL YEARS (En millones de dólares - In millions of dollars)
2007 2008 2009 2010 2011 2012 2013 2014r 2015r 2016p
INGRESO PERSONAL 53,232.7 57,161.9 59,031.2 59,983.2 61,178.7 62,227.1 64,159.7 63,115.7 63,854.4 63,877.5 PERSONAL INCOME
Compensación a empleados 30,234.2 30,868.8 30,676.9 29,870.4 29,290.0 29,671.2 29,841.1 29,349.3 28,861.8 28,839.6 Employees' compensation
Empresas, Personas e instituciones sin fines de lucro 20,703.0 21,107.1 20,505.3 20,363.3 19,922.3 20,193.1 20,401.7 20,378.1 20,393.9 20,252.6 Business, household and nonprofit institutions Gobierno 8,584.9 8,762.2 9,047.4 8,349.9 8,215.9 8,277.7 8,237.5 7,825.1 7,268.0 7,353.8 Government Resto del mundo 946.4 999.4 1,124.2 1,157.2 1,151.7 1,200.3 1,201.9 1,146.0 1,200.0 1,233.3 Rest of the world
Menos: Aportaciones a sistemas de Less: Contributions for social seguridad social 5,295.3 5,233.4 5,381.0 5,240.4 4,954.2 5,256.0 5,286.9 5,371.2 5,275.7 5,377.8 insurance
Empleados 2,221.2 2,167.5 2,233.0 2,207.6 1,951.7 2,155.3 2,150.9 2,236.8 2,190.6 2,163.4 Employees Patronos 3,074.1 3,066.0 3,147.9 3,032.8 3,002.4 3,100.6 3,136.0 3,134.4 3,085.1 3,214.4 Employers
Ingresos procedentes de la propiedad 12,023.5 12,289.8 12,765.1 12,021.6 13,258.8 14,377.4 15,418.7 15,058.5 15,886.0 16,191.4 Proprietors' income
Ganancia de empresas no Profit of unincorporated incorporadas 2,219.8 2,334.2 2,400.0 2,371.5 2,421.3 2,516.7 2,805.5 2,912.2 3,127.9 3,298.5 enterprises Dividendos de corporaciones Dividends of domestic locales 322.1 351.9 355.6 272.0 259.7 249.5 239.3 224.9 223.5 232.0 corporations Ingresos misceláneos y dividendos Miscellaneous income and recibidos del exterior 9.9 17.1 7.8 6.1 7.3 5.7 5.7 7.0 6.9 7.4 dividends received from abroad Ganancia de personas por Rental income of arrendamiento 6,648.6 6,863.2 7,518.1 7,460.3 8,552.0 9,672.0 9,668.3 9,490.3 9,141.4 9,283.8 persons Intereses recibidos por personas 2,823.1 2,723.3 2,483.7 1,911.7 2,018.4 1,933.5 2,699.9 2,424.0 3,386.4 3,369.7 Personal interest income
Pagos de transferencia 16,270.3 19,236.8 20,970.1 23,331.6 23,584.1 23,434.5 24,186.8 24,079.1 24,382.2 24,224.3 Transfer payments
Gobierno central y municipios 3,569.5 4,040.6 4,471.7 4,866.7 5,190.1 5,281.3 5,468.2 5,741.5 5,778.0 5,719.4 Central government and municipios Gobierno federal 10,327.1 12,279.3 13,598.8 14,959.6 15,352.3 15,822.0 16,299.7 16,324.1 16,399.0 16,540.2 Federal government Gobiernos estatales de E.E.U.U. 22.7 24.1 25.0 29.4 24.1 20.2 29.9 30.3 33.5 33.9 U.S. state governments Empresas 1,741.0 2,301.1 2,381.0 2,982.3 2,567.8 1,897.7 1,971.1 1,556.7 1,728.5 1,469.8 Business Otros no residentes 610.0 591.7 493.6 493.6 449.9 413.2 417.9 426.5 443.3 461.1 Other nonresidents
r - Cifras revisadas r - Revised figures p- Cifras preliminares p- Preliminary figures
Fuente: Junta de Planificación, Programa de Planificación Económica y Social, Source: Puerto Rico Planning Board, Program of Economic and Social Planning, Subprograma de Análisis Económico. Subprogram of Economic Analysis.

A-31 JUNTA DE PLANIFICACIÓN / PLANNING BOARD
APÉNDICE ESTADÍSTICO • STATISTICAL APPENDIXINFORME ECONÓMICO AL GOBERNADOR 2016 • ECONOMIC REPORT TO THE GOVERNOR 2016
INGRESO PERSONALPERSONAL INCOME
23,5
84.1
23,4
34.5
24,1
86.8
24,0
79.1
24,3
82.2
24,2
24.3
13,2
58.8
14,3
77.4
15,4
18.7
15,0
58.5
15,8
86.0
16,1
91.4
29,2
90.0
29,6
71.2
29,8
41.1
29,3
49.3
28,8
61.8
28,8
39.6
2,000.0
7,000.0
12,000.0
17,000.0
22,000.0
27,000.0
32,000.0
2011 2012 2013 2014r 2015r 2016p
Mill
ones
de
dóla
res
Mill
ions
of d
olla
rs
Años fiscales- Fiscal years
PAGOS DE TRANSFERENCIA: TRANSFERPAYMENTS
INGRESOS PROCEDENTES DE LA PROPIEDAD:PROPRIETORS' INCOME
COMPENSACION NETA A EMPLEADOS:EMPLOYEES' COMPENSATION, NET
r- Cifras revisadas. p- Cifras preliminares.r- Revised figures. p- Preliminary figures.
Fuente: Junta de Planificación, Programa de Planificación Económica y Social, Subprograma de Análisis Económico. Source: Puerto Rico Planning Board, Program of Economic and Social Planning, Subprogram of Economic Analysis.

A-32 JUNTA DE PLANIFICACIÓN / PLANNING BOARD
APÉNDICE ESTADÍSTICO • STATISTICAL APPENDIXINFORME ECONÓMICO AL GOBERNADOR 2016 • ECONOMIC REPORT TO THE GOVERNOR 2016
TABLA 16 - ACTIVOS FINANCIEROS DE LAS PERSONAS: AÑOS FISCALESTABLE 16 - PERSONAL FINANCIAL ASSETS: FISCAL YEARS(En millones de dólares - In millions of dollars)
2007 2008 2009 2010 2011 2012 2013 2014r 2015r 2016p
ACTIVOS FINANCIEROS, TOTAL 49,328.5 52,629.4 53,166.1 46,593.3 46,385.3 46,567.6 45,266.7 45,314.5 46,016.7 46,895.9 FINANCIAL ASSETS, TOTAL
Depósitos en bancos comerciales (1) 29,706.7 32,474.2 32,672.4 25,027.1 23,990.0 22,943.9 22,022.8 20,789.5 20,643.0 21,426.5 Deposits in commercial banks (1)
Ahorro en bancos federales de ahorro (2) 0.0 0.0 0.0 0.0 0.0 0.0 0.0 0.0 0.0 0.0 Saving in federal saving banks (2)
Ahorros en la Asociación de Savings in the Puerto Rico Empleados del Estado Libre Asociado 1,739.0 1,837.0 1,953.0 2,005.0 1,997.9 2,067.1 2,101.2 2,041.4 2,116.7 2,211.2 Commonwealth Employees' Association
Ahorros en cooperativas locales 6,418.8 6,689.1 6,988.0 7,415.9 7,721.4 8,083.9 8,335.2 8,442.8 8,620.7 8,489.0 Savings in local cooperatives
Ahorros en cooperativas federales 385.6 409.6 436.2 452.4 461.0 498.5 529.0 562.7 619.9 645.8 Savings in federal cooperatives
Reservas en fondos públicos de Reserves in public pension pensiones 9,926.1 10,063.9 9,961.6 10,540.2 10,664.0 11,475.1 10,841.4 12,100.5 12,695.8 12,857.6 funds
Reservas en compañías de seguros de vida 1,152.3 1,155.6 1,154.9 1,152.7 1,551.0 1,499.1 1,437.1 1,377.6 1,320.6 1,265.9 Reserves in life insurance companies
r- Cifras revisadas. r- Revised figures. p- Cifras preliminares. p- Preliminary figures.(1) Desde 1983 se incluyen depósitos en compañías de fideicomiso con poderes de banco. (1) Since 1983 deposits in trust companies with banking powers have been included.(2) Desde 1995 se incluyen sólo dos bancos federales de ahorro. Estos pasaron a ser (2) Since 1995 only two federal saving banks are included. They became bancos comerciales en 1999. commercial banks in 1999.
Fuente: Junta de Planificación, Programa de Planificación Económica y Social, Source: Puerto Rico Planning Board, Program of Economic and Social Planning, Subprograma de Análisis Económico. Subprogram of Economic Analysis.

A-33 JUNTA DE PLANIFICACIÓN / PLANNING BOARD
APÉNDICE ESTADÍSTICO • STATISTICAL APPENDIXINFORME ECONÓMICO AL GOBERNADOR 2016 • ECONOMIC REPORT TO THE GOVERNOR 2016
Depósitos en bancos comerciales: Deposits in commercial banks
45.7%
Ahorros en la Asociación de
Empleados del Estado Libre Asociado:
Savings in the Puerto Rico Commonwealth
Employees' Association4.7%
Ahorros en cooperativas locales:
Savings in local cooperatives
18.1%
Ahorros en cooperativas federales:
Savings in federal cooperatives
1.4%
Reservas en fondos públicos de pensiones:
Reserves in public pension funds
27.4%
Reservas en compañías de seguros de vida:
Reserves in life insurance companies
2.7%
ACTIVOS FINANCIEROS DE LAS PERSONAS: AÑO FISCAL 2016pPERSONAL FINANCIAL ASSETS: FISCAL YEAR 2016p
(Porciento - Percentage)
Fuente: Junta de Planificación, Programa de Planificación Económica y Social, Subprograma de Análisis Económico. Source: Puerto Rico Planning Board, Program of Economic and Social Planning, Subprogram of Economic Analysis.
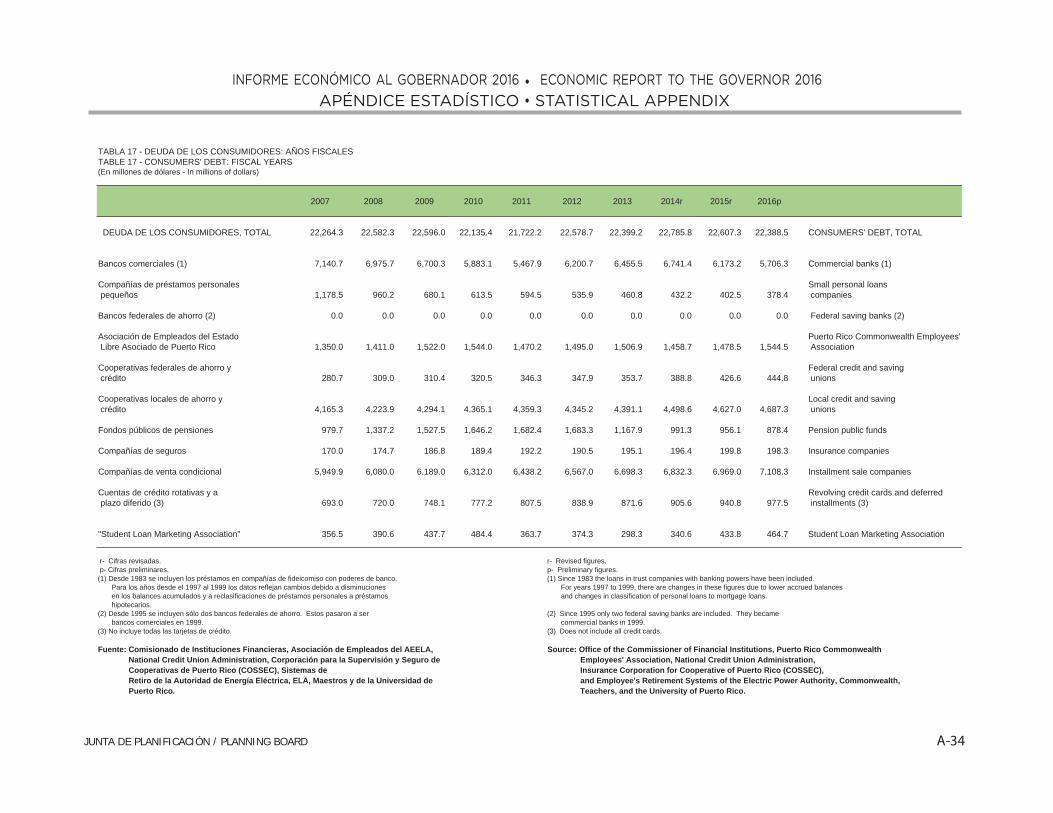
A-34 JUNTA DE PLANIFICACIÓN / PLANNING BOARD
APÉNDICE ESTADÍSTICO • STATISTICAL APPENDIXINFORME ECONÓMICO AL GOBERNADOR 2016 • ECONOMIC REPORT TO THE GOVERNOR 2016
TABLA 17 - DEUDA DE LOS CONSUMIDORES: AÑOS FISCALESTABLE 17 - CONSUMERS' DEBT: FISCAL YEARS(En millones de dólares - In millions of dollars)
2007 2008 2009 2010 2011 2012 2013 2014r 2015r 2016p
DEUDA DE LOS CONSUMIDORES, TOTAL 22,264.3 22,582.3 22,596.0 22,135.4 21,722.2 22,578.7 22,399.2 22,785.8 22,607.3 22,388.5 CONSUMERS' DEBT, TOTAL
Bancos comerciales (1) 7,140.7 6,975.7 6,700.3 5,883.1 5,467.9 6,200.7 6,455.5 6,741.4 6,173.2 5,706.3 Commercial banks (1)
Compañías de préstamos personales Small personal loans pequeños 1,178.5 960.2 680.1 613.5 594.5 535.9 460.8 432.2 402.5 378.4 companies
Bancos federales de ahorro (2) 0.0 0.0 0.0 0.0 0.0 0.0 0.0 0.0 0.0 0.0 Federal saving banks (2)
Asociación de Empleados del Estado Puerto Rico Commonwealth Employees' Libre Asociado de Puerto Rico 1,350.0 1,411.0 1,522.0 1,544.0 1,470.2 1,495.0 1,506.9 1,458.7 1,478.5 1,544.5 Association
Cooperativas federales de ahorro y Federal credit and saving crédito 280.7 309.0 310.4 320.5 346.3 347.9 353.7 388.8 426.6 444.8 unions
Cooperativas locales de ahorro y Local credit and saving crédito 4,165.3 4,223.9 4,294.1 4,365.1 4,359.3 4,345.2 4,391.1 4,498.6 4,627.0 4,687.3 unions
Fondos públicos de pensiones 979.7 1,337.2 1,527.5 1,646.2 1,682.4 1,683.3 1,167.9 991.3 956.1 878.4 Pension public funds
Compañías de seguros 170.0 174.7 186.8 189.4 192.2 190.5 195.1 196.4 199.8 198.3 Insurance companies
Compañías de venta condicional 5,949.9 6,080.0 6,189.0 6,312.0 6,438.2 6,567.0 6,698.3 6,832.3 6,969.0 7,108.3 Installment sale companies
Cuentas de crédito rotativas y a Revolving credit cards and deferred plazo diferido (3) 693.0 720.0 748.1 777.2 807.5 838.9 871.6 905.6 940.8 977.5 installments (3)
"Student Loan Marketing Association" 356.5 390.6 437.7 484.4 363.7 374.3 298.3 340.6 433.8 464.7 Student Loan Marketing Association
r- Cifras revisadas. r- Revised figures. p- Cifras preliminares. p- Preliminary figures.(1) Desde 1983 se incluyen los préstamos en compañías de fideicomiso con poderes de banco. (1) Since 1983 the loans in trust companies with banking powers have been included. Para los años desde el 1997 al 1999 los datos reflejan cambios debido a disminuciones For years 1997 to 1999, there are changes in these figures due to lower accrued balances en los balances acumulados y a reclasificaciones de préstamos personales a préstamos and changes in classification of personal loans to mortgage loans. hipotecarios.(2) Desde 1995 se incluyen sólo dos bancos federales de ahorro. Estos pasaron a ser (2) Since 1995 only two federal saving banks are included. They became bancos comerciales en 1999. commercial banks in 1999.(3) No incluye todas las tarjetas de crédito. (3) Does not include all credit cards.
Fuente: Comisionado de Instituciones Financieras, Asociación de Empleados del AEELA, Source: Office of the Commissioner of Financial Institutions, Puerto Rico Commonwealth National Credit Union Administration, Corporación para la Supervisión y Seguro de Employees' Association, National Credit Union Administration, Cooperativas de Puerto Rico (COSSEC), Sistemas de Insurance Corporation for Cooperative of Puerto Rico (COSSEC), Retiro de la Autoridad de Energía Eléctrica, ELA, Maestros y de la Universidad de and Employee's Retirement Systems of the Electric Power Authority, Commonwealth, Puerto Rico. Teachers, and the University of Puerto Rico.

A-35 JUNTA DE PLANIFICACIÓN / PLANNING BOARD
APÉNDICE ESTADÍSTICO • STATISTICAL APPENDIXINFORME ECONÓMICO AL GOBERNADOR 2016 • ECONOMIC REPORT TO THE GOVERNOR 2016
RELACIÓN ENTRE ACTIVOS Y DEUDA DE LOS CONSUMIDORESRATIO BETWEEN CONSUMERS’ ASSETS AND DEBT
2.14
2.062.00 1.99
2.04
2.14
1.80
1.90
2.00
2.10
2.20
2.30
2.40
2011 2012 2013 2014r 2015r 2016p
Mill
ones
de
dóla
res
Mill
ions
of d
olla
rs
Años fiscales- Fiscal years
Source: Office of the Commissioner of Financial Institutions, Puerto Rico Commonwealth Employees' Association, National Credit Union Administration, Insurance Corporation for Cooperative of Puerto Rico (COSSEC),
and Employee's Retirement Systems of the Electric Power Authority, Commonwealth, Teachers, and the University of Puerto Rico.
Fuente: Comisionado de Instituciones Financieras, Asociación de Empleados del AEELA, National redit Union Administration, Corporación para la Supervisión y Seguro de Cooperativas de Puerto Rico (COSSEC), Sistemas de Retiro de la Autoridad de Energía Eléctrica, ELA, Maestros y de la Universidad de Puerto Rico.
r- Cifras revisadas. p- Cifras preliminares.r- Revised figures. p- Preliminary figures.

A-36 JUNTA DE PLANIFICACIÓN / PLANNING BOARD
APÉNDICE ESTADÍSTICO • STATISTICAL APPENDIXINFORME ECONÓMICO AL GOBERNADOR 2016 • ECONOMIC REPORT TO THE GOVERNOR 2016
TABLA 18 - BALANZA DE PAGOS: AÑOS FISCALES TABLE 18 - BALANCE OF PAYMENTS: FISCAL YEARS (En millones de dólares - In millions of dollars)
2007 2008 2009 2010 2011 2012 2013 2014r 2015r 2016p
Ventas de artículos y servicios 72,567.8 76,266.1 73,839.2 73,965.4 76,218.5 74,487.8 74,486.9 74,285.5 77,839.8 80,425.7 Sales of goods and services Mercancía ajustada 64,203.2 67,551.0 66,474.9 67,213.2 69,891.8 67,993.9 68,001.0 67,758.1 70,899.9 73,199.0 Merchandise, adjusted Transportación 523.3 540.5 470.2 438.6 433.6 455.9 445.3 449.9 487.6 485.7 Transportation Gastos de visitantes 3,413.9 3,535.0 3,175.8 3,210.7 3,142.8 3,192.9 3,310.6 3,438.6 3,825.0 3,984.8 Visitors' expenditures Rendimientos de capital 1,670.8 1,768.0 1,158.4 792.5 570.1 507.1 486.3 420.6 353.4 380.7 Income on investments Gastos netos de funcionamiento de las Net operating expenditures of agencias federales en Puerto Rico 972.9 1,242.2 1,412.5 1,480.9 1,408.0 1,694.6 1,697.4 1,629.3 1,704.6 1,749.6 federal agencies in Puerto Rico Servicios misceláneos 1,783.8 1,629.5 1,147.4 829.4 772.2 643.4 546.3 589.0 569.2 626.0 Miscellaneous services
Compras de artículos y servicios 86,511.9 90,008.5 86,499.0 86,308.6 89,264.2 88,589.8 88,371.8 87,579.8 87,789.7 89,228.4 Purchases of goods and services Mercancía ajustada 50,055.6 51,006.3 47,087.3 46,200.2 48,910.0 49,400.0 49,180.0 48,473.1 48,800.0 48,859.7 Merchandise, adjusted Transportación 2,541.5 2,481.0 2,156.4 2,015.9 2,063.4 2,106.0 2,047.2 2,001.8 1,970.6 2,003.8 Transportation Gastos de viaje 1,192.4 1,213.3 919.1 808.9 815.8 787.0 781.9 763.2 744.0 758.7 Travel expenditures Rendimientos de capital 31,498.6 33,703.7 35,050.3 36,036.5 36,352.8 35,186.5 35,193.3 35,214.9 35,126.8 36,513.9 Income on investments Servicios misceláneos 1,223.9 1,604.2 1,285.9 1,247.2 1,122.3 1,110.3 1,169.4 1,126.9 1,148.4 1,092.3 Miscellaneous services
Saldo de las transacciones en Balance on goods and services artículos y servicios (13,944.1) (13,742.4) (12,659.8) (12,343.3) (13,045.8) (14,102.1) (13,885.0) (13,294.4) (9,949.9) (8,802.7) transactions
Interés neto del Gobierno central del E.L.A. y Net interest of the Commonwealth central los municipios (407.0) (498.3) (115.2) (198.9) (250.1) (335.9) 15.9 (90.7) (2.5) (87.1) government and municipios
Transferencias unilaterales, netas 11,427.0 13,513.3 15,323.3 17,742.0 18,868.9 17,997.6 18,672.9 17,732.1 17,457.7 17,528.2 Unilateral transfers, net Remesas privadas 477.9 458.0 364.5 337.4 287.5 300.3 313.0 323.8 338.9 354.3 Private remittances Gobierno federal 9,828.8 11,994.6 13,884.3 16,703.7 17,851.0 16,825.3 17,312.1 16,487.9 16,333.7 16,374.8 Federal government Gobierno del E.L.A. 2,612.2 2,724.9 3,225.1 4,704.7 5,240.8 3,985.6 3,998.4 3,298.0 3,090.2 2,989.6 Commonwealth government Individuos y otros 7,216.6 9,269.8 10,659.2 11,999.0 12,610.1 12,839.7 13,313.7 13,189.9 13,243.6 13,385.2 Individuals and others Gobiernos estatales de E.E.U.U. 19.7 20.9 21.5 25.9 20.2 15.9 27.0 27.3 31.2 31.1 U.S. state governments Otros no residentes 1,100.6 1,039.7 1,053.2 675.1 710.3 856.0 1,020.8 893.1 753.8 768.0 Other nonresidents
Balance en artículos y servicios, intereses Balance on goods and services, interest del Gobierno central del E.L.A. y los municipios of the Commonwealth central governmenty transferencias unilaterales (2,924.1) (727.5) 2,548.3 5,199.9 5,573.1 3,559.6 4,803.8 4,347.1 7,505.3 8,638.5 and municipios, and unilateral transfers
Movimientos netos de capital, total 5,119.7 7,030.1 7,539.1 7,155.6 7,650.6 (2,425.2) (5,154.3) (9,325.7) (3,608.2) 176.4 Net capital movements, total Aumento neto (+) o disminución neta (-) en Net increase (+) or net decrease (-) in las inversiones del exterior en Puerto Rico 1,539.4 9,391.9 5,563.2 2,816.3 5,177.2 (4,047.3) (9,368.0) (8,621.1) (4,722.2) (311.5) external investments in Puerto Rico A largo plazo (1) 4,229.7 13,312.6 9,700.6 5,710.3 9,309.8 (3,749.5) (5,673.6) (6,762.6) (5,880.7) (132.7) Long-term (1) A corto plazo (2,690.3) (3,920.7) (4,137.5) (2,894.0) (4,132.5) (297.8) (3,694.5) (1,858.5) 1,158.5 (178.8) Short-term Aumento neto (-) o disminución neta (+) en Net increase (-) or net decrease (+) in las inversiones de Puerto Rico en el exterior 3,580.3 (2,361.7) 1,975.9 4,339.3 2,473.3 1,622.0 4,213.7 (704.6) 1,114.0 487.9 Puerto Rican investments abroad A largo plazo (601.8) (2,159.1) 1,452.9 1,222.1 (3,881.3) 14.5 2,306.9 716.4 477.5 1,456.9 Long-term A corto plazo 4,182.1 (202.6) 523.1 3,117.2 6,354.6 1,607.6 1,906.9 (1,421.0) 636.6 (969.0) Short-term
Transacciones desconocidas (2,195.6) (6,302.7) (10,087.4) (12,355.4) (13,223.7) (1,134.4) 350.5 4,978.6 (3,897.1) (8,814.9) Unknown transactions
r- Cifras revisadas. r- Revised figures. p- Cifras preliminares. p- Preliminary figures.(1) Desde el año fiscal 1983 no se incluyen las inversiones directas netas. (1) Since 1983, the net direct investments are not included. ( ) Cifras negativas. ( ) Negative figures. Nota: Una cifra positiva indica la creación de un crédito o un ingreso neto percibido del exterior; Note: A positive figure indicates the creation of a credit or net inflow of funds; una cifra negativa indica la creación de un débito o un egreso neto remitido al exterior. a negative figure indicates the creation of a debit or a net outflow of funds.
Fuente: Junta de Planificación, Programa de Planificación Económica y Social, Source: Puerto Rico Planning Board, Program of Economic and Social Planning, Subprograma de Análisis Económico. Subprogram of Economic Analysis.

A-37 JUNTA DE PLANIFICACIÓN / PLANNING BOARD
APÉNDICE ESTADÍSTICO • STATISTICAL APPENDIXINFORME ECONÓMICO AL GOBERNADOR 2016 • ECONOMIC REPORT TO THE GOVERNOR 2016
76,2
18.5
74,4
87.8
74,4
86.9
74,2
85.5
77,8
39.8
80,4
25.789
,264
.2
88,5
89.8
88,3
71.8
87,5
79.8
87,7
89.7
89,2
28.4
55,000
65,000
75,000
85,000
95,000
2011 2012 2013 2014r 2015r 2016p
Mill
ones
de
dóla
res
Mill
ions
of d
olla
rs
Años fiscales- Fiscal years
VENTAS DE ARTÍCULOS Y SERVICIOS :SALES OF GOODS AND SERVICES
COMPRAS DE ARTÍCULOS Y SERVICIOS :PURCHASES OF GOODS AND SERVICES
r- Cifras revisadas. p- Cifras preliminares.r- Revised figures. p- Preliminary figures.
BALANZA DE PAGOSBALANCE OF PAYMENTS
Fuente: Junta de Planificación, Programa de Planificación Económica y Social, Subprograma de Análisis Económico. Source: Puerto Rico Planning Board, Program of Economic and Social Planning, Subprogram of Economic Analysis.

A-38 JUNTA DE PLANIFICACIÓN / PLANNING BOARD
APÉNDICE ESTADÍSTICO • STATISTICAL APPENDIXINFORME ECONÓMICO AL GOBERNADOR 2016 • ECONOMIC REPORT TO THE GOVERNOR 2016
TABLA 19 - NÚMERO Y GASTOS DE VISITANTES EN PUERTO RICO: AÑOS FISCALES TABLE 19 - NUMBER AND EXPENDITURES OF VISITORS IN PUERTO RICO: FISCAL YEARS
2007 2008 2009 2010 2011 2012 2013 2014r 2015r 2016p
NÚMERO DE VISITANTES, TOTAL 5,062.4 5,213.1 4,415.3 4,379.2 4,213.7 4,196.9 4,210.0 4,455.7 5,051.1 5,077.2 NUMBER OF VISITORS, TOTAL (En miles) (In thousands)
Turistas 3,687.0 3,716.2 3,183.3 3,185.6 3,047.9 3,069.1 3,172.0 3,246.0 3,541.8 3,735.7 Tourists En hoteles (1) 1,353.4 1,342.8 1,277.7 1,349.4 1,408.5 1,508.0 1,586.1 1,634.8 1,737.2 1,795.6 In hotels (1) En otros sitios (2) 2,333.6 2,373.4 1,905.5 1,836.2 1,639.4 1,561.1 1,585.9 1,611.2 1,804.5 1,940.2 In other places (2)
Excursionistas (3) 1,375.4 1,496.9 1,232.0 1,193.5 1,165.8 1,127.8 1,038.0 1,209.7 1,509.3 1,341.5 Excursionists (3)
GASTOS DE VISITANTES, TOTAL 3,413.9 3,535.0 3,175.8 3,210.7 3,142.8 3,192.9 3,310.6 3,438.6 3,825.0 3,984.8 VISITORS' EXPENDITURES, TOTAL (En millones de dólares) (In millions of dollars)
Turistas 3,241.7 3,340.6 3,002.1 3,039.4 2,973.5 3,025.2 3,154.6 3,256.4 3,597.3 3,782.4 Tourists En hoteles (1) 1,501.6 1,526.3 1,464.4 1,541.8 1,618.9 1,706.9 1,811.8 1,874.1 2,047.8 2,117.9 In hotels (1) En otros sitios (2) 1,740.1 1,814.3 1,537.7 1,497.6 1,354.5 1,318.3 1,342.9 1,382.3 1,549.5 1,664.5 In other places (2)
Excursionistas (3) 172.2 194.3 173.7 171.4 169.3 167.7 156.0 182.3 227.8 202.4 Excursionists (3)
NÚMERO Y GASTOS DE NUMBER AND EXPENDITURES OF TURISTAS TOURISTS
Estados Unidos United States Número de turistas 2,867.3 2,894.8 2,691.1 2,630.9 2,586.6 2,581.0 2,702.7 2,776.1 3,064.1 3,241.8 Number of tourists Gastos 2,521.9 2,602.8 2,538.2 2,510.0 2,523.2 2,543.8 2,687.8 2,785.4 3,112.4 3,283.2 Expenditures
Países extranjeros Foreign countries Número de turistas 800.3 804.3 479.2 545.9 454.1 481.1 461.1 462.5 472.9 488.4 Number of tourists Gastos 702.7 722.3 451.5 520.9 443.2 474.6 458.6 463.5 479.9 493.6 Expenditures
Islas Vírgenes Virgin Islands Número de turistas 19.4 17.2 13.0 8.8 7.2 6.9 8.2 7.4 4.9 5.5 Number of tourists Gastos 17.1 15.5 12.3 8.4 7.1 6.9 8.2 7.4 5.0 5.6 Expenditures
r- Cifras revisadas. r- Revised figures. p- Cifras preliminares. p- Preliminary figures. (1) Incluye paradores. (1) Includes paradores. (2) Incluye pensiones. (2) Includes guest houses. (3) Visitantes en barcos cruceros y militares en licencia. (3) Visitors on cruise ships and transient military personnel.
Fuente: Junta de Planificación, Programa de Planificación Económica y Social, Source: Puerto Rico Planning Board, Program of Economic and Social Planning, Subprograma de Análisis Económico. Subprogram of Economic Analysis.

A-39 JUNTA DE PLANIFICACIÓN / PLANNING BOARD
APÉNDICE ESTADÍSTICO • STATISTICAL APPENDIXINFORME ECONÓMICO AL GOBERNADOR 2016 • ECONOMIC REPORT TO THE GOVERNOR 2016
NÚMERO Y GASTOS DE VISITANTESNUMBER AND EXPENDITURES OF VISITORS
3,14
2.8
3,19
2.9
3,31
0.6
3,43
8.6
3,82
5.0
3,98
4.8
4,213.7 4,196.9 4,210.04,455.7
5,051.1 5,077.2
2,000.0
2,500.0
3,000.0
3,500.0
4,000.0
4,500.0
5,000.0
5,500.0
2,500.02,700.02,900.03,100.03,300.03,500.03,700.03,900.04,100.0
2011 2012 2013 2014r 2015r 2016p
Mile
s de
vis
itant
es
Thou
sand
s of
vis
itors
Mill
ones
de
dóla
res
Mill
ions
of d
olla
rs
Años fiscales- Fiscal years
GASTOS:EXPENDITURES
NÚMERO:NUMBER
r- Cifras revisadas. p- Cifras preliminares.r- Revised figures. p- Preliminary figures.
Fuente: Junta de Planificación, Programa de Planificación Económica y Social, Subprograma de Análisis Económico. Source: Puerto Rico Planning Board, Program of Economic and Social Planning, Subprogram of Economic Analysis.

A-40 JUNTA DE PLANIFICACIÓN / PLANNING BOARD
APÉNDICE ESTADÍSTICO • STATISTICAL APPENDIXINFORME ECONÓMICO AL GOBERNADOR 2016 • ECONOMIC REPORT TO THE GOVERNOR 2016
TABLA 20 - GASTOS NETOS DE FUNCIONAMIENTO DE LAS AGENCIAS FEDERALES EN PUERTO RICO: AÑOS FISCALES TABLE 20 - NET OPERATING EXPENDITURES OF FEDERAL AGENCIES IN PUERTO RICO: FISCAL YEARS (En millones de dólares - In millions of dollars)
2007 2008 2009 2010 2011 2012 2013 2014r 2015r 2016p
TOTAL 972.9 1,242.2 1,412.5 1,480.9 1,408.0 1,694.6 1,697.4 1,629.3 1,704.6 1,749.6 TOTAL
Agencias para la defensa nacional 439.1 679.8 768.8 767.1 743.0 893.6 895.7 859.8 899.5 923.3 National defense agencies
Departamento de Asuntos del Veterano 375.2 429.8 468.0 513.7 414.5 498.5 499.7 479.6 501.8 515.0 Department of Veterans' Affairs Departamento de la Defensa 63.9 250.0 300.7 253.4 328.5 395.1 396.0 380.2 397.7 408.2 Department of Defense
Otras agencias 533.8 562.4 643.8 713.8 665.0 801.0 801.7 769.5 805.1 826.3 Other agencies
Administración de Pequeños Negocios 2.0 2.7 4.0 2.6 2.4 2.8 2.8 2.7 2.9 2.9 Small Business Administration Administración de Servicios Generales 36.7 37.5 41.0 42.8 35.5 42.7 42.8 41.1 43.0 44.1 General Services Administration Departamento de Agricultura 45.0 47.8 46.6 47.4 41.4 49.7 49.9 47.9 50.1 51.4 Department of Agriculture Departamento de Comercio 4.0 5.8 15.4 16.2 13.4 16.1 16.1 15.5 16.2 16.6 Department of Commerce Departamento de Justicia 91.4 91.0 98.6 105.1 87.1 104.8 105.0 100.8 105.5 108.2 Department of Justice Departamento de lo Interior 10.1 11.2 11.5 12.0 9.9 11.9 12.0 11.5 12.0 12.3 Department of the Interior Departamento de Salud Department of Health y Servicios Humanos 61.3 67.6 69.2 72.4 60.0 72.2 72.3 69.4 72.6 74.6 and Human Services Departamento de Seguridad Nacional 60.6 86.9 71.6 126.9 183.0 220.1 220.6 211.7 221.5 227.4 Departament of Homeland Security Departamento del Tesoro (1) 52.5 38.6 43.8 48.6 40.8 49.1 49.2 47.3 49.5 50.8 Department of the Treasury (1) Departamento del Trabajo (2.1) (2.3) (2.4) (2.5) (2.1) (2.5) (2.5) (2.4) (2.5) (2.6) Department of Labor Departamento de Transportación (1) 29.9 33.0 33.8 35.3 29.3 35.2 35.3 33.9 35.4 36.4 Department of Transportation (1) Departamento de Vivienda y Desarrollo Department of Housing and Urban Urbano 7.4 8.2 8.4 8.7 7.2 8.7 8.7 8.4 8.8 9.0 Development Servicio Postal 108.7 106.8 132.4 119.0 88.3 106.2 106.5 102.2 106.9 109.8 Postal Service Otras agencias 26.4 27.7 69.9 79.2 68.8 84.0 82.9 79.6 83.2 85.4 Other agencies
r- Cifras revisadas. r- Revised figures. p- Cifras preliminares. p- Preliminary figures.(1) A partir del año fiscal 2004, ciertos programas incluidos previamente en esta agencia (1) From fiscal year 2004 on, certain programs included previously in this agency han sido transferidos al Departamento de Seguridad Nacional. have been transferred to the Departament of Homeland Security. Nota: La contribución del gobierno federal a sistemas de seguridad social Note: Federal government contribution to social insurance systems está incluida dentro de los gastos de cada una de las agencias. is included within the expenditures of each of the agencies.
Fuente: Junta de Planificación, Programa de Planificación Económica y Social, Source: Puerto Rico Planning Board, Program of Economic and Social Planning, Subprograma de Análisis Económico. Subprogram of Economic Analysis.
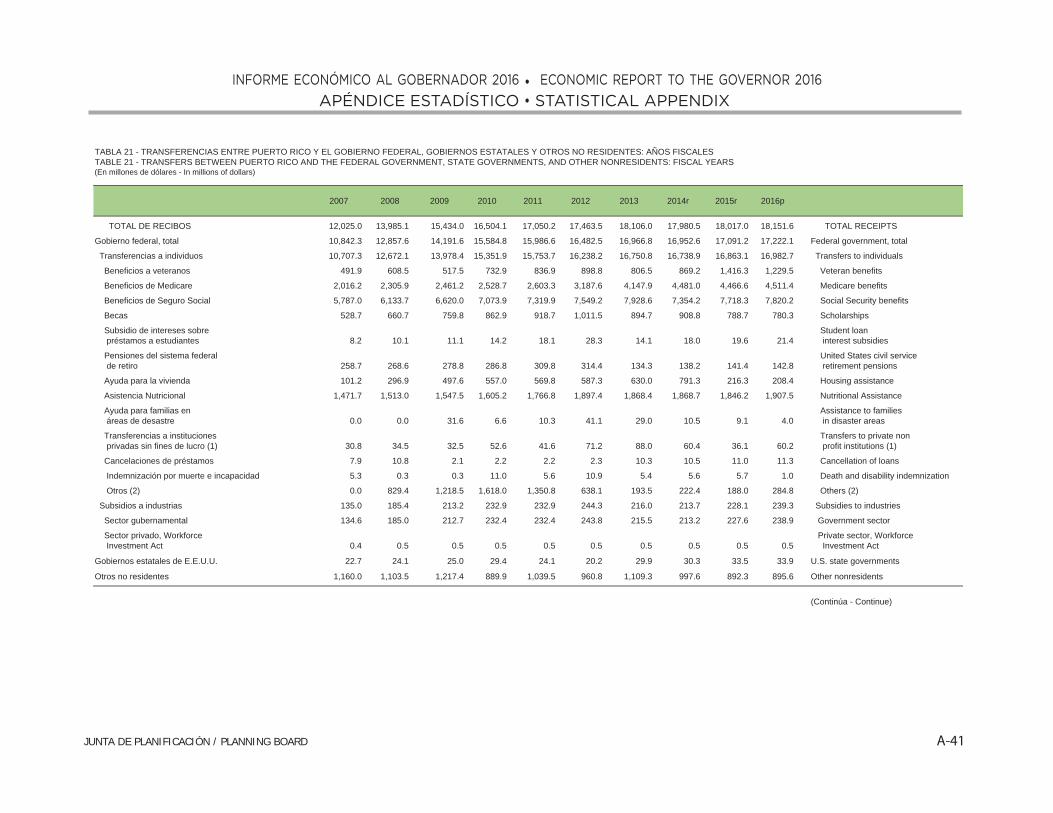
A-41 JUNTA DE PLANIFICACIÓN / PLANNING BOARD
APÉNDICE ESTADÍSTICO • STATISTICAL APPENDIXINFORME ECONÓMICO AL GOBERNADOR 2016 • ECONOMIC REPORT TO THE GOVERNOR 2016
TABLA 21 - TRANSFERENCIAS ENTRE PUERTO RICO Y EL GOBIERNO FEDERAL, GOBIERNOS ESTATALES Y OTROS NO RESIDENTES: AÑOS FISCALESTABLE 21 - TRANSFERS BETWEEN PUERTO RICO AND THE FEDERAL GOVERNMENT, STATE GOVERNMENTS, AND OTHER NONRESIDENTS: FISCAL YEARS(En millones de dólares - In millions of dollars)
2007 2008 2009 2010 2011 2012 2013 2014r 2015r 2016p
TOTAL DE RECIBOS 12,025.0 13,985.1 15,434.0 16,504.1 17,050.2 17,463.5 18,106.0 17,980.5 18,017.0 18,151.6 TOTAL RECEIPTS
Gobierno federal, total 10,842.3 12,857.6 14,191.6 15,584.8 15,986.6 16,482.5 16,966.8 16,952.6 17,091.2 17,222.1 Federal government, total
Transferencias a individuos 10,707.3 12,672.1 13,978.4 15,351.9 15,753.7 16,238.2 16,750.8 16,738.9 16,863.1 16,982.7 Transfers to individuals
Beneficios a veteranos 491.9 608.5 517.5 732.9 836.9 898.8 806.5 869.2 1,416.3 1,229.5 Veteran benefits
Beneficios de Medicare 2,016.2 2,305.9 2,461.2 2,528.7 2,603.3 3,187.6 4,147.9 4,481.0 4,466.6 4,511.4 Medicare benefits
Beneficios de Seguro Social 5,787.0 6,133.7 6,620.0 7,073.9 7,319.9 7,549.2 7,928.6 7,354.2 7,718.3 7,820.2 Social Security benefits
Becas 528.7 660.7 759.8 862.9 918.7 1,011.5 894.7 908.8 788.7 780.3 Scholarships
Subsidio de intereses sobre Student loan préstamos a estudiantes 8.2 10.1 11.1 14.2 18.1 28.3 14.1 18.0 19.6 21.4 interest subsidies
Pensiones del sistema federal United States civil service de retiro 258.7 268.6 278.8 286.8 309.8 314.4 134.3 138.2 141.4 142.8 retirement pensions
Ayuda para la vivienda 101.2 296.9 497.6 557.0 569.8 587.3 630.0 791.3 216.3 208.4 Housing assistance
Asistencia Nutricional 1,471.7 1,513.0 1,547.5 1,605.2 1,766.8 1,897.4 1,868.4 1,868.7 1,846.2 1,907.5 Nutritional Assistance
Ayuda para familias en Assistance to families áreas de desastre 0.0 0.0 31.6 6.6 10.3 41.1 29.0 10.5 9.1 4.0 in disaster areas
Transferencias a instituciones Transfers to private non privadas sin fines de lucro (1) 30.8 34.5 32.5 52.6 41.6 71.2 88.0 60.4 36.1 60.2 profit institutions (1)
Cancelaciones de préstamos 7.9 10.8 2.1 2.2 2.2 2.3 10.3 10.5 11.0 11.3 Cancellation of loans
Indemnización por muerte e incapacidad 5.3 0.3 0.3 11.0 5.6 10.9 5.4 5.6 5.7 1.0 Death and disability indemnization
Otros (2) 0.0 829.4 1,218.5 1,618.0 1,350.8 638.1 193.5 222.4 188.0 284.8 Others (2)
Subsidios a industrias 135.0 185.4 213.2 232.9 232.9 244.3 216.0 213.7 228.1 239.3 Subsidies to industries
Sector gubernamental 134.6 185.0 212.7 232.4 232.4 243.8 215.5 213.2 227.6 238.9 Government sector
Sector privado, Workforce Private sector, Workforce Investment Act 0.4 0.5 0.5 0.5 0.5 0.5 0.5 0.5 0.5 0.5 Investment Act
Gobiernos estatales de E.E.U.U. 22.7 24.1 25.0 29.4 24.1 20.2 29.9 30.3 33.5 33.9 U.S. state governments
Otros no residentes 1,160.0 1,103.5 1,217.4 889.9 1,039.5 960.8 1,109.3 997.6 892.3 895.6 Other nonresidents
(Continúa - Continue)

A-42 JUNTA DE PLANIFICACIÓN / PLANNING BOARD
APÉNDICE ESTADÍSTICO • STATISTICAL APPENDIXINFORME ECONÓMICO AL GOBERNADOR 2016 • ECONOMIC REPORT TO THE GOVERNOR 2016
TABLA 21 - TRANSFERENCIAS ENTRE PUERTO RICO Y EL GOBIERNO FEDERAL, GOBIERNOS ESTATALES Y OTROS NO RESIDENTES: AÑOS FISCALES (CONT.)TABLE 21 - TRANSFERS BETWEEN PUERTO RICO AND THE FEDERAL GOVERNMENT, STATE GOVERNMENTS, AND OTHER NONRESIDENTS: FISCAL YEARS (CONT.)(En millones de dólares - In millions of dollars)
2007 2008 2009 2010 2011 2012 2013 2014r 2015r 2016p
TOTAL DE PAGOS 3,688.1 3,654.7 3,700.2 3,804.2 3,709.6 3,751.9 3,744.6 3,870.2 3,988.3 3,967.2 TOTAL PAYMENTS
Gobierno federal, total 3,625.7 3,587.8 3,532.4 3,585.8 3,376.5 3,642.8 3,653.1 3,762.7 3,847.6 3,836.9 Federal government, total
Transferencias de individuos 1,882.2 1,834.4 1,827.4 1,861.7 1,656.9 1,886.7 1,923.9 1,936.2 1,981.6 1,946.2 Transfers from individuals Derechos por pasaporte 7.0 5.4 4.3 2.7 2.8 2.0 4.0 4.9 3.5 4.0 Passport fees Aportación al Medicare 380.3 392.8 379.6 392.3 401.4 416.1 451.2 414.8 464.1 442.6 Medicare contribution Aportaciones de los empleados a sistemas Employees' contribution to de seguridad social 1,494.9 1,436.2 1,443.5 1,466.7 1,252.7 1,468.6 1,468.7 1,516.4 1,514.0 1,499.6 social security systems Primas al seguro de vida por servicio Premiums on national services nacional 1.7 1.7 1.7 1.7 1.8 1.8 1.8 1.8 1.8 1.8 life insurance Aportación al sistema federal de Contribution to U. S. Civil retiro 74.4 74.3 83.1 100.7 102.9 106.9 68.5 102.0 101.8 104.9 Service retirement fund Aportación al Seguro Social 1,395.8 1,334.9 1,323.2 1,324.8 1,108.6 1,295.1 1,358.0 1,373.3 1,369.2 1,351.3 Contribution to Social Security Aportación al seguro de salud y de vida 23.0 25.3 35.5 39.4 39.4 64.8 40.4 39.3 41.1 41.6 Contribution to life and health insurance
Transferencias de industrias 99.1 103.5 101.4 92.5 105.1 104.8 104.1 127.3 133.2 137.3 Transfers from industries
Aportación al seguro por desempleo 231.0 252.2 200.4 207.3 210.8 211.7 214.4 217.4 247.9 282.6 Unemployment insurance contribution
Aportaciones de los patronos a sistemas de Employers' contribution to seguridad social 1,413.4 1,397.7 1,403.2 1,424.4 1,403.6 1,439.6 1,410.7 1,481.8 1,484.9 1,470.8 social security systems Aportación al sistema federal de Contribution to U. S. Civil retiro 74.4 74.3 83.1 100.7 102.9 106.9 68.5 102.0 101.8 104.9 Service retirement fund Aportación al Seguro Social 1,284.2 1,266.9 1,255.8 1,257.3 1,238.1 1,267.9 1,285.5 1,340.5 1,341.9 1,324.4 Social Security contribution Aportación al seguro de salud y de vida 54.8 56.5 64.3 66.4 62.6 64.8 56.7 39.3 41.1 41.6 Contribution to life and health insurance
Gobiernos estatales de E.E.U.U. 3.0 3.2 3.5 3.6 3.9 4.3 2.9 3.0 2.3 2.8 U.S. state governments
Otros no residentes 59.4 63.8 164.2 214.8 329.2 104.8 88.5 104.5 138.5 127.5 Other nonresidents
Balance neto, total 8,336.9 10,330.4 11,733.8 12,699.9 13,340.6 13,711.6 14,361.5 14,110.3 14,028.6 14,184.3 Net balance, total
Gobierno federal 7,216.6 9,269.8 10,659.2 11,999.0 12,610.1 12,839.7 13,313.7 13,189.9 13,243.6 13,385.2 Federal governmentGobiernos estatales de E.E.U.U. 19.7 20.9 21.5 25.9 20.2 15.9 27.0 27.3 31.2 31.1 U.S. state governmentsOtros no residentes 1,100.6 1,039.7 1,053.2 675.1 710.3 856.0 1,020.8 893.1 753.8 768.0 Other nonresidents
r- Cifras revisadas. r- Revised figures. p- Cifras preliminares. p- Preliminary figures. a/ Menos de $50,000. a/ Less than $50,000.(1) Las transferencias a instituciones privadas sin fines de lucro conceptualmente (1) Conceptually, transfers to private nonprofit institutions are se consideran transferencias a personas . considered transfers to individuals.(2) Ley de Estímulo Económico de 2008, Ley de Recuperación y Reinversión de América (2) Economic Stimulus Act of 2008, American Recovery and Reinvestment Act de 2009 y Fondo de Transición a la Televisión Digital y Seguridad Pública. of 2009, and Digital Television Transition and Public Safety Fund.
Fuente: Junta de Planificación, Programa de Planificación Económica y Social, Source: Puerto Rico Planning Board, Program of Economic and Social Planning, Subprograma de Análisis Económico. Subprogram of Economic Analysis.

A-43 JUNTA DE PLANIFICACIÓN / PLANNING BOARD
APÉNDICE ESTADÍSTICO • STATISTICAL APPENDIXINFORME ECONÓMICO AL GOBERNADOR 2016 • ECONOMIC REPORT TO THE GOVERNOR 2016
TRANSFERENCIAS ENTRE PUERTO RICO Y EL GOBIERNO FEDERAL A INDIVIDUOSTRANSFERS BETWEEN PUERTO RICO AND THE FEDERAL GOVERNMENT TO INDIVIDUALS
1,656.9 1,886.7 1,923.9 1,936.2 1,981.6 1,946.2
15,753.716,238.2 16,750.8 16,738.9 16,863.1 16,982.7
10.5
11.6 11.5 11.6 11.811.5
8.0
10.0
12.0
14.0
0.0
4,000.0
8,000.0
12,000.0
16,000.0
20,000.0
2011 2012 2013 2014r 2015r 2016p
Por c
ient
o -P
erce
ntag
e
Mill
ones
de
dóla
res
Mill
ions
of d
olla
rs
Años fiscales- Fiscal years
TRANSFERENCIAS DE INDIVIDUOS (PAGOS):TRANSFERS FROM INDIVIDUALS (PAYMENTS)
TRANSFERENCIAS A INDIVIDUOS (RECIBOS):TRANSFERS TO INDIVIDUALS (RECEIPTS)
RAZON: RATIOr- Cifras revisadas. p- Cifras preliminares.r- Revised figures. p- Preliminary figures.
Fuente: Junta de Planificación, Programa de Planificación Económica y Social, Subprograma de Análisis Económico. Source: Puerto Rico Planning Board, Program of Economic and Social Planning, Subprogram of Economic Analysis.

A-44 JUNTA DE PLANIFICACIÓN / PLANNING BOARD
APÉNDICE ESTADÍSTICO • STATISTICAL APPENDIXINFORME ECONÓMICO AL GOBERNADOR 2016 • ECONOMIC REPORT TO THE GOVERNOR 2016
TABLA 22 - APORTACIONES FEDERALES AL GOBIERNO DEL E.L.A.: AÑOS FISCALESTABLE 22 - FEDERAL GRANTS TO THE COMMONWEALTH GOVERNMENT: FISCAL YEARS(En millones de dólares - In millions of dollars)
2007 2008 2009 2010 2011 2012 2013 2014r 2015r 2016p
Total 2,612.2 2,724.9 3,225.1 4,704.7 5,240.8 3,985.3 3,998.4 3,298.0 3,090.2 2,989.6 Total
Gobierno central del E.L.A. 1,950.7 2,037.5 2,237.9 2,496.9 2,619.0 2,470.1 2,530.0 2,424.3 2,452.8 2,372.6 Commonwealth central government Autoridad de Carreteras Highway and Transportation y Transportación (1) 203.1 167.9 172.0 142.8 146.2 123.2 183.6 176.9 124.8 127.0 Authority (1) Comisión para la Seguridad en el Tránsito 1.5 2.7 2.9 2.9 0.0 0.0 10.5 8.2 1.7 1.9 Traffic Safety Commission Compañía de Parques Nacionales (2) 0.1 1.9 0.2 0.1 0.0 0.0 b/ b/ b/ 0.0 National Parks Company (2) Departamento de Agricultura 0.9 1.5 1.5 1.5 0.0 0.2 0.8 4.6 0.5 1.1 Department of Agriculture Departamento de Educación 661.2 786.4 757.5 967.3 1,153.9 1,007.7 879.5 876.6 996.6 820.1 Department of Education Departamento de Justicia 26.0 29.1 21.4 3.7 0.0 27.4 6.7 6.4 7.2 5.4 Department of Justice Departamento de la Familia 143.8 151.5 228.6 228.5 252.4 153.7 122.9 117.3 130.9 158.5 Department of the Family Departamento de la Vivienda 2.9 6.8 5.9 2.7 1.2 1.3 b/ 0.2 0.7 0.4 Department of Housing Departamento de Recreación y Deportes 0.0 0.0 0.3 0.5 0.4 6.7 2.0 6.4 2.7 2.7 Department of Recreation and Sports Departamento de Recursos Naturales Department of Natural y Ambientales 10.1 6.4 11.6 8.7 11.4 11.9 9.3 7.7 8.0 5.9 and Environmental Resources Departamento de Salud 679.7 697.5 868.8 674.4 905.8 838.8 814.3 934.9 829.5 827.8 Department of Health Departamento de Transportación Department of Transportation y Obras Públicas 0.2 0.7 0.9 0.2 1.1 1.1 0.6 0.0 0.6 0.3 and Public Works Departamento del Trabajo y Department of Labor and Recursos Humanos 29.2 36.9 32.0 29.8 25.4 54.6 37.9 40.1 21.1 28.1 Human Resources Guardia Nacional de Puerto Rico 20.6 17.2 6.2 15.3 11.3 4.1 3.0 24.9 19.8 33.3 Puerto Rico National Guard Instituto de Cultura Puertorriqueña 0.0 0.0 0.7 1.0 0.0 0.7 0.0 0.0 0.0 0.0 Institute of Puerto Rican Culture Junta de Calidad Ambiental 9.6 9.6 6.6 6.6 0.2 8.4 5.2 7.5 14.9 10.5 Environmental Quality Board Junta de Planificación 0.5 1.4 1.1 0.8 4.0 1.4 5.0 1.2 0.7 1.4 Planning Board Oficina de Asuntos de la Juventud 0.7 2.5 1.1 0.0 0.0 0.0 0.0 b/ 0.0 0.0 Office of Youth Affairs Oficina del Comisionado de Asuntos Office of the Commisioner of Municipal Municipales 1.1 1.1 1.1 1.1 1.1 5.6 0.8 21.9 5.3 3.7 Affairs Oficina de la Defensa Civil 0.0 0.0 b/ b/ b/ b/ b/ b/ b/ b/ Office of Civil Defense Policía de Puerto Rico 12.6 8.3 5.4 13.0 7.6 7.9 2.4 7.1 6.4 7.5 Puerto Rico Police Universidad de Puerto Rico (1) 25.8 32.1 16.4 14.7 16.9 60.2 38.4 39.2 29.7 86.4 University of Puerto Rico (1) Otras agencias (3) 121.1 76.2 95.7 381.1 79.9 155.0 407.2 142.9 251.8 250.6 Other agencies
(Continúa - Continue)
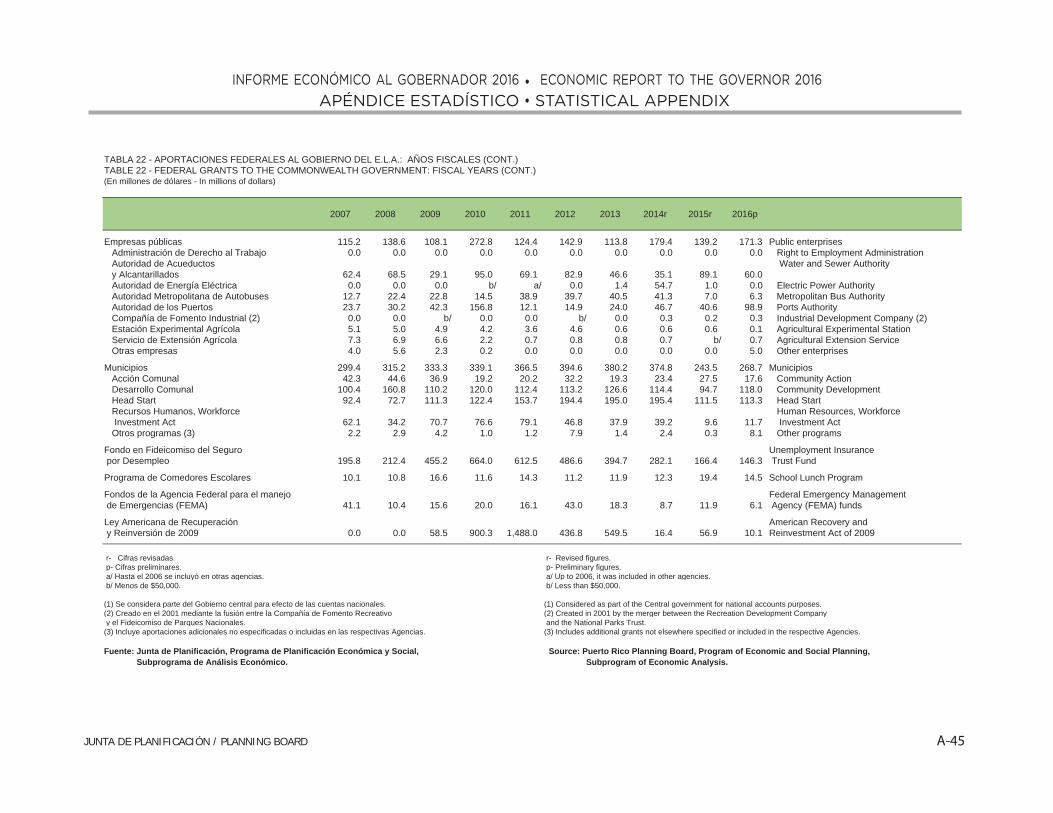
A-45 JUNTA DE PLANIFICACIÓN / PLANNING BOARD
APÉNDICE ESTADÍSTICO • STATISTICAL APPENDIXINFORME ECONÓMICO AL GOBERNADOR 2016 • ECONOMIC REPORT TO THE GOVERNOR 2016
TABLA 22 - APORTACIONES FEDERALES AL GOBIERNO DEL E.L.A.: AÑOS FISCALES (CONT.)TABLE 22 - FEDERAL GRANTS TO THE COMMONWEALTH GOVERNMENT: FISCAL YEARS (CONT.)(En millones de dólares - In millions of dollars)
2007 2008 2009 2010 2011 2012 2013 2014r 2015r 2016p
Empresas públicas 115.2 138.6 108.1 272.8 124.4 142.9 113.8 179.4 139.2 171.3 Public enterprises Administración de Derecho al Trabajo 0.0 0.0 0.0 0.0 0.0 0.0 0.0 0.0 0.0 0.0 Right to Employment Administration Autoridad de Acueductos Water and Sewer Authority y Alcantarillados 62.4 68.5 29.1 95.0 69.1 82.9 46.6 35.1 89.1 60.0 Autoridad de Energía Eléctrica 0.0 0.0 0.0 b/ a/ 0.0 1.4 54.7 1.0 0.0 Electric Power Authority Autoridad Metropolitana de Autobuses 12.7 22.4 22.8 14.5 38.9 39.7 40.5 41.3 7.0 6.3 Metropolitan Bus Authority Autoridad de los Puertos 23.7 30.2 42.3 156.8 12.1 14.9 24.0 46.7 40.6 98.9 Ports Authority Compañía de Fomento Industrial (2) 0.0 0.0 b/ 0.0 0.0 b/ 0.0 0.3 0.2 0.3 Industrial Development Company (2) Estación Experimental Agrícola 5.1 5.0 4.9 4.2 3.6 4.6 0.6 0.6 0.6 0.1 Agricultural Experimental Station Servicio de Extensión Agrícola 7.3 6.9 6.6 2.2 0.7 0.8 0.8 0.7 b/ 0.7 Agricultural Extension Service Otras empresas 4.0 5.6 2.3 0.2 0.0 0.0 0.0 0.0 0.0 5.0 Other enterprises
Municipios 299.4 315.2 333.3 339.1 366.5 394.6 380.2 374.8 243.5 268.7 Municipios Acción Comunal 42.3 44.6 36.9 19.2 20.2 32.2 19.3 23.4 27.5 17.6 Community Action Desarrollo Comunal 100.4 160.8 110.2 120.0 112.4 113.2 126.6 114.4 94.7 118.0 Community Development Head Start 92.4 72.7 111.3 122.4 153.7 194.4 195.0 195.4 111.5 113.3 Head Start Recursos Humanos, Workforce Human Resources, Workforce Investment Act 62.1 34.2 70.7 76.6 79.1 46.8 37.9 39.2 9.6 11.7 Investment Act Otros programas (3) 2.2 2.9 4.2 1.0 1.2 7.9 1.4 2.4 0.3 8.1 Other programs
Fondo en Fideicomiso del Seguro Unemployment Insurance por Desempleo 195.8 212.4 455.2 664.0 612.5 486.6 394.7 282.1 166.4 146.3 Trust Fund
Programa de Comedores Escolares 10.1 10.8 16.6 11.6 14.3 11.2 11.9 12.3 19.4 14.5 School Lunch Program
Fondos de la Agencia Federal para el manejo Federal Emergency Management de Emergencias (FEMA) 41.1 10.4 15.6 20.0 16.1 43.0 18.3 8.7 11.9 6.1 Agency (FEMA) funds
Ley Americana de Recuperación American Recovery and y Reinversión de 2009 0.0 0.0 58.5 900.3 1,488.0 436.8 549.5 16.4 56.9 10.1 Reinvestment Act of 2009
r- Cifras revisadas. r- Revised figures.p- Cifras preliminares. p- Preliminary figures.
a/ Hasta el 2006 se incluyó en otras agencias. a/ Up to 2006, it was included in other agencies. b/ Menos de $50,000. b/ Less than $50,000.
(1) Se considera parte del Gobierno central para efecto de las cuentas nacionales. (1) Considered as part of the Central government for national accounts purposes.(2) Creado en el 2001 mediante la fusión entre la Compañía de Fomento Recreativo (2) Created in 2001 by the merger between the Recreation Development Companyy el Fideicomiso de Parques Nacionales. and the National Parks Trust.(3) Incluye aportaciones adicionales no especificadas o incluidas en las respectivas Agencias. (3) Includes additional grants not elsewhere specified or included in the respective Agencies.
Fuente: Junta de Planificación, Programa de Planificación Económica y Social, Source: Puerto Rico Planning Board, Program of Economic and Social Planning, Subprograma de Análisis Económico. Subprogram of Economic Analysis.

A-46 JUNTA DE PLANIFICACIÓN / PLANNING BOARD
APÉNDICE ESTADÍSTICO • STATISTICAL APPENDIXINFORME ECONÓMICO AL GOBERNADOR 2016 • ECONOMIC REPORT TO THE GOVERNOR 2016
TABLA 23 - EXPORTACIONES DE MERCANCÍA REGISTRADA POR SISTEMA DE CLASIFICACIÓN INDUSTRIAL DE AMÉRICA DEL NORTE (SCIAN): AÑOS FISCALESTABLE 23 - EXPORTS OF RECORDED MERCHANDISE BY NORTH AMERICAN INDUSTRY CLASSIFICATION SYSTEM (NAICS): FISCAL YEARS (En millones de dólares - In millions of dollars)
SCIAN 2007 2008 2009 2010 2011 2012 2013 2014r 2015r 2016pNAICS
EXPORTACIONES REGISTRADAS, TOTAL 60,010.8 63,953.6 60,806.6 61,657.2 64,876.0 58,914.1 62,396.9 62,457.2 69,390.9 71,856.1 RECORDED EXPORTS, TOTAL
11 Agricultura, silvicultura, pesca y caza 37.2 45.6 38.9 50.3 41.2 52.7 58.2 70.6 51.6 54.2 Agriculture, forestry, fishing and hunting
21 Minería 3.7 5.5 13.4 54.4 17.9 11.9 28.6 12.9 14.2 19.2 Mining
31-33 Manufactura 59,378.1 63,229.9 60,098.4 60,056.6 62,875.2 58,164.6 61,674.2 61,789.1 68,758.3 71,215.2 Manufacturing
311 Alimentos 3,751.5 4,468.2 3,597.5 3,611.3 3,980.4 3,670.4 4,080.8 2,410.4 2,868.4 3,069.3 Food312 Productos de bebidas y de tabaco 359.6 474.4 493.6 500.1 356.0 285.9 247.0 259.7 197.1 262.1 Beverage and tobacco products
313-314 Textiles 78.4 87.4 84.6 66.7 141.3 128.7 140.6 82.7 69.2 75.1 Textiles315 Ropa 208.2 116.5 129.4 103.4 108.6 89.2 90.0 89.0 74.5 54.1 Apparel316 Cuero y productos afines 93.5 108.2 109.2 63.9 60.8 42.5 46.4 53.9 71.1 94.2 Leather and allied products321 Productos de madera 22.0 29.6 23.2 21.6 21.6 18.5 22.0 22.4 22.2 21.9 Wood products322 Papel 26.9 28.2 36.0 37.3 33.0 33.1 35.5 30.0 27.9 22.5 Paper323 Imprenta 23.7 20.7 20.2 15.9 12.0 9.8 12.0 17.2 8.6 11.3 Printing324 Productos de petróleo y de carbón 951.4 1,585.0 505.9 170.4 83.0 68.1 157.5 603.8 544.8 459.5 Petroleum and coal products325 Químicos 39,587.8 45,662.2 45,762.8 46,536.0 48,763.7 44,488.3 47,967.4 48,146.1 53,365.1 55,581.2 Chemicals3254 Farmacéuticos y medicinas 36,567.9 42,182.7 41,983.5 42,492.7 43,224.0 40,848.0 43,887.0 43,344.9 48,763.9 51,060.3 Pharmaceuticals and medicines326 Productos de plástico y de goma 150.5 92.1 123.5 112.2 125.3 132.5 136.8 170.2 187.2 176.9 Plastic and rubber products327 Productos de minerales no metálicos 71.0 67.5 58.4 55.5 51.4 45.8 52.2 46.7 51.0 38.1 Nonmetallic mineral products331 Metales primarios 184.3 182.9 211.0 306.2 562.6 974.0 186.5 122.9 149.6 170.0 Primary metals332 Productos fabricados de metal 64.1 72.6 65.9 92.3 89.0 86.9 79.0 72.2 81.7 98.6 Fabricated metal products333 Maquinaria 712.2 635.9 557.1 639.0 743.3 729.3 799.9 861.6 967.6 1,127.0 Machinery334 Productos de computadora y electrónicos 6,885.0 4,083.5 3,197.2 2,511.1 2,005.4 1,575.1 1,481.4 1,687.2 1,767.3 1,572.7 Computer and electronic products3341 Computadoras y equipo periférico 4,023.0 2,274.0 1,596.6 962.6 815.0 440.5 433.2 416.7 348.2 157.1 Computers and peripheral equipment335 Equipos eléctricos, enseres Electrical equipment, appliance,
y componentes 1,281.4 1,558.3 1,241.7 876.9 872.2 1,023.9 1,064.4 1,114.2 1,063.5 1,175.6 and component336 Equipo de transportación 132.4 138.1 168.4 233.6 283.6 237.4 272.2 278.2 313.7 292.7 Transportation equipment337 Muebles y productos relacionados 5.6 8.9 11.3 7.5 7.9 7.7 9.4 27.5 32.6 35.6 Furniture and related products339 Manufactura miscelánea 4,788.6 3,809.7 3,701.8 4,095.8 4,574.2 4,517.4 4,793.1 5,693.1 6,895.2 6,876.7 Miscellaneous manufacturing3391 Equipos y materiales de uso médico 4,675.2 3,732.6 3,649.6 4,053.1 4,539.9 4,481.6 4,758.7 5,677.3 6,848.7 6,816.7 Medical equipment and supplies
Otros sectores (1) 591.8 672.6 655.8 1,495.9 1,941.7 684.9 635.8 584.7 566.9 567.5 Other sectors (1)
(1) Incluye servicios de reparación y mercancía no clasificada. (1) Includes repair services and merchandise not classified.
Nota: La clasificación de mercancía registrada de acuerdo al Sistema de Clasificación Industrial Note: The classification of recorded merchandise according to the North American Industrial de América del Norte no equivale necesariamente a la Clasificación Industrial Uniforme. Classification System does not necessarily equals the Standard Industrial Classification.
Fuente: Junta de Planificación, Programa de Planificación Económica y Social, Source: Puerto Rico Planning Board, Program of Economic and Social Planning, Subprograma de Análisis Económico. Subprogram of Economic Analysis.

A-47 JUNTA DE PLANIFICACIÓN / PLANNING BOARD
APÉNDICE ESTADÍSTICO • STATISTICAL APPENDIXINFORME ECONÓMICO AL GOBERNADOR 2016 • ECONOMIC REPORT TO THE GOVERNOR 2016
TABLA 24 - IMPORTACIONES DE MERCANCÍA REGISTRADA POR SISTEMA DE CLASIFICACIÓN INDUSTRIAL DE AMÉRICA DEL NORTE (SCIAN): AÑOS FISCALESTABLE 24 - IMPORTS OF RECORDED MERCHANDISE BY NORTH AMERICAN INDUSTRY CLASSIFICATION SYSTEM (NAICS): FISCAL YEARS (En millones de dólares - In millions of dollars)
SCIAN 2007 2008 2009 2010 2011 2012 2013 2014r 2015r 2016pNAICS
IMPORTACIONES REGISTRADAS,TOTAL 45,265.8 44,928.3 40,651.0 40,810.1 44,670.6 46,574.6 45,038.7 42,475.6 43,233.0 43,320.1 RECORDED IMPORTS,TOTAL
11 Agricultura, silvicultura, pesca y caza 459.6 519.2 521.7 511.3 539.6 530.7 548.5 572.3 570.3 565.0 Agriculture, forestry, fishing and hunting
21 Minería 1,510.0 2,457.3 546.1 407.4 424.1 604.8 801.7 962.7 871.6 623.9 Mining
31-33 Manufactura 42,259.4 40,779.0 38,605.5 38,517.3 42,250.6 44,284.8 42,356.3 39,327.7 40,427.5 40,875.9 Manufacturing
311 Alimentos 2,440.6 2,627.7 2,955.6 2,987.8 3,178.5 3,385.2 3,317.1 3,328.5 3,442.4 3,189.9 Food312 Productos de bebidas y de tabaco 448.1 428.9 454.3 470.2 466.9 480.3 494.7 518.0 500.1 435.0 Beverage and tobacco products
313-314 Textiles 351.4 244.7 327.4 338.2 384.3 401.3 289.6 232.9 271.8 255.6 Textiles315 Ropa 604.2 541.1 554.0 501.8 508.7 563.8 629.3 510.1 514.1 485.3 Apparel316 Cuero y productos afines 289.7 279.6 278.8 241.0 297.6 266.6 296.9 282.9 261.9 256.7 Leather and allied products321 Productos de madera 137.6 124.6 120.2 104.2 121.0 117.1 114.0 82.8 95.8 78.9 Wood products322 Papel 577.2 568.8 593.5 580.2 578.7 574.1 555.2 552.3 541.6 484.6 Paper323 Imprenta 183.8 190.5 169.0 161.9 153.8 149.1 130.7 115.0 105.9 93.4 Printing324 Productos de petróleo y de carbón 4,152.8 5,169.8 4,714.0 4,952.5 5,738.8 6,603.4 5,872.6 4,644.8 3,823.9 2,623.3 Petroleum and coal products325 Químicos 21,675.9 19,337.5 18,146.4 18,066.1 20,022.9 20,573.5 19,496.2 17,998.9 19,366.8 22,250.3 Chemicals3251 Químicos básicos 4,150.3 3,286.5 3,282.4 3,249.7 4,428.5 3,917.7 3,469.9 4,333.8 4,053.3 4,497.3 Basic chemicals3254 Farmacéuticos y medicinas 16,494.7 15,065.9 13,591.2 13,761.7 14,476.8 15,503.0 13,409.4 12,545.7 14,140.6 16,726.4 Pharmaceuticals and medicines326 Productos de plástico y de goma 773.8 859.5 911.6 911.9 1,017.3 958.1 888.8 850.2 881.3 922.7 Plastic and rubber products327 Productos de minerales no metálicos 289.6 260.3 254.3 218.0 215.6 224.3 222.4 203.6 200.9 182.8 Nonmetallic mineral products331 Metales primarios 620.0 592.3 580.6 452.6 870.3 708.2 722.9 790.3 547.0 329.9 Primary metals332 Productos fabricados de metal 626.3 527.2 461.6 413.4 442.4 507.7 486.6 446.0 444.4 439.6 Fabricated metal products333 Maquinaria 1,266.0 1,199.1 1,122.4 1,039.4 1,048.6 1,183.5 1,150.5 1,095.6 1,154.3 1,088.1 Machinery334 Productos de computadora y electrónicos 2,932.8 2,986.2 2,829.2 2,604.1 2,398.4 2,415.4 2,350.8 2,261.7 2,442.5 2,129.7 Computer and electronic products335 Equipos eléctricos, enseres Electrical equipment, appliance,
y componentes 1,052.9 1,041.7 878.0 832.0 904.5 952.3 904.4 919.2 1,063.1 950.8 and component336 Equipo de transportación 1,922.3 1,909.3 1,478.2 1,841.6 2,002.6 2,271.7 2,490.9 2,491.9 2,791.7 2,694.3 Transportation equipment3361 Vehículos de motor 1,608.7 1,647.8 1,204.9 1,535.0 1,713.3 1,965.3 1,996.8 1,991.8 1,612.4 1,853.2 Motor vehicles337 Muebles y productos relacionados 296.5 284.6 264.3 248.5 249.3 253.1 298.0 237.3 268.0 253.3 Furniture and related products339 Manufactura miscelánea 1,617.9 1,605.6 1,512.0 1,552.0 1,650.2 1,696.3 1,644.7 1,765.8 1,710.1 1,731.7 Miscellaneous manufacturing
Otros sectores (1) 1,036.8 1,172.8 977.6 1,374.1 1,456.3 1,154.4 1,332.3 1,613.0 1,363.6 1,255.4 Other sectors (1)
(1) Incluye servicios de reparación y mercancía no clasificada. (1) Includes repair services and merchandise not classified.
Nota: La clasificación de mercancía registrada de acuerdo al Sistema de Clasificación Industrial Note: The classification of recorded merchandise according to the North American Industrial de América del Norte no equivale necesariamente a la Clasificación Industrial Uniforme. Classification System does not necessarily equals the Standard Industrial Classification.
Fuente: Junta de Planificación, Programa de Planificación Económica y Social, Source: Puerto Rico Planning Board, Program of Economic and Social Planning, Subprograma de Análisis Económico. Subprogram of Economic Analysis.

A-48 JUNTA DE PLANIFICACIÓN / PLANNING BOARD
APÉNDICE ESTADÍSTICO • STATISTICAL APPENDIXINFORME ECONÓMICO AL GOBERNADOR 2016 • ECONOMIC REPORT TO THE GOVERNOR 2016
TABLA 25 - BALANCE COMERCIAL: AÑOS FISCALESTABLE 25 - TRADE BALANCE: FISCAL YEARS (En millones de dólares - In millions of dollars)
2007 2008 2009 2010 2011 2012 2013 2014r 2015r 2016p
Exportaciones registradas, total 60,010.8 63,953.6 60,806.6 61,657.2 64,876.0 58,914.1 62,396.9 62,457.2 69,390.9 71,856.1 Recorded exports, total
Estados Unidos 46,324.0 47,262.3 43,543.9 41,989.2 45,872.7 41,798.0 44,665.8 44,853.1 51,433.1 54,592.5 United States
Países extranjeros 13,514.8 16,549.4 17,140.9 19,526.0 18,822.6 16,953.1 17,498.2 17,310.3 17,677.4 16,919.7 Foreign countries
Islas Vírgenes 172.0 141.9 121.8 142.1 180.6 162.9 232.8 293.8 280.5 343.8 Virgin Islands
Importaciones registradas, total 45,265.8 44,928.3 40,651.0 40,810.1 44,670.6 46,574.6 45,038.7 42,475.6 43,233.0 43,320.1 Recorded imports, total
Estados Unidos 22,662.4 21,322.1 19,069.1 20,895.5 20,579.1 19,837.1 20,454.9 20,063.9 22,333.8 24,076.2 United States
Países extranjeros 21,225.9 22,031.0 19,973.8 18,341.2 22,076.5 24,962.4 24,575.0 22,401.1 20,884.1 19,242.6 Foreign countries
Islas Vírgenes 1,377.5 1,575.2 1,608.1 1,573.4 2,015.0 1,775.1 8.8 10.6 15.1 1.3 Virgin Islands
Balance comercial 14,745.0 19,025.3 20,155.6 20,847.1 20,205.3 12,339.5 17,358.2 19,981.6 26,157.9 28,536.0 Trade balance
Estados Unidos 23,661.6 25,940.2 24,474.8 21,093.6 25,293.6 21,960.9 24,210.9 24,789.3 29,099.3 30,516.4 United States
Países extranjeros (7,711.1) (5,481.6) (2,832.9) 1,184.7 (3,253.9) (8,009.2) (7,076.8) (5,090.9) (3,206.7) (2,322.9) Foreign countries
Islas Vírgenes (1,205.5) (1,433.3) (1,486.3) (1,431.3) (1,834.4) (1,612.2) 224.0 283.2 265.4 342.5 Virgin Islands
( ) Cifras negativas. ( ) Negative figures.
Fuente: Junta de Planificación, Programa de Planificación Económica y Social, Source: Puerto Rico Planning Board, Program of Economic and Social Planning, Subprograma de Análisis Económico. Subprogram of Economic Analysis.
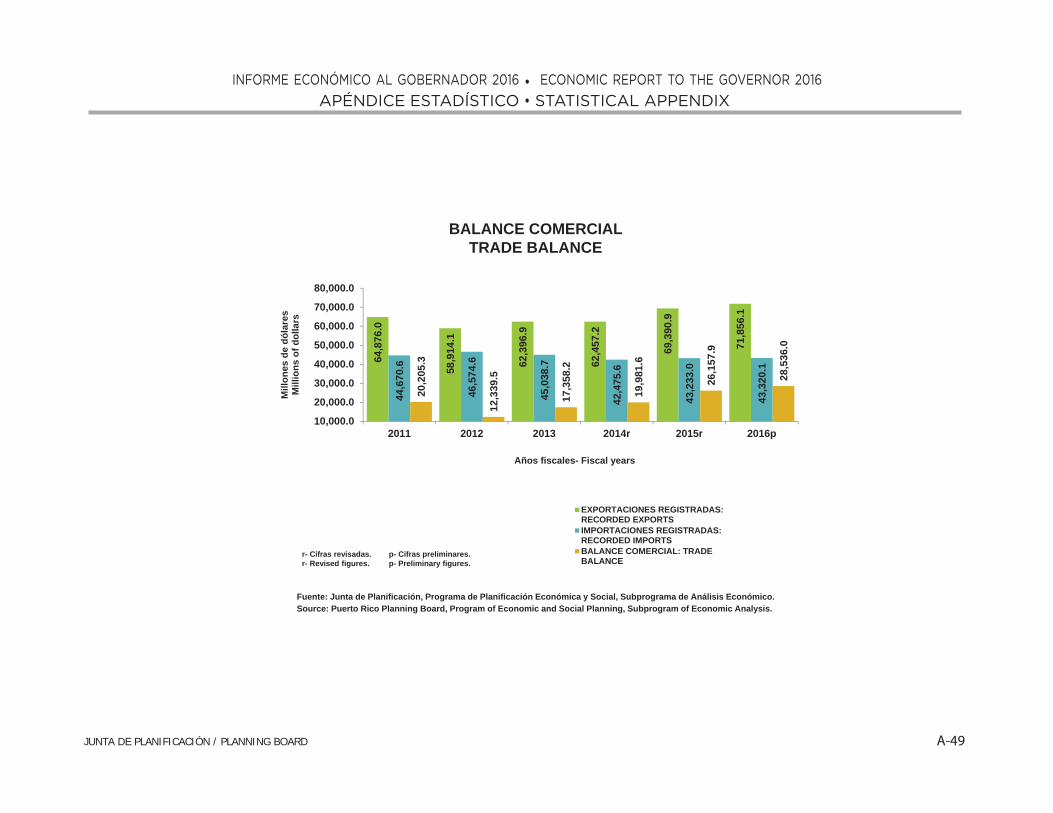
A-49 JUNTA DE PLANIFICACIÓN / PLANNING BOARD
APÉNDICE ESTADÍSTICO • STATISTICAL APPENDIXINFORME ECONÓMICO AL GOBERNADOR 2016 • ECONOMIC REPORT TO THE GOVERNOR 2016
BALANCE COMERCIAL TRADE BALANCE
64,8
76.0
58,9
14.1
62,3
96.9
62,4
57.2
69,3
90.9
71,8
56.1
44,6
70.6
46,5
74.6
45,0
38.7
42,4
75.6
43,2
33.0
43,3
20.1
20,2
05.3
12,3
39.5
17,3
58.2
19,9
81.6
26,1
57.9
28,5
36.0
10,000.0
20,000.0
30,000.0
40,000.0
50,000.0
60,000.0
70,000.0
80,000.0
2011 2012 2013 2014r 2015r 2016p
Mill
ones
de
dóla
res
Mill
ions
of d
olla
rs
Años fiscales- Fiscal years
EXPORTACIONES REGISTRADAS:RECORDED EXPORTSIMPORTACIONES REGISTRADAS:RECORDED IMPORTSBALANCE COMERCIAL: TRADEBALANCE
r- Cifras revisadas. p- Cifras preliminares.r- Revised figures. p- Preliminary figures.
Fuente: Junta de Planificación, Programa de Planificación Económica y Social, Subprograma de Análisis Económico. Source: Puerto Rico Planning Board, Program of Economic and Social Planning, Subprogram of Economic Analysis.

A-50 JUNTA DE PLANIFICACIÓN / PLANNING BOARD
APÉNDICE ESTADÍSTICO • STATISTICAL APPENDIXINFORME ECONÓMICO AL GOBERNADOR 2016 • ECONOMIC REPORT TO THE GOVERNOR 2016
TABLA 26 - CLASIFICACIÓN ECONÓMICA DE LAS IMPORTACIONES DE MERCANCÍA AJUSTADA *: AÑOS FISCALES TABLE 26 - ECONOMIC CLASSIFICATION OF ADJUSTED MERCHANDISE IMPORTS *: FISCAL YEARS (En millones de dólares-In millions of dollars)
2007 2008 2009 2010 2011 2012 2013 2014r 2015r 2016p
IMPORTACIONES AJUSTADAS 50,055.6 51,006.3 47,087.3 46,200.2 48,910.0 49,400.0 49,180.0 48,473.1 48,800.0 48,859.7 ADJUSTED IMPORTS
Artículos de consumo 8,261.1 8,179.6 8,299.7 8,916.4 9,310.6 9,842.8 9,889.5 9,569.6 9,764.9 9,726.3 Consumer goods
Duraderos 2,435.1 2,329.5 2,061.9 2,243.6 2,234.1 2,761.2 3,045.0 2,753.9 2,481.6 2,613.8 Durables
Automóviles 1,111.3 1,116.5 851.5 1,044.1 1,172.9 1,453.8 1,655.3 1,502.3 1,207.1 1,371.9 Automobiles
Enseres eléctricos 446.1 422.7 422.8 428.7 446.4 427.5 432.1 347.5 353.4 327.9 Electrical appliances
Otros 877.6 790.4 787.6 770.8 614.8 879.9 957.6 904.1 921.0 914.0 Others
No duraderos 5,826.0 5,850.1 6,237.8 6,672.7 7,076.6 7,081.6 6,844.5 6,815.7 7,283.3 7,112.5 Nondurables
Alimentos 2,269.3 2,652.4 2,962.7 2,994.6 3,195.5 3,413.4 3,353.6 3,411.5 3,523.5 3,277.8 Food
Bebidas alcohólicas y Alcoholic beverages and productos de tabaco 408.7 381.7 398.9 419.3 426.6 427.2 423.0 444.8 404.8 355.8 tobacco products
Otros 3,148.0 2,816.0 2,876.3 3,258.8 3,454.5 3,241.1 3,067.9 2,959.4 3,355.0 3,478.9 Others
Bienes de capital 3,383.2 3,133.3 2,831.5 2,739.1 2,853.5 3,047.5 3,013.5 2,920.8 2,939.7 2,872.5 Capital goods
Materias primas y Raw material and productos intermedios 38,411.2 39,693.4 35,956.1 34,544.9 36,745.8 36,509.8 36,277.0 35,982.6 36,095.4 36,260.9 intermediate products
r- Cifras revisadas. r- Revised figures.p- Cifras preliminares. p- Preliminary figures.* Al valor de las importaciones de mercancía registrada se le hacen ajustes * Recorded merchandise imports are adjusted by: parcel post,
por concepto de: paquetes postales, equipo de oficina para alquiler, office equipment for rent, motion picture films, returned películas cinematográficas, mercancía devuelta, mercancía sin registrar, autos merchandise, unrecorded merchandise, automobiles, and crude oil and y derechos de igualación de costos de las refinerías de petróleo y nafta. naphtha entitlements.
Fuente: Junta de Planificación, Programa de Planificación Económica y Social, Source: Puerto Rico Planning Board, Program of Economic and Social Planning, Subprograma de Análisis Económico. Subprogram of Economic Analysis.

A-51 JUNTA DE PLANIFICACIÓN / PLANNING BOARD
APÉNDICE ESTADÍSTICO • STATISTICAL APPENDIXINFORME ECONÓMICO AL GOBERNADOR 2016 • ECONOMIC REPORT TO THE GOVERNOR 2016
CLASIFICACIÓN ECONÓMICA DE LAS IMPORTACIONES DE MERCANCIA AJUSTADAECONOMIC CLASSIFICATION OF MERCHANDISE ADJUSTED IMPORTS
36,7
45.8
36,5
09.8
36,2
77.0
35,9
82.6
36,0
95.4
36,2
60.9
2,85
3.5
3,04
7.5
3,01
3.5
2,92
0.8
2,93
9.7
2,87
2.59,31
0.6
9,84
2.8
9,88
9.5
9,56
9.6
9,76
4.9
9,72
6.3
0.0
7,500.0
15,000.0
22,500.0
30,000.0
37,500.0
45,000.0
2011 2012 2013 2014r 2015r 2016p
Mill
ones
de
dóla
res
Mill
ions
of d
olla
rs
Años fiscales- Fiscal years
MATERIA PRIMA Y PRODUCTOS INTERMEDIOS: RAW MATERIAL AND INTERMEDIATE PRODUCTSBIENES DE CAPITAL: CAPITAL GOODS
ARTICULOS DE CONSUMO: CONSUMER GOODS
r- Cifras revisadas. p- Cifras preliminares.r- Revised figures. p- Preliminary figures.
Fuente: Junta de Planificación, Programa de Planificación Económica y Social, Subprograma de Análisis Económico. Source: Puerto Rico Planning Board, Program of Economic and Social Planning, Subprogram of Economic Analysis.

A-52 JUNTA DE PLANIFICACIÓN / PLANNING BOARD
APÉNDICE ESTADÍSTICO • STATISTICAL APPENDIXINFORME ECONÓMICO AL GOBERNADOR 2016 • ECONOMIC REPORT TO THE GOVERNOR 2016
TABLA 27 - RENTAS PERIÓDICAS NETAS DEL E.L.A.: AÑOS FISCALESTABLE 27 -COMMONWEALTH GOVERNMENT NET RECURRENT REVENUES: FISCAL YEARS(En millones de dólares - In millions of dollars)
2007 2008 2009 2010 2011 2012 2013 2014r 2015r 2016p
TOTAL 13,056.6 12,321.7 12,495.7 13,047.4 13,028.3 14,272.2 14,386.3 14,931.5 15,481.7 15,905.3 TOTAL
De fuentes estatales 8,954.8 8,488.0 7,736.7 7,754.2 7,820.9 8,745.1 8,785.6 9,551.3 10,008.4 10,334.6 From Commonwealth sources
Contributivas 8,211.0 7,600.6 7,062.6 7,098.8 7,376.0 8,173.2 7,792.8 8,584.2 8,596.8 9,005.5 Tax revenues
Contribución sobre la propiedad 128.7 119.7 86.0 314.0 246.6 97.7 108.6 77.5 93.7 207.2 Property taxes
Contribución sobre ingresos, total 6,187.3 5,509.6 5,187.6 5,162.7 4,910.3 4,551.5 4,373.2 4,946.1 4,978.2 4,511.7 Income tax, total Individuos 3,071.7 2,759.3 2,648.3 2,593.6 2,186.2 2,129.4 2,054.7 1,979.4 2,295.3 2,003.3 Individuals Corporaciones y sociedades 2,005.9 1,567.5 1,377.8 1,684.0 1,677.3 1,461.7 1,287.3 1,915.1 1,738.0 1,664.6 Corporations and partnerships Retenida a no residentes 933.6 1,087.8 1,081.7 830.4 1,000.4 890.8 982.9 899.9 784.1 808.8 Withheld to nonresidents Impuesto sobre repatriaciones 25.1 21.6 19.4 15.0 12.6 27.7 8.9 7.1 3.7 0.0 Toll Gate Tax Intereses sujetos al 17% 12.1 13.6 11.7 9.9 7.0 6.8 5.4 4.9 4.4 4.2 Interest subject to 17% Impuestos sobre dividendos 10% dividends al 10% (1) 138.9 59.8 48.7 29.8 26.8 35.1 34.1 139.7 152.7 30.7 tax (1)
Contribución sobre herencias Inheritance and donations y donaciones 4.7 6.6 5.1 3.6 3.1 5.5 1.8 1.4 6.6 4.7 taxes
Arbitrios, total 1,150.9 900.4 838.6 929.8 1,602.9 2,834.7 2,614.2 2,869.8 2,800.0 2,613.7 Excise taxes, total Bebidas alcohólicas, total 279.0 268.1 277.4 284.8 281.0 292.6 282.3 266.5 258.2 264.7 Alcoholic beverages, total Espíritus destilados 52.3 50.2 54.8 53.9 51.2 52.7 54.2 46.9 44.1 46.0 Distilled spirits Cerveza 207.8 198.9 203.4 211.8 209.6 217.1 207.3 195.0 192.3 194.6 Beer Otras 18.9 19.0 19.2 19.1 20.2 22.8 20.8 24.7 21.8 24.0 Others Otros artículos, total 871.9 632.3 561.2 645.0 1,321.9 2,542.1 2,331.9 2,603.3 2,541.9 2,349.0 Other taxable goods, total Productos de petróleo 6.2 8.4 4.3 4.7 4.2 3.8 4.4 30.0 3.2 3.0 Petroleum products Productos de tabaco 132.4 119.1 129.4 182.5 202.0 172.2 186.9 171.1 170.9 100.3 Tobacco products Vehículos de motor 396.7 366.3 310.9 350.8 364.2 386.5 419.2 392.0 298.5 285.6 Motor vehicles Arbitrio general de 5% 193.9 0.0 0.0 0.0 0.0 0.0 0.0 0.0 0.0 0.0 5% General excise tax Importación de petróleo 0.0 0.0 0.0 0.0 0.0 0.0 0.0 0.0 0.0 0.0 Petroleum import fees Foráneas (Ley 154) 0.0 0.0 0.0 0.0 677.6 1,875.8 1,632.5 1,902.2 1,942.9 1,862.3 Foreign (Act 154) Otros 142.7 138.5 116.6 107.0 73.9 103.8 88.8 107.9 126.4 97.8 Others
Impuesto a venta y uso 583.7 914.3 800.4 543.6 531.7 543.3 543.2 598.5 629.5 1,559.6 Sales and use tax
Licencias 155.7 150.0 144.9 145.2 81.4 140.7 151.8 90.8 88.8 108.6 Licenses Vehículos de motor 99.0 87.4 85.1 87.0 62.9 93.7 102.2 40.3 38.2 57.8 Motor vehicles Bebidas alcohólicas 5.0 4.9 4.8 4.7 6.5 4.3 5.0 5.1 5.5 7.1 Alcoholic beverages Maquinas de entretenimiento y otros 16.9 19.7 19.3 18.7 0.3 0.2 0.1 0.0 0.0 0.1 Entertainment machines and others Otras licencias 34.9 38.0 35.7 34.8 11.7 42.5 44.5 45.4 45.1 43.5 Others licences
(Continúa - Continue)

A-53 JUNTA DE PLANIFICACIÓN / PLANNING BOARD
APÉNDICE ESTADÍSTICO • STATISTICAL APPENDIXINFORME ECONÓMICO AL GOBERNADOR 2016 • ECONOMIC REPORT TO THE GOVERNOR 2016
TABLA 27 - RENTAS PERIÓDICAS NETAS DEL E.L.A.: AÑOS FISCALES (CONT.)TABLE 27 -COMMONWEALTH GOVERNMENT NET RECURRENT REVENUES: FISCAL YEARS (CONT.)(En millones de dólares - In millions of dollars)
2007 2008 2009 2010 2011 2012 2013 2014r 2015r 2016p
No contributivas 743.8 887.4 674.1 655.4 444.9 571.9 992.8 967.1 1,411.5 1,329.1 Non-Tax Revenues Lotería tradicional 73.0 46.6 51.5 42.8 46.2 38.2 24.3 81.8 20.2 50.9 Traditional lottery Lotería electrónica 71.8 105.3 75.2 80.0 55.7 56.2 38.9 72.3 93.6 77.2 Electronic lottery Derechos, multas y Permit fees, fines, and penalidades 83.5 253.6 236.6 100.1 147.8 134.8 121.1 161.8 171.7 54.3 penalties Ingresos misceláneos 515.5 336.7 310.8 432.4 195.2 342.7 808.5 651.2 1,126.0 1,146.7 Miscellaneous income Venta de propiedades 0.0 145.2 0.0 0.0 0.0 0.0 0.0 0.0 0.0 0.0 Property Sales Transferencias de fondos Transfers from no presupuestados (2) 0.0 0.0 0.0 0.0 0.0 0.0 0.0 0.0 0.0 0.0 non-budget funds (2)
De otras fuentes 4,101.8 3,833.7 4,759.0 5,293.2 5,207.4 5,527.1 5,600.7 5,380.2 5,473.3 5,570.7 From Non-Commonwealth sources
Derechos de aduana 14.5 4.9 3.2 0.0 0.0 7.7 0.0 0.0 2.3 - Customs duties Arbitrios sobre U.S. excises on off-shore embarques 377.9 356.8 404.3 352.3 328.5 302.3 247.8 248.0 189.2 199.6 shipments Aportaciones federales 3,709.4 3,472.0 4,351.5 4,940.9 4,878.9 5,217.1 5,352.8 5,132.2 5,281.8 5,371.0 Federal grants
Gestiones Administrativas (2) 0.0 0.0 0.0 0.0 0.0 0.0 0.0 0.0 0.0 0.0 Administrative procedures (2)
r- Cifras revisadas. r- Revised figures. p- Cifras preliminares. p- Preliminary figures.(1) A partir de 1996, los recaudos por concepto de intereses sobre dividendos (1) Since 1996, the receipts from interest on dividends se redujeron de 20 a 10% debido a la Reforma Contributiva de 1994 were lowered from 20% to 10% due to the 1994 Tax Reform (Ley Núm.120 del 31 de octubre de 1994). (Act 120 of October 31, 1994).(2) Desde el año fiscal 2001, el Departamento de Hacienda incorpora estas (2) Since fiscal year 2001, the Department of the Treasury incorporates partidas. these items.
Fuente: Departamento de Hacienda, Oficina de Asuntos Económicos. Source: Department of the Treasury, Office of Economic Affairs.

A-54 JUNTA DE PLANIFICACIÓN / PLANNING BOARD
APÉNDICE ESTADÍSTICO • STATISTICAL APPENDIXINFORME ECONÓMICO AL GOBERNADOR 2016 • ECONOMIC REPORT TO THE GOVERNOR 2016
RENTAS PERIÓDICAS NETAS DEL GOBIERNO DE PUERTO RICOPUERTO RICO’S NET RECURRENT REVENUES
444.
9
571.
9
992.
8
967.
1
1,41
1.5
1,32
9.1
5,20
7.4
5,52
7.1
5,60
0.7
5,38
0.2
5,47
3.3
5,57
0.7
7,37
6.0
8,17
3.2
7,79
2.8
8,58
4.2
8,59
6.8
9,00
5.513
,028
.3
14,2
72.2
14,3
86.3
14,9
31.5
15,4
81.7
15,9
05.3
0.02,000.04,000.06,000.08,000.0
10,000.012,000.014,000.016,000.018,000.0
2011 2012 2013 2014r 2015r 2016p
Mill
ones
de
dóla
res
Mill
ions
of d
olla
rs
Años fiscales- Fiscal years
DE FUENTES ESTATALES NO CONTRIBUTIVAS: FROM COMMONWEALTH SOURCES NON-TAX REVENUESDE OTRAS FUENTES: FROM NON-COMMONWEALTH SOURCESDE OTRAS FUENTES CONTRIBUTIVAS: FROM COMMONWEALTH SOURCES -TAX REVENUESTOTAL
Fuente: Departamento de Hacienda, Oficina de Asuntos Económicos.Source: Department of the Treasury, Office of Economic Affairs.
r- Cifras revisadas. p- Cifras preliminares.r- Revised figures. p- Preliminary figures.

A-55 JUNTA DE PLANIFICACIÓN / PLANNING BOARD
APÉNDICE ESTADÍSTICO • STATISTICAL APPENDIXINFORME ECONÓMICO AL GOBERNADOR 2016 • ECONOMIC REPORT TO THE GOVERNOR 2016
TABLA 28 - INGRESOS NETOS AL FONDO GENERAL DEL ELA : AÑOS FISCALESTABLE 28 - COMMONWEALTH GOVERNMENT GENERAL FUND NET REVENUES: FISCAL YEARS(En millones de dólares - In millions of dollars)
2007 2008 2009 2010 2011 2012 2013 2014r 2015r 2016p
TOTAL 8,862.5 8,359.0 7,710.2 7,716.1 8,158.3 8,667.9 8,562.2 9,036.9 8,960.9 9,175.3 TOTAL
De fuentes estatales 8,470.1 7,997.4 7,302.7 7,363.8 7,828.1 8,357.8 8,314.4 8,788.9 8,769.4 8,975.7 From Commonwealth sources
Contributivas 7,995.2 7,378.7 6,891.5 6,926.3 7,379.7 8,022.6 7,641.5 8,303.4 8,425.0 8,710.7 Tax revenues
Contribución sobre la Property propiedad 0.8 0.0 1.0 227.8 246.6 44.4 52.6 19.8 21.4 11.3 taxes
Contribución sobre ingresos, total 6,187.2 5,509.7 5,187.2 5,162.7 4,914.5 4,551.5 4,373.2 4,846.1 4,978.2 4,511.7 Income tax, total Individuos 3,071.7 2,759.3 2,648.3 2,593.6 2,187.1 2,129.4 2,054.7 1,979.4 2,295.3 2,003.3 Individuals Corporaciones y sociedades 2,005.7 1,567.5 1,377.4 1,684.0 1,680.5 1,461.7 1,287.3 1,915.1 1,738.0 1,664.6 Corporations and partnerships Retenida a no residentes 933.7 1,087.8 1,081.7 830.4 1,000.4 890.8 982.9 899.9 784.1 808.8 Withheld to nonresidents Impuesto sobre repatriaciones 25.1 21.6 19.4 15.0 12.6 27.7 8.9 7.1 3.7 0.0 Toll Gate Tax Intereses sujetos al 17% 12.1 13.7 11.7 9.9 7.0 6.8 5.4 4.9 4.4 4.2 Interest subject to 17% Impuesto sobre dividendos sujetos al 10% (1) 138.9 59.8 48.7 29.8 26.8 35.1 34.1 39.7 152.7 30.7 10% Dividends Tax (1)
Contribución sobre herencias Inheritance and donation y donaciones 4.7 6.6 5.1 3.6 3.1 5.5 1.8 1.4 6.6 4.7 taxes
Impuesto sobre ventas y uso 582.6 911.0 797.2 540.3 531.7 540.0 539.9 595.3 626.3 1,559.6 Sales and use tax
Arbitrios, total 1,122.4 863.6 804.6 896.0 1,602.3 2,804.6 2,592.8 2,821.0 2,773.0 2,604.3 Excise taxes, total Bebidas alcohólicas, total 279.0 268.1 277.4 284.8 281.0 292.6 282.3 266.5 258.2 264.7 Alcoholic beverages, total Espíritus destilados 52.3 50.2 54.8 53.9 51.2 52.7 54.2 46.9 44.1 46.0 Distilled spirits Cerveza 207.8 198.9 203.4 211.8 209.6 217.1 207.3 195.0 192.3 194.6 Beer Otras 18.9 19.0 19.2 19.1 20.2 22.8 20.8 24.7 21.8 24.0 Others Otros artículos, total 843.3 595.5 527.2 611.2 1,321.4 2,512.0 2,310.4 2,554.5 2,514.8 2,339.7 Other taxable goods, total Foráneas (Ley 154) 0.0 0.0 0.0 0.0 677.6 1,875.8 1,632.5 1,902.2 1,942.9 1,862.3 Foreign (Act 154) Productos de petróleo 6.0 8.4 4.3 4.7 4.2 3.8 4.4 4.0 3.2 3.3 Petroleum products Productos de tabaco 132.4 119.1 129.4 182.5 202.0 172.2 186.9 171.1 170.9 100.3 Tobacco products Vehículos de motor 396.7 366.3 310.9 350.8 364.2 386.5 419.2 392.0 298.5 285.6 Motor vehicles Arbitrio general del 5% 193.9 0.0 0.0 0.0 0.0 0.0 0.0 0.0 0.0 0.0 5% General excise tax Petróleo crudo y Crude petroleum and sus derivados 0.0 0.0 0.0 0.0 0.0 0.0 0.0 0.0 0.0 0.0 derived products Otros 114.3 101.6 82.5 73.3 73.4 73.7 67.4 85.2 99.3 88.2 Others
Licencias 97.6 87.7 96.4 95.8 81.4 76.6 81.1 19.8 19.6 19.0 Licenses Vehículos de motor 65.5 52.0 62.9 61.7 62.9 62.5 64.3 2.3 2.3 2.2 Motor vehicles Maquinas de entretenimiento 16.9 19.7 19.3 18.7 0.3 0.2 0.1 0.0 0.0 0.1 Entertainment machines Bebidas alcohólicas y otras 15.2 16.0 14.3 15.3 18.2 13.9 16.7 17.6 17.2 16.7 Alcoholic beverages and others
(Continúa - Continue)

A-56 JUNTA DE PLANIFICACIÓN / PLANNING BOARD
APÉNDICE ESTADÍSTICO • STATISTICAL APPENDIXINFORME ECONÓMICO AL GOBERNADOR 2016 • ECONOMIC REPORT TO THE GOVERNOR 2016
TABLA 28 - INGRESOS NETOS AL FONDO GENERAL DEL ELA : AÑOS FISCALES (CONT.)TABLE 28 - COMMONWEALTH GOVERNMENT GENERAL FUND NET REVENUES: FISCAL YEARS (CONT.)(En millones de dólares - In millions of dollars)
2007 2008 2009 2010 2011 2012 2013 2014r 2015r 2016p
No contributivas 474.9 618.6 411.1 437.6 448.4 335.2 672.9 485.5 344.4 264.9 Non-tax revenues
Lotería tradicional 73.0 46.6 51.5 42.8 46.2 38.2 24.3 81.8 20.2 50.8 Traditional lottery Lotería electrónica 71.8 105.3 75.2 80.0 55.7 56.2 38.9 72.3 93.6 77.2 Electronic lottery Ingresos misceláneos 330.1 466.7 284.4 314.8 346.6 240.9 609.7 331.4 230.6 137.0 Miscellaneous income Transferencias de fondos Transfers from no presupuestados (2) 0.0 0.0 0.0 0.0 0.0 0.0 0.0 0.0 0.0 0.0 non-budget funds (2)
De otras fuentes 392.4 361.6 407.5 352.3 330.2 310.0 247.8 248.0 191.5 199.6 From Non-Commonwealth sources
Derechos de aduana 14.5 4.8 3.3 0.0 0.0 7.7 0.0 0.0 2.3 0.0 Customs duties Arbitrios sobre U.S. excises on off-shore embarques 377.9 356.8 404.3 352.3 330.2 302.3 247.8 248.0 189.2 199.6 shipments
Gestiones Administrativas (2) 0.0 0.0 0.0 0.0 0.0 0.0 0.0 0.0 0.0 0.0 Administrative procedures (2)
r- Cifras revisadas. r- Revised figures.p- Cifras preliminares. p- Preliminary figures.(1) A partir de 1996, los recaudos por concepto de intereses sobre dividendos (1) Since 1996, the receipts from interest on dividends se redujeron de 20 a 10% debido a la Reforma Contributiva de 1994 were lowered from 20% to 10% due to the 1994 Tax Reform
(Ley Núm.120 del 31 de octubre de 1994). (Act 120 of October 31, 1994).(2) Desde el año fiscal 2001, el Departamento de Hacienda incorpora (2) Since fiscal year 2001, the Department of Treasury incorporates estas partidas. these items.

A-57 JUNTA DE PLANIFICACIÓN / PLANNING BOARD
APÉNDICE ESTADÍSTICO • STATISTICAL APPENDIXINFORME ECONÓMICO AL GOBERNADOR 2016 • ECONOMIC REPORT TO THE GOVERNOR 2016
TABLA 29 - DEUDA PÚBLICA BRUTA DE PUERTO RICO: AL 30 DE JUNIO TABLE 29 - GROSS PUBLIC DEBT OF PUERTO RICO: AS OF JUNE 30(En millones de dólares - In millions of dollars)
2007 2008 2009 2010 2011 2012 2013 2014 2015 2016p
TOTAL 42,818.3 46,932.2 52,980.1 56,823.1 58,942.0 64,760.3 64,957.1 67,272.9 66,182.6 64,254.0 TOTAL
Empresas públicas 29,796.4 34,320.6 40,044.0 43,288.3 45,042.2 49,044.7 48,746.4 48,744.0 47,979.6 46,861.6 Public enterprises
Gobierno central Commonwealth central del E.L.A.* 10,558.9 9,792.2 9,938.8 10,303.4 10,362.8 11,844.1 12,328.7 14,336.0 14,076.9 13,481.4 government *
Municipios 2,463.0 2,819.4 2,997.3 3,231.4 3,537.0 3,871.5 3,882.0 4,192.9 4,126.1 3,911.0 Municipios
r- Cifras revisadas. r- Revised figures.p- Cifras preliminares. p- Preliminary figures. * En las cuentas sociales la Autoridad de Carreteras y * In the economic accounts the Highway and Transportation Authority Transportación y la Universidad de Puerto Rico se consideran and the University of Puerto Rico are considered as agencies como agencias del gobierno central. of the central government.
Fuente: Banco Gubernamental de Fomento para Puerto Rico. Source: Government Development Bank for Puerto Rico.
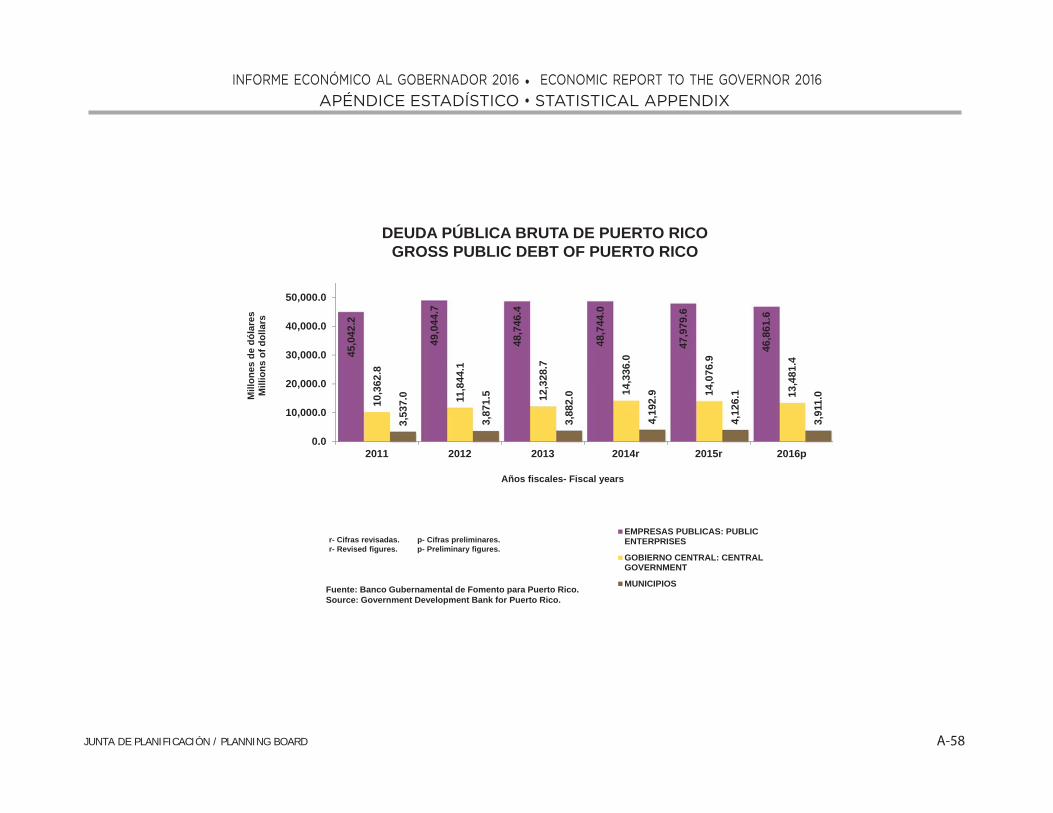
A-58 JUNTA DE PLANIFICACIÓN / PLANNING BOARD
APÉNDICE ESTADÍSTICO • STATISTICAL APPENDIXINFORME ECONÓMICO AL GOBERNADOR 2016 • ECONOMIC REPORT TO THE GOVERNOR 2016
DEUDA PÚBLICA BRUTA DE PUERTO RICOGROSS PUBLIC DEBT OF PUERTO RICO
45,0
42.2
49,0
44.7
48,7
46.4
48,7
44.0
47,9
79.6
46,8
61.6
10,3
62.8
11,8
44.1
12,3
28.7
14,3
36.0
14,0
76.9
13,4
81.4
3,53
7.0
3,87
1.5
3,88
2.0
4,19
2.9
4,12
6.1
3,91
1.0
0.0
10,000.0
20,000.0
30,000.0
40,000.0
50,000.0
2011 2012 2013 2014r 2015r 2016p
Mill
ones
de
dóla
res
Mill
ions
of d
olla
rs
Años fiscales- Fiscal years
EMPRESAS PUBLICAS: PUBLICENTERPRISES
GOBIERNO CENTRAL: CENTRALGOVERNMENT
MUNICIPIOSFuente: Banco Gubernamental de Fomento para Puerto Rico. Source: Government Development Bank for Puerto Rico.
r- Cifras revisadas. p- Cifras preliminares.r- Revised figures. p- Preliminary figures.

A-59 JUNTA DE PLANIFICACIÓN / PLANNING BOARD
APÉNDICE ESTADÍSTICO • STATISTICAL APPENDIXINFORME ECONÓMICO AL GOBERNADOR 2016 • ECONOMIC REPORT TO THE GOVERNOR 2016
TABLA 30 - ARBITRIOS Y GALONES MEDIDAS DE BEBIDAS ALCOHOLICAS: AÑOS FISCALESTABLE 30 - EXCISES TAX AND GALLONS OF ALCOHOLIC BEVERAGES: FISCAL YEARS(En miles de gallons - In thousands of gallons)
2010 2011 2012 2013 2014r 2015r 2016p
Espiritus Destilados - G.M. (1) Distilled spirits - W.G. (1)
Espíritus destilados no derivados de la caña de azúcar 854 839 915 933 806 705 920 Distilled spirits not derived from sugar cane Arbitrios Espiritus Destilados - G.M. (1) $ 31.29 $ 31.29 $ 31.29 $ 31.29 $ 31.29 $ 31.29 $ 31.29 Excise tax Distilled spirits not derived from sugar cane Espíritus destilados derivados de la caña de azúcar 1,800 1,652 1,095 583 536 588 575 Distilled spirits derived from sugar cane Arbitrio Espíritus destilados derivados de la caña de azúcar $ 15.12 $ 15.12 $ 15.12 $ 15.12 $ 15.12 $ 15.12 $ 15.12 Excise tax Distilled spirits derived from sugar cane Espíritus destilados derivados de la caña añejado 12 meses 0.00 0.00 617 1,387 1,505 1,534 1,336 Distilled spirits derived from sugar cane aged 12 months Arbitrio Espíritus destilados derivados de la caña añejado 12 meses $0.00 $0.00 $12.09 $12.09 $12.09 $12.09 12$ Excise tax Distilled spirits derived from sugar cane aged 12 months Producción artesanal de la caña con menos de 40% de alcohol Artisanal production of sugar cane with less than 40% alcohol por volumen 0 0 3 11 11 13 10 by volume Arbitrio producción artesanal con menos de 40% de alcohol Excise tax artisanal production with less than 40% alcohol por volumen $ 0.00 $ 0.00 $ 6.30 $ 6.30 $ 6.30 $ 6.30 $ 6.30 by volume
Total Galones 2,654 2,491 2,630 2,914 2,858 2,840 2,841 Total Gallons
Vinos - G.M. Wine - W.G.
Sidras y vinos 1,216 1,253 1,365 1,313 1,599 1,307 1,479 Cider and wine Arbitrio Sidras y vinos $ 12.05 $ 12.05 $ 12.05 $ 12.05 $ 12.05 $ 12.05 $ 12.05 Excise tax cider and wine Vinos de mostos concentrados 11 9 16 16 6 28 35 Concentrate wine must Arbitrio Vinos de mostos concentrados $ 4.48 $ 4.48 $ 7.00 $ 7.00 $ 7.00 $ 7.00 $ 7.00 Excise tax concentrate wine must Vinos de calidad sub-normal 1,486 1,322 1,206 1,336 1,301 1,038 925 Sub-normal quality wine Arbitrio Espíritus destilados derivados de la caña de azúcar $ 2.00 $ 2.00 $ 2.00 $ 2.00 $ 2.00 $ 2.00 $ 2.00 Excise tax Sub-normal quality wine Vinos de frutas tropicales 118 169 344 110 197 1,336 1,152 Tropical fruits wine Arbitrio Vinos de frutas tropicales $ 0.97 $ 0.97 $ 0.97 $ 0.97 $ 0.97 $ 0.97 $ 0.97 Excise tax tropical fruits wine Champaña y vinos espumosos o carbonatados 117 135 142 139 176 168 208 Champagne and sparkling wine or carbonates Arbitrio Champaña y vinos espumosos o carbonatados $ 14.45 $ 14.45 $ 14.45 $ 14.45 $ 14.45 $ 14.45 $ 14.45 Excise tax champagne and sparkling wine or carbonates Champaña y vinos espumosos o carbonatados subnormales 2 2 1 8 1 2 5 Champagne and wine sparkling or sub-normal carbonates Arbitrio Champaña y vinos espumosos o carbonatados subnormales $ 2.55 $ 2.55 $ 2.55 $ 2.55 $ 2.55 $ 2.55 $ 2.55 Excise tax champagne and wine sparkling or sub-normal carbonates Champaña, vinos espumosos o carbonatados Champagne, sparkling wine or carbonate de mostos concentrados a/ - - - - - from concentrate wine must Arbitro Champaña, vinos espumosos o carbonatados Excise tax champagne, sparkling wine or carbonate de mostos concentrados $ 5.50 $ 5.50 $ 5.50 $ 5.85 $ 5.85 $ 5.85 $ 5.85 from concentrate wine must
Total Galones 2,951 2,890 3,073 2,922 3,280 3,879 3,804 Total Gallons
Cervezas - G.M. Beer - W.G.
Cerveza producción entre 1-9,000,000 galones 8,525 8,646 9,108 8,616 9,440 9,158 8,994 Beer production 1-9,000,000 gallons Arbitrio Cerveza producción entre 1-9,000,000 galones $ 2.55 $ 2.55 $ 2.55 $ 2.55 $ 2.55 $ 2.55 $ 2.55 Excise tax Beer production 1-9,000,000 gallons Cerveza producción entre 9,000,001-10,000,000 galones 937 406 1,252 915 1,082 1,670 1,120 Beer production 9,000,001-10,000,000 gallons Arbitrio Cerveza producción entre 9,000,001-10,000,000 galones $ 2.76 $ 2.76 $ 2.76 $ 2.76 $ 2.76 $ 2.76 $ 2.76 Excise tax Beer production 9,000,001-10,000,000 gallons Cerveza producción entre 10,000,001-11,000,000 galones 626 990 1,000 999 1,000 510 819 Beer production 10,000,001-11,000,000 gallons Arbitrio Cerveza producción entre 10,000,001-11,000,000 galones $ 2.97 $ 2.97 $ 2.97 $ 2.97 $ 2.97 $ 2.97 $ 2.97 Excise tax Beer production 10,000,001-11,000,000 gallons Cerveza producción entre 11,000,001-12,000,000 galones 846 1,002 1,000 999 1,012 - 1,000 Beer production 11,000,001-12,000,000 gallons Arbitrio Cerveza producción entre 11,000,001-12,000,000 galones $ 3.18 $ 3.18 $ 3.18 $ 3.18 $ 3.18 $ 3.18 $ 3.18 Excise tax Beer production 11,000,001-12,000,000 gallons Cerveza producción entre 12,000,001-31,000,000 galones 8,666 6,673 6,701 7,417 7,426 6,784 7,482 Beer production 12,000,001-13,000,000 gallons Arbitrio Cerveza producción entre 12,000,001-31,000,000 galones $ 3.39 $ 3.39 $ 3.39 $ 3.39 $ 3.39 $ 3.39 $ 3.39 Excise tax Beer production 12,000,001-13,000,000 gallons Cerveza producción en exceso de 31 millones de galones 35,295 36,112 37,145 34,756 31,399 33,742 31,634 Beer production in excess of 31 millions gallons Arbitrio Cerveza producción en exceso de 31 millones de galones $ 4.35 $ 4.35 $ 4.35 $ 4.35 $ 4.35 $ 4.35 $ 4.35 Excise tax Beer production in excess of 31 millions gallons
Total Galones 54,895 53,828 56,205 53,632 51,359 51,864 51,049 Total Gallons
r- Cifras revisadas. r- Revised figures. p- Cifras preliminares. p- Preliminary figures.a/- Menos de 50,000 a/- Less than 50,000 (1) G.M.- Galones medida. (1) W.G.- Wine gallons.Fuente: Departamento de Hacienda Source: Department of the Treasury

A-60 JUNTA DE PLANIFICACIÓN / PLANNING BOARD
APÉNDICE ESTADÍSTICO • STATISTICAL APPENDIXINFORME ECONÓMICO AL GOBERNADOR 2016 • ECONOMIC REPORT TO THE GOVERNOR 2016
TABLA 31- ESTADISTICAS DEMOGRAFICAS SELECCIONADAS : AÑOS FISCALESTABLE 31- SELECTED DEMOGRAPHIC STATISTICS : FISCAL YEARS
2007 2008 2009 2010 2011 2012 2013 2014r 2015r 2016p
Población al 1ro de julio (En miles) 3,783 3,761 3,740 3,722 3,679 3,634 3,593 3,535 3,474 3,411 Population as of July 1st (In thousands)
Nacimientos (En miles) 47 46 45 42 41 39 37 34 34 31 Births (In thousands)
Defunciones (En miles) 29 29 29 30 30 30 29 30 30 28 Deaths (In thousands)
Nacimientos por cada 1,000 Births per 1,000 habitantes 12.4 12.1 12.0 11.3 11.1 10.7 10.3 9.6 9.8 9.1 population
Defunciones por cada 1,000 Deaths per 1,000 habitantes 7.8 7.7 7.8 8.1 8.2 8.3 8.1 8.5 8.6 8.2 population
Aumento natural por cada 1,000 Natural increase per 1,000 habitantes 4.6 4.4 4.3 3.2 3.0 2.5 2.2 1.1 1.2 0.9 population
p- Cifras preliminares. p- Preliminary figures.
Fuente: Negociado del Censo de E.U., División de Población Source: U.S. Bureau of the Census, Population Division (Population Estimates, Vintage 2016); Departamento de Salud (Population Estimates, Vintage 2016); Puerto Rico Department de Puerto Rico; y Junta de Planificación, Oficina del Censo. of Health; and Puerto Rico Planning Board, Office of the Census.

A-61 JUNTA DE PLANIFICACIÓN / PLANNING BOARD
APÉNDICE ESTADÍSTICO • STATISTICAL APPENDIXINFORME ECONÓMICO AL GOBERNADOR 2016 • ECONOMIC REPORT TO THE GOVERNOR 2016
TASA DE NATALIDAD Y MORTALIDAD POR CADA MIL HABITANTESBIRTH AND DEATH PER 1,000 POPULATION
11.1 10.7 10.39.6 9.8
9.18.2 8.3 8.1 8.5 8.6 8.2
0.0
2.0
4.0
6.0
8.0
10.0
12.0
2011 2012 2013 2014r 2015r 2016p
Porc
ient
o -P
erce
ntag
e
Años fiscales- Fiscal years
NATALIDAD: BIRTH RATEMORTALIDAD: DEATH RATE
Fuente: Negociado del Censo federal, División de Población; Departamento de Salud de Puerto Rico;y Junta de Planificación, Oficina del Censo.
Source: U.S. Bureau of the Census, Population Division; Puerto Rico Department of Health;and Puerto Rico Planning Board, Office of the Census.
r- Cifras revisadas. p- Cifras preliminares.r- Revised figures. p- Preliminary figures.
POBLACIÓN DE PUERTO RICO AL 1ro DE JULIOPOPULATION OF PUERTO RICO AS OF 1st OF JULY
3,6793,634
3,593
3,535
3,474
3,411
3,3003,3403,3803,4203,4603,5003,5403,5803,6203,6603,7003,740
2011 2012 2013 2014r 2015r 2016p
Mile
s de
per
sona
sTh
ousa
nds
of p
erso
ns
Años fiscales- Fiscal years
r- Cifras revisadas. p- Cifras preliminares.r- Revised figures. p- Preliminary figures.
Fuente: Negociado del Censo federal, División de Población; Departamento de Salud de Puerto Rico;y Junta de Planificación, Oficina del Censo.
Source: U.S. Bureau of the Census, Population Division; Puerto Rico Department of Health;and Puerto Rico Planning Board, Office of the Census.
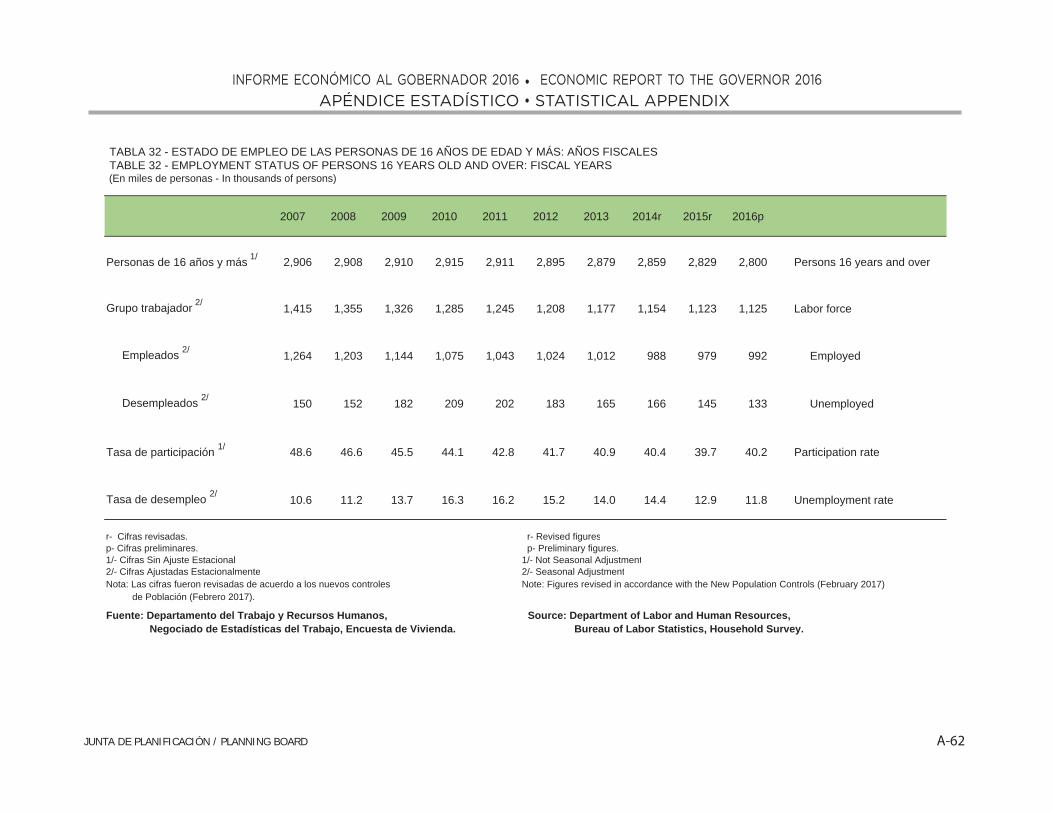
A-62 JUNTA DE PLANIFICACIÓN / PLANNING BOARD
APÉNDICE ESTADÍSTICO • STATISTICAL APPENDIXINFORME ECONÓMICO AL GOBERNADOR 2016 • ECONOMIC REPORT TO THE GOVERNOR 2016
TABLA 32 - ESTADO DE EMPLEO DE LAS PERSONAS DE 16 AÑOS DE EDAD Y MÁS: AÑOS FISCALES TABLE 32 - EMPLOYMENT STATUS OF PERSONS 16 YEARS OLD AND OVER: FISCAL YEARS (En miles de personas - In thousands of persons)
2007 2008 2009 2010 2011 2012 2013 2014r 2015r 2016p
Personas de 16 años y más 1/ 2,906 2,908 2,910 2,915 2,911 2,895 2,879 2,859 2,829 2,800 Persons 16 years and over
Grupo trabajador 2/ 1,415 1,355 1,326 1,285 1,245 1,208 1,177 1,154 1,123 1,125 Labor force
Empleados 2/ 1,264 1,203 1,144 1,075 1,043 1,024 1,012 988 979 992 Employed
Desempleados 2/ 150 152 182 209 202 183 165 166 145 133 Unemployed
Tasa de participación 1/ 48.6 46.6 45.5 44.1 42.8 41.7 40.9 40.4 39.7 40.2 Participation rate
Tasa de desempleo 2/ 10.6 11.2 13.7 16.3 16.2 15.2 14.0 14.4 12.9 11.8 Unemployment rate
r- Cifras revisadas. r- Revised figuresp- Cifras preliminares. p- Preliminary figures.1/- Cifras Sin Ajuste Estacional 1/- Not Seasonal Adjustment2/- Cifras Ajustadas Estacionalmente 2/- Seasonal AdjustmentNota: Las cifras fueron revisadas de acuerdo a los nuevos controles Note: Figures revised in accordance with the New Population Controls (February 2017) de Población (Febrero 2017).
Fuente: Departamento del Trabajo y Recursos Humanos, Source: Department of Labor and Human Resources, Negociado de Estadísticas del Trabajo, Encuesta de Vivienda. Bureau of Labor Statistics, Household Survey.

A-63 JUNTA DE PLANIFICACIÓN / PLANNING BOARD
APÉNDICE ESTADÍSTICO • STATISTICAL APPENDIXINFORME ECONÓMICO AL GOBERNADOR 2016 • ECONOMIC REPORT TO THE GOVERNOR 2016
TASA DE DESEMPLEOUNEMPLOYMENT RATE
16.2
15.2
14.0 14.3
13.0
11.7
9.0
11.0
13.0
15.0
17.0
2011 2012 2013 2014r 2015r 2016p
Porc
ient
o -P
erce
ntag
e
Años fiscales- Fiscal years
Fuente: Departamento del Trabajo y Recursos Humanos, Negociado de Estadísticas del Trabajo, Encuesta de Vivienda.Source: Department of Labor and Human Resources, Bureau of Labor Statistics, Household Survey.
r- Cifras revisadas. p- Cifras preliminares.r- Revised figures. p- Preliminary figures.

A-64 JUNTA DE PLANIFICACIÓN / PLANNING BOARD
APÉNDICE ESTADÍSTICO • STATISTICAL APPENDIXINFORME ECONÓMICO AL GOBERNADOR 2016 • ECONOMIC REPORT TO THE GOVERNOR 2016
TASA DE PARTICIPACIÓNPARTICIPATION RATES
42.841.7
41.0 40.539.9 40.3
35.0
37.0
39.0
41.0
43.0
45.0
47.0
2011 2012 2013 2014r 2015r 2016p
Porc
ient
o-P
erce
ntag
e
Años fiscales- Fiscal years
Fuente: Departamento del Trabajo y Recursos Humanos, Negociado de Estadísticas del Trabajo, Encuesta de Vivienda.Source: Department of Labor and Human Resources, Bureau of Labor Statistics, Household Survey.
r- Cifras revisadas. p- Cifras preliminares.r- Revised figures. p- Preliminary figures.
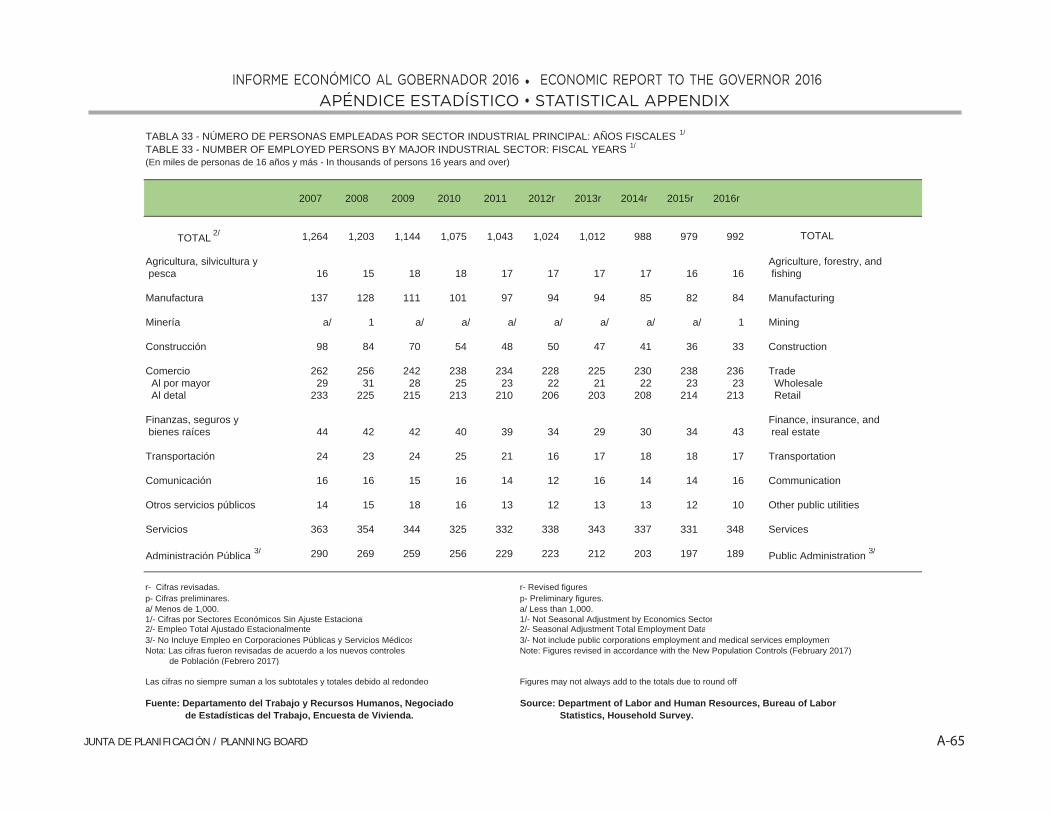
A-65 JUNTA DE PLANIFICACIÓN / PLANNING BOARD
APÉNDICE ESTADÍSTICO • STATISTICAL APPENDIXINFORME ECONÓMICO AL GOBERNADOR 2016 • ECONOMIC REPORT TO THE GOVERNOR 2016
TABLA 33 - NÚMERO DE PERSONAS EMPLEADAS POR SECTOR INDUSTRIAL PRINCIPAL: AÑOS FISCALES 1/
TABLE 33 - NUMBER OF EMPLOYED PERSONS BY MAJOR INDUSTRIAL SECTOR: FISCAL YEARS 1/
(En miles de personas de 16 años y más - In thousands of persons 16 years and over)
2007 2008 2009 2010 2011 2012r 2013r 2014r 2015r 2016r
TOTAL 2/ 1,264 1,203 1,144 1,075 1,043 1,024 1,012 988 979 992 TOTAL
Agricultura, silvicultura y Agriculture, forestry, and pesca 16 15 18 18 17 17 17 17 16 16 fishing
Manufactura 137 128 111 101 97 94 94 85 82 84 Manufacturing
Minería a/ 1 a/ a/ a/ a/ a/ a/ a/ 1 Mining
Construcción 98 84 70 54 48 50 47 41 36 33 Construction
Comercio 262 256 242 238 234 228 225 230 238 236 Trade Al por mayor 29 31 28 25 23 22 21 22 23 23 Wholesale Al detal 233 225 215 213 210 206 203 208 214 213 Retail
Finanzas, seguros y Finance, insurance, and bienes raíces 44 42 42 40 39 34 29 30 34 43 real estate
Transportación 24 23 24 25 21 16 17 18 18 17 Transportation
Comunicación 16 16 15 16 14 12 16 14 14 16 Communication
Otros servicios públicos 14 15 18 16 13 12 13 13 12 10 Other public utilities
Servicios 363 354 344 325 332 338 343 337 331 348 Services
Administración Pública 3/ 290 269 259 256 229 223 212 203 197 189 Public Administration 3/
r- Cifras revisadas. r- Revised figuresp- Cifras preliminares. p- Preliminary figures.a/ Menos de 1,000. a/ Less than 1,000.1/- Cifras por Sectores Económicos Sin Ajuste Estacional 1/- Not Seasonal Adjustment by Economics Sector2/- Empleo Total Ajustado Estacionalmente 2/- Seasonal Adjustment Total Employment Data3/- No Incluye Empleo en Corporaciones Públicas y Servicios Médicos 3/- Not include public corporations employment and medical services employmentNota: Las cifras fueron revisadas de acuerdo a los nuevos controles Note: Figures revised in accordance with the New Population Controls (February 2017) de Población (Febrero 2017).
Las cifras no siempre suman a los subtotales y totales debido al redondeo Figures may not always add to the totals due to round off
Fuente: Departamento del Trabajo y Recursos Humanos, Negociado Source: Department of Labor and Human Resources, Bureau of Labor de Estadísticas del Trabajo, Encuesta de Vivienda. Statistics, Household Survey.

A-66 JUNTA DE PLANIFICACIÓN / PLANNING BOARD
APÉNDICE ESTADÍSTICO • STATISTICAL APPENDIXINFORME ECONÓMICO AL GOBERNADOR 2016 • ECONOMIC REPORT TO THE GOVERNOR 2016
EMPLEO TOTAL: ENCUESTA DE VIVIENDATOTAL EMPLOYMENT: HOUSEHOLD SURVEY
1,043 1,025 1,015 993 984 1,002
0
200
400
600
800
1,000
1,200
2011 2012 2013 2014r 2015r 2016p
Mile
s de
per
sona
sTh
ousa
nds
of p
erso
ns
Años fiscales- Fiscal years
Fuente: Departamento del Trabajo y Recursos Humanos, Negociado de Estadísticas del Trabajo, Encuesta de Vivienda.Source: Department of Labor and Human Resources, Bureau of Labor Statistics, Household Survey.
r- Cifras revisadas. p- Cifras preliminares.r- Revised figures. p- Preliminary figures.

A-67 JUNTA DE PLANIFICACIÓN / PLANNING BOARD
APÉNDICE ESTADÍSTICO • STATISTICAL APPENDIXINFORME ECONÓMICO AL GOBERNADOR 2016 • ECONOMIC REPORT TO THE GOVERNOR 2016
GRUPO TRABAJADORLABOR FORCE
1,245 1,208 1,180 1,1591,130
1,1341,043 1,025 1,015
993 984 1,002
201
183
165 166
147
133
100.0
120.0
140.0
160.0
180.0
200.0
220.0
600.0700.0800.0900.0
1,000.01,100.01,200.01,300.01,400.01,500.0
2011 2012 2013 2014r 2015r 2016p
Mile
s de
per
sona
sTh
ousa
nds
of p
erso
ns
Años fiscales- Fiscal years
TOTALEMPLEADOS: EMPLOYMENTDESEMPLEADOS: UNEMPLOYED
Fuente: Departamento del Trabajo y Recursos Humanos, Negociado de Estadísticas del Trabajo, Encuesta de Vivienda.Source: Department of Labor and Human Resources, Bureau of Labor Statistics, Household Survey.
r- Cifras revisadas. p- Cifras preliminares.r- Revised figures. p- Preliminary figures.
NÚMERO DE PERSONAS EMPLEADASNUMBER OF EMPLOYED PERSONS
1,043.01,025.0
1,015.0
993.0984.0
1,002.0
923.6931.3 937.2
917.2905.6
894.9
870.0
970.0
1,070.0
2011 2012 2013 2014r 2015r 2016p
Mile
s de
per
sona
sTh
ousa
nds
of p
erso
n
Años fiscales- Fiscal years
ENCUESTA DE VIVIENDA: HOUSEHOLD SURVEY
ENCUESTA DE ESTABLECIMIENTOS: ESTABLISHMENT SURVEY
r- Cifras revisadas. p- Cifras preliminares.r- Revised figures. p- Preliminary figures.
Fuente: Departamento del Trabajo y Recursos Humanos, Negociado de Estadísticas del Trabajo, Encuesta de Vivienda.Source: Department of Labor and Human Resources, Bureau of Labor Statistics, Household Survey.

A-68 JUNTA DE PLANIFICACIÓN / PLANNING BOARD
APÉNDICE ESTADÍSTICO • STATISTICAL APPENDIXINFORME ECONÓMICO AL GOBERNADOR 2016 • ECONOMIC REPORT TO THE GOVERNOR 2016
TABLA 34 - NUMERO DE PERSONAS EMPLEADAS EN ESTABLECIMIENTOS POR SECTOR INDUSTRIAL PRINCIPAL: AÑOS FISCALESTABLE 34 - NUMBER OF EMPLOYED PERSONS IN ESTABLISHMENTS BY MAJOR INDUSTRIAL SECTOR: FISCAL YEARS(En miles de personas - In thousands of persons)
2007 2008 2009 2010 2011 2012 2013 2014 2015 2016r
Total No Agrícola 1,036.9 1,024.5 995.4 942.8 923.9 932.1 936.8 916.8 905.4 895.2 Total Non Farm
Minería, Tala y Construcción 64.7 59.6 49.1 36.3 32.1 35.2 33.7 28.3 26.7 23.9 Mining, Logging & Construction Minería y Tala 1/ 1.5 1.3 1.0 0.8 0.7 0.7 0.8 0.7 0.6 0.5 Mining & Logging 1/ Construcción 1/ 63.2 58.4 48.1 35.5 31.3 34.3 33.0 27.6 26.3 23.4 Construction 1/
Manufactura 107.8 104.0 96.7 88.3 85.7 83.5 78.7 75.5 75.0 74.0 Manufacturing
Comercio, Transportación y Utilidades 184.1 181.5 176.4 173.5 174.4 174.4 176.8 176.8 174.4 173.7 Trade, Transportation & Utilities Comercio al por mayor 33.3 33.7 33.3 32.7 32.0 31.5 31.6 31.0 30.4 29.6 Wholesale trade Comercio al detal 133.8 131.0 127.4 126.2 128.1 128.2 130.6 131.0 129.2 128.7 Retail trade Transportación, Almacenaje y Utilidades 1/ 17.0 16.7 15.7 14.6 14.4 14.6 14.7 14.8 14.8 15.4 Transportation, Warehouse and Utilities 1/
Información 22.6 21.4 20.2 18.8 18.8 18.7 19.2 19.7 20.0 18.6 Information
Finanzas 49.1 48.5 48.5 45.8 43.7 44.4 44.4 43.4 42.5 42.3 Financial Industries
Servicios Profesionales y Comerciales 108.9 108.2 103.6 102.8 105.5 108.9 112.6 114.8 112.8 113.2 Professional and Business Services
Servicios Educativos y de Salud 105.4 108.6 109.9 111.4 114.2 117.6 122.1 123.1 123.3 122.4 Educational and Health Services
Recreación y Alojamiento 73.6 73.4 71.0 71.1 71.1 72.9 77.0 79.5 80.5 81.0 Leisure and Hospitality
Otros Servicios 21.9 21.2 20.1 18.7 17.9 17.6 17.9 18.0 17.9 17.4 Other Services
Gobierno 298.9 298.2 299.8 276.1 260.5 259.0 254.5 237.9 232.4 228.7 Government Gobierno Federal 14.7 14.8 15.1 16.6 14.9 14.5 14.3 13.9 14.0 14.3 Federal Government Gobierno Estatal 222.2 218.8 217.7 197.7 185.8 184.2 179.7 168.8 163.4 159.3 State Government Gobierno Municipal 62.0 64.5 67.1 61.8 59.7 60.3 60.6 55.2 54.9 55.1 Local Government
r- Cifras revisadas. r- Revised figures.
1/ Cifras sin ajustes estacionales 1/ Not seasonally adjusted figures
Nota: Las cifras no siempre suman a los subtotales y totales debido al redondeo. Note: Figures may not always add to the totals due to round off.
Fuente: Departamento del Trabajo y Recursos Humanos, Negociado de Estadísticas Source: Department of Labor and Human Resources, Bureau of Labor del Trabajo, Encuesta de Establecimientos (Empleo Asalariado No Agrícola). Statistics, Establishment Survey (Non Farm Employment).

JUNTA DE PLANIFICACIÓN / PLANNING BOARD A-69
APÉNDICE ESTADÍSTICO • STATISTICAL APPENDIXINFORME ECONÓMICO AL GOBERNADOR 2016 • ECONOMIC REPORT TO THE GOVERNOR 2016
TASAS DE CRECIMIENTOGROWTH RATES

A-70 JUNTA DE PLANIFICACIÓN / PLANNING BOARD
APÉNDICE ESTADÍSTICO • STATISTICAL APPENDIXINFORME ECONÓMICO AL GOBERNADOR 2016 • ECONOMIC REPORT TO THE GOVERNOR 2016

JUNTA DE PLANIFICACIÓN / PLANNING BOARD A-71
APÉNDICE ESTADÍSTICO • STATISTICAL APPENDIXINFORME ECONÓMICO AL GOBERNADOR 2016 • ECONOMIC REPORT TO THE GOVERNOR 2016
INTERPRETACIÓN DE LOS CUADROS DE TASASDE CRECIMIENTO ANUAL
Esta sección del Apéndice Estadístico del Informe Económico al Gobernador y a la Asamblea Legislativa 2016 incluye cuadros con las tasas de crecimiento para los años fi scales 1992 al 2016 correspondientes a las siguientes variables económicas:
1. Producto bruto 2. Producto bruto per cápita 3. Gastos de consumo personal 4. Gastos de consumo personal per cápita 5. Gastos de consumo personal de bienes duraderos 6. Gastos de consumo personal de bienes no duraderos 7. Gastos de consumo personal de servicios 8. Gastos de consumo del gobierno 9. Inversión interna bruta de capital fi jo 10. Inversión en construcción 11. Inversión en construcción de vivienda privada 12. Inversión en maquinaria y equipo 13. Producto interno bruto 14. Producto interno bruto per cápita
Los cuadros para estas variables se presentan a precios corrientes y constantes en los casos donde corresponda. Cada uno de éstos contiene las tasas de crecimiento anual para dos años en específi co, cualesquiera que éstos sean para la serie presentada en esta publicación. Los cuadros están divididos por una línea diagonal formando dos triángulos. Las tasas de crecimiento a precios corrientes se presentan en el triángulo inferior y las tasas de crecimiento a precios constantes en el triángulo superior. La ventaja de este ordenamiento es que permite comparar directamente, entre dos años dados, la tasa de crecimiento monetario con la tasa de crecimiento real de una determinada variable macroeconómica.
El cuadro se lee igual que el sistema de coordenadas cartesianas. Tanto en el eje de las abscisas (eje horizontal) como en el de las ordenadas (eje vertical) aparecen los años. En el punto o celda de intersección de dos años dados aparece la tasa de crecimiento para el periodo.
Si se interesa obtener la tasa de crecimiento de una variable a precios corrientes entre dos años dados, se busca primeramente en el eje vertical el año más reciente y se mueve en dirección horizontal hacia la derecha, hasta encontrar la intersección con el otro año. El valor que aparece en la celda de intersección es la tasa de crecimiento monetario durante el periodo. En cambio, si lo que se interesa es obtener la tasa de crecimiento a precios constantes de la misma variable, se busca primeramente en el eje horizontal (en el tope del cuadro) el año más reciente y se mueve en dirección vertical, hasta encontrar la intersección con el otro año. De este modo, se obtiene la tasa de crecimiento real durante el periodo. Al realizar el procedimiento conviene recordar que se debe partir del año más reciente.
15. Ingreso personal 16. Ingreso personal per cápita 17. Ingreso personal disponible 18. Ingreso personal disponible per cápita 19. Ingreso neto 20. Ingreso neto per cápita 21. Índices implícitos de precios para defl acionar el producto bruto 22. Índice implícito de precios para defl acionar los gastos
de consumo personal 23. Empleo 24. Desempleo 25. Población 26. Deuda pública bruta de Puerto Rico

A-72 JUNTA DE PLANIFICACIÓN / PLANNING BOARD
APÉNDICE ESTADÍSTICO • STATISTICAL APPENDIXINFORME ECONÓMICO AL GOBERNADOR 2016 • ECONOMIC REPORT TO THE GOVERNOR 2016
INTERPRETATION OF THE ANNUAL GROWTH RATES TABLES
This section of the Statistical Appendix of the Economic Report to the Governor and to the Legislative Assembly 2016 includes growth rates tables for fi scal years 1992 through 2016, corresponding to the following economic variables:
1. Gross Product 2. Per Capita Gross Product 3. Personal Consumption Expenditures 4. Per Capita Personal Consumption Expenditures 5. Durable Goods Personal Consumption Expenditures 6. Non-Durable Goods Personal Consumption Expenditures 7. Personal Consumption Expenditures of Services 8. Government Consumption Expenditures 9. Gross Fixed Domestic Investment 10. Construction Investment 11. Private Housing Construction Investment 12. Machinery and Equipment Investment 13. Gross Domestic Product The tables for these variables are presented at current and constant prices where applicable. Each one of these contains the annual growth rates for specifi cally two years, whichever they are for the series presented in this publication. The tables are divided by a diagonal line forming two triangles. The growth rates at current prices are at the lower triangle and the growth rates at constant prices are at the upper triangle. The advantage of this layout is that it permits a direct comparison, between two years, of the nominal growth rate with the real growth rate of a determined macroeconomic variable.
The table is read the same as in Cartesian coordinates. The years appear at both the abscissas axis (horizontal axis) as well as that of the ordinates (vertical axis). At the intersection point or cell for two given years, the growth rate for such period appears.
If one is interested in obtaining a variable’s growth rate at current prices between two given years, fi rst look at the vertical axis for the most recent year and move towards horizontally to the right, until the other year’s intersection is found. The value appearing at the intersection cell is the nominal growth rate during such period. On the other hand, if one is interested in obtaining the constant growth rate for the same variable, look fi rst the horizontal axis (at the top of the table) of the most recent year and move in a vertical direction, until the intersection with the other year is found. Hence, the real growth rate during such period is obtained. While doing the procedure it is convenient to remember that you must start from the most recent year.
14. Per Capita Gross Domestic Product 15. Personal Income 16. Personal Per Capita Income 17. Disposable Personal Income 18. Per Capita Disposable Personal Income 19. Net Income 20. Per Capita Net Income 21. Implicit Price Defl ators for Gross Product 22. Implicit Price Defl ators for Personal Consumption Expenditures 23. Employment 24. Unemployment 25. Population 26. Gross Public Debt of Puerto Rico

JUNTA DE PLANIFICACIÓN / PLANNING BOARD A-73
APÉNDICE ESTADÍSTICO • STATISTICAL APPENDIXINFORME ECONÓMICO AL GOBERNADOR 2016 • ECONOMIC REPORT TO THE GOVERNOR 2016
1992 1993 1994 1995 1996 1997 1998 1999 2000 2001 2002 2003 2004 2005 2006 2007 2008 2009 2010 2011 2012 2013 2014 2015 20161992 ===1993 === O1994 === PRECIOS CONSTANTES - CONSTANT PRICES R1995 === D1996 === E1997 === 1954=100 N1998 === A1999 === D2000 === DIAGONAL A2001 === -2002 ABSCISA - ABSCISSA === O2003 === R2004 === D2005 === I2006 === N2007 PRECIOS CORRIENTES - CURRENT PRICES === A2008 === T2009 === E2010 ===2011 ===2012 ===2013 ===2014 ===2015 ===2016 ===
TASAS DE CRECIMIENTO ANUALANNUAL GROWTH RATES

A-74 JUNTA DE PLANIFICACIÓN / PLANNING BOARD
APÉNDICE ESTADÍSTICO • STATISTICAL APPENDIXINFORME ECONÓMICO AL GOBERNADOR 2016 • ECONOMIC REPORT TO THE GOVERNOR 2016
1
2
1992 1993 1994 1995 1996 1997 1998 1999 2000 2001 2002 2003 2004 2005 2006 2007 2008 2009 2010 2011 2012 2013 2014 2015 2016
1992 === 3.3 2.9 3.1 3.1 3.2 3.2 3.3 3.8 3.6 3.2 3.1 3.0 3.0 2.8 2.5 2.2 1.8 1.5 1.3 1.3 1.2 1.1 1.0 0.91993 6.1 === 2.5 3.0 3.1 3.2 3.2 3.3 3.9 3.6 3.2 3.0 3.0 2.9 2.7 2.4 2.1 1.7 1.4 1.2 1.2 1.1 1.0 0.9 0.81994 6.0 6.0 === 3.4 3.4 3.4 3.3 3.5 4.1 3.8 3.2 3.1 3.1 3.0 2.7 2.4 2.1 1.6 1.3 1.1 1.1 1.0 0.9 0.8 0.7
P C 1995 6.3 6.4 6.8 === 3.3 3.3 3.3 3.5 4.3 3.8 3.2 3.1 3.0 2.9 2.7 2.4 1.9 1.5 1.2 1.0 1.0 0.9 0.8 0.7 0.6R U 1996 6.4 6.5 6.7 6.7 === 3.4 3.3 3.6 4.5 3.9 3.2 3.0 3.0 2.9 2.6 2.3 1.8 1.4 1.0 0.8 0.8 0.8 0.6 0.6 0.5E R 1997 6.4 6.5 6.7 6.6 6.5 === 3.2 3.6 4.9 4.0 3.2 3.0 2.9 2.8 2.5 2.2 1.7 1.2 0.8 0.7 0.7 0.6 0.5 0.4 0.3C R 1998 6.8 6.9 7.1 7.3 7.5 8.6 === 4.1 5.8 4.3 3.1 2.9 2.9 2.7 2.5 2.0 1.5 1.0 0.6 0.5 0.5 0.4 0.3 0.2 0.2I E 1999 7.1 7.3 7.5 7.7 8.0 8.8 9.0 === 7.5 4.4 2.8 2.6 2.6 2.5 2.2 1.8 1.3 0.7 0.3 0.2 0.2 0.2 0.0 0.0 -0.1O N 2000 7.6 7.8 8.1 8.3 8.8 9.5 10.0 10.9 === 1.5 0.6 1.1 1.5 1.6 1.4 1.0 0.5 0.0 -0.3 -0.5 -0.4 -0.4 -0.5 -0.5 -0.5S T 2001 7.4 7.6 7.8 8.0 8.2 8.7 8.7 8.5 6.2 === -0.3 0.9 1.5 1.6 1.4 0.9 0.4 -0.2 -0.5 -0.7 -0.6 -0.5 -0.6 -0.6 -0.6
2002 6.9 6.9 7.1 7.1 7.2 7.3 7.0 6.3 4.1 2.0 === 2.1 2.4 2.2 1.8 1.2 0.5 -0.1 -0.6 -0.7 -0.6 -0.5 -0.6 -0.6 -0.7C P 2003 6.7 6.8 6.9 6.9 6.9 7.0 6.7 6.1 4.5 3.7 5.4 === 2.7 2.3 1.7 1.0 0.2 -0.5 -0.9 -1.0 -0.9 -0.8 -0.9 -0.9 -0.9O R 2004 6.7 6.8 6.9 6.9 6.9 7.0 6.7 6.2 5.1 4.7 6.1 6.9 === 1.9 1.2 0.4 -0.4 -1.1 -1.5 -1.6 -1.3 -1.2 -1.2 -1.2 -1.2R I 2005 6.7 6.7 6.8 6.8 6.8 6.8 6.6 6.2 5.3 5.0 6.0 6.4 5.9 === 0.5 -0.4 -1.2 -1.9 -2.2 -2.1 -1.7 -1.5 -1.6 -1.5 -1.4R C 2006 6.6 6.6 6.7 6.7 6.7 6.7 6.4 6.1 5.3 5.1 5.9 6.1 5.7 5.5 === -1.2 -2.0 -2.6 -2.9 -2.6 -2.1 -1.8 -1.8 -1.7 -1.6I E 2007 6.5 6.5 6.5 6.5 6.5 6.5 6.3 5.9 5.2 5.1 5.7 5.7 5.4 5.1 4.8 === -2.9 -3.3 -3.4 -3.0 -2.3 -1.9 -1.9 -1.8 -1.7E S 2008 6.3 6.3 6.3 6.3 6.2 6.2 6.0 5.6 5.0 4.8 5.3 5.3 4.9 4.6 4.1 3.4 === -3.8 -3.7 -3.0 -2.2 -1.8 -1.8 -1.6 -1.5N 2009 6.0 6.0 6.0 5.9 5.9 5.8 5.6 5.2 4.6 4.4 4.7 4.6 4.2 3.8 3.2 2.4 1.5 === -3.6 -2.6 -1.6 -1.2 -1.3 -1.2 -1.2T 2010 5.7 5.7 5.7 5.6 5.5 5.4 5.2 4.8 4.2 4.0 4.3 4.1 3.7 3.2 2.7 2.0 1.3 1.1 === -1.7 -0.6 -0.4 -0.8 -0.7 -0.8E 2011 5.5 5.5 5.5 5.4 5.3 5.2 4.9 4.6 4.1 3.8 4.0 3.9 3.5 3.1 2.6 2.0 1.6 1.6 2.2 === 0.5 0.2 -0.5 -0.5 -0.6S 2012 5.4 5.4 5.4 5.3 5.2 5.1 4.8 4.5 4.0 3.8 4.0 3.8 3.5 3.1 2.8 2.3 2.1 2.3 2.9 3.6 === -0.1 -1.0 -0.9 -0.9
2013 5.2 5.2 5.1 5.0 4.9 4.8 4.6 4.3 3.8 3.6 3.7 3.6 3.2 2.9 2.5 2.2 1.9 2.0 2.4 2.4 1.3 === -1.8 -1.2 -1.22014 5.0 4.9 4.9 4.8 4.7 4.5 4.3 4.0 3.5 3.3 3.4 3.2 2.9 2.5 2.2 1.8 1.6 1.6 1.7 1.5 0.5 -0.2 === -0.7 -0.92015 4.8 4.7 4.7 4.6 4.5 4.3 4.1 3.8 3.3 3.1 3.2 3.1 2.7 2.4 2.1 1.7 1.5 1.5 1.6 1.4 0.7 0.5 1.1 === -1.12016 4.6 4.6 4.5 4.4 4.3 4.2 3.9 3.6 3.2 3.0 3.1 2.9 2.6 2.3 1.9 1.6 1.4 1.4 1.5 1.3 0.7 0.6 1.0 0.8 ===
P R E C I O S C O N S T A N T E S - C O N S T A N T P R I C E S
TASAS DE CRECIMIENTO ANUAL DEL PRODUCTO BRUTOGROSS PRODUCT
1992 1993 1994 1995 1996 1997 1998 1999 2000 2001 2002 2003 2004 2005 2006 2007 2008 2009 2010 2011 2012 2013 2014 2015 2016
1992 === 2.6 2.1 2.2 2.2 2.2 2.3 2.5 3.0 2.8 2.5 2.4 2.5 2.4 2.3 2.1 1.8 1.5 1.2 1.1 1.2 1.2 1.1 1.1 1.11993 5.3 === 1.6 2.1 2.1 2.2 2.2 2.4 3.1 2.9 2.5 2.4 2.4 2.4 2.3 2.1 1.8 1.4 1.2 1.1 1.1 1.1 1.0 1.0 1.01994 5.2 5.1 === 2.5 2.4 2.4 2.4 2.6 3.3 3.0 2.6 2.5 2.5 2.5 2.3 2.1 1.8 1.4 1.1 1.0 1.1 1.1 1.0 1.0 1.0
P C 1995 5.4 5.4 5.8 === 2.2 2.3 2.3 2.6 3.5 3.1 2.6 2.5 2.5 2.5 2.3 2.1 1.7 1.4 1.1 0.9 1.0 1.0 0.9 0.9 0.9R U 1996 5.4 5.5 5.7 5.6 === 2.3 2.4 2.8 3.8 3.3 2.7 2.6 2.6 2.5 2.3 2.0 1.7 1.3 1.0 0.8 0.9 0.9 0.8 0.8 0.8E R 1997 5.4 5.5 5.6 5.5 5.5 === 2.5 3.0 4.3 3.5 2.7 2.6 2.6 2.5 2.3 2.0 1.6 1.2 0.9 0.7 0.8 0.8 0.8 0.8 0.8C R 1998 5.8 5.9 6.2 6.3 6.6 7.7 === 3.5 5.3 3.9 2.8 2.6 2.6 2.5 2.3 2.0 1.5 1.1 0.7 0.6 0.7 0.7 0.6 0.7 0.7I E 1999 6.2 6.3 6.6 6.8 7.2 8.1 8.4 === 7.1 4.1 2.6 2.4 2.5 2.4 2.1 1.8 1.3 0.9 0.5 0.4 0.5 0.5 0.5 0.5 0.5O N 2000 6.7 6.9 7.2 7.5 8.0 8.9 9.5 10.5 === 1.2 0.4 0.9 1.3 1.5 1.3 1.0 0.6 0.2 -0.2 -0.2 -0.1 0.0 0.0 0.1 0.1S T 2001 6.6 6.8 7.1 7.3 7.6 8.1 8.3 8.2 5.9 === -0.5 0.7 1.4 1.5 1.4 1.0 0.5 0.1 -0.3 -0.4 -0.2 -0.1 -0.1 0.0 0.0
2002 6.1 6.2 6.4 6.5 6.6 6.9 6.6 6.0 3.9 1.8 === 2.0 2.3 2.2 1.8 1.3 0.7 0.1 -0.3 -0.3 -0.1 0.0 -0.1 0.0 0.1C P 2003 6.1 6.1 6.3 6.3 6.4 6.6 6.4 5.9 4.3 3.6 5.3 === 2.6 2.3 1.8 1.2 0.5 -0.2 -0.6 -0.6 -0.4 -0.2 -0.2 -0.1 -0.1O R 2004 6.1 6.2 6.3 6.4 6.5 6.6 6.4 6.0 5.0 4.6 6.1 6.8 === 2.0 1.4 0.7 -0.1 -0.7 -1.1 -1.1 -0.7 -0.5 -0.5 -0.4 -0.3R I 2005 6.1 6.2 6.3 6.3 6.4 6.5 6.4 6.0 5.2 5.0 6.0 6.4 5.9 === 0.8 0.0 -0.8 -1.4 -1.7 -1.6 -1.1 -0.8 -0.8 -0.6 -0.5R C 2006 6.1 6.2 6.2 6.3 6.4 6.5 6.3 6.0 5.3 5.1 6.0 6.2 5.8 5.8 === -0.7 -1.5 -2.1 -2.3 -2.0 -1.4 -1.1 -1.0 -0.8 -0.6I E 2007 6.0 6.1 6.2 6.2 6.3 6.3 6.2 5.9 5.3 5.2 5.8 6.0 5.7 5.6 5.4 === -2.3 -2.8 -2.9 -2.4 -1.6 -1.1 -1.0 -0.8 -0.6E S 2008 5.9 6.0 6.0 6.0 6.1 6.1 6.0 5.7 5.1 5.0 5.5 5.6 5.3 5.0 4.7 4.0 === -3.3 -3.2 -2.4 -1.4 -0.9 -0.8 -0.6 -0.4N 2009 5.7 5.7 5.7 5.7 5.8 5.8 5.6 5.3 4.8 4.6 5.0 5.0 4.6 4.3 3.8 3.0 2.0 === -3.1 -2.0 -0.8 -0.3 -0.3 -0.1 0.0T 2010 5.4 5.5 5.5 5.5 5.5 5.5 5.3 5.0 4.4 4.3 4.6 4.5 4.1 3.7 3.2 2.5 1.8 1.6 === -0.9 0.4 0.6 0.4 0.5 0.5E 2011 5.3 5.3 5.3 5.3 5.3 5.3 5.1 4.8 4.3 4.2 4.4 4.3 3.9 3.6 3.2 2.7 2.2 2.3 3.1 === 1.7 1.4 0.8 0.9 0.8S 2012 5.3 5.3 5.3 5.3 5.3 5.2 5.1 4.8 4.4 4.2 4.5 4.4 4.1 3.8 3.5 3.1 2.9 3.2 3.9 4.8 === 1.1 0.3 0.6 0.6
2013 5.2 5.2 5.2 5.1 5.1 5.1 4.9 4.6 4.2 4.1 4.3 4.2 3.9 3.6 3.3 3.0 2.8 3.0 3.4 3.6 2.5 === -0.4 1.0 0.42014 5.0 5.0 5.0 4.9 4.9 4.8 4.7 4.4 4.0 3.8 4.0 3.9 3.6 3.4 3.1 2.7 2.5 2.6 2.9 2.8 1.8 1.2 === 1.0 0.92015 4.9 4.9 4.9 4.8 4.8 4.7 4.6 4.3 3.9 3.8 3.9 3.8 3.5 3.3 3.0 2.7 2.6 2.7 2.9 2.8 2.2 2.0 2.9 === 0.72016 4.8 4.8 4.8 4.7 4.7 4.6 4.4 4.2 3.8 3.7 3.8 3.7 3.5 3.2 3.0 2.7 2.6 2.7 2.8 2.8 2.3 2.2 2.7 2.6 ===
P R E C I O S C O N S T A N T E S - C O N S T A N T P R I C E S
TASAS DE CRECIMIENTO ANUAL DEL PRODUCTO BRUTO PER CÁPITAPER CAPITA GROSS PRODUCT

JUNTA DE PLANIFICACIÓN / PLANNING BOARD A-75
APÉNDICE ESTADÍSTICO • STATISTICAL APPENDIXINFORME ECONÓMICO AL GOBERNADOR 2016 • ECONOMIC REPORT TO THE GOVERNOR 2016
3
4
3
1992 1993 1994 1995 1996 1997 1998 1999 2000 2001 2002 2003 2004 2005 2006 2007 2008 2009 2010 2011 2012 2013 2014 2015 2016
1992 = 5.0 5.0 5.0 5.3 5.4 5.3 5.3 5.5 5.0 4.8 4.7 4.6 4.5 4.2 4.0 3.7 3.3 3.2 3.1 3.1 3.0 2.7 2.5 2.31993 6.0 = 5.0 5.1 5.4 5.5 5.3 5.3 5.5 5.0 4.8 4.6 4.6 4.4 4.2 4.0 3.6 3.2 3.1 3.0 3.0 2.9 2.6 2.4 2.21994 6.5 7.1 = 5.1 5.7 5.7 5.4 5.4 5.6 5.0 4.7 4.6 4.6 4.4 4.1 3.9 3.5 3.1 3.0 2.9 2.9 2.8 2.5 2.3 2.1
P C 1995 6.4 6.6 6.1 = 6.2 6.0 5.5 5.4 5.7 5.0 4.7 4.5 4.5 4.3 4.0 3.8 3.4 2.9 2.8 2.8 2.7 2.7 2.4 2.1 1.9R U 1996 6.6 6.8 6.7 7.4 = 5.8 5.1 5.2 5.6 4.8 4.4 4.3 4.3 4.1 3.8 3.6 3.2 2.7 2.6 2.5 2.5 2.5 2.2 1.9 1.7E R 1997 6.9 7.1 7.1 7.6 7.8 = 4.4 4.9 5.5 4.5 4.2 4.0 4.1 3.9 3.6 3.4 2.9 2.4 2.4 2.3 2.3 2.3 1.9 1.7 1.5C R 1998 6.8 7.0 7.0 7.3 7.2 6.6 = 5.4 6.1 4.5 4.1 4.0 4.0 3.8 3.5 3.2 2.8 2.3 2.2 2.1 2.2 2.1 1.8 1.5 1.4I E 1999 6.8 6.9 6.8 7.0 6.9 6.5 6.3 = 6.8 4.1 3.7 3.6 3.7 3.6 3.2 3.0 2.5 1.9 1.9 1.9 1.9 1.9 1.6 1.3 1.1O N 2000 7.2 7.4 7.4 7.7 7.7 7.7 8.3 10.3 = 1.4 2.2 2.6 3.0 2.9 2.6 2.4 2.0 1.4 1.4 1.4 1.5 1.5 1.2 0.9 0.8S T 2001 6.9 7.0 7.0 7.1 7.1 6.9 7.0 7.3 4.5 = 2.9 3.1 3.5 3.3 2.8 2.6 2.0 1.4 1.4 1.4 1.5 1.5 1.2 0.9 0.7
2002 6.4 6.5 6.4 6.4 6.3 6.0 5.9 5.7 3.5 2.5 = 3.4 3.8 3.4 2.8 2.5 1.9 1.2 1.2 1.3 1.4 1.4 1.0 0.8 0.6C P 2003 6.3 6.3 6.2 6.2 6.0 5.7 5.6 5.4 3.8 3.5 4.5 = 4.2 3.5 2.6 2.3 1.6 0.9 0.9 1.0 1.2 1.2 0.8 0.5 0.4O R 2004 6.2 6.2 6.1 6.1 6.0 5.7 5.6 5.4 4.2 4.1 5.0 5.4 = 2.7 1.9 1.7 1.0 0.2 0.4 0.6 0.8 0.9 0.5 0.2 0.1R I 2005 6.2 6.2 6.1 6.1 6.0 5.8 5.7 5.6 4.6 4.7 5.4 5.9 6.3 = 1.0 1.2 0.4 -0.4 -0.1 0.2 0.5 0.7 0.2 0.0 -0.2R C 2006 6.2 6.2 6.2 6.2 6.1 5.9 5.8 5.7 5.0 5.1 5.7 6.1 6.5 6.6 = 1.3 0.1 -0.9 -0.3 0.0 0.4 0.6 0.1 -0.2 -0.3I E 2007 6.1 6.1 6.0 6.0 5.9 5.7 5.6 5.5 4.8 4.9 5.3 5.5 5.6 5.2 3.9 = -1.2 -2.0 -0.9 -0.3 0.2 0.5 0.0 -0.3 -0.5E S 2008 6.0 6.0 5.9 5.9 5.8 5.6 5.5 5.4 4.8 4.8 5.2 5.4 5.4 5.0 4.3 4.7 = -2.9 -0.7 0.0 0.6 0.8 0.2 -0.2 -0.4N 2009 5.7 5.7 5.6 5.5 5.4 5.2 5.1 4.9 4.4 4.4 4.6 4.6 4.5 4.0 3.2 2.9 1.0 = 1.4 1.5 1.8 1.8 0.8 0.2 0.0T 2010 5.5 5.5 5.4 5.4 5.2 5.0 4.9 4.8 4.2 4.2 4.4 4.4 4.2 3.8 3.2 2.9 2.0 3.0 = 1.5 2.0 1.9 0.6 0.0 -0.3E 2011 5.4 5.3 5.2 5.2 5.0 4.8 4.7 4.6 4.1 4.0 4.2 4.2 4.0 3.6 3.0 2.8 2.2 2.7 2.4 = 2.4 2.1 0.3 -0.4 -0.7S 2012 5.3 5.3 5.2 5.2 5.0 4.8 4.7 4.6 4.1 4.1 4.3 4.2 4.1 3.7 3.3 3.2 2.8 3.4 3.6 4.7 = 1.7 -0.7 -1.3 -1.4
2013 5.2 5.2 5.1 5.0 4.9 4.7 4.6 4.4 4.0 4.0 4.1 4.1 3.9 3.6 3.2 3.1 2.7 3.2 3.2 3.7 2.6 -3.1 -2.8 -2.42014 4.9 4.9 4.8 4.7 4.5 4.4 4.2 4.1 3.6 3.6 3.7 3.6 3.4 3.1 2.7 2.5 2.1 2.3 2.2 2.1 0.8 -0.9 -2.5 -2.12015 4.7 4.6 4.5 4.4 4.3 4.1 3.9 3.8 3.4 3.3 3.3 3.2 3.1 2.7 2.3 2.1 1.8 1.9 1.6 1.4 0.4 -0.7 -0.5 -1.72016 4.4 4.4 4.3 4.2 4.0 3.8 3.7 3.5 3.1 3.0 3.1 2.9 2.7 2.4 2.0 1.8 1.4 1.5 1.3 1.0 0.1 -0.7 -0.6 -0.7 ===
P R E C I O S C O N S T A N T E S - C O N S T A N T P R I C E S
TASAS DE CRECIMIENTO ANUAL DE LOS GASTOS DE CONSUMO PERSONAL PERSONAL CONSUMPTION EXPENDITURES
1992 1993 1994 1995 1996 1997 1998 1999 2000 2001 2002 2003 2004 2005 2006 2007 2008 2009 2010 2011 2012 2013 2014 2015 2016
1992 === 4.2 4.2 4.2 4.4 4.5 4.3 4.4 4.6 4.2 4.1 4.0 4.0 3.9 3.7 3.6 3.4 3.0 3.0 2.9 3.0 3.0 2.7 2.6 2.51993 5.2 === 4.1 4.1 4.4 4.5 4.3 4.4 4.7 4.3 4.1 4.0 4.0 3.9 3.7 3.6 3.3 2.9 2.9 2.9 2.9 2.9 2.7 2.5 2.41994 5.7 6.1 === 4.2 4.6 4.7 4.4 4.5 4.8 4.3 4.1 4.0 4.0 3.9 3.7 3.5 3.2 2.9 2.8 2.8 2.8 2.8 2.6 2.4 2.3
P C 1995 5.5 5.6 5.1 === 5.1 4.9 4.5 4.6 4.9 4.3 4.1 4.0 4.0 3.9 3.6 3.5 3.2 2.8 2.7 2.7 2.7 2.8 2.5 2.3 2.2R U 1996 5.7 5.8 5.7 6.3 === 4.7 4.2 4.4 4.9 4.1 3.9 3.8 3.9 3.7 3.5 3.3 3.0 2.6 2.5 2.5 2.6 2.6 2.4 2.2 2.1E R 1997 5.9 6.1 6.0 6.5 6.7 === 3.6 4.2 4.9 4.0 3.7 3.7 3.7 3.6 3.4 3.2 2.9 2.4 2.4 2.4 2.5 2.5 2.2 2.1 2.0C R 1998 5.9 6.0 6.0 6.3 6.2 5.8 === 4.8 5.6 4.1 3.8 3.7 3.8 3.6 3.3 3.2 2.8 2.3 2.3 2.3 2.4 2.4 2.1 2.0 1.9I E 1999 5.9 6.0 5.9 6.1 6.1 5.8 5.8 === 6.4 3.8 3.4 3.4 3.5 3.4 3.1 3.0 2.6 2.1 2.0 2.1 2.2 2.2 2.0 1.8 1.7O N 2000 6.4 6.5 6.6 6.9 7.0 7.1 7.8 9.9 === 1.2 2.0 2.4 2.8 2.8 2.6 2.5 2.1 1.6 1.6 1.7 1.9 1.9 1.7 1.5 1.4S T 2001 6.1 6.2 6.2 6.4 6.5 6.4 6.6 7.0 4.2 === 2.7 3.0 3.4 3.2 2.9 2.7 2.2 1.6 1.7 1.7 1.9 2.0 1.7 1.5 1.4
2002 5.7 5.8 5.7 5.8 5.7 5.6 5.5 5.4 3.2 2.3 === 3.3 3.7 3.4 2.9 2.7 2.1 1.5 1.5 1.6 1.8 1.9 1.6 1.4 1.3C P 2003 5.6 5.6 5.6 5.6 5.6 5.4 5.3 5.2 3.6 3.4 4.4 === 4.2 3.5 2.7 2.5 1.9 1.2 1.3 1.4 1.7 1.8 1.5 1.3 1.2O R 2004 5.6 5.6 5.6 5.6 5.5 5.4 5.3 5.2 4.1 4.0 4.9 5.4 === 2.8 2.0 2.0 1.3 0.6 0.8 1.0 1.4 1.5 1.2 1.0 0.9R I 2005 5.7 5.7 5.6 5.7 5.6 5.5 5.5 5.4 4.5 4.6 5.4 5.9 6.4 === 1.3 1.6 0.9 0.0 0.4 0.8 1.2 1.4 1.0 0.8 0.8R C 2006 5.7 5.8 5.7 5.8 5.8 5.6 5.6 5.6 4.9 5.1 5.8 6.2 6.6 6.9 === 1.8 0.6 -0.4 0.2 0.6 1.1 1.4 1.0 0.8 0.7I E 2007 5.6 5.7 5.6 5.7 5.6 5.5 5.5 5.5 4.8 5.0 5.5 5.8 5.9 5.6 4.4 === -0.6 -1.5 -0.3 0.4 1.0 1.3 0.9 0.7 0.6E S 2008 5.6 5.7 5.6 5.7 5.6 5.5 5.5 5.4 4.9 5.0 5.5 5.7 5.7 5.5 4.9 5.3 === -2.3 -0.2 0.7 1.4 1.7 1.1 0.8 0.7N 2009 5.4 5.4 5.3 5.4 5.3 5.2 5.1 5.1 4.5 4.6 4.9 5.0 4.9 4.5 3.8 3.5 1.6 === 2.0 2.2 2.7 2.7 1.8 1.4 1.2T 2010 5.3 5.3 5.2 5.2 5.2 5.1 5.0 4.9 4.4 4.5 4.7 4.8 4.7 4.3 3.7 3.5 2.6 3.6 === 2.4 3.0 3.0 1.8 1.2 1.1E 2011 5.2 5.2 5.1 5.1 5.0 4.9 4.9 4.8 4.3 4.3 4.6 4.6 4.5 4.2 3.6 3.4 2.8 3.4 3.3 === 3.6 3.3 1.6 1.0 0.8S 2012 5.2 5.2 5.2 5.2 5.1 5.0 4.9 4.9 4.5 4.5 4.7 4.7 4.7 4.4 4.0 3.9 3.6 4.3 4.6 5.9 === 2.9 0.5 0.1 0.1
2013 5.2 5.1 5.1 5.1 5.0 4.9 4.9 4.8 4.4 4.4 4.6 4.7 4.6 4.3 4.0 3.9 3.6 4.1 4.3 4.9 3.8 === -1.8 -1.3 -0.82014 4.9 4.9 4.9 4.8 4.8 4.7 4.6 4.5 4.1 4.1 4.3 4.3 4.1 3.9 3.5 3.4 3.1 3.4 3.4 3.4 2.1 0.5 === -0.8 -0.32015 4.8 4.7 4.7 4.7 4.6 4.5 4.4 4.3 3.9 3.9 4.0 4.0 3.9 3.6 3.3 3.1 2.8 3.0 2.9 2.8 1.8 0.8 1.2 === 0.12016 4.6 4.6 4.5 4.5 4.4 4.3 4.2 4.1 3.8 3.7 3.8 3.8 3.6 3.4 3.1 2.9 2.6 2.8 2.6 2.5 1.6 0.9 1.2 1.1 ===
TASAS DE CRECIMIENTO ANUAL DE LOS GASTOS DE CONSUMO PERSONAL PER CÁPITAPER CAPITA PERSONAL CONSUMPTION EXPENDITURES
P R E C I O S C O N S T A N T E S - C O N S T A N T P R I C E S

A-76 JUNTA DE PLANIFICACIÓN / PLANNING BOARD
APÉNDICE ESTADÍSTICO • STATISTICAL APPENDIXINFORME ECONÓMICO AL GOBERNADOR 2016 • ECONOMIC REPORT TO THE GOVERNOR 2016
1992 1993 1994 1995 1996 1997 1998 1999 2000 2001 2002 2003 2004 2005 2006 2007 2008 2009 2010 2011 2012 2013 2014 2015 2016
1992 === 0.5 1.2 1.8 3.5 3.9 3.5 3.7 3.7 3.4 3.2 3.0 3.1 3.1 3.1 3.2 2.9 2.4 2.3 2.5 2.6 2.5 2.1 1.8 1.51993 2.1 === 1.9 2.4 4.5 4.8 4.1 4.3 4.1 3.8 3.5 3.3 3.3 3.3 3.3 3.4 3.1 2.6 2.4 2.7 2.7 2.6 2.1 1.9 1.51994 3.2 4.3 === 2.9 5.9 5.8 4.7 4.8 4.5 4.1 3.7 3.5 3.5 3.4 3.5 3.5 3.2 2.6 2.5 2.7 2.7 2.7 2.2 1.9 1.5
P C 1995 3.2 3.8 3.4 === 9.0 7.3 5.3 5.2 4.8 4.3 3.8 3.5 3.5 3.5 3.5 3.6 3.2 2.6 2.4 2.7 2.7 2.6 2.1 1.8 1.4R U 1996 4.9 5.8 6.6 9.9 === 5.6 3.5 4.0 3.8 3.4 2.9 2.8 2.9 2.9 3.0 3.1 2.7 2.1 2.0 2.3 2.3 2.3 1.8 1.5 1.1E R 1997 5.5 6.3 7.0 8.9 7.9 === 1.5 3.2 3.2 2.8 2.4 2.3 2.5 2.6 2.7 2.8 2.5 1.8 1.7 2.1 2.1 2.1 1.5 1.3 0.8C R 1998 5.1 5.7 6.0 6.9 5.5 3.1 === 5.1 4.1 3.3 2.7 2.5 2.6 2.7 2.9 3.0 2.6 1.8 1.7 2.1 2.1 2.1 1.5 1.2 0.8I E 1999 5.2 5.7 6.0 6.7 5.7 4.6 6.1 === 3.2 2.4 1.9 1.8 2.2 2.4 2.6 2.7 2.3 1.5 1.4 1.9 1.9 1.9 1.3 1.0 0.6O N 2000 5.1 5.5 5.7 6.2 5.3 4.4 5.1 4.2 === 1.7 1.2 1.4 1.9 2.2 2.5 2.6 2.2 1.3 1.2 1.7 1.8 1.8 1.2 0.9 0.4S T 2001 5.1 5.5 5.6 6.0 5.3 4.6 5.1 4.7 5.2 === 0.7 1.3 2.0 2.3 2.6 2.8 2.3 1.3 1.2 1.7 1.8 1.8 1.1 0.8 0.3
2002 4.6 4.8 4.9 5.1 4.4 3.7 3.8 3.0 2.5 -0.1 === 1.8 2.6 2.9 3.1 3.2 2.5 1.4 1.3 1.9 1.9 1.9 1.2 0.8 0.3C P 2003 4.6 4.8 4.9 5.1 4.4 3.8 4.0 3.4 3.2 2.2 4.6 === 3.4 3.4 3.5 3.6 2.7 1.3 1.2 1.9 2.0 1.9 1.1 0.7 0.2O R 2004 4.5 4.7 4.8 4.9 4.3 3.8 3.9 3.5 3.3 2.7 4.1 3.7 === 3.3 3.6 3.6 2.5 0.9 0.8 1.6 1.8 1.8 0.9 0.5 -0.1R I 2005 4.7 4.9 5.0 5.1 4.6 4.2 4.4 4.1 4.1 3.8 5.2 5.4 7.3 === 3.8 3.8 2.2 0.3 0.3 1.4 1.6 1.6 0.6 0.2 -0.4R C 2006 5.0 5.2 5.3 5.4 5.0 4.7 4.9 4.7 4.8 4.7 6.0 6.5 7.9 8.5 === 3.8 1.4 -0.8 -0.5 0.9 1.2 1.3 0.2 -0.2 -0.8I E 2007 5.0 5.3 5.3 5.5 5.1 4.8 5.0 4.9 5.0 5.0 6.0 6.4 7.3 7.4 6.2 === -1.0 -3.1 -1.9 0.2 0.7 0.9 -0.3 -0.7 -1.3E S 2008 5.1 5.3 5.4 5.5 5.2 4.9 5.1 5.0 5.1 5.1 6.0 6.3 7.0 6.9 6.1 6.0 === -5.1 -2.4 0.6 1.1 1.2 -0.2 -0.6 -1.4N 2009 4.9 5.1 5.1 5.2 4.9 4.6 4.8 4.7 4.7 4.6 5.3 5.5 5.8 5.5 4.5 3.6 1.3 === 0.4 3.5 3.2 2.9 0.9 0.1 -0.8T 2010 4.9 5.0 5.1 5.2 4.9 4.6 4.7 4.6 4.7 4.6 5.2 5.3 5.6 5.3 4.5 3.9 2.8 4.4 === 6.8 4.7 3.7 1.0 0.1 -1.0E 2011 4.8 4.9 5.0 5.1 4.7 4.5 4.6 4.5 4.5 4.5 5.0 5.0 5.2 4.9 4.2 3.7 2.9 3.8 3.2 === 2.7 2.3 -0.9 -1.5 -2.5S 2012 4.8 4.9 4.9 5.0 4.7 4.5 4.6 4.5 4.6 4.5 5.0 5.0 5.2 4.9 4.3 3.9 3.4 4.1 4.0 4.8 === 1.8 -2.6 -2.9 -3.7
2013 4.7 4.8 4.8 4.9 4.6 4.4 4.5 4.4 4.4 4.4 4.8 4.8 4.9 4.6 4.1 3.7 3.3 3.8 3.6 3.8 2.8 === -6.8 -5.1 -5.52014 4.3 4.4 4.4 4.5 4.2 4.0 4.0 3.9 3.9 3.7 4.1 4.0 4.1 3.7 3.1 2.7 2.2 2.3 1.8 1.4 -0.3 -3.3 === -3.4 -4.82015 4.1 4.2 4.2 4.3 4.0 3.8 3.8 3.7 3.6 3.5 3.8 3.7 3.7 3.4 2.8 2.4 1.9 2.0 1.5 1.1 -0.1 -1.4 0.4 === -6.32016 3.8 3.9 3.8 3.9 3.6 3.3 3.4 3.2 3.1 3.0 3.2 3.1 3.1 2.7 2.2 1.7 1.2 1.2 0.6 0.1 -1.0 -2.2 -1.7 -3.7 ===
TASAS DE CRECIMIENTO ANUAL DE LOS GASTOS DE CONSUMO PERSONAL DE BIENES NO DURADEROSPERSONAL CONSUMPTION EXPENDITURES OF NON DURABLE GOODS
P R E C I O S C O N S T A N T E S - C O N S T A N T P R I C E S
5
6
1992 1993 1994 1995 1996 1997 1998 1999 2000 2001 2002 2003 2004 2005 2006 2007 2008 2009 2010 2011 2012 2013 2014 2015 2016
1992 === 16.3 11.3 11.7 9.4 9.2 8.2 8.6 6.9 6.9 6.1 5.1 4.9 5.6 5.4 5.0 4.4 4.0 3.7 3.8 3.9 3.9 3.1 3.2 2.91993 18.1 === 6.6 9.5 7.2 7.5 6.7 7.4 5.7 5.8 5.0 4.1 4.0 4.7 4.6 4.3 3.7 3.3 3.0 3.2 3.3 3.3 2.5 2.6 2.41994 13.2 8.6 === 12.5 7.4 7.8 6.7 7.5 5.5 5.7 4.8 3.8 3.7 4.5 4.5 4.1 3.5 3.1 2.8 3.0 3.1 3.1 2.3 2.4 2.2
P C 1995 12.9 10.5 12.4 === 2.5 5.6 4.8 6.3 4.2 4.6 3.8 2.8 2.8 3.8 3.8 3.4 2.8 2.4 2.2 2.4 2.6 2.6 1.8 1.9 1.7R U 1996 10.5 8.1 7.8 3.5 === 8.7 6.0 7.6 4.6 5.0 4.0 2.8 2.8 3.9 3.9 3.5 2.8 2.4 2.2 2.4 2.6 2.6 1.8 1.9 1.7E R 1997 10.5 8.6 8.7 6.8 10.3 === 3.4 7.1 3.2 4.1 3.1 1.8 2.0 3.3 3.4 3.0 2.3 1.9 1.7 2.0 2.2 2.3 1.4 1.6 1.3C R 1998 9.8 8.2 8.1 6.7 8.4 6.4 === 10.9 3.1 4.3 3.0 1.5 1.7 3.3 3.4 3.0 2.2 1.8 1.5 1.8 2.1 2.2 1.3 1.4 1.2I E 1999 9.6 8.3 8.2 7.2 8.5 7.6 8.7 === -4.1 1.2 0.5 -0.7 0.0 2.1 2.3 2.0 1.3 0.9 0.7 1.1 1.4 1.6 0.7 0.9 0.7O N 2000 8.2 6.8 6.6 5.4 5.9 4.5 3.5 -1.4 === 6.8 2.8 0.4 1.1 3.4 3.4 2.9 1.9 1.5 1.2 1.6 1.9 2.0 1.0 1.2 1.0S T 2001 7.9 6.7 6.5 5.5 5.9 4.9 4.4 2.2 6.0 === -1.0 -2.6 -0.8 2.6 2.8 2.3 1.3 0.8 0.6 1.1 1.5 1.7 0.6 0.8 0.6
2002 7.2 6.0 5.7 4.8 5.0 4.0 3.4 1.7 3.3 0.6 === -4.1 -0.7 3.8 3.8 2.9 1.7 1.1 0.8 1.4 1.7 1.9 0.7 1.0 0.7C P 2003 6.0 4.9 4.5 3.6 3.6 2.5 1.7 0.1 0.5 -2.1 -4.7 === 2.9 8.0 6.5 4.8 2.8 2.0 1.5 2.1 2.4 2.5 1.2 1.4 1.1O R 2004 6.1 5.0 4.7 3.9 3.9 3.0 2.5 1.2 1.9 0.6 0.6 6.2 === 13.3 8.4 5.4 2.8 1.8 1.3 1.9 2.3 2.5 1.0 1.3 0.9R I 2005 6.5 5.6 5.3 4.6 4.7 4.1 3.7 2.9 3.8 3.2 4.1 8.9 11.6 === 3.7 1.7 -0.4 -0.9 -0.9 0.1 0.8 1.2 -0.3 0.1 -0.1R C 2006 6.3 5.4 5.2 4.5 4.6 4.0 3.7 3.0 3.8 3.3 4.0 7.1 7.6 3.7 === -0.3 -2.4 -2.4 -2.1 -0.5 0.4 0.9 -0.8 -0.2 -0.5I E 2007 5.6 4.7 4.4 3.8 3.8 3.2 2.9 2.1 2.7 2.1 2.4 4.3 3.7 -0.1 -3.7 === -4.6 -3.5 -2.7 -0.6 0.5 1.1 -0.8 -0.2 -0.5E S 2008 5.1 4.3 4.0 3.3 3.3 2.7 2.4 1.7 2.1 1.5 1.7 3.0 2.2 -0.8 -2.9 -2.1 === -2.4 -1.7 0.7 1.8 2.2 -0.2 0.4 0.0N 2009 4.4 3.6 3.2 2.6 2.5 1.9 1.5 0.8 1.1 0.5 0.5 1.3 0.4 -2.2 -4.1 -4.3 -6.5 === -1.0 2.3 3.2 3.4 0.2 0.9 0.3T 2010 4.3 3.5 3.2 2.6 2.6 2.0 1.7 1.0 1.3 0.8 0.8 1.6 0.9 -1.2 -2.3 -1.9 -1.8 3.1 === 5.8 5.4 4.9 0.6 1.3 0.6E 2011 4.4 3.7 3.4 2.8 2.8 2.3 2.0 1.4 1.7 1.3 1.3 2.1 1.5 0.0 -0.8 0.0 0.7 4.4 5.8 === 5.0 4.5 -1.1 0.1 -0.5S 2012 4.5 3.9 3.6 3.1 3.1 2.6 2.4 1.9 2.2 1.8 1.9 2.7 2.3 1.0 0.6 1.5 2.4 5.5 6.7 7.6 === 3.9 -4.1 -1.4 -1.8
2013 4.6 4.0 3.7 3.3 3.3 2.9 2.6 2.2 2.5 2.2 2.3 3.1 2.7 1.7 1.4 2.3 3.1 5.7 6.6 7.0 6.4 === -11.5 -4.0 -3.62014 3.9 3.3 3.0 2.5 2.5 2.0 1.8 1.3 1.5 1.2 1.2 1.8 1.4 0.3 -0.1 0.4 0.8 2.3 2.1 0.9 -2.3 -10.2 === 4.1 0.62015 3.6 3.0 2.8 2.3 2.2 1.8 1.5 1.1 1.3 0.9 1.0 1.5 1.0 0.0 -0.4 0.1 0.4 1.6 1.2 0.1 -2.2 -6.2 -2.1 === -2.92016 3.5 2.9 2.6 2.2 2.1 1.7 1.4 1.0 1.2 0.9 0.9 1.3 0.9 0.0 -0.4 0.0 0.3 1.3 1.0 0.1 -1.7 -4.3 -1.2 -0.3 ===
P R E C I O S C O N S T A N T E S - C O N S T A N T P R I C E S
TASAS DE CRECIMIENTO ANUAL DE LOS GASTOS DE CONSUMO PERSONAL DE BIENES DURADEROSPESONAL CONSUMPTION EXPENDITURES OF DURABLE GOODS

JUNTA DE PLANIFICACIÓN / PLANNING BOARD A-77
APÉNDICE ESTADÍSTICO • STATISTICAL APPENDIXINFORME ECONÓMICO AL GOBERNADOR 2016 • ECONOMIC REPORT TO THE GOVERNOR 2016
7
8
7
1992 1993 1994 1995 1996 1997 1998 1999 2000 2001 2002 2003 2004 2005 2006 2007 2008 2009 2010 2011 2012 2013 2014 2015 2016
1992 === 5.5 6.5 5.7 5.6 5.4 5.8 5.4 6.7 5.8 5.9 6.0 6.0 5.4 4.8 4.5 4.2 3.9 3.8 3.4 3.3 3.1 3.2 2.9 2.91993 6.9 === 7.6 5.9 5.6 5.4 5.9 5.4 6.8 5.8 5.9 6.1 6.0 5.4 4.8 4.4 4.1 3.8 3.8 3.3 3.2 3.0 3.1 2.7 2.71994 8.2 9.4 === 4.2 4.7 4.7 5.5 5.0 6.7 5.6 5.7 5.9 5.9 5.2 4.5 4.2 3.9 3.5 3.5 3.0 2.9 2.8 2.9 2.5 2.5
P C 1995 7.7 8.1 6.9 === 5.1 4.9 5.9 5.2 7.2 5.8 5.9 6.1 6.0 5.3 4.6 4.2 3.8 3.5 3.5 3.0 2.8 2.7 2.8 2.4 2.5R U 1996 7.4 7.5 6.6 6.3 === 4.7 6.3 5.3 7.7 6.0 6.0 6.3 6.2 5.3 4.5 4.1 3.7 3.4 3.4 2.8 2.7 2.6 2.7 2.3 2.3E R 1997 7.3 7.4 6.7 6.6 7.0 === 7.9 5.6 8.8 6.3 6.3 6.6 6.4 5.4 4.5 4.0 3.7 3.3 3.3 2.7 2.6 2.5 2.6 2.2 2.2C R 1998 7.7 7.9 7.5 7.7 8.5 10.0 === 3.3 9.2 5.7 5.9 6.3 6.1 5.0 4.1 3.6 3.2 2.8 2.9 2.3 2.2 2.1 2.2 1.8 1.9I E 1999 7.5 7.5 7.2 7.3 7.6 7.9 5.8 === 15.5 7.0 6.8 7.0 6.7 5.3 4.2 3.6 3.2 2.8 2.8 2.2 2.1 2.0 2.2 1.8 1.8O N 2000 8.9 9.2 9.1 9.6 10.5 11.7 12.5 19.6 === -0.9 2.8 4.4 4.6 3.4 2.4 2.0 1.8 1.5 1.7 1.1 1.1 1.0 1.3 0.9 1.0S T 2001 8.3 8.5 8.3 8.6 9.0 9.6 9.4 11.2 3.5 === 6.5 7.1 6.5 4.5 3.1 2.5 2.2 1.8 1.9 1.3 1.3 1.2 1.4 1.0 1.1
2002 8.0 8.1 7.9 8.1 8.4 8.6 8.3 9.1 4.2 5.0 === 7.7 6.5 3.8 2.2 1.8 1.5 1.1 1.4 0.7 0.8 0.7 1.0 0.6 0.8C P 2003 7.9 7.9 7.8 7.9 8.1 8.3 8.0 8.5 5.1 5.9 6.8 === 5.3 1.9 0.5 0.3 0.3 0.1 0.5 -0.1 0.0 0.1 0.4 0.0 0.3O R 2004 7.7 7.8 7.7 7.8 7.9 8.1 7.8 8.2 5.5 6.2 6.7 6.6 === -1.4 -1.9 -1.3 -0.9 -1.0 -0.3 -0.9 -0.6 -0.5 0.0 -0.4 -0.2R I 2005 7.5 7.5 7.4 7.4 7.6 7.6 7.3 7.5 5.3 5.7 6.0 5.6 4.5 === -2.3 -1.2 -0.8 -0.8 0.0 -0.8 -0.5 -0.4 0.1 -0.3 0.0R C 2006 7.4 7.4 7.2 7.3 7.4 7.4 7.1 7.3 5.4 5.7 5.9 5.6 5.1 5.8 === -0.1 0.0 -0.4 0.5 -0.5 -0.2 -0.1 0.4 -0.1 0.2I E 2007 7.1 7.1 7.0 7.0 7.1 7.1 6.7 6.9 5.1 5.4 5.5 5.2 4.7 4.8 3.8 === 0.1 -0.5 0.8 -0.6 -0.2 -0.1 0.5 -0.1 0.2E S 2008 7.0 7.0 6.8 6.8 6.9 6.9 6.6 6.7 5.2 5.4 5.5 5.2 4.8 4.9 4.5 5.2 === -1.0 1.1 -0.8 -0.3 -0.1 0.6 -0.1 0.2N 2009 6.7 6.7 6.5 6.5 6.5 6.5 6.2 6.2 4.8 5.0 5.0 4.7 4.3 4.3 3.8 3.8 2.4 === 3.3 -0.6 -0.1 0.1 0.9 0.0 0.4T 2010 6.5 6.4 6.2 6.2 6.2 6.1 5.8 5.8 4.5 4.7 4.6 4.3 3.9 3.8 3.3 3.2 2.1 1.9 === -4.5 -1.7 -1.0 0.3 -0.6 0.0E 2011 6.2 6.1 5.9 5.9 5.9 5.8 5.5 5.4 4.2 4.3 4.2 3.9 3.5 3.4 2.9 2.7 1.8 1.5 1.2 === 1.1 0.8 1.9 0.4 0.9S 2012 6.1 6.0 5.8 5.8 5.7 5.7 5.4 5.3 4.2 4.3 4.2 3.9 3.6 3.5 3.1 2.9 2.4 2.4 2.6 4.1 === 0.6 2.4 0.1 0.8
2013 5.9 5.8 5.6 5.5 5.5 5.4 5.1 5.1 4.0 4.1 4.0 3.7 3.4 3.2 2.9 2.7 2.2 2.2 2.3 2.9 1.7 === 4.2 -0.1 0.92014 5.7 5.7 5.5 5.4 5.4 5.3 5.0 4.9 3.9 4.0 3.9 3.6 3.3 3.2 2.9 2.8 2.4 2.4 2.5 2.9 2.3 3.0 === -4.2 -0.72015 5.4 5.4 5.2 5.1 5.0 4.9 4.6 4.6 3.6 3.6 3.5 3.3 3.0 2.8 2.5 2.3 1.9 1.8 1.8 1.9 1.2 1.0 -0.9 === 2.92016 5.3 5.2 5.0 4.9 4.9 4.7 4.5 4.4 3.5 3.5 3.4 3.1 2.8 2.7 2.4 2.2 1.9 1.8 1.8 1.9 1.4 1.2 0.4 1.7 ===
TASAS DE CRECIMIENTO ANUAL DE LOS GASTOS DE CONSUMO PERSONAL DE SERVICIOSPERSONAL CONSUMPTION EXPENDITURES OF SERVICES
P R E C I O S C O N S T A N T E S - C O N S T A N T P R I C E S
1992 1993 1994 1995 1996 1997 1998 1999 2000 2001 2002 2003 2004 2005 2006 2007 2008 2009 2010 2011 2012 2013 2014 2015 2016
1992 === 1.1 0.7 2.7 3.3 3.7 3.4 3.5 2.3 2.5 2.8 2.8 2.6 2.7 2.5 2.2 1.8 1.8 1.5 1.3 1.3 1.2 1.4 0.9 0.71993 5.9 === 0.3 3.6 4.1 4.3 3.8 3.9 2.5 2.7 3.0 2.9 2.7 2.8 2.6 2.3 1.8 1.9 1.6 1.4 1.4 1.2 1.5 0.9 0.61994 5.6 5.3 === 7.0 6.0 5.7 4.7 4.7 2.9 3.0 3.3 3.2 3.0 3.1 2.8 2.5 2.0 2.0 1.7 1.4 1.4 1.2 1.5 0.9 0.7
P C 1995 7.4 8.1 11.0 === 5.0 5.1 4.0 4.1 2.1 2.4 2.8 2.8 2.5 2.7 2.4 2.1 1.6 1.7 1.3 1.1 1.1 0.9 1.2 0.6 0.4R U 1996 7.8 8.5 10.1 9.2 === 5.2 3.5 3.8 1.4 1.9 2.5 2.5 2.2 2.4 2.1 1.9 1.3 1.4 1.1 0.8 0.9 0.7 1.0 0.4 0.1E R 1997 7.5 8.0 8.9 7.8 6.5 === 1.9 3.1 0.1 1.0 1.9 2.0 1.8 2.1 1.8 1.5 1.0 1.1 0.7 0.5 0.6 0.4 0.8 0.2 -0.1C R 1998 6.7 6.9 7.3 6.1 4.6 2.7 === 4.4 -0.7 0.8 1.9 2.1 1.8 2.1 1.8 1.5 0.9 1.0 0.6 0.4 0.5 0.3 0.7 0.1 -0.2I E 1999 6.6 6.7 7.0 6.0 4.9 4.2 5.7 === -5.6 -1.0 1.1 1.5 1.3 1.8 1.4 1.2 0.5 0.7 0.3 0.1 0.2 0.0 0.5 -0.2 -0.5O N 2000 5.2 5.1 5.1 4.0 2.7 1.5 0.9 -3.7 === 3.9 4.7 4.0 3.1 3.3 2.7 2.2 1.3 1.4 0.9 0.6 0.7 0.5 0.9 0.2 -0.2S T 2001 5.4 5.4 5.4 4.5 3.5 2.8 2.8 1.4 6.8 === 5.5 4.0 2.8 3.1 2.4 1.9 0.9 1.1 0.6 0.3 0.4 0.2 0.7 -0.1 -0.4
2002 5.7 5.7 5.7 5.0 4.3 3.9 4.2 3.6 7.5 8.2 === 2.5 1.5 2.4 1.7 1.2 0.2 0.5 0.0 -0.2 -0.1 -0.3 0.3 -0.5 -0.8C P 2003 5.6 5.6 5.6 4.9 4.3 4.0 4.2 3.9 6.5 6.3 4.5 === 0.6 2.3 1.4 0.8 -0.3 0.2 -0.3 -0.6 -0.4 -0.5 0.1 -0.8 -1.1O R 2004 5.5 5.4 5.4 4.8 4.3 4.0 4.2 3.9 5.9 5.6 4.4 4.2 === 4.1 1.8 0.9 -0.5 0.1 -0.5 -0.7 -0.5 -0.7 0.1 -0.9 -1.2R I 2005 5.9 5.9 5.9 5.4 5.0 4.8 5.1 5.0 6.8 6.9 6.4 7.4 10.6 === -0.4 -0.6 -2.0 -0.9 -1.4 -1.5 -1.1 -1.3 -0.3 -1.4 -1.7R C 2006 5.6 5.6 5.6 5.1 4.8 4.6 4.8 4.7 6.1 6.0 5.4 5.8 6.5 2.6 === -0.8 -2.8 -1.0 -1.6 -1.7 -1.2 -1.4 -0.3 -1.5 -1.8I E 2007 5.4 5.3 5.3 4.9 4.5 4.3 4.5 4.3 5.5 5.3 4.7 4.7 4.9 2.2 1.8 === -4.7 -1.2 -1.9 -2.0 -1.3 -1.5 -0.2 -1.5 -1.9E S 2008 5.0 5.0 4.9 4.5 4.1 3.9 4.0 3.8 4.8 4.5 3.9 3.8 3.7 1.5 0.9 0.1 === 2.5 -0.5 -1.0 -0.5 -0.8 0.5 -1.1 -1.6N 2009 5.0 5.0 5.0 4.6 4.2 4.0 4.1 4.0 4.9 4.6 4.1 4.1 4.1 2.5 2.4 2.8 5.5 === -3.4 -2.8 -1.4 -1.6 0.1 -1.7 -2.1T 2010 4.6 4.6 4.5 4.1 3.7 3.5 3.6 3.4 4.1 3.8 3.3 3.1 3.0 1.5 1.2 1.0 1.5 -2.3 === -2.2 -0.5 -1.0 1.0 -1.3 -1.9E 2011 4.2 4.1 4.0 3.6 3.3 3.0 3.1 2.8 3.5 3.1 2.6 2.3 2.1 0.7 0.3 0.0 0.0 -2.7 -3.1 === 1.3 -0.5 2.1 -1.1 -1.9S 2012 4.1 4.0 4.0 3.6 3.2 3.0 3.0 2.8 3.4 3.1 2.6 2.4 2.2 1.0 0.7 0.5 0.7 -0.9 -0.2 2.7 === -2.1 2.5 -1.9 -2.6
2013 3.8 3.7 3.7 3.3 2.9 2.7 2.7 2.5 3.0 2.7 2.2 1.9 1.7 0.6 0.4 0.1 0.1 -1.2 -0.8 0.4 -1.9 === 7.4 -1.8 -2.82014 3.9 3.8 3.7 3.3 3.0 2.8 2.8 2.6 3.1 2.8 2.3 2.1 1.9 1.0 0.8 0.7 0.8 -0.1 0.4 1.6 1.1 4.2 === -10.2 -7.52015 2.8 2.7 2.6 2.2 1.8 1.6 1.5 1.2 1.6 1.2 0.7 0.4 0.0 -1.0 -1.4 -1.7 -2.0 -3.2 -3.4 -3.4 -5.4 -7.1 -17.2 === -4.82016 2.5 2.3 2.2 1.8 1.4 1.2 1.1 0.8 1.1 0.7 0.2 -0.1 -0.4 -1.4 -1.8 -2.2 -2.4 -3.5 -3.7 -3.8 -5.4 -6.6 -11.5 -5.5 ===
P R E C I O S C O N S T A N T E S - C O N S T A N T P R I C E S
GOVERNMENT CONSUMPTION EXPENDITURESTASAS DE CRECIMIENTO ANUAL DE LOS GASTOS DE CONSUMO DEL GOBIERNO

A-78 JUNTA DE PLANIFICACIÓN / PLANNING BOARD
APÉNDICE ESTADÍSTICO • STATISTICAL APPENDIXINFORME ECONÓMICO AL GOBERNADOR 2016 • ECONOMIC REPORT TO THE GOVERNOR 2016
9
100
1992 1993 1994 1995 1996 1997 1998 1999 2000 2001 2002 2003 2004 2005 2006 2007 2008 2009 2010 2011 2012 2013 2014 2015 2016
1992 === 8.3 5.4 6.9 7.9 8.8 7.9 10.4 9.3 8.1 6.8 6.1 6.2 5.3 4.9 4.4 3.5 2.4 1.9 2.3 2.5 2.0 1.6 1.2 1.11993 10.1 === 2.4 6.2 7.8 8.9 7.8 10.7 9.4 8.0 6.6 5.9 6.0 5.1 4.6 4.1 3.1 2.1 1.6 2.0 2.2 1.7 1.3 0.9 0.81994 8.0 6.0 === 10.1 10.6 11.1 9.2 12.5 10.6 8.9 7.2 6.3 6.3 5.3 4.8 4.2 3.2 2.1 1.5 2.0 2.2 1.6 1.2 0.9 0.8
P C 1995 9.2 8.7 11.5 === 11.0 11.6 8.9 13.1 10.7 8.7 6.7 5.9 5.9 4.8 4.3 3.7 2.7 1.5 1.0 1.5 1.7 1.2 0.8 0.4 0.3R U 1996 10.8 11.0 13.6 15.7 === 12.1 7.9 13.8 10.6 8.2 6.0 5.1 5.3 4.2 3.7 3.1 2.0 0.8 0.3 0.9 1.1 0.6 0.2 -0.1 -0.2E R 1997 11.1 11.3 13.2 14.0 12.4 === 3.9 14.6 10.1 7.2 4.9 4.0 4.3 3.2 2.8 2.2 1.1 -0.1 -0.6 0.1 0.5 -0.1 -0.4 -0.7 -0.8C R 1998 10.4 10.4 11.6 11.6 9.6 6.9 === 26.5 13.3 8.4 5.1 4.0 4.4 3.1 2.6 2.1 0.9 -0.4 -0.9 -0.2 0.2 -0.3 -0.7 -1.0 -1.0I E 1999 12.5 12.9 14.3 15.0 14.8 16.0 25.9 === 1.6 0.3 -1.2 -0.9 0.5 -0.3 -0.4 -0.6 -1.6 -2.8 -3.1 -2.1 -1.6 -2.0 -2.3 -2.5 -2.4O N 2000 11.3 11.4 12.4 12.6 11.8 11.6 14.0 3.3 === -0.9 -2.5 -1.7 0.2 -0.7 -0.7 -1.0 -2.0 -3.2 -3.6 -2.4 -1.8 -2.3 -2.6 -2.8 -2.7S T 2001 9.8 9.7 10.3 10.1 9.0 8.2 8.6 0.9 -1.4 === -4.1 -2.1 0.6 -0.6 -0.6 -1.0 -2.2 -3.5 -3.9 -2.6 -1.9 -2.4 -2.7 -2.9 -2.8
2002 8.5 8.3 8.6 8.2 6.9 5.9 5.6 -0.4 -2.1 -2.8 === -0.2 3.1 0.6 0.2 -0.3 -1.9 -3.5 -3.8 -2.4 -1.7 -2.2 -2.6 -2.8 -2.7C P 2003 7.7 7.4 7.6 7.1 5.9 4.9 4.5 -0.3 -1.4 -1.4 0.1 === 6.4 0.9 0.4 -0.4 -2.2 -4.0 -4.3 -2.7 -1.8 -2.4 -2.8 -3.0 -2.9O R 2004 7.5 7.2 7.4 6.9 5.9 5.0 4.6 0.8 0.2 0.8 2.6 5.3 === -4.2 -2.5 -2.5 -4.2 -6.0 -6.0 -3.9 -2.8 -3.4 -3.7 -3.9 -3.7R I 2005 6.8 6.6 6.6 6.1 5.1 4.3 3.9 0.6 0.1 0.5 1.6 2.3 -0.5 === -0.8 -1.7 -4.2 -6.4 -6.4 -3.9 -2.6 -3.3 -3.6 -3.8 -3.6R C 2006 6.3 6.0 6.0 5.5 4.5 3.7 3.3 0.4 0.0 0.3 1.0 1.4 -0.5 -0.6 === -2.5 -5.9 -8.2 -7.7 -4.5 -2.9 -3.6 -3.9 -4.2 -3.9I E 2007 5.8 5.5 5.4 4.9 4.0 3.2 2.8 0.2 -0.2 0.0 0.6 0.7 -0.8 -1.0 -1.3 === -9.2 -10.9 -9.4 -5.0 -3.0 -3.8 -4.1 -4.4 -4.0E S 2008 5.0 4.6 4.6 4.0 3.1 2.3 1.9 -0.5 -1.0 -0.9 -0.6 -0.7 -2.1 -2.7 -3.7 -6.0 === -12.5 -9.5 -3.5 -1.4 -2.7 -3.3 -3.6 -3.4N 2009 3.9 3.5 3.4 2.8 1.9 1.1 0.6 -1.7 -2.2 -2.3 -2.2 -2.6 -4.1 -5.0 -6.4 -8.9 -11.6 === -6.4 1.3 2.6 -0.1 -1.3 -2.1 -2.0T 2010 3.2 2.8 2.6 2.1 1.2 0.3 -0.2 -2.3 -2.8 -3.0 -3.0 -3.4 -4.8 -5.6 -6.8 -8.6 -9.9 -8.0 === 9.6 7.4 2.1 0.0 -1.2 -1.2E 2011 3.5 3.1 2.9 2.4 1.6 0.9 0.4 -1.5 -1.9 -1.9 -1.8 -2.1 -3.1 -3.5 -4.1 -4.8 -4.3 -0.5 7.7 === 5.3 -1.4 -3.0 -3.7 -3.2S 2012 3.7 3.3 3.2 2.7 2.0 1.3 0.9 -0.8 -1.1 -1.1 -0.9 -1.0 -1.8 -2.0 -2.2 -2.4 -1.4 2.2 7.8 7.8 === -7.7 -6.9 -6.5 -5.3
2013 3.2 2.8 2.7 2.2 1.4 0.8 0.4 -1.2 -1.6 -1.6 -1.4 -1.6 -2.3 -2.6 -2.8 -3.1 -2.5 -0.1 2.7 0.4 -6.6 === -6.1 -6.0 -4.52014 2.7 2.3 2.2 1.7 1.0 0.3 -0.1 -1.6 -1.9 -2.0 -1.9 -2.1 -2.8 -3.0 -3.3 -3.6 -3.2 -1.4 0.3 -2.0 -6.6 -6.6 === -5.8 -3.62015 2.4 2.0 1.9 1.4 0.7 0.1 -0.3 -1.7 -2.1 -2.1 -2.1 -2.2 -2.9 -3.1 -3.4 -3.7 -3.3 -1.9 -0.6 -2.5 -5.8 -5.4 -4.1 === -1.42016 2.1 1.7 1.6 1.1 0.4 -0.2 -0.5 -1.9 -2.2 -2.3 -2.2 -2.4 -3.0 -3.3 -3.5 -3.8 -3.5 -2.3 -1.3 -3.0 -5.5 -5.1 -4.3 -4.6 ===
P R E C I O S C O N S T A N T E S - C O N S T A N T P R I C E S
GROSS FIXED DOMESTIC INVESTMENTTASAS DE CRECIMIENTO ANUAL DE LA INVERSIÓN INTERNA BRUTA DE CAPITAL FIJO
1992 1993 1994 1995 1996 1997 1998 1999 2000 2001 2002 2003 2004 2005 2006 2007 2008 2009 2010 2011 2012 2013 2014 2015 2016
1992 === 2.2 1.2 3.4 8.0 8.8 9.2 10.7 9.7 8.4 7.0 6.0 5.6 4.6 3.4 2.6 1.8 0.2 -0.6 -0.5 0.3 -0.5 -1.3 -1.6 -2.01993 6.9 === 0.1 3.9 10.0 10.5 10.7 12.2 10.8 9.2 7.6 6.4 5.9 4.8 3.5 2.6 1.8 0.1 -0.8 -0.6 0.2 -0.6 -1.5 -1.8 -2.21994 5.5 4.1 === 7.9 15.3 14.2 13.5 14.7 12.7 10.6 8.5 7.1 6.5 5.2 3.7 2.8 1.9 0.1 -0.9 -0.7 0.2 -0.7 -1.6 -1.9 -2.3
P C 1995 7.2 7.3 10.6 === 23.2 17.5 15.5 16.5 13.7 11.1 8.6 7.0 6.3 4.9 3.4 2.4 1.5 -0.5 -1.4 -1.2 -0.3 -1.1 -2.0 -2.3 -2.7R U 1996 11.6 13.1 18.0 25.8 === 12.2 11.8 14.4 11.4 8.8 6.4 4.9 4.4 3.1 1.6 0.7 -0.2 -2.1 -3.0 -2.6 -1.6 -2.4 -3.3 -3.5 -3.9E R 1997 12.1 13.5 16.8 20.0 14.5 === 11.4 15.5 11.1 8.0 5.3 3.7 3.3 2.0 0.5 -0.4 -1.2 -3.2 -4.1 -3.6 -2.4 -3.3 -4.1 -4.3 -4.7C R 1998 12.5 13.6 16.2 18.0 14.4 14.2 === 19.7 11.0 6.8 3.8 2.2 2.0 0.7 -0.8 -1.6 -2.4 -4.4 -5.2 -4.7 -3.4 -4.2 -5.0 -5.2 -5.5I E 1999 13.8 15.0 17.4 19.1 17.0 18.2 22.3 === 3.0 0.9 -1.0 -1.7 -1.2 -2.1 -3.4 -4.0 -4.6 -6.5 -7.2 -6.5 -4.9 -5.7 -6.4 -6.6 -6.8O N 2000 12.6 13.5 15.1 16.0 13.7 13.5 13.1 4.5 === -1.1 -3.0 -3.2 -2.2 -3.1 -4.5 -4.9 -5.5 -7.5 -8.2 -7.3 -5.6 -6.3 -7.1 -7.2 -7.4S T 2001 11.0 11.5 12.6 12.9 10.5 9.6 8.1 1.6 -1.3 === -4.8 -4.3 -2.6 -3.6 -5.1 -5.6 -6.1 -8.3 -9.0 -7.9 -6.0 -6.7 -7.5 -7.6 -7.8
2002 9.4 9.7 10.4 10.4 8.0 6.7 4.9 -0.3 -2.6 -3.9 === -3.7 -1.4 -3.2 -5.2 -5.7 -6.3 -8.8 -9.5 -8.2 -6.1 -6.9 -7.8 -7.8 -8.0C P 2003 8.3 8.4 8.9 8.7 6.4 5.1 3.4 -0.8 -2.6 -3.2 -2.4 === 1.0 -3.0 -5.7 -6.2 -6.8 -9.6 -10.3 -8.8 -6.3 -7.2 -8.1 -8.1 -8.3O R 2004 7.9 8.0 8.4 8.2 6.1 5.0 3.5 0.1 -0.9 -0.8 0.8 4.1 === -6.8 -8.9 -8.5 -8.7 -11.6 -12.0 -10.1 -7.2 -8.1 -9.0 -8.9 -9.0R I 2005 7.2 7.2 7.5 7.2 5.3 4.2 2.8 -0.1 -1.0 -0.9 0.1 1.4 -1.2 === -10.9 -9.3 -9.3 -12.7 -13.0 -10.6 -7.3 -8.2 -9.2 -9.1 -9.2R C 2006 6.1 6.0 6.2 5.8 3.9 2.8 1.5 -1.2 -2.1 -2.3 -1.8 -1.6 -4.4 -7.4 === -7.6 -8.5 -13.3 -13.5 -10.5 -6.6 -7.8 -9.0 -8.9 -9.1I E 2007 5.3 5.2 5.3 4.9 3.1 2.1 0.8 -1.6 -2.5 -2.7 -2.4 -2.4 -4.5 -6.0 -4.6 === -9.4 -16.1 -15.4 -11.2 -6.4 -7.9 -9.2 -9.1 -9.2E S 2008 4.6 4.4 4.4 4.0 2.3 1.3 0.1 -2.1 -2.9 -3.2 -3.0 -3.2 -4.9 -6.1 -5.4 -6.3 === -22.2 -18.2 -11.8 -5.7 -7.6 -9.2 -9.0 -9.2N 2009 2.8 2.6 2.5 1.9 0.3 -0.8 -2.1 -4.2 -5.1 -5.6 -5.9 -6.4 -8.4 -10.1 -11.0 -14.0 -21.1 === -14.1 -6.2 0.6 -3.5 -6.3 -6.6 -7.2T 2010 1.8 1.5 1.4 0.8 -0.8 -1.9 -3.1 -5.1 -6.1 -6.6 -6.9 -7.5 -9.3 -10.8 -11.7 -13.9 -17.5 -13.8 === 2.5 8.8 0.3 -4.2 -5.1 -6.0E 2011 2.0 1.7 1.6 1.1 -0.4 -1.4 -2.5 -4.3 -5.1 -5.4 -5.6 -6.0 -7.4 -8.3 -8.5 -9.5 -10.5 -4.8 5.2 === 15.6 -0.8 -6.4 -6.9 -7.6S 2012 2.8 2.5 2.5 2.0 0.7 -0.2 -1.1 -2.8 -3.3 -3.5 -3.5 -3.6 -4.5 -5.0 -4.6 -4.5 -4.1 2.3 11.5 18.1 === -14.8 -15.8 -13.3 -12.6
2013 2.0 1.7 1.6 1.1 -0.2 -1.0 -2.0 -3.5 -4.1 -4.3 -4.4 -4.5 -5.5 -6.0 -5.8 -6.0 -5.9 -1.7 2.7 1.5 -12.7 === -16.7 -12.6 -11.82014 1.2 0.9 0.7 0.2 -1.0 -1.9 -2.8 -4.3 -4.9 -5.1 -5.2 -5.5 -6.4 -7.0 -6.9 -7.2 -7.4 -4.4 -1.8 -4.1 -13.6 -14.4 === -8.3 -9.32015 0.8 0.5 0.3 -0.1 -1.3 -2.2 -3.0 -4.4 -5.0 -5.3 -5.4 -5.6 -6.5 -7.0 -6.9 -7.2 -7.3 -4.8 -2.9 -4.8 -11.5 -10.8 -7.1 === -10.32016 0.3 0.0 -0.2 -0.7 -1.8 -2.6 -3.5 -4.8 -5.4 -5.6 -5.8 -6.0 -6.8 -7.3 -7.3 -7.6 -7.8 -5.7 -4.3 -6.1 -11.3 -10.8 -8.9 -10.7 ===
TASAS DE CRECIMIENTO ANUAL DE LA INVERSIÓN EN CONSTRUCCIÓNCONSTRUCTION INVESTMENT
P R E C I O S C O N S T A N T E S - C O N S T A N T P R I C E S

JUNTA DE PLANIFICACIÓN / PLANNING BOARD A-79
APÉNDICE ESTADÍSTICO • STATISTICAL APPENDIXINFORME ECONÓMICO AL GOBERNADOR 2016 • ECONOMIC REPORT TO THE GOVERNOR 2016
11
122
11
1992 1993 1994 1995 1996 1997 1998 1999 2000 2001 2002 2003 2004 2005 2006 2007 2008 2009 2010 2011 2012 2013 2014 2015 2016
1992 === 0.7 7.6 9.3 13.3 13.3 14.1 17.3 13.6 13.9 13.5 11.4 9.9 8.6 8.3 7.1 4.3 1.9 1.3 -0.3 -1.1 -1.4 -2.1 -1.9 -1.81993 5.4 === 15.0 13.9 17.8 16.7 17.0 20.4 15.6 15.7 15.0 12.5 10.8 9.3 8.9 7.5 4.6 2.0 1.3 -0.4 -1.2 -1.5 -2.3 -2.0 -1.91994 12.3 19.6 === 12.8 19.3 17.2 17.5 21.5 15.7 15.8 15.0 12.2 10.4 8.8 8.4 7.0 3.9 1.2 0.5 -1.2 -2.0 -2.4 -3.1 -2.8 -2.6
P C 1995 13.4 17.6 15.7 === 26.1 19.5 19.1 23.7 16.3 16.3 15.3 12.2 10.1 8.4 8.0 6.5 3.2 0.4 -0.3 -2.0 -2.8 -3.1 -3.8 -3.5 -3.3R U 1996 17.1 21.2 22.1 28.8 === 13.2 15.7 22.9 13.9 14.4 13.6 10.3 8.3 6.6 6.3 4.9 1.5 -1.3 -1.9 -3.7 -4.4 -4.6 -5.3 -4.8 -4.5E R 1997 16.8 19.8 19.9 22.0 15.6 === 18.3 28.1 14.2 14.7 13.7 9.8 7.6 5.8 5.6 4.1 0.5 -2.4 -3.0 -4.8 -5.5 -5.6 -6.2 -5.8 -5.4C R 1998 17.5 20.1 20.2 21.8 18.4 21.3 === 38.8 12.2 13.5 12.6 8.2 5.9 4.1 4.1 2.6 -1.1 -4.1 -4.6 -6.4 -7.0 -7.1 -7.6 -7.0 -6.6I E 1999 20.7 23.5 24.2 26.5 25.7 31.1 41.8 === -9.3 2.7 5.0 1.7 0.3 -0.7 -0.1 -1.2 -4.8 -7.6 -7.8 -9.4 -9.8 -9.7 -10.1 -9.3 -8.7O N 2000 16.7 18.4 18.2 18.7 16.3 16.5 14.2 -7.9 === 16.2 13.0 5.6 2.9 1.1 1.5 0.1 -4.2 -7.4 -7.6 -9.4 -9.8 -9.7 -10.1 -9.3 -8.7S T 2001 16.6 18.1 17.9 18.2 16.2 16.4 14.8 3.3 15.9 === 9.8 0.7 -1.2 -2.4 -1.2 -2.4 -6.8 -10.0 -10.0 -11.6 -11.9 -11.6 -11.9 -10.9 -10.1
2002 16.0 17.2 16.9 17.1 15.3 15.2 13.7 5.7 13.2 10.6 === -7.7 -6.3 -6.1 -3.8 -4.7 -9.3 -12.5 -12.2 -13.7 -13.8 -13.3 -13.5 -12.3 -11.4C P 2003 13.8 14.6 14.1 13.9 11.9 11.3 9.4 2.6 6.4 1.9 -6.2 === -4.8 -5.3 -2.5 -3.9 -9.6 -13.3 -12.8 -14.5 -14.4 -13.9 -14.0 -12.7 -11.7O R 2004 12.4 13.0 12.4 12.0 10.1 9.3 7.5 1.7 4.2 0.6 -4.1 -1.9 === -5.8 -1.3 -3.6 -10.8 -14.9 -14.1 -15.7 -15.6 -14.8 -14.9 -13.4 -12.2R I 2005 11.4 11.9 11.2 10.8 8.9 8.1 6.3 1.4 3.3 0.4 -2.8 -1.0 -0.2 === 3.5 -2.5 -12.4 -17.1 -15.6 -17.3 -16.9 -15.9 -15.8 -14.1 -12.8R C 2006 11.1 11.5 10.9 10.5 8.8 8.0 6.5 2.2 4.0 1.8 -0.3 1.7 3.6 7.5 === -8.2 -19.4 -23.0 -19.8 -20.9 -19.8 -18.3 -18.0 -15.8 -14.3I E 2007 9.9 10.2 9.5 9.1 7.4 6.6 5.1 1.3 2.6 0.6 -1.3 -0.1 0.6 0.9 -5.2 === -29.2 -29.4 -23.4 -23.8 -22.0 -19.9 -19.3 -16.8 -14.9E S 2008 7.2 7.3 6.5 5.8 4.1 3.1 1.4 -2.3 -1.6 -3.9 -6.1 -6.1 -7.1 -9.3 -16.6 -26.7 === -29.7 -20.3 -21.9 -20.1 -17.9 -17.5 -14.8 -13.0N 2009 4.6 4.6 3.6 2.8 1.1 -0.1 -1.8 -5.3 -5.0 -7.4 -9.7 -10.3 -11.9 -14.6 -20.9 -27.7 -28.7 === -9.7 -17.7 -16.6 -14.6 -14.8 -12.0 -10.3T 2010 3.8 3.7 2.8 2.0 0.3 -0.8 -2.4 -5.7 -5.5 -7.6 -9.7 -10.1 -11.5 -13.5 -18.1 -22.0 -19.6 -9.4 === -25.1 -19.9 -16.2 -16.0 -12.5 -10.4E 2011 2.2 2.0 1.0 0.2 -1.5 -2.6 -4.2 -7.3 -7.2 -9.3 -11.3 -11.9 -13.2 -15.2 -19.2 -22.3 -20.8 -16.5 -23.1 === -14.3 -11.4 -12.8 -9.0 -7.1S 2012 1.4 1.2 0.2 -0.6 -2.2 -3.3 -4.8 -7.7 -7.7 -9.6 -11.4 -11.9 -13.1 -14.8 -18.1 -20.4 -18.8 -15.2 -17.9 -12.4 === -8.4 -12.0 -7.2 -5.2
2013 1.0 0.8 -0.1 -0.9 -2.4 -3.5 -4.9 -7.6 -7.6 -9.3 -10.9 -11.4 -12.4 -13.8 -16.5 -18.2 -16.4 -13.0 -14.2 -9.4 -6.2 === -15.4 -6.6 -4.12014 0.3 0.1 -0.8 -1.6 -3.1 -4.1 -5.5 -8.0 -8.0 -9.6 -11.1 -11.5 -12.4 -13.7 -16.1 -17.5 -15.9 -13.0 -13.9 -10.6 -9.7 -13.1 === 3.1 2.12015 0.5 0.3 -0.6 -1.3 -2.7 -3.6 -4.9 -7.2 -7.2 -8.7 -10.0 -10.3 -11.0 -12.0 -14.0 -15.0 -13.2 -10.3 -10.5 -7.1 -5.2 -4.7 4.5 === 1.22016 0.5 0.3 -0.5 -1.2 -2.5 -3.4 -4.6 -6.8 -6.7 -8.1 -9.3 -9.5 -10.1 -11.0 -12.6 -13.4 -11.6 -8.8 -8.7 -5.6 -3.8 -3.0 2.5 0.7 ===
P R E C I O S C O N S T A N T E S - C O N S T A N T P R I C E S
PRIVATE HOUSING CONSTRUCTION INVESTMENTTASAS DE CRECIMIENTO ANUAL DE LA INVERSIÓN EN CONSTRUCCIÓN DE VIVIENDA PRIVADA
1992 1993 1994 1995 1996 1997 1998 1999 2000 2001 2002 2003 2004 2005 2006 2007 2008 2009 2010 2011 2012 2013 2014 2015 2016
1992 === 14.6 9.4 10.3 7.9 8.7 6.5 10.1 8.8 7.7 6.5 6.3 6.7 6.0 6.2 5.8 4.8 4.1 3.8 4.2 4.1 3.6 3.4 3.0 3.01993 13.6 === 4.5 8.3 5.7 7.3 5.0 9.4 8.0 6.9 5.7 5.5 6.0 5.4 5.5 5.2 4.2 3.5 3.2 3.7 3.5 3.1 2.9 2.5 2.51994 10.7 7.9 === 12.1 6.3 8.2 5.1 10.4 8.6 7.2 5.8 5.6 6.2 5.4 5.6 5.3 4.2 3.4 3.1 3.6 3.5 3.1 2.8 2.4 2.4
P C 1995 11.3 10.1 12.4 === 0.8 6.3 2.8 9.9 7.9 6.4 4.9 4.8 5.6 4.8 5.1 4.7 3.6 2.8 2.5 3.1 3.0 2.6 2.3 2.0 2.0R U 1996 9.9 8.6 9.0 5.8 === 12.1 3.8 13.2 9.8 7.6 5.7 5.4 6.2 5.2 5.5 5.1 3.8 3.0 2.6 3.3 3.1 2.7 2.4 2.0 2.0E R 1997 9.9 8.9 9.3 7.8 9.8 === -3.8 13.7 9.0 6.5 4.4 4.3 5.3 4.4 4.8 4.4 3.1 2.3 1.9 2.7 2.5 2.1 1.9 1.5 1.5C R 1998 7.8 6.7 6.4 4.4 3.8 -2.0 === 34.5 16.0 10.1 6.6 6.0 7.0 5.6 5.9 5.4 3.8 2.9 2.4 3.2 3.0 2.5 2.3 1.8 1.8I E 1999 10.8 10.4 10.9 10.5 12.1 13.3 30.9 === 0.1 -0.3 -1.4 -0.1 2.2 1.5 2.4 2.2 0.9 0.1 -0.1 0.9 0.9 0.6 0.4 0.1 0.2O N 2000 9.6 9.1 9.3 8.7 9.4 9.2 15.3 1.6 === -0.7 -2.1 -0.1 2.7 1.8 2.8 2.5 1.0 0.1 -0.1 1.0 1.0 0.6 0.4 0.1 0.2S T 2001 8.3 7.7 7.7 6.9 7.1 6.4 9.4 0.0 -1.5 === -3.4 0.2 3.9 2.4 3.5 3.0 1.2 0.2 0.0 1.2 1.2 0.7 0.5 0.1 0.2
2002 7.3 6.7 6.5 5.7 5.7 4.8 6.6 -0.4 -1.4 -1.3 === 3.9 7.7 4.4 5.3 4.4 2.0 0.8 0.4 1.7 1.6 1.1 0.9 0.4 0.5C P 2003 7.0 6.3 6.1 5.4 5.3 4.6 6.0 0.5 0.2 1.0 3.4 === 11.7 4.7 5.7 4.5 1.7 0.3 -0.1 1.4 1.4 0.8 0.6 0.1 0.2O R 2004 6.9 6.4 6.2 5.5 5.5 4.9 6.1 1.7 1.8 2.9 5.0 6.7 === -1.9 2.9 2.2 -0.7 -1.9 -1.9 0.1 0.2 -0.3 -0.4 -0.9 -0.7R I 2005 6.4 5.8 5.7 5.0 4.9 4.3 5.3 1.5 1.5 2.3 3.5 3.5 0.4 === 7.8 4.4 -0.3 -1.9 -1.9 0.4 0.5 -0.1 -0.3 -0.8 -0.5R C 2006 6.5 6.0 5.8 5.3 5.2 4.7 5.6 2.4 2.5 3.3 4.5 4.9 4.0 7.7 === 1.0 -4.2 -4.9 -4.3 -1.0 -0.7 -1.2 -1.3 -1.7 -1.3I E 2007 6.2 5.7 5.5 5.0 4.9 4.4 5.2 2.3 2.4 3.1 4.0 4.2 3.4 4.9 2.1 === -9.1 -7.7 -5.9 -1.5 -1.1 -1.6 -1.6 -2.0 -1.6E S 2008 5.4 4.9 4.7 4.1 4.0 3.5 4.0 1.4 1.4 1.8 2.3 2.1 1.0 1.2 -1.9 -5.7 === -6.3 -4.3 1.1 1.0 0.0 -0.3 -1.0 -0.6N 2009 4.9 4.4 4.2 3.6 3.5 3.0 3.4 1.0 0.9 1.3 1.6 1.3 0.3 0.3 -2.1 -4.1 -2.5 === -2.3 5.0 3.6 1.6 1.0 0.0 0.2T 2010 4.4 3.9 3.7 3.1 2.9 2.4 2.8 0.6 0.5 0.7 1.0 0.6 -0.4 -0.5 -2.5 -3.9 -3.0 -3.5 === 12.9 6.7 3.0 1.8 0.4 0.7E 2011 4.7 4.2 4.0 3.5 3.4 2.9 3.3 1.3 1.3 1.5 1.9 1.7 1.0 1.1 -0.2 -0.8 1.0 2.7 9.4 === 0.9 -1.7 -1.6 -2.5 -1.6S 2012 4.5 4.1 3.8 3.4 3.2 2.8 3.1 1.3 1.2 1.5 1.8 1.6 1.0 1.1 0.0 -0.4 0.9 2.1 5.1 0.9 === -4.2 -2.9 -3.6 -2.3
2013 4.2 3.8 3.5 3.1 2.9 2.5 2.8 1.0 1.0 1.2 1.4 1.3 0.7 0.7 -0.3 -0.7 0.4 1.1 2.7 -0.4 -1.8 === -1.5 -3.3 -1.62014 4.0 3.5 3.3 2.8 2.7 2.3 2.5 0.9 0.8 1.0 1.2 1.0 0.5 0.5 -0.4 -0.7 0.1 0.7 1.7 -0.7 -1.5 -1.2 === -5.0 -1.72015 3.7 3.2 3.0 2.6 2.4 2.0 2.3 0.7 0.6 0.8 0.9 0.8 0.2 0.2 -0.6 -0.9 -0.2 0.2 0.9 -1.1 -1.7 -1.7 -2.2 === 1.82016 3.5 3.0 2.8 2.4 2.2 1.8 2.1 0.6 0.5 0.7 0.8 0.6 0.1 0.1 -0.7 -0.9 -0.3 0.0 0.6 -1.1 -1.6 -1.5 -1.7 -1.1 ===
P R E C I O S C O N S T A N T E S - C O N S T A N T P R I C E S
MACHINERY AND EQUIPMENT INVESTMENTTASAS DE CRECIMIENTO ANUAL DE LA INVERSIÓN EN MAQUINARIA Y EQUIPO

A-80 JUNTA DE PLANIFICACIÓN / PLANNING BOARD
APÉNDICE ESTADÍSTICO • STATISTICAL APPENDIXINFORME ECONÓMICO AL GOBERNADOR 2016 • ECONOMIC REPORT TO THE GOVERNOR 2016
13
144
3333
1992 1993 1994 1995 1996 1997 1998 1999 2000 2001 2002 2003 2004 2005 2006 2007 2008 2009 2010 2011 2012 2013 2014 2015 2016
1992 === 4.6 4.4 4.5 3.9 4.1 4.3 4.5 4.7 4.9 4.6 4.4 4.2 3.7 3.3 3.0 2.7 2.4 2.3 2.1 2.0 1.9 1.8 1.7 1.51993 6.6 === 4.2 4.4 3.7 4.0 4.3 4.5 4.7 4.9 4.6 4.4 4.2 3.6 3.2 2.9 2.6 2.3 2.1 2.0 1.9 1.8 1.6 1.5 1.31994 7.1 7.5 === 4.5 3.4 3.9 4.3 4.5 4.8 5.0 4.7 4.4 4.2 3.6 3.2 2.8 2.5 2.2 2.0 1.9 1.8 1.7 1.5 1.4 1.2
P C 1995 7.2 7.5 7.4 === 2.3 3.6 4.2 4.5 4.9 5.1 4.7 4.4 4.1 3.5 3.0 2.7 2.3 2.0 1.9 1.7 1.6 1.5 1.4 1.2 1.1R U 1996 7.0 7.1 6.9 6.3 === 4.9 5.2 5.3 5.5 5.7 5.1 4.7 4.4 3.6 3.1 2.7 2.3 2.0 1.8 1.7 1.6 1.5 1.3 1.2 1.0E R 1997 6.8 6.9 6.7 6.3 6.3 === 5.5 5.5 5.7 5.9 5.1 4.7 4.3 3.5 2.9 2.5 2.1 1.8 1.6 1.4 1.4 1.2 1.1 1.0 0.8C R 1998 7.7 7.9 8.0 8.2 9.2 12.2 === 5.4 5.8 6.0 5.0 4.5 4.1 3.2 2.6 2.2 1.8 1.4 1.3 1.1 1.1 1.0 0.8 0.7 0.5I E 1999 7.6 7.8 7.8 7.9 8.5 9.6 6.9 === 6.2 6.3 4.9 4.3 3.8 2.8 2.2 1.8 1.4 1.0 0.9 0.8 0.7 0.7 0.5 0.4 0.3O N 2000 7.7 7.9 7.9 8.0 8.5 9.2 7.7 8.5 === 6.4 4.3 3.6 3.2 2.2 1.6 1.2 0.8 0.5 0.4 0.3 0.3 0.2 0.1 0.1 -0.1S T 2001 8.1 8.3 8.4 8.5 9.0 9.7 8.8 9.7 11.0 === 2.2 2.3 2.2 1.1 0.6 0.3 0.0 -0.2 -0.3 -0.3 -0.2 -0.3 -0.3 -0.4 -0.5
2002 7.7 7.8 7.8 7.9 8.1 8.5 7.6 7.8 7.5 4.1 === 2.3 2.2 0.8 0.2 -0.1 -0.4 -0.6 -0.6 -0.5 -0.5 -0.5 -0.5 -0.6 -0.7C P 2003 7.4 7.5 7.5 7.5 7.6 7.9 7.0 7.0 6.5 4.3 4.5 === 2.0 0.0 -0.5 -0.7 -0.9 -1.1 -1.0 -0.9 -0.8 -0.7 -0.8 -0.8 -1.0O R 2004 7.3 7.3 7.3 7.3 7.4 7.6 6.8 6.8 6.4 4.9 5.2 5.9 === -2.0 -1.7 -1.5 -1.6 -1.7 -1.5 -1.3 -1.1 -1.0 -1.1 -1.1 -1.2R I 2005 7.0 7.1 7.0 7.0 7.1 7.2 6.5 6.4 6.0 4.8 5.0 5.2 4.5 === -1.4 -1.3 -1.5 -1.6 -1.4 -1.2 -1.0 -0.9 -1.0 -1.0 -1.1R C 2006 6.8 6.8 6.8 6.7 6.8 6.8 6.2 6.1 5.7 4.6 4.7 4.8 4.2 4.0 === -1.2 -1.5 -1.7 -1.3 -1.1 -1.0 -0.9 -0.9 -0.9 -1.1I E 2007 6.5 6.5 6.5 6.4 6.4 6.4 5.8 5.6 5.2 4.3 4.3 4.2 3.7 3.3 2.6 === -1.8 -1.9 -1.4 -1.1 -0.9 -0.8 -0.9 -0.9 -1.1E S 2008 6.4 6.4 6.3 6.2 6.2 6.2 5.6 5.5 5.1 4.3 4.3 4.3 3.9 3.7 3.6 4.6 === -2.0 -1.2 -0.9 -0.7 -0.6 -0.7 -0.8 -1.0N 2009 6.2 6.2 6.1 6.0 6.0 5.9 5.4 5.2 4.9 4.1 4.1 4.1 3.7 3.5 3.4 3.8 2.9 === -0.4 -0.4 -0.2 -0.3 -0.4 -0.6 -0.9T 2010 6.0 5.9 5.8 5.7 5.7 5.6 5.1 4.9 4.6 3.9 3.9 3.8 3.4 3.2 3.0 3.2 2.5 2.1 === -0.4 -0.2 -0.2 -0.5 -0.6 -0.9E 2011 5.8 5.7 5.6 5.5 5.4 5.4 4.9 4.7 4.4 3.7 3.7 3.6 3.2 3.0 2.8 2.9 2.3 2.0 2.0 === 0.0 -0.1 -0.5 -0.6 -1.0S 2012 5.5 5.5 5.4 5.2 5.2 5.1 4.6 4.4 4.1 3.5 3.4 3.3 3.0 2.8 2.6 2.6 2.1 1.8 1.6 1.2 === -0.3 -0.7 -0.9 -1.3
2013 5.3 5.2 5.1 5.0 4.9 4.8 4.4 4.2 3.8 3.3 3.2 3.1 2.7 2.5 2.3 2.3 1.8 1.5 1.4 1.0 0.9 === -1.2 -1.2 -1.62014 5.1 5.0 4.9 4.7 4.6 4.5 4.1 3.9 3.6 3.0 2.9 2.8 2.5 2.2 2.0 1.9 1.5 1.2 1.0 0.7 0.4 0.0 === -1.1 -1.92015 4.9 4.8 4.7 4.5 4.4 4.3 3.9 3.7 3.4 2.8 2.7 2.6 2.3 2.1 1.9 1.8 1.4 1.1 0.9 0.7 0.5 0.3 0.7 === -2.62016 4.7 4.7 4.5 4.4 4.3 4.2 3.8 3.6 3.3 2.8 2.7 2.5 2.3 2.1 1.9 1.8 1.4 1.2 1.1 0.9 0.8 0.8 1.3 1.8 =
P R E C I O S C O N S T A N T E S - C O N S T A N T P R I C E S
GROSS DOMESTIC PRODUCTTASAS DE CRECIMIENTO ANUAL DEL PRODUCTO INTERNO BRUTO
1992 1993 1994 1995 1996 1997 1998 1999 2000 2001 2002 2003 2004 2005 2006 2007 2008 2009 2010 2011 2012 2013 2014 2015 2016
1992 === 3.9 3.6 3.6 3.0 3.2 3.4 3.6 3.9 4.1 3.9 3.8 3.6 3.2 2.9 2.6 2.4 2.2 2.0 2.0 1.9 1.9 1.8 1.7 1.61993 5.8 === 3.3 3.4 2.7 3.0 3.3 3.6 3.9 4.2 3.9 3.8 3.6 3.1 2.8 2.5 2.3 2.0 1.9 1.9 1.8 1.8 1.7 1.6 1.51994 6.2 6.5 === 3.6 2.4 2.9 3.3 3.6 4.0 4.3 4.0 3.8 3.6 3.1 2.7 2.5 2.2 2.0 1.8 1.8 1.7 1.7 1.6 1.6 1.5
P C 1995 6.3 6.5 6.5 === 1.3 2.5 3.3 3.7 4.1 4.4 4.1 3.8 3.6 3.1 2.7 2.4 2.1 1.9 1.7 1.7 1.6 1.6 1.5 1.5 1.4R U 1996 6.0 6.1 5.8 5.2 === 3.8 4.3 4.5 4.8 5.1 4.5 4.2 3.9 3.3 2.8 2.5 2.2 1.9 1.8 1.7 1.6 1.6 1.5 1.5 1.4E R 1997 5.9 5.9 5.6 5.2 5.2 === 4.7 4.8 5.1 5.4 4.7 4.3 3.9 3.2 2.7 2.4 2.0 1.7 1.6 1.5 1.5 1.5 1.4 1.3 1.2C R 1998 6.8 6.9 7.0 7.2 8.3 11.4 === 4.8 5.3 5.6 4.7 4.2 3.8 3.0 2.5 2.1 1.8 1.5 1.4 1.3 1.3 1.3 1.2 1.2 1.0I E 1999 6.7 6.8 6.9 7.0 7.6 8.9 6.4 === 5.8 6.0 4.6 4.0 3.6 2.7 2.1 1.8 1.4 1.1 1.0 1.0 1.0 1.0 0.9 0.9 0.8O N 2000 6.9 7.0 7.1 7.2 7.7 8.6 7.2 8.1 === 6.2 4.1 3.5 3.1 2.1 1.5 1.2 0.9 0.6 0.6 0.6 0.6 0.6 0.6 0.6 0.5S T 2001 7.3 7.5 7.6 7.8 8.3 9.1 8.4 9.4 10.8 === 2.0 2.1 2.1 1.0 0.6 0.4 0.2 0.0 0.0 0.0 0.1 0.2 0.2 0.2 0.2
2002 7.0 7.1 7.1 7.2 7.6 8.1 7.3 7.6 7.3 4.0 === 2.2 2.1 0.7 0.3 0.1 -0.1 -0.3 -0.3 -0.2 -0.1 0.0 0.0 0.1 0.0C P 2003 6.7 6.8 6.8 6.9 7.1 7.5 6.7 6.8 6.3 4.2 4.4 === 1.9 0.0 -0.4 -0.4 -0.6 -0.7 -0.6 -0.5 -0.3 -0.2 -0.1 -0.1 -0.1O R 2004 6.7 6.7 6.7 6.8 7.0 7.2 6.5 6.6 6.2 4.7 5.2 5.9 === -1.9 -1.5 -1.2 -1.3 -1.3 -1.0 -0.8 -0.6 -0.4 -0.4 -0.3 -0.3R I 2005 6.5 6.5 6.5 6.6 6.7 6.9 6.3 6.2 5.9 4.7 4.9 5.2 4.5 === -1.1 -0.9 -1.0 -1.1 -0.9 -0.6 -0.4 -0.2 -0.2 -0.1 -0.2R C 2006 6.3 6.4 6.4 6.3 6.5 6.6 6.0 6.0 5.6 4.6 4.8 4.9 4.4 4.3 === -0.6 -1.0 -1.1 -0.8 -0.6 -0.3 -0.1 -0.1 0.0 -0.1I E 2007 6.1 6.1 6.1 6.1 6.1 6.2 5.7 5.6 5.3 4.4 4.4 4.4 4.0 3.7 3.1 === -1.3 -1.3 -0.9 -0.5 -0.2 0.0 0.0 0.1 0.0E S 2008 6.1 6.1 6.0 6.0 6.1 6.1 5.6 5.6 5.2 4.5 4.6 4.6 4.3 4.2 4.1 5.2 === -1.4 -0.6 -0.3 0.1 0.3 0.2 0.3 0.1N 2009 5.9 5.9 5.9 5.8 5.9 5.9 5.4 5.3 5.1 4.4 4.4 4.4 4.1 4.0 3.9 4.4 3.5 === 0.1 0.3 0.6 0.7 0.6 0.6 0.4T 2010 5.7 5.7 5.7 5.6 5.6 5.7 5.2 5.1 4.8 4.2 4.2 4.2 3.9 3.7 3.6 3.8 3.1 2.6 === 0.5 0.8 0.9 0.7 0.7 0.4E 2011 5.6 5.6 5.5 5.4 5.4 5.5 5.0 4.9 4.6 4.0 4.0 4.0 3.7 3.6 3.5 3.5 3.0 2.7 2.9 === 1.2 1.0 0.8 0.7 0.4S 2012 5.4 5.4 5.3 5.3 5.3 5.3 4.8 4.7 4.4 3.9 3.9 3.8 3.6 3.4 3.3 3.3 2.8 2.6 2.6 2.4 === 0.9 0.5 0.6 0.2
2013 5.2 5.2 5.1 5.1 5.1 5.1 4.6 4.5 4.3 3.7 3.7 3.6 3.4 3.3 3.1 3.1 2.7 2.5 2.4 2.2 2.1 === 0.2 0.4 0.02014 5.1 5.0 5.0 4.9 4.9 4.8 4.4 4.3 4.0 3.6 3.5 3.4 3.2 3.0 2.9 2.9 2.5 2.3 2.2 2.0 1.7 1.4 === 0.6 -0.12015 4.9 4.9 4.8 4.8 4.7 4.7 4.3 4.2 3.9 3.5 3.4 3.3 3.1 3.0 2.8 2.8 2.5 2.3 2.2 2.1 2.0 1.9 2.4 === -0.92016 4.9 4.9 4.8 4.7 4.7 4.6 4.3 4.2 3.9 3.5 3.4 3.4 3.2 3.0 2.9 2.9 2.6 2.5 2.5 2.4 2.4 2.5 3.0 3.7 =
P R E C I O S C O N S T A N T E S - C O N S T A N T P R I C E S
PER CAPITA GROSS DOMESTIC PRODUCTTASAS DE CRECIMIENTO ANUAL DEL PRODUCTO INTERNO BRUTO INTERNO PER CÁPITA

JUNTA DE PLANIFICACIÓN / PLANNING BOARD A-81
APÉNDICE ESTADÍSTICO • STATISTICAL APPENDIXINFORME ECONÓMICO AL GOBERNADOR 2016 • ECONOMIC REPORT TO THE GOVERNOR 2016
15
166
555
1992 1993 1994 1995 1996 1997 1998 1999 2000 2001 2002 2003 2004 2005 2006 2007 2008 2009 2010 2011 2012 2013 2014 2015 2016
1992 === 6.4 4.7 4.8 5.6 5.9 5.4 5.4 5.1 5.0 4.9 4.8 4.5 4.5 4.0 3.8 3.6 3.3 3.2 3.0 2.9 2.8 2.5 2.4 2.21993 7.4 === 3.1 4.0 5.3 5.8 5.2 5.3 4.9 4.8 4.7 4.6 4.4 4.3 3.9 3.6 3.4 3.2 3.0 2.9 2.7 2.7 2.3 2.2 2.11994 6.3 5.1 === 4.9 6.4 6.7 5.7 5.7 5.2 5.0 4.9 4.8 4.5 4.4 3.9 3.6 3.4 3.2 3.0 2.9 2.7 2.6 2.3 2.2 2.0
P C 1995 6.1 5.5 5.9 === 8.1 7.6 6.0 6.0 5.3 5.1 4.9 4.8 4.5 4.4 3.8 3.5 3.3 3.0 2.8 2.7 2.5 2.5 2.2 2.0 1.9R U 1996 6.9 6.7 7.5 9.3 === 7.1 5.1 5.3 4.6 4.5 4.4 4.3 4.0 4.0 3.4 3.1 2.9 2.7 2.5 2.4 2.2 2.2 1.9 1.7 1.6E R 1997 7.4 7.3 8.1 9.2 9.2 === 3.0 4.3 3.8 3.8 3.8 3.9 3.6 3.6 3.0 2.7 2.6 2.3 2.1 2.0 1.9 1.9 1.6 1.4 1.3C R 1998 7.0 6.9 7.3 7.8 7.1 5.1 === 5.7 4.2 4.1 4.0 4.0 3.7 3.6 3.0 2.7 2.5 2.2 2.0 2.0 1.8 1.8 1.5 1.3 1.2I E 1999 6.9 6.8 7.2 7.5 7.0 5.9 6.6 === 2.8 3.3 3.5 3.6 3.3 3.3 2.6 2.3 2.2 1.9 1.7 1.7 1.5 1.6 1.2 1.1 0.9O N 2000 6.8 6.7 7.0 7.3 6.8 6.0 6.4 6.1 === 3.8 3.8 3.9 3.4 3.4 2.6 2.2 2.1 1.8 1.6 1.6 1.4 1.5 1.1 0.9 0.8S T 2001 6.8 6.8 7.0 7.2 6.8 6.2 6.6 6.5 6.9 === 3.9 4.0 3.3 3.3 2.4 2.0 1.9 1.5 1.4 1.4 1.2 1.3 0.9 0.7 0.6
2002 6.5 6.4 6.6 6.7 6.2 5.6 5.8 5.5 5.2 3.4 === 4.1 3.0 3.1 2.0 1.6 1.5 1.2 1.1 1.1 0.9 1.0 0.6 0.5 0.4C P 2003 6.4 6.3 6.4 6.5 6.1 5.6 5.7 5.4 5.2 4.3 5.3 === 2.0 2.7 1.3 1.0 1.0 0.7 0.6 0.7 0.6 0.7 0.3 0.2 0.1O R 2004 6.1 6.0 6.1 6.1 5.7 5.2 5.3 5.0 4.7 4.0 4.2 3.2 === 3.3 1.0 0.6 0.8 0.5 0.4 0.5 0.4 0.6 0.1 0.1 0.0R I 2005 6.2 6.1 6.2 6.2 5.9 5.4 5.5 5.3 5.1 4.7 5.1 5.1 7.0 === -1.3 -0.7 0.0 -0.2 -0.1 0.1 0.0 0.3 -0.2 -0.3 -0.3R C 2006 6.0 5.9 6.0 6.0 5.7 5.3 5.3 5.1 5.0 4.6 4.9 4.7 5.5 4.1 === 0.0 0.6 0.2 0.2 0.3 0.2 0.5 -0.1 -0.2 -0.2I E 2007 5.8 5.7 5.7 5.7 5.4 5.0 5.0 4.8 4.6 4.2 4.4 4.2 4.5 3.3 2.4 === 1.3 0.3 0.2 0.4 0.2 0.6 -0.1 -0.2 -0.3E S 2008 5.9 5.8 5.8 5.8 5.5 5.2 5.2 5.1 4.9 4.7 4.9 4.8 5.2 4.6 4.9 7.4 === -0.7 -0.3 0.1 0.0 0.4 -0.3 -0.4 -0.4N 2009 5.7 5.6 5.7 5.6 5.4 5.1 5.0 4.9 4.8 4.5 4.6 4.5 4.8 4.3 4.3 5.3 3.3 === 0.1 0.6 0.2 0.7 -0.2 -0.3 -0.4T 2010 5.5 5.4 5.4 5.4 5.1 4.8 4.8 4.6 4.4 4.2 4.3 4.1 4.3 3.7 3.7 4.1 2.4 1.6 === 1.1 0.3 0.9 -0.3 -0.4 -0.5E 2011 5.3 5.2 5.2 5.2 4.9 4.6 4.5 4.4 4.2 3.9 4.0 3.8 3.9 3.4 3.3 3.5 2.3 1.8 2.0 === -0.5 0.8 -0.7 -0.8 -0.8S 2012 5.1 5.0 5.0 4.9 4.7 4.4 4.3 4.2 4.0 3.7 3.8 3.6 3.7 3.2 3.0 3.2 2.1 1.8 1.9 1.7 === 2.2 -0.8 -0.8 -0.9
2013 5.0 4.9 4.9 4.8 4.6 4.3 4.3 4.1 3.9 3.7 3.7 3.6 3.6 3.2 3.1 3.2 2.3 2.1 2.3 2.4 3.1 === -3.8 -2.3 -1.92014 4.7 4.6 4.6 4.5 4.2 4.0 3.9 3.7 3.5 3.3 3.3 3.1 3.1 2.6 2.5 2.5 1.7 1.3 1.3 1.0 0.7 -1.6 === -0.8 -0.92015 4.6 4.4 4.4 4.3 4.1 3.8 3.7 3.5 3.4 3.1 3.1 2.9 2.9 2.5 2.3 2.3 1.6 1.3 1.3 1.1 0.9 -0.2 1.2 === -0.92016 4.4 4.2 4.2 4.1 3.9 3.6 3.5 3.3 3.2 2.9 2.9 2.7 2.6 2.3 2.1 2.0 1.4 1.1 1.1 0.9 0.7 -0.1 0.6 0.0 =
P R E C I O S C O N S T A N T E S - C O N S T A N T P R I C E S
PERSONAL INCOMETASAS DE CRECIMIENTO ANUAL DEL INGRESO PERSONAL
1992 1993 1994 1995 1996 1997 1998 1999 2000 2001 2002 2003 2004 2005 2006 2007 2008 2009 2010 2011 2012 2013 2014 2015 2016
1992 === 5.6 3.9 3.9 4.6 4.9 4.5 4.6 4.3 4.2 4.2 4.1 4.0 3.9 3.5 3.3 3.3 3.0 2.9 2.9 2.7 2.8 2.5 2.5 2.41993 6.6 === 2.2 3.0 4.3 4.8 4.2 4.4 4.1 4.0 4.0 4.0 3.8 3.8 3.4 3.2 3.1 2.9 2.8 2.7 2.6 2.6 2.4 2.3 2.31994 5.4 4.2 === 3.9 5.4 5.6 4.8 4.8 4.4 4.3 4.2 4.2 4.0 3.9 3.5 3.3 3.2 2.9 2.8 2.7 2.6 2.7 2.4 2.3 2.3
P C 1995 5.2 4.5 4.9 === 7.0 6.5 5.1 5.1 4.5 4.4 4.3 4.2 4.0 3.9 3.5 3.2 3.1 2.9 2.7 2.7 2.5 2.6 2.3 2.2 2.2R U 1996 5.9 5.7 6.5 8.2 === 6.0 4.1 4.5 3.9 3.9 3.8 3.9 3.6 3.6 3.1 2.9 2.8 2.6 2.4 2.4 2.3 2.3 2.1 2.0 1.9E R 1997 6.4 6.3 7.0 8.1 8.1 === 2.2 3.7 3.2 3.3 3.4 3.5 3.3 3.3 2.8 2.6 2.5 2.3 2.1 2.1 2.0 2.1 1.8 1.8 1.7C R 1998 6.0 5.9 6.3 6.8 6.2 4.3 === 5.1 3.7 3.7 3.7 3.7 3.4 3.4 2.9 2.6 2.5 2.3 2.1 2.1 2.0 2.1 1.8 1.8 1.7I E 1999 6.0 5.9 6.3 6.6 6.1 5.2 6.1 === 2.4 3.0 3.2 3.4 3.1 3.2 2.5 2.3 2.2 2.0 1.9 1.9 1.8 1.9 1.6 1.6 1.5O N 2000 6.0 5.9 6.2 6.5 6.0 5.4 5.9 5.7 === 3.6 3.6 3.8 3.3 3.3 2.6 2.3 2.2 2.0 1.8 1.8 1.7 1.9 1.5 1.5 1.5S T 2001 6.1 6.0 6.3 6.5 6.2 5.7 6.1 6.2 6.6 === 3.7 3.9 3.2 3.3 2.4 2.1 2.0 1.8 1.6 1.7 1.6 1.7 1.4 1.4 1.3
2002 5.8 5.7 5.9 6.0 5.7 5.2 5.4 5.2 4.9 3.2 === 4.0 3.0 3.1 2.1 1.7 1.8 1.5 1.4 1.4 1.4 1.5 1.2 1.2 1.2C P 2003 5.7 5.6 5.8 5.9 5.6 5.2 5.4 5.2 5.0 4.2 5.2 === 2.0 2.7 1.4 1.2 1.3 1.1 1.0 1.1 1.1 1.3 1.0 0.9 0.9O R 2004 5.5 5.4 5.5 5.6 5.3 4.9 5.0 4.8 4.5 3.9 4.2 3.2 === 3.4 1.1 0.9 1.2 0.9 0.8 1.0 1.0 1.2 0.9 0.9 0.9R I 2005 5.6 5.5 5.7 5.7 5.5 5.2 5.3 5.2 5.0 4.6 5.1 5.1 7.0 === -1.0 -0.3 0.4 0.3 0.3 0.6 0.6 1.0 0.6 0.6 0.6R C 2006 5.5 5.4 5.6 5.6 5.4 5.1 5.2 5.0 4.9 4.6 4.9 4.8 5.7 4.4 === 0.5 1.2 0.7 0.7 0.9 0.9 1.3 0.8 0.8 0.8I E 2007 5.4 5.3 5.4 5.4 5.1 4.9 4.9 4.8 4.6 4.3 4.5 4.4 4.8 3.7 3.0 === 1.9 0.9 0.8 1.1 1.0 1.4 0.8 0.8 0.8E S 2008 5.5 5.5 5.5 5.6 5.4 5.1 5.2 5.1 5.1 4.8 5.1 5.1 5.6 5.1 5.5 8.0 === -0.2 0.2 0.8 0.8 1.3 0.6 0.7 0.7N 2009 5.4 5.3 5.4 5.5 5.3 5.0 5.1 5.0 4.9 4.7 4.9 4.9 5.2 4.8 4.9 5.9 3.8 === 0.6 1.3 1.1 1.6 0.8 0.8 0.8T 2010 5.2 5.2 5.2 5.2 5.0 4.8 4.8 4.7 4.6 4.4 4.6 4.5 4.7 4.3 4.2 4.6 3.0 2.2 === 1.9 1.3 2.0 0.9 0.9 0.9E 2011 5.1 5.0 5.1 5.1 4.9 4.7 4.7 4.6 4.5 4.3 4.4 4.3 4.4 4.0 3.9 4.2 2.9 2.5 2.8 === 0.7 2.0 0.5 0.6 0.6S 2012 5.0 4.9 5.0 5.0 4.8 4.6 4.6 4.5 4.3 4.1 4.2 4.1 4.2 3.9 3.8 3.9 2.9 2.6 2.9 2.9 === 3.4 0.4 0.6 0.6
2013 5.4 5.3 5.2 5.1 5.0 4.9 4.4 4.3 3.9 3.4 3.3 3.2 2.9 2.7 2.5 2.5 2.0 1.8 1.7 1.6 1.9 === -2.4 -0.8 -0.32014 4.7 4.6 4.7 4.6 4.5 4.2 4.2 4.1 4.0 3.8 3.9 3.7 3.8 3.4 3.3 3.4 2.6 2.4 2.4 2.3 2.0 -0.2 === 0.9 0.82015 4.6 4.6 4.6 4.6 4.4 4.2 4.2 4.0 3.9 3.7 3.8 3.7 3.7 3.4 3.3 3.3 2.7 2.5 2.5 2.5 2.3 1.3 2.9 === 0.82016 4.5 4.4 4.5 4.4 4.2 4.0 4.0 3.9 3.8 3.6 3.6 3.5 3.6 3.2 3.1 3.2 2.6 2.4 2.4 2.3 2.2 1.5 2.4 1.8 =
P R E C I O S C O N S T A N T E S - C O N S T A N T P R I C E S
PER CAPITA PERSONAL INCOMETASAS DE CRECIMIENTO ANUAL DEL INGRESO PERSONAL PER CÁPITA

A-82 JUNTA DE PLANIFICACIÓN / PLANNING BOARD
APÉNDICE ESTADÍSTICO • STATISTICAL APPENDIXINFORME ECONÓMICO AL GOBERNADOR 2016 • ECONOMIC REPORT TO THE GOVERNOR 2016
17
1888
7777
1992 1993 1994 1995 1996 1997 1998 1999 2000 2001 2002 2003 2004 2005 2006 2007 2008 2009 2010 2011 2012 2013 2014 2015 2016
1992 === 6.6 4.6 4.6 5.4 5.8 5.3 5.3 5.0 4.9 4.7 4.5 4.3 4.2 3.9 3.7 3.6 3.4 3.2 3.2 3.0 3.0 2.6 2.5 2.31993 7.7 === 2.5 3.5 5.0 5.6 5.0 5.1 4.8 4.7 4.5 4.3 4.1 4.0 3.7 3.5 3.4 3.2 3.0 3.0 2.8 2.8 2.4 2.3 2.21994 6.1 4.5 === 4.6 6.3 6.7 5.6 5.6 5.2 5.0 4.7 4.5 4.3 4.2 3.8 3.6 3.5 3.3 3.1 3.0 2.8 2.8 2.4 2.3 2.1
P C 1995 5.9 5.0 5.5 === 8.1 7.7 6.0 5.8 5.3 5.1 4.7 4.5 4.2 4.1 3.7 3.5 3.4 3.2 3.0 2.9 2.7 2.7 2.3 2.2 2.0R U 1996 6.8 6.4 7.4 9.3 === 7.3 5.0 5.1 4.6 4.5 4.2 4.0 3.8 3.7 3.2 3.1 3.1 2.8 2.6 2.6 2.4 2.4 2.0 1.9 1.7E R 1997 7.3 7.2 8.1 9.4 9.4 === 2.6 3.9 3.7 3.8 3.6 3.5 3.3 3.3 2.8 2.7 2.7 2.4 2.2 2.2 2.1 2.1 1.7 1.6 1.4C R 1998 6.9 6.7 7.2 7.8 7.1 4.8 === 5.2 4.2 4.2 3.8 3.7 3.4 3.3 2.8 2.7 2.7 2.4 2.2 2.2 2.0 2.0 1.7 1.5 1.4I E 1999 6.8 6.6 7.0 7.4 6.8 5.5 6.2 === 3.3 3.7 3.3 3.3 3.0 3.0 2.5 2.4 2.4 2.1 1.9 1.9 1.8 1.8 1.4 1.3 1.2O N 2000 6.7 6.6 6.9 7.2 6.7 5.8 6.3 6.5 === 4.1 3.4 3.3 2.9 3.0 2.4 2.3 2.3 2.0 1.8 1.8 1.6 1.7 1.3 1.1 1.0S T 2001 6.8 6.7 7.0 7.2 6.8 6.2 6.6 6.9 7.2 === 2.6 2.9 2.5 2.7 2.0 2.0 2.0 1.7 1.6 1.6 1.4 1.5 1.1 0.9 0.8
2002 6.4 6.3 6.5 6.7 6.2 5.6 5.8 5.7 5.3 3.4 === 3.1 2.5 2.7 1.9 1.8 1.9 1.6 1.4 1.5 1.3 1.4 1.0 0.8 0.7C P 2003 6.3 6.2 6.3 6.4 6.0 5.5 5.6 5.5 5.1 4.1 4.9 === 1.9 2.5 1.4 1.5 1.7 1.4 1.2 1.3 1.1 1.2 0.8 0.6 0.5O R 2004 6.1 5.9 6.0 6.1 5.7 5.2 5.3 5.1 4.7 3.9 4.2 3.5 === 3.2 1.2 1.4 1.7 1.3 1.1 1.2 1.0 1.2 0.7 0.5 0.4R I 2005 6.1 6.0 6.1 6.2 5.8 5.4 5.5 5.4 5.2 4.6 5.1 5.2 6.9 === -0.7 0.5 1.1 0.8 0.7 0.9 0.7 0.9 0.4 0.2 0.2R C 2006 6.0 5.8 5.9 6.0 5.6 5.2 5.3 5.2 5.0 4.5 4.8 4.8 5.4 4.0 === 1.8 2.1 1.3 1.0 1.2 0.9 1.2 0.5 0.3 0.2I E 2007 5.8 5.6 5.7 5.7 5.4 5.0 5.0 4.9 4.7 4.2 4.4 4.3 4.6 3.5 2.9 === 2.4 1.0 0.8 1.0 0.8 1.1 0.3 0.1 0.1E S 2008 5.9 5.8 5.9 5.9 5.7 5.3 5.4 5.3 5.1 4.8 5.1 5.1 5.6 5.1 5.7 8.5 === -0.3 0.0 0.6 0.4 0.8 0.0 -0.2 -0.2N 2009 5.8 5.7 5.8 5.8 5.5 5.2 5.2 5.1 5.0 4.7 4.9 4.9 5.2 4.8 5.0 6.1 3.7 === 0.2 1.1 0.6 1.1 0.0 -0.1 -0.2T 2010 5.6 5.4 5.5 5.5 5.2 4.9 4.9 4.8 4.7 4.4 4.5 4.4 4.6 4.2 4.2 4.6 2.7 1.8 === 1.9 0.8 1.3 0.0 -0.2 -0.3E 2011 5.4 5.3 5.3 5.3 5.1 4.8 4.8 4.6 4.5 4.2 4.3 4.2 4.3 3.9 3.9 4.2 2.8 2.3 2.8 === -0.3 1.1 -0.6 -0.7 -0.7S 2012 5.2 5.1 5.1 5.1 4.9 4.6 4.6 4.4 4.3 4.0 4.1 4.0 4.0 3.6 3.6 3.7 2.6 2.2 2.4 2.0 === 2.4 -0.8 -0.9 -0.8
2013 5.2 5.0 5.1 5.0 4.8 4.5 4.5 4.4 4.2 3.9 4.0 3.9 4.0 3.6 3.6 3.7 2.7 2.5 2.7 2.6 3.3 === -3.9 -2.5 -1.92014 4.8 4.7 4.7 4.7 4.4 4.1 4.1 3.9 3.8 3.5 3.5 3.4 3.4 3.0 2.9 2.9 2.0 1.6 1.6 1.2 0.8 -1.8 === -1.1 -0.82015 4.7 4.5 4.5 4.5 4.2 3.9 3.9 3.7 3.6 3.3 3.3 3.2 3.2 2.8 2.7 2.6 1.8 1.5 1.4 1.1 0.8 -0.4 0.9 === -0.52016 4.5 4.3 4.3 4.3 4.0 3.8 3.7 3.6 3.4 3.1 3.1 3.0 2.9 2.6 2.4 2.4 1.6 1.4 1.3 1.0 0.7 -0.1 0.7 0.5 =
DISPONSABLE PERSONAL INCOME
P R E C I O S C O N S T A N T E S - C O N S T A N T P R I C E S
TASAS DE CRECIMIENTO ANUAL DEL INGRESO PERSONAL DISPONIBLE
1992 1993 1994 1995 1996 1997 1998 1999 2000 2001 2002 2003 2004 2005 2006 2007 2008 2009 2010 2011 2012 2013 2014 2015 2016
1992 === 5.9 3.7 3.7 4.5 4.8 4.3 4.4 4.2 4.2 4.0 3.9 3.7 3.7 3.4 3.3 3.3 3.1 3.0 3.0 2.9 2.9 2.6 2.6 2.51993 6.9 === 1.6 2.6 4.1 4.6 4.1 4.2 4.0 4.0 3.8 3.7 3.5 3.5 3.2 3.1 3.1 2.9 2.8 2.8 2.7 2.8 2.5 2.4 2.41994 5.2 3.6 === 3.6 5.3 5.6 4.7 4.7 4.4 4.3 4.1 3.9 3.7 3.7 3.3 3.3 3.2 3.0 2.9 2.9 2.8 2.8 2.5 2.4 2.4
P C 1995 5.0 4.1 4.6 === 7.0 6.6 5.0 4.9 4.5 4.4 4.1 4.0 3.7 3.7 3.3 3.2 3.2 3.0 2.8 2.8 2.7 2.8 2.5 2.4 2.3R U 1996 5.8 5.4 6.4 8.2 === 6.3 4.0 4.2 3.9 3.9 3.6 3.6 3.3 3.3 2.9 2.9 2.9 2.7 2.6 2.6 2.5 2.5 2.2 2.2 2.1E R 1997 6.3 6.1 7.0 8.2 8.3 === 1.9 3.3 3.1 3.3 3.1 3.1 2.9 3.0 2.6 2.6 2.6 2.4 2.3 2.3 2.2 2.3 2.0 1.9 1.9C R 1998 5.9 5.7 6.2 6.8 6.1 4.0 === 4.7 3.8 3.8 3.4 3.4 3.1 3.1 2.7 2.6 2.7 2.4 2.3 2.3 2.2 2.3 2.0 1.9 1.9I E 1999 5.9 5.7 6.1 6.5 5.9 4.8 5.6 === 2.9 3.4 3.0 3.0 2.8 2.9 2.4 2.4 2.4 2.2 2.1 2.1 2.1 2.2 1.8 1.8 1.7O N 2000 5.9 5.7 6.1 6.4 6.0 5.2 5.8 6.1 === 3.9 3.1 3.1 2.8 2.9 2.3 2.3 2.4 2.2 2.0 2.1 2.0 2.1 1.8 1.7 1.7S T 2001 6.0 5.9 6.2 6.5 6.2 5.6 6.2 6.5 7.0 === 2.4 2.7 2.4 2.6 2.0 2.1 2.2 1.9 1.8 1.9 1.8 2.0 1.6 1.5 1.5
2002 5.7 5.6 5.8 6.0 5.7 5.2 5.4 5.4 5.1 3.2 === 3.0 2.4 2.7 1.9 2.0 2.2 1.9 1.7 1.9 1.8 1.9 1.5 1.5 1.5C P 2003 5.4 5.3 5.4 5.5 5.2 4.7 4.8 4.6 4.1 2.7 2.2 === 1.8 2.6 1.5 1.7 2.0 1.7 1.6 1.7 1.6 1.8 1.4 1.3 1.3O R 2004 5.2 5.1 5.2 5.3 4.9 4.5 4.5 4.3 3.9 2.9 2.7 3.3 === 3.3 1.4 1.7 2.0 1.7 1.5 1.7 1.6 1.8 1.4 1.3 1.3R I 2005 5.4 5.2 5.4 5.5 5.2 4.8 4.9 4.8 4.5 3.9 4.2 5.2 7.2 === -0.4 0.9 1.6 1.3 1.2 1.4 1.4 1.6 1.2 1.1 1.1R C 2006 5.5 5.4 5.5 5.6 5.3 5.0 5.1 5.1 4.9 4.5 4.8 5.7 7.0 6.8 === 2.3 2.6 1.8 1.6 1.8 1.7 1.9 1.4 1.3 1.3I E 2007 5.3 5.2 5.4 5.4 5.2 4.9 5.0 4.9 4.7 4.3 4.6 5.2 5.8 5.1 3.5 === 3.0 1.6 1.3 1.7 1.5 1.9 1.2 1.1 1.2E S 2008 5.6 5.5 5.6 5.7 5.5 5.2 5.4 5.3 5.3 5.0 5.3 5.9 6.6 6.4 6.3 9.1 === 0.2 0.5 1.3 1.2 1.7 0.9 0.9 0.9N 2009 5.5 5.4 5.5 5.6 5.4 5.2 5.3 5.2 5.1 4.9 5.2 5.7 6.1 5.9 5.6 6.7 4.3 === 0.8 1.8 1.5 2.0 1.1 1.0 1.0T 2010 5.3 5.2 5.3 5.4 5.2 4.9 5.0 5.0 4.9 4.6 4.8 5.2 5.5 5.2 4.8 5.2 3.3 2.3 === 2.8 1.8 2.4 1.2 1.0 1.1E 2011 5.2 5.1 5.2 5.3 5.1 4.8 4.9 4.9 4.8 4.5 4.7 5.0 5.2 4.9 4.5 4.8 3.4 3.0 3.7 === 0.9 2.3 0.6 0.6 0.7S 2012 5.1 5.0 5.1 5.1 5.0 4.7 4.8 4.7 4.6 4.4 4.5 4.8 5.0 4.7 4.3 4.5 3.4 3.1 3.4 3.2 === 3.6 0.5 0.5 0.7
2013 5.1 5.0 5.1 5.1 4.9 4.7 4.8 4.7 4.6 4.4 4.5 4.8 4.9 4.7 4.3 4.5 3.6 3.4 3.8 3.9 4.6 === -2.6 -1.0 -0.22014 4.8 4.7 4.8 4.8 4.6 4.4 4.4 4.4 4.2 4.0 4.1 4.3 4.4 4.1 3.7 3.8 2.9 2.7 2.7 2.4 2.1 -0.4 === 0.6 0.92015 4.7 4.6 4.7 4.7 4.5 4.3 4.3 4.3 4.1 3.9 4.0 4.1 4.2 3.9 3.6 3.6 2.9 2.7 2.7 2.5 2.3 1.1 2.6 === 1.32016 4.6 4.5 4.6 4.6 4.4 4.2 4.2 4.1 4.0 3.8 3.9 4.0 4.1 3.8 3.5 3.5 2.8 2.6 2.6 2.4 2.3 1.5 2.5 2.3 =
P R E C I O S C O N S T A N T E S - C O N S T A N T P R I C E S
PER CAPITA DISPOSABLE PERSONAL INCOMETASAS DE CRECIMIENTO ANUAL DEL INGRESO PERSONAL DISPONIBLE PER CÁPITA

JUNTA DE PLANIFICACIÓN / PLANNING BOARD A-83
APÉNDICE ESTADÍSTICO • STATISTICAL APPENDIXINFORME ECONÓMICO AL GOBERNADOR 2016 • ECONOMIC REPORT TO THE GOVERNOR 2016
19
200
9999
1992 1993 1994 1995 1996 1997 1998 1999 2000 2001 2002 2003 2004 2005 2006 2007 2008 2009 2010 2011 2012 2013 2014 2015 2016
1992 ===1993 7.9 ===1994 6.0 4.0 ===
P C 1995 6.4 5.7 7.3 ===R U 1996 6.1 5.5 6.2 5.1 ===E R 1997 6.6 6.2 7.0 6.8 8.5 ===C R 1998 6.6 6.4 6.9 6.8 7.7 6.9 ===I E 1999 6.2 5.9 6.3 6.0 6.4 5.3 3.8 ===O N 2000 6.6 6.4 6.8 6.6 7.0 6.5 6.4 9.1 ===S T 2001 6.8 6.7 7.1 7.1 7.5 7.2 7.3 9.2 9.3 ===
2002 6.5 6.3 6.6 6.5 6.8 6.4 6.3 7.1 6.2 3.2 ===C P 2003 6.5 6.3 6.6 6.5 6.7 6.4 6.3 6.9 6.2 4.7 6.2 ===O R 2004 6.5 6.3 6.6 6.5 6.7 6.4 6.3 6.8 6.3 5.3 6.4 6.6 ===R I 2005 6.5 6.4 6.6 6.5 6.7 6.5 6.4 6.9 6.5 5.8 6.6 6.9 7.1 ===R C 2006 6.4 6.3 6.5 6.4 6.5 6.3 6.2 6.6 6.2 5.6 6.2 6.2 5.9 4.8 ===I E 2007 6.3 6.2 6.4 6.3 6.4 6.2 6.1 6.4 6.1 5.5 6.0 6.0 5.8 5.1 5.4 ===E S 2008 6.0 5.9 6.0 5.9 6.0 5.8 5.7 5.9 5.5 5.0 5.3 5.1 4.7 3.9 3.5 1.6 ===N 2009 5.7 5.5 5.6 5.5 5.5 5.3 5.1 5.3 4.9 4.3 4.5 4.2 3.7 2.9 2.3 0.7 -0.1 ===T 2010 5.4 5.2 5.3 5.2 5.2 4.9 4.7 4.8 4.4 3.9 4.0 3.7 3.2 2.4 1.8 0.7 0.2 0.5 ===E 2011 5.2 5.0 5.1 4.9 4.9 4.7 4.5 4.6 4.2 3.7 3.7 3.4 3.0 2.3 1.8 0.9 0.7 1.0 1.6 ===S 2012 5.2 5.1 5.1 5.0 5.0 4.8 4.6 4.7 4.3 3.9 4.0 3.7 3.4 2.8 2.5 1.9 2.0 2.7 3.9 6.2 ===
2013 5.1 4.9 5.0 4.8 4.8 4.6 4.5 4.5 4.2 3.7 3.8 3.6 3.2 2.7 2.5 2.0 2.1 2.6 3.3 4.2 2.2 ===2014 4.8 4.7 4.7 4.6 4.6 4.3 4.2 4.2 3.9 3.4 3.5 3.2 2.9 2.4 2.1 1.7 1.7 2.1 2.5 2.8 1.1 0.0 ===2015 4.6 4.5 4.5 4.4 4.3 4.1 3.9 4.0 3.6 3.2 3.2 3.0 2.7 2.2 2.0 1.5 1.5 1.8 2.1 2.2 0.9 0.3 0.5 ===2016 4.4 4.3 4.3 4.1 4.1 3.9 3.7 3.7 3.4 3.0 3.0 2.7 2.4 2.0 1.7 1.3 1.3 1.5 1.7 1.7 0.6 0.0 0.1 -0.4 =
TASAS DE CRECIMIENTO ANUAL DEL INGRESO NETONET INCOME
1992 1993 1994 1995 1996 1997 1998 1999 2000 2001 2002 2003 2004 2005 2006 2007 2008 2009 2010 2011 2012 2013 2014 2015 2016
1992 ===1993 7.1 ===1994 5.1 3.1 ===
P C 1995 5.5 4.7 6.3 ===R U 1996 5.1 4.5 5.2 4.0 ===E R 1997 5.6 5.2 5.9 5.7 7.4 ===C R 1998 5.7 5.4 5.9 5.8 6.7 6.1 ===I E 1999 5.3 5.0 5.4 5.2 5.5 4.6 3.2 ===O N 2000 5.7 5.5 5.9 5.8 6.3 5.9 5.9 8.6 ===S T 2001 6.1 5.9 6.4 6.4 6.8 6.7 6.9 8.8 9.0 ===
2002 5.8 5.6 5.9 5.9 6.2 6.0 5.9 6.9 6.0 3.0 ===C P 2003 5.8 5.7 6.0 5.9 6.2 6.0 6.0 6.7 6.0 4.5 6.1 ===O R 2004 5.9 5.7 6.0 6.0 6.2 6.1 6.1 6.6 6.1 5.2 6.3 6.6 ===R I 2005 6.0 5.9 6.1 6.1 6.3 6.2 6.2 6.7 6.4 5.7 6.6 6.9 7.2 ===R C 2006 5.9 5.8 6.0 6.0 6.2 6.1 6.1 6.5 6.1 5.6 6.2 6.3 6.1 5.1 ===I E 2007 5.9 5.8 6.0 6.0 6.2 6.1 6.1 6.4 6.1 5.6 6.2 6.2 6.1 5.5 5.9 ===E S 2008 5.7 5.6 5.7 5.7 5.8 5.7 5.7 5.9 5.6 5.1 5.5 5.4 5.1 4.4 4.0 2.2 ===N 2009 5.4 5.2 5.4 5.3 5.4 5.3 5.2 5.4 5.0 4.5 4.8 4.5 4.1 3.4 2.8 1.3 0.5 ===T 2010 5.1 5.0 5.1 5.0 5.1 4.9 4.8 5.0 4.6 4.1 4.3 4.0 3.6 2.9 2.4 1.2 0.8 1.1 ===E 2011 5.0 4.8 4.9 4.9 4.9 4.7 4.6 4.8 4.4 4.0 4.1 3.8 3.4 2.8 2.4 1.5 1.3 1.7 2.4 ===S 2012 5.1 5.0 5.1 5.0 5.1 4.9 4.8 5.0 4.7 4.3 4.4 4.2 3.9 3.5 3.2 2.7 2.8 3.6 4.9 7.5 ===
2013 5.0 4.9 5.0 4.9 5.0 4.8 4.7 4.9 4.6 4.2 4.3 4.1 3.9 3.5 3.2 2.8 2.9 3.6 4.4 5.4 3.4 ===2014 4.8 4.7 4.8 4.7 4.8 4.6 4.5 4.6 4.3 4.0 4.1 3.9 3.6 3.2 3.0 2.6 2.7 3.1 3.6 4.0 2.4 1.4 ===2015 4.7 4.6 4.7 4.6 4.6 4.5 4.4 4.5 4.2 3.9 3.9 3.8 3.5 3.1 2.9 2.6 2.6 3.0 3.4 3.6 2.3 1.8 2.2 ===2016 4.6 4.5 4.5 4.5 4.5 4.3 4.2 4.3 4.0 3.7 3.7 3.6 3.3 3.0 2.8 2.4 2.5 2.7 3.0 3.2 2.1 1.7 1.8 1.4 =
PER CAPITA NET INCOMETASAS DE CRECIMIENTO ANUAL DEL INGRESO NETO PER CÁPITA

A-84 JUNTA DE PLANIFICACIÓN / PLANNING BOARD
APÉNDICE ESTADÍSTICO • STATISTICAL APPENDIXINFORME ECONÓMICO AL GOBERNADOR 2016 • ECONOMIC REPORT TO THE GOVERNOR 2016
21
22
1992 1993 1994 1995 1996 1997 1998 1999 2000 2001 2002 2003 2004 2005 2006 2007 2008 2009 2010 2011 2012 2013 2014 2015 2016
1992 ===1993 2.7 ===1994 3.0 3.4 ===1995 3.1 3.3 3.2 ===1996 3.2 3.3 3.3 3.3 ===1997 3.1 3.2 3.2 3.2 3.0 ===1998 3.5 3.6 3.7 3.8 4.1 5.1 ===1999 3.6 3.8 3.9 4.1 4.3 5.0 4.8 ===2000 3.6 3.7 3.8 3.9 4.0 4.4 4.0 3.2 ===2001 3.7 3.8 3.9 4.0 4.2 4.4 4.2 3.9 4.7 ===2002 3.6 3.7 3.7 3.8 3.9 4.0 3.7 3.4 3.5 2.3 ===2003 3.5 3.6 3.7 3.7 3.8 3.9 3.6 3.4 3.4 2.8 3.3 ===2004 3.6 3.7 3.7 3.8 3.8 3.9 3.7 3.5 3.6 3.2 3.7 4.1 ===2005 3.6 3.7 3.7 3.8 3.8 3.9 3.7 3.6 3.6 3.4 3.8 4.0 3.9 ===2006 3.7 3.8 3.8 3.9 3.9 4.0 3.9 3.8 3.9 3.7 4.0 4.3 4.4 4.9 ===2007 3.9 4.0 4.0 4.1 4.1 4.2 4.1 4.1 4.2 4.1 4.5 4.7 5.0 5.5 6.1 ===2008 4.0 4.1 4.2 4.2 4.3 4.4 4.4 4.3 4.5 4.4 4.8 5.1 5.4 5.9 6.3 6.5 ===2009 4.1 4.2 4.3 4.3 4.4 4.5 4.5 4.4 4.6 4.6 4.9 5.2 5.4 5.7 6.0 6.0 5.4 ===2010 4.1 4.2 4.3 4.4 4.4 4.5 4.5 4.5 4.6 4.6 4.9 5.1 5.3 5.6 5.7 5.6 5.1 4.8 ===2011 4.1 4.2 4.3 4.3 4.4 4.5 4.5 4.4 4.5 4.5 4.8 5.0 5.1 5.3 5.4 5.2 4.7 4.4 4.0 ===2012 4.1 4.2 4.2 4.3 4.3 4.4 4.4 4.3 4.4 4.4 4.6 4.7 4.8 5.0 5.0 4.7 4.3 3.9 3.5 3.0 ===2013 4.0 4.0 4.1 4.1 4.1 4.2 4.2 4.1 4.2 4.1 4.3 4.4 4.4 4.5 4.5 4.2 3.7 3.3 2.8 2.2 1.4 ===2014 3.8 3.9 3.9 4.0 4.0 4.1 4.0 3.9 4.0 3.9 4.1 4.1 4.2 4.2 4.1 3.8 3.4 3.0 2.5 2.0 1.5 1.6 ===2015 3.8 3.8 3.8 3.9 3.9 3.9 3.9 3.8 3.8 3.8 3.9 3.9 3.9 3.9 3.8 3.6 3.1 2.8 2.4 2.0 1.6 1.7 1.8 ===2016 3.7 3.7 3.7 3.8 3.8 3.8 3.8 3.7 3.7 3.7 3.8 3.8 3.8 3.8 3.6 3.4 3.0 2.6 2.3 1.9 1.7 1.8 1.9 1.9 =
IMPLICIT PRICE DEFLATORS FOR GROSS PRODUCTTASAS DE CRECIMIENTO ANUAL DEL ÍNDICE ÍMPLICITO DE PRECIOS PARA DEFLACIONAR EL PRODUCTO BRUTO
1992 1993 1994 1995 1996 1997 1998 1999 2000 2001 2002 2003 2004 2005 2006 2007 2008 2009 2010 2011 2012 2013 2014 2015 2016
1992 ===1993 1.0 ===1994 1.5 1.9 ===1995 1.3 1.4 0.9 ===1996 1.2 1.3 1.0 1.1 ===1997 1.4 1.5 1.3 1.5 1.9 ===1998 1.5 1.6 1.5 1.7 2.0 2.1 ===1999 1.4 1.5 1.4 1.5 1.6 1.5 0.9 ===2000 1.6 1.7 1.7 1.9 2.0 2.1 2.1 3.3 ===2001 1.8 1.9 1.9 2.0 2.2 2.3 2.4 3.1 3.0 ===2002 1.6 1.6 1.6 1.7 1.8 1.7 1.7 1.9 1.3 -0.4 ===2003 1.5 1.6 1.5 1.6 1.7 1.6 1.6 1.7 1.2 0.3 1.1 ===2004 1.5 1.5 1.5 1.6 1.6 1.6 1.5 1.6 1.2 0.6 1.1 1.2 ===2005 1.6 1.7 1.7 1.8 1.8 1.8 1.8 1.9 1.7 1.3 1.9 2.4 3.5 ===2006 1.9 2.0 2.0 2.1 2.2 2.2 2.2 2.4 2.3 2.2 2.8 3.4 4.5 5.5 ===2007 2.0 2.0 2.0 2.1 2.2 2.2 2.3 2.4 2.3 2.2 2.7 3.2 3.8 4.0 2.5 ===2008 2.2 2.3 2.3 2.4 2.5 2.6 2.6 2.8 2.8 2.7 3.3 3.7 4.4 4.6 4.2 6.0 ===2009 2.3 2.4 2.4 2.5 2.6 2.7 2.8 2.9 2.9 2.9 3.4 3.8 4.3 4.5 4.2 5.0 4.0 ===2010 2.3 2.3 2.4 2.5 2.6 2.6 2.7 2.8 2.8 2.7 3.2 3.4 3.8 3.9 3.5 3.8 2.8 1.5 ===2011 2.2 2.3 2.3 2.4 2.4 2.5 2.5 2.7 2.6 2.6 2.9 3.1 3.4 3.4 3.0 3.1 2.1 1.2 0.9 ===2012 2.2 2.3 2.3 2.4 2.4 2.5 2.5 2.6 2.6 2.5 2.8 3.0 3.3 3.2 2.8 2.9 2.2 1.6 1.6 2.2 ===2013 2.1 2.2 2.2 2.3 2.3 2.4 2.4 2.5 2.4 2.4 2.7 2.8 3.0 2.9 2.6 2.6 1.9 1.4 1.3 1.6 0.9 ===2014 2.1 2.2 2.2 2.3 2.3 2.4 2.4 2.5 2.4 2.4 2.6 2.8 2.9 2.8 2.5 2.5 2.0 1.6 1.6 1.8 1.6 2.3 ===2015 2.1 2.2 2.2 2.3 2.3 2.3 2.4 2.5 2.4 2.4 2.6 2.7 2.8 2.8 2.5 2.5 2.0 1.6 1.7 1.9 1.7 2.1 2.0 ===2016 2.1 2.1 2.1 2.2 2.3 2.3 2.3 2.4 2.3 2.3 2.5 2.6 2.7 2.6 2.3 2.3 1.9 1.5 1.5 1.7 1.5 1.8 1.5 1.0 =
IMPLICIT PRICE DEFLACTORS FOR PERSONAL CONSUMPTION EXPENDITURESTASAS DE CRECIMIENTO ANUAL DEL ÍNDICE ÍMPLICITO DE PRECIOS PARA DEFLACIONAR LOS GASTOS DE CONSUMO PERSONAL

JUNTA DE PLANIFICACIÓN / PLANNING BOARD A-85
APÉNDICE ESTADÍSTICO • STATISTICAL APPENDIXINFORME ECONÓMICO AL GOBERNADOR 2016 • ECONOMIC REPORT TO THE GOVERNOR 2016
23
24
1992 1993 1994 1995 1996 1997 1998 1999 2000 2001 2002 2003 2004 2005 2006 2007 2008 2009 2010 2011 2012 2013 2014 2015 2016
1992 ===1993 2.3 ===1994 1.7 1.2 ===1995 2.5 2.6 4.0 ===1996 2.8 3.0 3.9 3.9 ===1997 2.9 3.1 3.7 3.6 3.3 ===1998 2.6 2.6 3.0 2.7 2.0 0.8 ===1999 2.3 2.3 2.5 2.1 1.5 0.7 0.5 ===2000 2.1 2.0 2.2 1.8 1.3 0.6 0.6 0.6 ===2001 1.8 1.7 1.8 1.4 0.9 0.4 0.2 0.0 -0.5 ===2002 1.7 1.6 1.6 1.3 0.9 0.4 0.3 0.3 0.1 0.7 ===2003 1.8 1.7 1.8 1.5 1.2 0.9 0.9 1.0 1.1 1.9 3.1 ===2004 1.8 1.7 1.8 1.5 1.2 1.0 1.0 1.1 1.2 1.8 2.3 1.5 ===2005 1.8 1.8 1.9 1.7 1.4 1.2 1.2 1.3 1.5 2.0 2.4 2.1 2.7 ===2006 1.8 1.8 1.8 1.6 1.4 1.2 1.2 1.3 1.5 1.9 2.1 1.8 2.0 1.3 ===2007 1.7 1.7 1.7 1.5 1.3 1.1 1.2 1.3 1.3 1.7 1.9 1.5 1.6 1.0 0.7 ===2008 1.3 1.2 1.2 1.0 0.8 0.6 0.6 0.6 0.6 0.7 0.7 0.3 -0.1 -1.0 -2.1 -4.8 ===2009 0.9 0.9 0.8 0.6 0.4 0.1 0.1 0.0 -0.1 0.0 -0.1 -0.6 -1.1 -2.0 -3.0 -4.8 -4.9 ===2010 0.5 0.4 0.4 0.2 -0.1 -0.4 -0.5 -0.6 -0.7 -0.7 -0.9 -1.4 -1.9 -2.8 -3.8 -5.2 -5.5 -6.0 ===2011 0.3 0.2 0.2 0.0 -0.3 -0.6 -0.7 -0.8 -0.9 -0.9 -1.1 -1.6 -2.1 -2.8 -3.6 -4.7 -4.6 -4.5 -3.0 ===2012 0.2 0.1 0.1 -0.1 -0.4 -0.6 -0.7 -0.8 -1.0 -1.0 -1.2 -1.6 -2.0 -2.7 -3.3 -4.1 -3.9 -3.6 -2.4 -1.7 ===2013 0.2 0.1 0.0 -0.2 -0.4 -0.7 -0.8 -0.8 -1.0 -1.0 -1.1 -1.6 -1.9 -2.5 -3.0 -3.6 -3.3 -2.9 -1.9 -1.4 -1.0 ===2014 0.1 0.0 -0.1 -0.3 -0.5 -0.7 -0.8 -0.9 -1.0 -1.1 -1.2 -1.6 -1.9 -2.4 -2.9 -3.4 -3.1 -2.8 -2.0 -1.6 -1.6 -2.2 ===2015 0.0 -0.1 -0.1 -0.3 -0.5 -0.8 -0.8 -0.9 -1.0 -1.1 -1.2 -1.6 -1.8 -2.3 -2.7 -3.1 -2.8 -2.5 -1.8 -1.4 -1.4 -1.5 -0.9 ===2016 0.1 0.0 0.0 -0.2 -0.4 -0.6 -0.7 -0.8 -0.9 -0.9 -1.0 -1.3 -1.5 -1.9 -2.2 -2.5 -2.3 -1.9 -1.2 -0.8 -0.6 -0.4 0.5 1.8 ===
EMPLOYMENTTASAS DE CRECIMIENTO ANUAL DEL EMPLEO
1992 1993 1994 1995 1996 1997 1998 1999 2000 2001 2002 2003 2004 2005 2006 2007 2008 2009 2010 2011 2012 2013 2014 2015 2016
1992 ===1993 4.7 ===1994 -0.3 -5.0 ===
P C 1995 -4.5 -8.8 -12.5 ===R U 1996 -2.4 -4.7 -4.5 4.2 ===E R 1997 -2.5 -4.2 -4.0 0.6 -2.9 ===C R 1998 -1.2 -2.4 -1.7 2.1 1.1 5.3 ===I E 1999 -2.4 -3.5 -3.2 -0.8 -2.3 -2.1 -8.9 ===O N 2000 -3.8 -4.9 -4.9 -3.3 -5.1 -5.8 -10.9 -12.9 ===S T 2001 -4.1 -5.1 -5.1 -3.8 -5.3 -6.0 -9.4 -9.7 -6.3 ===
2002 -2.1 -2.8 -2.6 -1.1 -1.9 -1.7 -3.4 -1.5 4.8 17.3 ===C P 2003 -1.6 -2.2 -1.9 -0.5 -1.1 -0.8 -2.0 -0.2 4.5 10.4 3.8 ===O R 2004 -2.0 -2.6 -2.3 -1.1 -1.7 -1.6 -2.7 -1.4 1.7 4.6 -1.3 -6.2 ===R I 2005 -2.2 -2.8 -2.6 -1.5 -2.1 -2.1 -3.1 -2.0 0.3 2.0 -2.6 -5.7 -5.3 ===R C 2006 -1.5 -2.0 -1.7 -0.7 -1.1 -1.0 -1.7 -0.6 1.6 3.2 0.0 -1.3 1.3 8.3 ===I E 2007 -1.7 -2.1 -1.9 -0.9 -1.4 -1.2 -1.9 -1.0 0.8 2.0 -0.8 -1.9 -0.4 2.1 -3.8 ===E S 2008 -1.5 -1.9 -1.7 -0.8 -1.2 -1.0 -1.6 -0.8 0.9 1.9 -0.4 -1.3 0.0 1.8 -1.3 1.3 ===N 2009 -0.4 -0.7 -0.4 0.5 0.3 0.5 0.1 1.1 2.7 3.9 2.1 1.9 3.6 5.9 5.1 9.8 19.1 ===T 2010 0.5 0.2 0.6 1.5 1.3 1.6 1.3 2.3 4.0 5.2 3.8 3.8 5.5 7.8 7.7 11.9 17.5 16.0 ===E 2011 0.2 0.0 0.3 1.1 0.9 1.2 0.9 1.8 3.2 4.2 2.9 2.7 4.1 5.7 5.2 7.6 9.8 5.4 -4.3 ===S 2012 -0.3 -0.5 -0.3 0.5 0.3 0.5 0.2 0.9 2.1 2.9 1.6 1.4 2.3 3.5 2.7 4.1 4.7 0.4 -6.6 -9.0 ===
2013 -0.7 -1.0 -0.8 -0.1 -0.3 -0.2 -0.5 0.1 1.2 1.8 0.5 0.2 0.9 1.7 0.8 1.6 1.7 -2.3 -7.7 -9.4 -9.8 ===2014 -0.7 -0.9 -0.7 -0.1 -0.3 -0.1 -0.5 0.1 1.1 1.7 0.5 0.2 0.9 1.6 0.8 1.5 1.5 -1.7 -5.7 -6.2 -4.8 0.6 ===2015 -1.2 -1.4 -1.3 -0.7 -0.9 -0.8 -1.2 -0.6 0.2 0.7 -0.5 -0.8 -0.3 0.2 -0.7 -0.3 -0.5 -3.4 -6.9 -7.5 -7.0 -5.6 -11.4 ===2016 -1.5 -1.8 -1.7 -1.1 -1.4 -1.3 -1.6 -1.2 -0.4 0.0 -1.1 -1.5 -1.1 -0.7 -1.6 -1.3 -1.7 -4.3 -7.3 -7.9 -7.7 -6.9 -10.5 -9.5 =
UNEMPLOYMENTTASAS DE CRECIMIENTO ANUAL DEL DESEMPLEO
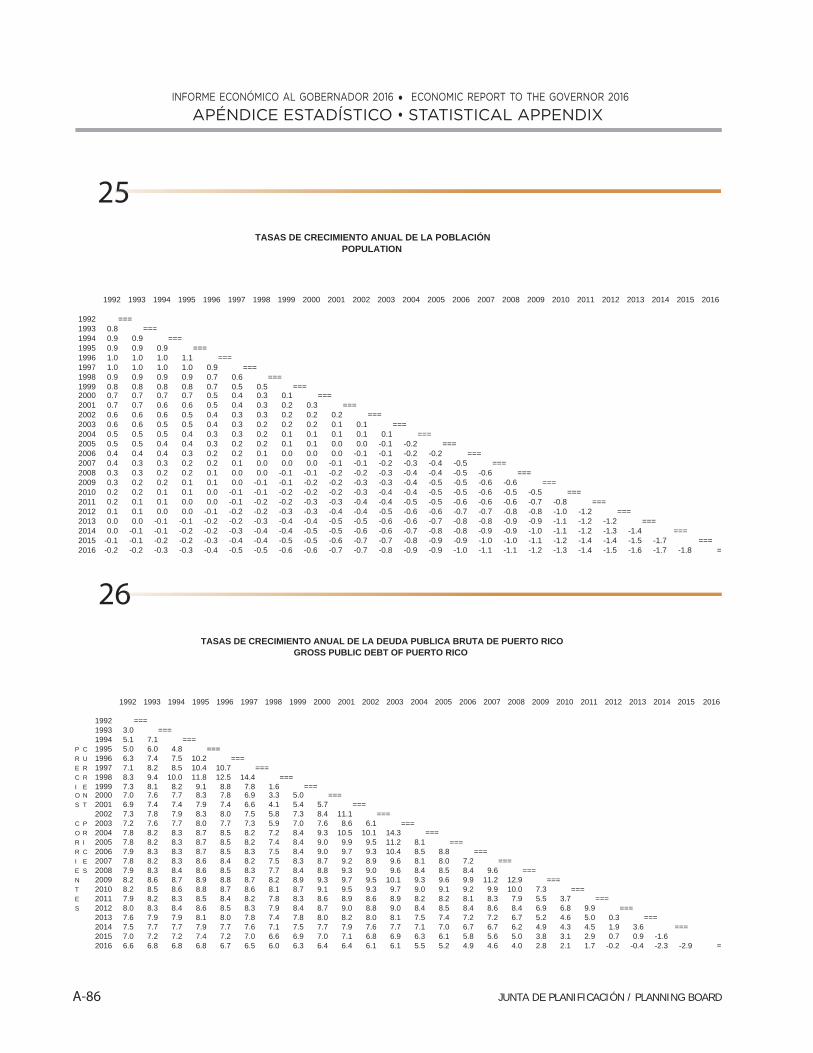
A-86 JUNTA DE PLANIFICACIÓN / PLANNING BOARD
APÉNDICE ESTADÍSTICO • STATISTICAL APPENDIXINFORME ECONÓMICO AL GOBERNADOR 2016 • ECONOMIC REPORT TO THE GOVERNOR 2016
26
25
6
5555
1992 1993 1994 1995 1996 1997 1998 1999 2000 2001 2002 2003 2004 2005 2006 2007 2008 2009 2010 2011 2012 2013 2014 2015 2016
1992 ===1993 0.8 ===1994 0.9 0.9 ===1995 0.9 0.9 0.9 ===1996 1.0 1.0 1.0 1.1 ===1997 1.0 1.0 1.0 1.0 0.9 ===1998 0.9 0.9 0.9 0.9 0.7 0.6 ===1999 0.8 0.8 0.8 0.8 0.7 0.5 0.5 ===2000 0.7 0.7 0.7 0.7 0.5 0.4 0.3 0.1 ===2001 0.7 0.7 0.6 0.6 0.5 0.4 0.3 0.2 0.3 ===2002 0.6 0.6 0.6 0.5 0.4 0.3 0.3 0.2 0.2 0.2 ===2003 0.6 0.6 0.5 0.5 0.4 0.3 0.2 0.2 0.2 0.1 0.1 ===2004 0.5 0.5 0.5 0.4 0.3 0.3 0.2 0.1 0.1 0.1 0.1 0.1 ===2005 0.5 0.5 0.4 0.4 0.3 0.2 0.2 0.1 0.1 0.0 0.0 -0.1 -0.2 ===2006 0.4 0.4 0.4 0.3 0.2 0.2 0.1 0.0 0.0 0.0 -0.1 -0.1 -0.2 -0.2 ===2007 0.4 0.3 0.3 0.2 0.2 0.1 0.0 0.0 0.0 -0.1 -0.1 -0.2 -0.3 -0.4 -0.5 ===2008 0.3 0.3 0.2 0.2 0.1 0.0 0.0 -0.1 -0.1 -0.2 -0.2 -0.3 -0.4 -0.4 -0.5 -0.6 ===2009 0.3 0.2 0.2 0.1 0.1 0.0 -0.1 -0.1 -0.2 -0.2 -0.3 -0.3 -0.4 -0.5 -0.5 -0.6 -0.6 ===2010 0.2 0.2 0.1 0.1 0.0 -0.1 -0.1 -0.2 -0.2 -0.2 -0.3 -0.4 -0.4 -0.5 -0.5 -0.6 -0.5 -0.5 ===2011 0.2 0.1 0.1 0.0 0.0 -0.1 -0.2 -0.2 -0.3 -0.3 -0.4 -0.4 -0.5 -0.5 -0.6 -0.6 -0.6 -0.7 -0.8 ===2012 0.1 0.1 0.0 0.0 -0.1 -0.2 -0.2 -0.3 -0.3 -0.4 -0.4 -0.5 -0.6 -0.6 -0.7 -0.7 -0.8 -0.8 -1.0 -1.2 ===2013 0.0 0.0 -0.1 -0.1 -0.2 -0.2 -0.3 -0.4 -0.4 -0.5 -0.5 -0.6 -0.6 -0.7 -0.8 -0.8 -0.9 -0.9 -1.1 -1.2 -1.2 ===2014 0.0 -0.1 -0.1 -0.2 -0.2 -0.3 -0.4 -0.4 -0.5 -0.5 -0.6 -0.6 -0.7 -0.8 -0.8 -0.9 -0.9 -1.0 -1.1 -1.2 -1.3 -1.4 ===2015 -0.1 -0.1 -0.2 -0.2 -0.3 -0.4 -0.4 -0.5 -0.5 -0.6 -0.7 -0.7 -0.8 -0.9 -0.9 -1.0 -1.0 -1.1 -1.2 -1.4 -1.4 -1.5 -1.7 ===2016 -0.2 -0.2 -0.3 -0.3 -0.4 -0.5 -0.5 -0.6 -0.6 -0.7 -0.7 -0.8 -0.9 -0.9 -1.0 -1.1 -1.1 -1.2 -1.3 -1.4 -1.5 -1.6 -1.7 -1.8 =
POPULATIONTASAS DE CRECIMIENTO ANUAL DE LA POBLACIÓN
1992 1993 1994 1995 1996 1997 1998 1999 2000 2001 2002 2003 2004 2005 2006 2007 2008 2009 2010 2011 2012 2013 2014 2015 2016
1992 ===1993 3.0 ===1994 5.1 7.1 ===
P C 1995 5.0 6.0 4.8 ===R U 1996 6.3 7.4 7.5 10.2 ===E R 1997 7.1 8.2 8.5 10.4 10.7 ===C R 1998 8.3 9.4 10.0 11.8 12.5 14.4 ===I E 1999 7.3 8.1 8.2 9.1 8.8 7.8 1.6 ===O N 2000 7.0 7.6 7.7 8.3 7.8 6.9 3.3 5.0 ===S T 2001 6.9 7.4 7.4 7.9 7.4 6.6 4.1 5.4 5.7 ===
2002 7.3 7.8 7.9 8.3 8.0 7.5 5.8 7.3 8.4 11.1 ===C P 2003 7.2 7.6 7.7 8.0 7.7 7.3 5.9 7.0 7.6 8.6 6.1 ===O R 2004 7.8 8.2 8.3 8.7 8.5 8.2 7.2 8.4 9.3 10.5 10.1 14.3 ===R I 2005 7.8 8.2 8.3 8.7 8.5 8.2 7.4 8.4 9.0 9.9 9.5 11.2 8.1 ===R C 2006 7.9 8.3 8.3 8.7 8.5 8.3 7.5 8.4 9.0 9.7 9.3 10.4 8.5 8.8 ===I E 2007 7.8 8.2 8.3 8.6 8.4 8.2 7.5 8.3 8.7 9.2 8.9 9.6 8.1 8.0 7.2 ===E S 2008 7.9 8.3 8.4 8.6 8.5 8.3 7.7 8.4 8.8 9.3 9.0 9.6 8.4 8.5 8.4 9.6 ===N 2009 8.2 8.6 8.7 8.9 8.8 8.7 8.2 8.9 9.3 9.7 9.5 10.1 9.3 9.6 9.9 11.2 12.9 ===T 2010 8.2 8.5 8.6 8.8 8.7 8.6 8.1 8.7 9.1 9.5 9.3 9.7 9.0 9.1 9.2 9.9 10.0 7.3 ===E 2011 7.9 8.2 8.3 8.5 8.4 8.2 7.8 8.3 8.6 8.9 8.6 8.9 8.2 8.2 8.1 8.3 7.9 5.5 3.7 ===S 2012 8.0 8.3 8.4 8.6 8.5 8.3 7.9 8.4 8.7 9.0 8.8 9.0 8.4 8.5 8.4 8.6 8.4 6.9 6.8 9.9 ===
2013 7.6 7.9 7.9 8.1 8.0 7.8 7.4 7.8 8.0 8.2 8.0 8.1 7.5 7.4 7.2 7.2 6.7 5.2 4.6 5.0 0.3 ===2014 7.5 7.7 7.7 7.9 7.7 7.6 7.1 7.5 7.7 7.9 7.6 7.7 7.1 7.0 6.7 6.7 6.2 4.9 4.3 4.5 1.9 3.6 ===2015 7.0 7.2 7.2 7.4 7.2 7.0 6.6 6.9 7.0 7.1 6.8 6.9 6.3 6.1 5.8 5.6 5.0 3.8 3.1 2.9 0.7 0.9 -1.62016 6.6 6.8 6.8 6.8 6.7 6.5 6.0 6.3 6.4 6.4 6.1 6.1 5.5 5.2 4.9 4.6 4.0 2.8 2.1 1.7 -0.2 -0.4 -2.3 -2.9 ==
GROSS PUBLIC DEBT OF PUERTO RICOTASAS DE CRECIMIENTO ANUAL DE LA DEUDA PUBLICA BRUTA DE PUERTO RICO