
Practical Malware Analysis: Ch 0: Malware Analysis Primer & 1: Basic Static Techniques

Primer
Techniques to Fingerprint Construction
Materials
Techniques to Fingerprint Construction Materials User Guide
(R06B)
April 9 2019

iii
Contents
Section Page
Executive Summary ............................................................................................................... 1
1.0 Background ................................................................................................................ 1
1.1 What is Spectroscopy .............................................................................................. 1
1.2 User Guidelines ....................................................................................................... 1
1.3 Target Users and Applications ................................................................................ 2
2.0 X-Ray Fluorescence .................................................................................................... 3
2.1 Principle of XRF ....................................................................................................... 3
2.2 Applications............................................................................................................. 4
2.3 Equipment ............................................................................................................... 7
2.4 Test Procedure ........................................................................................................ 8
2.5 Limitations............................................................................................................... 9
3.0 Fourier-Transform Infrared Spectroscopy ................................................................. 13
3.1 Principle of FTIR .................................................................................................... 13
3.2 Applications........................................................................................................... 15
3.3 Equipment ............................................................................................................. 17
3.4 Test Procedure ...................................................................................................... 20
3.5 Limitations............................................................................................................. 24
References .......................................................................................................................... 24

CONTENTS, Continued
iv
Tables
1 Overview of Potential Applications for XRF and FTIR Spectroscopic Techniques 2 Example of Exported XRF Results 3 Example of XRF Results for samples shown on Figure 6 4 Properties of the most common ATR internal reflection elements
Figures
1 Principle of Spectroscopy 2 Example of FTIR Spectra of Hot Mix Asphalt (HMA), Pure Polymer and HMA-Polymer Mixture
(left) and X-Ray Diffraction (XRD) Patterns of Pure Clay, Pure Lime and Clay-Lime Mixture (right) 3 Example of portable XRF devices, presented during a SHRP2 R06B showcase at the University of
Connecticut (November 2, 2016) 4 Pressed powder pellet (left and placing of the pellet in the XRF test stand for laboratory analysis
(photos courtesy of Maine DOT) 5 Example of XRF test stand, with a protective shield to isolate X-rays. Samples are placed within
the shield in contact with the XRF window 6 Freshly painted concrete blocks in the laboratory (left) and freshly painted bridge on I-95
overpass in Maine (right) 7 Representation of the X-ray path as it is emitted from the XRF equipment, interacts and with the
matrix and then re-emitted from different elements towards the detector. 8 Principle of molecular vibration upon IR irradiation of a CO2 molecule and corresponding
spectrum. 9 Example of material-specific calibration curve for SiO2 created by the Tennessee Department of
Transportation 10 Typical IR Absorption Ranges for Common Organic Functional Groups (reproduced after Wade
[7]) 11 Handheld (top) and benchtop (bottom) ATR equipment presented at the R06B showcase at
UCONN (November 2, 2016). 12 Field Use of a benchtop ATR FTIR Spectrometer 13 Example of ATR spectrum of HMA spectrum, pure SBS polymer (structure shown) and mixture of
HMA with 6% SBS. The right image shows a limited part of the spectrum for clarity 14 Example of FTIR spectrum of asphalt binder, tested as certified sample (green) and during
project application (red) (courtesy of Jerry McMahan, Vermont Agency of Transportation)

v
Definitions
µm micrometers
AASHTO American Association of State Highway and Transportation Officials
Al aluminum
As arsenic
ASTM American Society for Testing and Materials
ATR attenuated total reflectance
C=C double carbon bond
C-N carbon-nitrogen bond
C=O carbonyl
Ca calcium
Ca(OH)2 calcium hydroxide
CaCO3 calcium carbonate
CaO lime
Cl- chloride
cm-1 inverse centimeter
-COOH carboxyl
CSV comma separated value
Cu copper
DOT Department of Transportation
DRIFT diffuse reflectance
EDXRF energy dispersive X-ray Fluorescence
FHWA Federal Highway Administration
FTIR Fourier transform infrared
Ge germanium
HMA hot-mix asphalt
IR infrared

DEFINITIONS, Continued
vi
IRE internal reflection element
LOD limit of detection
Mg magnesium
mg/kg milligrams per kilograms
mm millimeter
MS mass spectrometer
Na+ sodium ion
-NH2 amine
NH4+ ammonium ion
Ni nickel
NIST National Institute of Science and Technology
NMR nuclear magnetic resonance
-O oxygen
-OH hydroxyl
OSHA Occupational Safety and Health Administration
Pb lead
PCC Portland concrete cement
PDA personal digital assistant
PMI Positive material identification
PO43- phosphate ion
ppm parts per million
QA Quality assurance
R06B Techniques to Fingerprint Construction Materials
RAP recycled asphalt pavement
S=O sulfoxide
SO42- sulfate ion
SBS styrene-butadiene-styrene
SHRP2 second Strategic Highway Research Program
DEFINITIONS, Continued
vii
Si silicon
SiO2 silica
TDOT Tennessee Department of Transportation
Ti titanium
U uranium
UV-VIS ultraviolet - visible
WDXRF wavelength dispersive X-ray fluorescence
XRD X-ray diffraction
XRF X-ray fluorescence
Zn zinc
ZnSe zinc selenide
ES-1
Executive Summary
Techniques to Fingerprint Construction Materials (R06B) was developed through the second
Strategic Highway Research Program (SHRP2), which is a collaboration between the Federal
Highway Administration (FHWA) and the American Association of State Highway and
Transportation Officials (AASHTO). Techniques to Fingerprint Construction Materials evaluated
portable spectroscopy technologies that can be used during construction to verify the chemical
compounds or presence of certain additives or contaminants in some commonly used
construction materials. This report provides guidelines for applying selected portable
spectroscopy techniques to a wide range of materials commonly used in transportation
infrastructure. Spectroscopy includes several methods, and only a subset of the most common
ones were screened during the research phase of Techniques to Fingerprint Construction
Materials. The most promising, field-ready technologies that apply to a large number of materials
emerged to be X-ray fluorescence (XRF) and attenuated total reflectance Fourier transform
infrared (ATR FTIR) spectroscopy.
XRF spectroscopy measures the elemental composition of materials, specifically metals,
reporting the concentrations in milligrams per kilogram (mg/kg) of material. This method mostly
applies to solid materials, but it can be used to measure metal concentrations in liquids and
suspensions as well. Most hand-held XRF spectrometers can detect elements with atomic
number Z between Z = 12 (magnesium [Mg]) and Z = 92 (uranium [U]); however, instruments that
can also detect sodium [Na] with Z = 11 are also available at a higher price. Portable XRF analysis
can be applied in trace-element mode and has detection limits between 2 and 100 mg/kg for
most metals, depending on the element and the matrix, or in alloy mode to determine ore-grade
concentrations (greater than 1 percent by weight). Different vendors provide different
calibration sets to cover a wide range of materials and concentrations. XRF instruments are easy
to operate. The analysis can be conducted in bulk samples placed in a sample cup or directly on
a surface, and the duration of the test is under 3 minutes. Potential applications of XRF for
construction materials include analyzing steel grade, aggregate quality, traffic paints and epoxies;
identifying lead (Pb) and arsenic (As) in glass beads; identifying hazardous heavy metals in soils,
aggregates, and construction debris; and identifying waste materials such as recycled engine oil
bottoms in asphalt, among others. A draft AASHTO method has been developed for traffic paints,
along with an ASTM International (formerly American Society for Testing and Materials [ASTM])
method (ASTM D4764 - 01(2012)).
ATR FTIR spectroscopy detects the vibrations of polar, asymmetric functional groups (-OH, C=O,
C-C, C-N, -NH2, -SO4, and others), which appear as peaks in a recorded spectrum at characteristic
wavelengths in the infrared (IR) region. Comparing an unknown spectrum with spectra of pure

ES-2
compounds is the basis of fingerprinting materials and their mixtures. The absorbance at the
characteristic wavelengths can also be used to quantify a particular functional group in the
analyzed mixture, provided that an appropriate calibration curve is set up. Thus, ATR requires a
higher degree of training for spectra interpretation and acquisition of reference spectra for field
utilization. ATR spectrometers are available both as portable benchtop and handheld
instruments, the analysis requires little sample preparation beyond selecting a representative
aliquot, and the test duration is under 5 minutes. Potential applications of ATR are identifying
admixtures in Portland cement concrete; detecting lime in asphalt; detecting and semi-
quantifying styrene-butadiene block (SBS) polymers in asphalt; detecting tar, oil, and organic
contaminants in soils and aggregates.
1
1.0 Background
1.1 What is Spectroscopy
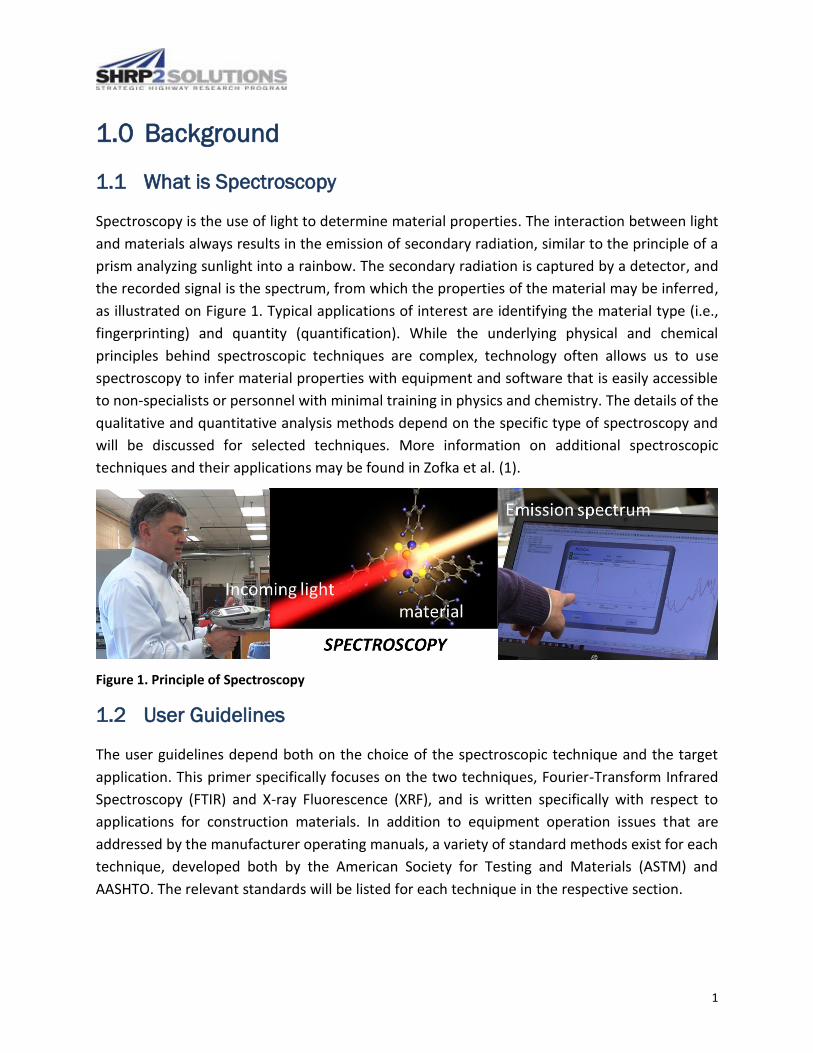
Spectroscopy is the use of light to determine material properties. The interaction between light
and materials always results in the emission of secondary radiation, similar to the principle of a
prism analyzing sunlight into a rainbow. The secondary radiation is captured by a detector, and
the recorded signal is the spectrum, from which the properties of the material may be inferred,
as illustrated on Figure 1. Typical applications of interest are identifying the material type (i.e.,
fingerprinting) and quantity (quantification). While the underlying physical and chemical
principles behind spectroscopic techniques are complex, technology often allows us to use
spectroscopy to infer material properties with equipment and software that is easily accessible
to non-specialists or personnel with minimal training in physics and chemistry. The details of the
qualitative and quantitative analysis methods depend on the specific type of spectroscopy and
will be discussed for selected techniques. More information on additional spectroscopic
techniques and their applications may be found in Zofka et al. (1).
Figure 1. Principle of Spectroscopy
1.2 User Guidelines
The user guidelines depend both on the choice of the spectroscopic technique and the target
application. This primer specifically focuses on the two techniques, Fourier-Transform Infrared
Spectroscopy (FTIR) and X-ray Fluorescence (XRF), and is written specifically with respect to
applications for construction materials. In addition to equipment operation issues that are
addressed by the manufacturer operating manuals, a variety of standard methods exist for each
technique, developed both by the American Society for Testing and Materials (ASTM) and
AASHTO. The relevant standards will be listed for each technique in the respective section.

2
1.3 Target Users and Applications
This primer has been written considering that the main target users of spectroscopic techniques
for construction materials are state highway agencies that require QA procedures to meet
material specifications. However, material manufacturers and contractors are also potential end
users of these techniques for the same purpose and may adopt the recommendations as well.
The target applications depend on the particular technique to be implemented. This primer
focuses on XRF and FTIR spectroscopy as the two most versatile portable techniques that can be
used for a variety of applications. These will be discussed for each method separately in the
following chapters. An overview is provided in Table 1.
Table 1. Overview of Potential Applications for XRF and FTIR Spectroscopic Techniques
XRF FTIR
QA of traffic paints and epoxies Identification of PCC admixtures
Detection of lead (Pb) and arsenic (As) in glass beads
Detection of lime in asphalt
Analysis of heavy metals in construction debris, old paints, aggregates, soils etc.
Evaluation of degree of asphalt oxidation (in research stage*)
Detection of lime and polyphosphoric acid (PPA) in asphalt
Identification and semi-quantification of SBS polymers in asphalt
Detection of motor oils, waste engine oils and rubber in asphalt mixes
Identification of waste engine oil and other admixtures in asphalt (in research stage*)
QA of Portland cement Detection of miscellaneous additives in asphalt (crumb rubber, nanoclay and carbon admixtures –in research stage*)
Steel grade and metal alloy analysis Detection of organic contaminants (diesel, tar, waste oil) in inorganic media (soils, aggregates)
Note: * These applications have been presented in the research literature, but not vetted in the field.
3
2.0 X-Ray Fluorescence
2.1 Principle of XRF
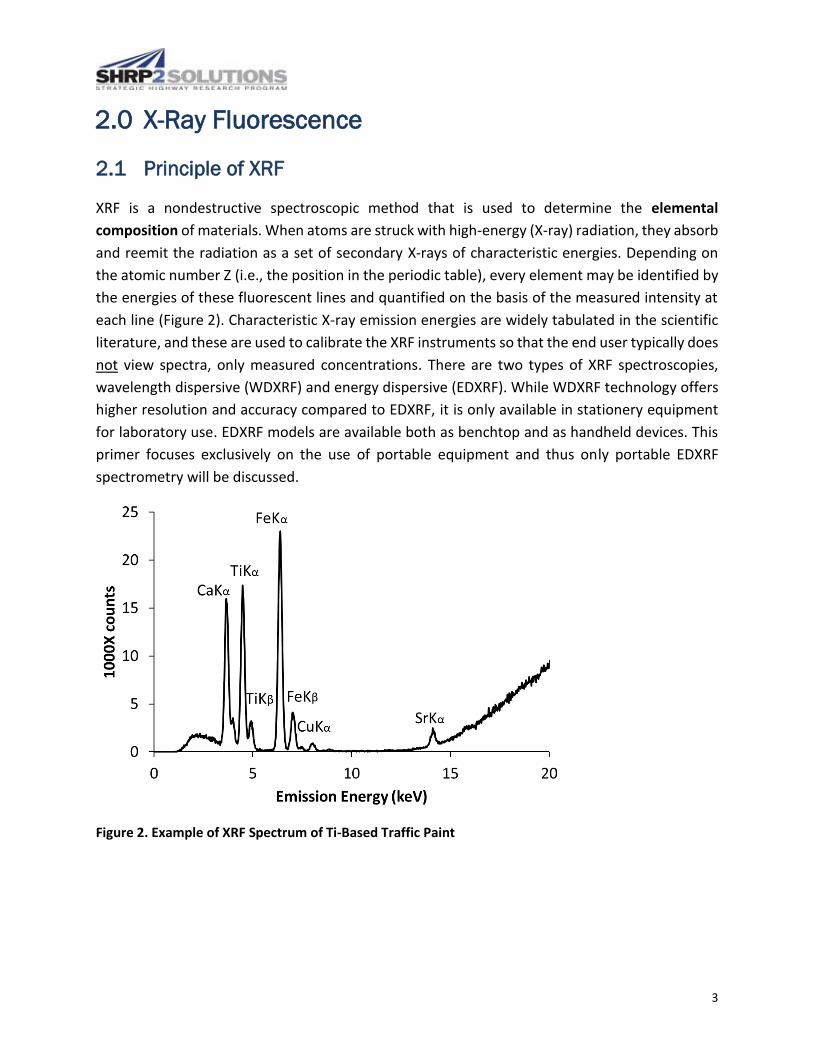
XRF is a nondestructive spectroscopic method that is used to determine the elemental
composition of materials. When atoms are struck with high-energy (X-ray) radiation, they absorb
and reemit the radiation as a set of secondary X-rays of characteristic energies. Depending on
the atomic number Z (i.e., the position in the periodic table), every element may be identified by
the energies of these fluorescent lines and quantified on the basis of the measured intensity at
each line (Figure 2). Characteristic X-ray emission energies are widely tabulated in the scientific
literature, and these are used to calibrate the XRF instruments so that the end user typically does
not view spectra, only measured concentrations. There are two types of XRF spectroscopies,
wavelength dispersive (WDXRF) and energy dispersive (EDXRF). While WDXRF technology offers
higher resolution and accuracy compared to EDXRF, it is only available in stationery equipment
for laboratory use. EDXRF models are available both as benchtop and as handheld devices. This
primer focuses exclusively on the use of portable equipment and thus only portable EDXRF
spectrometry will be discussed.
Figure 2. Example of XRF Spectrum of Ti-Based Traffic Paint

4
Figure 3. Example of portable XRF devices, presented during a SHRP2 R06B showcase at the University of Connecticut (November 2, 2016).
2.2 Applications
XRF may be used for the following several types of applications in construction and
transportation materials:
Detecting heavy metals in solids, suspensions, or liquids—Examples include Pb in paint,
Pb and As in glass beads, metal contaminants in soils, asphalt, aggregates, and
construction debris.

5
Determining steel grade—Several manufacturers offer specific calibrations that
recognize the grade and type of steel analyzed, as well as various types of metal alloys.
Positive material identification (PMI) testing is a widely used term that refers to the
analysis of the composition of metal alloys, including steel, and XRF is the premier method
for this application.
Measuring chloride content in concrete—Maine Department of Transportation (DOT)
recently developed a method to detect deleterious levels of chloride in concrete using a
portable XRF in a laboratory setting. The method is applied on crushed, homogenized
concrete prepared as a pressed powder pellet (Figure 4).
Figure 4. Pressed powder pellet (left and placing of the pellet in the XRF test stand for
laboratory analysis (photos courtesy of Maine DOT)
Measuring thickness of metal coatings (Cr, Zn, Ni)—ASTM Method B568-98 covers this
application, which is also available as built-in calibration by certain manufacturers.
Measuring the zinc (Zn) coating thickness of railings is an example of the implementation
of this application in transportation.
Detecting lime in asphalt binder—This application may be done using the calcium (Ca)
content and was employed as early as 1985 (2). A caveat to this method is that if the
asphalt binder has already been mixed with the aggregate and the aggregate contains
calcium, it will interfere with the detection of lime (CaO).
Detecting PPA in asphalt binder—The Alabama DOT has developed a standard
specification to measure PPA in asphalt binder using XRF to detect P. Federal Highway
Administration (FHWA) (3) offers additional information on this application.

6
Detecting waste admixtures in asphalt mix using characteristic metals—Both FHWA and
the Texas DOT have employed XRF to identify the presence of materials such as tire
rubbers and waste engine oils in asphalt mixes using elevated contents of zinc (Zn),
calcium (Ca), molybdenum (Mo) and copper (Cu) as markers. Hesp and Shurvell (4) also
report on applying XRF using Zn to identify waste engine oil in asphalt mix. Arnold (5)
presents a comprehensive methodology to detect and estimate REOB in asphalt mix.
QA of paints and epoxies—Techniques to Fingerprint Construction Materials User Guide
developed a draft AASHTO specification to use the titanium (Ti) content of paints as QA
criterion. ASTM 5381-93 (5) was recently developed with the same purpose. These
techniques apply to the analysis of liquid paints prior to the application on the road
surface. The use of XRF to determine the Ti content of thermoplastics used in road
marking is still under development. QA of cement—XRF is the primary method used in
the cement industry to determine the composition and consistency of Portland cement.
Typically stationary WDXRF equipment is utilized towards this purpose due to its ability
to detect light elements (silicon [Si], aluminum [Al], magnesium [Mg]) with high precision,
however modern handheld equipment may also have similar capabilities. This application
has not been vetted to date.
In general, XRF may be used to fingerprint any material that has a characteristic elemental
composition for the calibrated elements, or a characteristic metal, as illustrated in the examples
above. Typically, developing a new application requires analyzing pure materials in the laboratory
to determine the “signature” elements and associated concentrations and evaluate the lower
level of admixture that could be detected by XRF.
There are several ASTM, AASHTO and EPA methods available related to XRF application on
construction materials, some of which are listed below:
AASHTO methods
• AASHTO TP 106 Standard Method Of Test For Determination Of Heavy Metal Content Of
Glass Beads Using X-ray Fluorescence (XRF)
• AASHTO M 85 Chemical (Oxide) Analysis by X-ray Fluorescence (XRF)
• AASHTO T 105-14 Standard Method of Test for Chemical Analysis of Hydraulic Cement
(ASTM Designation: C 114-11be1)
ASTM methods
• ASTM F2980 – 13: Standard Test Method for Analysis of Heavy Metals in Glass by Field
Portable X-Ray Fluorescence (XRF)

7
• ASTM E1361 02(2014)e1: Standard Guide for Correction of Interelement Effects in X-Ray
Spectrometric Analysis
• ASTM D4294-16e1 Standard Test Method for Sulfur in Petroleum and Petroleum Products
by Energy Dispersive X-ray Fluorescence Spectrometry
• ASTM D5381-93(2014) Standard Guide for X-Ray Fluorescence (XRF) Spectroscopy of
Pigments and Extenders
• ASTM E2120-10(2016) Standard Practice for Performance Evaluation of the Portable X-
Ray Fluorescence Spectrometer for the Measurement of Lead in Paint Films
• ASTM D4764-01(2012) Standard Test Method for Determination by X-ray Fluorescence
Spectroscopy of Titanium Dioxide Content in Paint
• ASTM B568-98 (2014): Standard Test Method for Measurement of Coating Thickness by
X-ray Spectrometry
EPA methods
• SW-846 Test Method 6200: Field Portable X-Ray Fluorescence Spectrometry for the
Determination of Elemental Concentrations in Soil and Sediment
Users are encouraged to consult the respective websites, as new methods are continuously
developed and revised for portable XRF applications.
2.3 Equipment
Portable XRF devices in the market are pre-calibrated for a variety of elements and concentration
ranges, and operations and maintenance require only basic training. As will be discussed later,
care must be taken that the built-in calibrations are appropriate for the type of application
considered. While this does not affect the operation of the equipment per se, it is important for
proper evaluation of the results. Certification from the Occupational Safety and Health
Administration (OSHA) for operation of X-ray equipment may be a requirement; this depends on
state regulations.
The test consists in attaching the equipment to the sample or surface of interest (Figure 3). The
user then pulls a trigger to conduct the test, or controls the operation from a laptop when the
equipment is attached to a docking station. The test duration is under 3 minutes, with most
applications requiring as little as 30-60 seconds of analysis. The results are provided automatically
in tabulated format for each element in the calibration range, in milligrams per kilograms (mg/kg)
or percent by weight. The error associated with the XRF measurement, calculated as three times
the standard deviation (3σ), is also provided. The results are stored in the equipment and can be

8
exported as comma separate value (.csv) spreadsheets directly into a computer, an example of
which is shown in Table 2. Individual spectra may also be exported, if so desired.
Table 2. Example of Exported XRF Results
Sample ID Ni Ni +/- Ni Pass Ti Ti +/- Ti Pass
Sample-1 189 27 Pass 4784 248 Pass
Sample-2 Less than LOD
70 Pass 6863 215 Pass
Sample-3 85 19 Pass 5396 197 Pass Note: Each element contains a column for the concentration in mg/kg, the instrument error (+/-) in mg/kg and the internal QA result (Pass/Fail). LOD = Limit of detection
Most available portable XRF equipment can detect elements between Mg (Z=12) and U (Z=92),
and calibrations are typically provided for more than 30 elements. In some cases, different
calibrations are required for elements that are measured in low concentrations (<10,000 mg/kg
or 1% by weight) and for elements that are present in high concentrations, e.g. alloys, cements
or aggregates. This depends on the manufacturer and should be discussed prior to the purchase
of the equipment. The limits of detection (LODs) are specific to each element and also depend
on the equipment type; users may consult with individual manufacturers to obtain tables of LODs
for the particular model and calibration. In addition, LODs are sensitive to the analysis time (the
longer the time, the lower the LOD) and the analyzed matrix.
Most manufacturers offer a range of handheld instruments for different applications, such as
targeting ores and alloys, trace elements in soils, light elements in oil and gas exploration, and
others. The type of anode (that is, the X-ray producing material) in the equipment may vary
between silver [Ag], gold [Au], tungsten [W], rhodium [Rh], and others. The choice of anode
depends on the target application; Rh has superior performance for light elements such as Mg,
but interferes with the measurement of Cl; W offers superior performance for heavy elements
such as Pb or Cadmium. Several calibration ranges (in the ppm or percentage range) are also
possible for a single instrument, increasing the versatility of applications. Each calibration has a
detection limit and an upper limit, above which the response is nonlinear, and the quantification
results become unreliable. Users should consult on the upper limits with the manufacturer, as
they are typically not provided in the accompanying documentation.
2.4 Test Procedure
XRF may be applied on granular samples that are placed in special XRF sample holders, or the
equipment may be directly placed on the material surface, as shown on Figure 3. Test stands are

9
available that can be used to place sample holders and perform the test without the need for an
operator to hold it (Figure 5).
Figure 5. Example of XRF test stand, with a protective shield to isolate X-rays. Samples are
placed within the shield in contact with the XRF window.
In general, the testing procedure involves the following steps:
Initiating equipment start-up and standardization according to the directions of the
manufacturer. This typically requires 10 minutes or less.
Placing the sample holder on the XRF window (if a test stand is used) or hold the XRF
window flush against the surface.
Initiating the test by pushing the trigger or by using the software, if a test stand is used.
The test may last between 30 seconds to 3 minutes. The actual time required will depend
on the instrument and desired level of accuracy. The longer the testing time, the lower
the LOD and the associated standard deviation.
Receiving results displayed on the screen and exporting in a digital format.
2.5 Limitations
The following are the main limitations of XRF: (1) it can identify only elements, not complex
compounds; and, (2) the range of elements is limited. XRF cannot be used, for example, to
determine the composition of any organic material, and it cannot differentiate that contain
similar elements with different structure (for example, lime and limestone are both based on Ca,

10
but lime is calcium oxide [CaO] and limestone is calcium carbonate [CaCO3]). It is possible to use
XRF to detect the presence of calcium in a mixture, however differentiation between free lime
and calcium carbonate is not possible. This may be especially confusing when elements are
reported as oxides, i.e. CaO. This does not mean that calcium is present as free lime, but is only
a reporting format for the total elemental concentration.
Beyond the method itself, there are nuances with respect to XRF interpretation that are
associated with the specific type of material, for example the moisture content of a liquid paint
affects the measured metal content. Also, the depth of penetration has to be considered, for
example conducting a test on paint applied onto a surface will also yield signal from the
underlying material, which has to be taken into account for interpretation of results. An example
to illustrate both of these phenomena is shown on Figure 6 and in Table 3, obtained from a field
application in Maine, conducted during Phase IV of R06B.
Figure 6. Freshly painted concrete blocks in the laboratory (left) and freshly painted bridge on
I-95 overpass in Maine (right)
Table 3. Example of XRF Results for samples shown on Figure 6
Laboratory Field
Liquid paint Painted block Painted bridge
Ti (wt.%) 8.82 ± 0.13 10.06 ± 2.67 9.21 ± 0.29
Fe (wt.%) 0.02 ± 0.01 13.30 ± 3.30 17.83 ± 3.68
Zn (wt.%) 0.01 ± 0.01 ND 34.20 ± 4.85
Pb (wt.%) ND ND 0.02 ± 0.01 Note: ND = not detected
Testing the liquid paint in the laboratory resulted in an average Ti concentration of 8.8 wt.%; in
this case, the paint was placed in a sample holder and tested separately. In the next step, painted
wedges were prepared and tested, in order to create a more representative testing environment
compared to the field testing conditions. The Ti content on the same paint immediately after

11
application was found to be ~10%. The higher result is that during application of the water in the
paint emulsion evaporates, resulting in more concentrated content of Ti in the fresh paint layer.
As the paint dries out, the content keeps increasing until it stabilizes. When the same paint was
tested on the freshly painted bridge, the Ti content was found to be intermediate compared to
the two laboratory measurements. In addition to this observation, it may be seen from Table 3
that other elements were detected in different concentrations on the painted blocks and bridge,
which were not present in the original paint. This is due to the phenomenon shown on Figure 7.
Figure 7. Representation of the X-ray path as it is emitted from the XRF equipment, interacts and with
the matrix and then re-emitted from different elements towards the detector.
Incoming radiation has a high energy (up to 50 keV) and thus penetrates most construction
materials to depths that range from several millimeters to centimeters. The X-rays then interact
with the elements in the material, which emit the secondary radiation at a wavelength or energy
specific to the element. In order for the element to be detected, the secondary radiation has to
reach the detector, i.e. penetrate the material in the reverse direction, as shown on Figure 7.
How far the radiation can travel is a function of the element that emits it and the surrounding
matrix, which partially attenuates the signal as it travels towards the detector. In the application
shown on Figure 7, Fe and Pb present below the paint layer are both able to be captured by the
XRF and the respective concentrations reported in Table 2. The reported concentrations of the
elements are not necessarily derived from the same location within the material, which is an
important consideration when analyzing stratified and inhomogeneous matrices such as paint
layers.
Finally, a crucial consideration is the so called “matrix effects”. This means that the nature of the
material being measured influences the measurement. The first consideration when testing a
new material is whether the build-in calibrations can accurately capture the behavior of the
material. It is crucial that users purchase a variety of standards with properties similar to the

12
properties of the materials to be tested. These can be used to produce material-specific
calibration curves that can be programmed into the equipment as “user factors” that are specific
to the material. An example of this is shown on Figure 8. The Tennessee Department of
Transportation (TDOT) was interested in measuring the silica (SiO2) content of aggregates using
the portable XRF as a measure of aggregate quality. TDOT acquired a variety of siliceous
standards from the Cement Concrete Reference Laboratory, with a range of concentrations
between 18% and 60% SiO2, as shown on Figure 8. Each standard was prepared with a hydraulic
press and analyzed using the built-in calibration of the XRF. The results were plotted against the
reference concentration of the standard. As seen on Figure 8, the XRF measurement consistently
overestimated the SiO2 concentration by a factor of 1.0657. This factor could then be used to
automatically correct all SiO2 concentrations ready by the instrument in the range 18-60%, as
long as the analyzed materials were similar in nature, i.e. aluminosilicates such as soils,
aggregates, cements, and pozzolans. This process was repeated using the same samples for a
variety of other elements as well.
Figure 8. Example of material-specific calibration curve for SiO2 created by TDOT
Finally, note as with any analysis method for heterogeneous materials, such as soils, aggregates,
and other natural materials, users should develop robust sampling and material handling plans
to insure the representativeness of the results.

13
3.0 Fourier-Transform Infrared Spectroscopy
3.1 Principle of FTIR
While XRF spectroscopy is largely automated, so that the user does not necessarily need to delve
as much into the underlying principles, FTIR is a more nuanced technique that does require some
basic understanding of the physical principles in order to conduct proper qualitative and
quantitative analysis. While it is beyond the scope of this primer to provide a full analysis of FTIR
theory (e.g., refer to Stuart (7) for a comprehensive presentation), we will summarize some basic
principles as related to the analysis of construction materials. Such understanding is necessary to
avoid pitfalls, such as false identifications and unrealistic expectations.
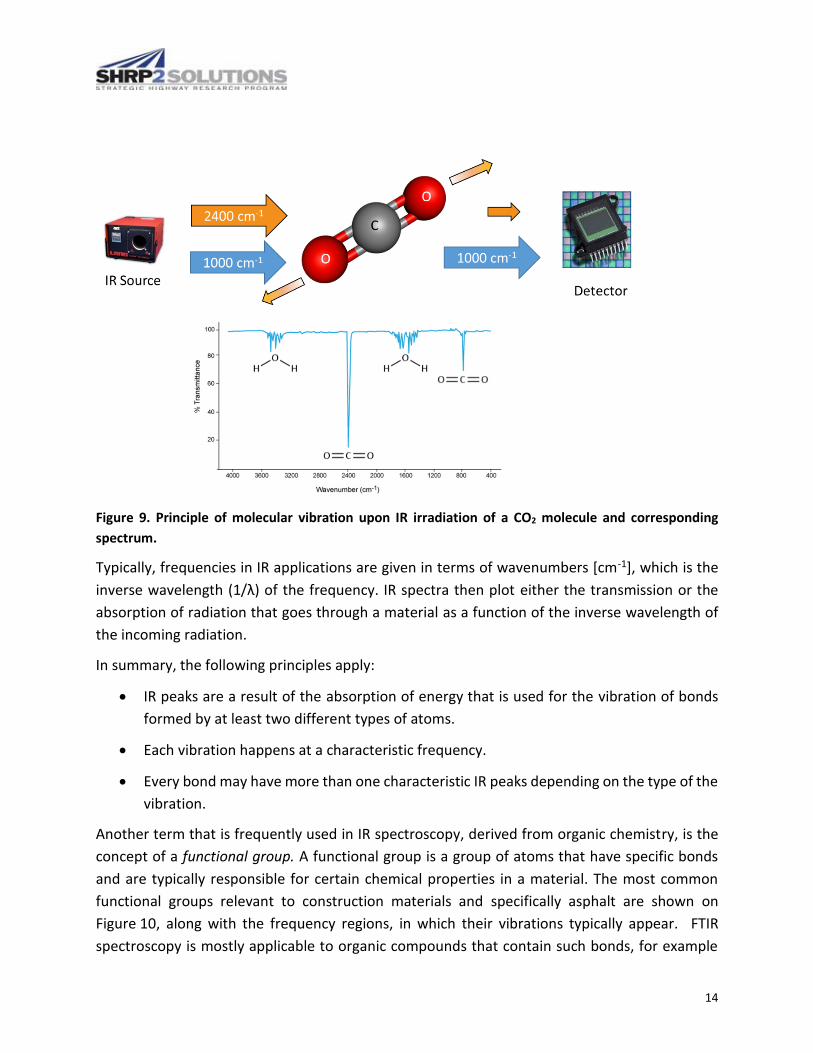
FTIR spectroscopy relies on the absorption of electromagnetic radiation in the infrared region
(wavelength between 0.78 and 100 micrometers [μm]) by vibrating molecules or functional
groups in large molecules. Fundamentally, covalent bonds between different atoms (e.g., carbon
[C] and oxygen [O]) are capable of absorbing IR radiation at a specific frequency, which then
induces a vibration in different directions. This is illustrated for the carbon dioxide [CO2] molecule
on Figure 9. The IR source emits radiation at several frequencies; only the one at
approximately 2,400 inverse centimeter (cm-1) is absorbed by the CO2 molecule and used to
induce a stretching vibration of the molecule. The emitted radiation that is captured then by the
detector records the same intensity of other frequencies that were not changed by the molecule,
whereas the IR-active frequency comes out diminished in intensity. In a transmission spectrum,
this is recorded as a reduction in the percent transmission at that frequency, as shown on
Figure 9. For the case of CO2 stretching shown on Figure 9, this vibration occurs at 2345 cm-1 and
is observed a sharp peak in the IR spectrum. The bending vibration occurs at 665 cm-1 and is
observed as a smaller peak. The small noise observed in between is due to ambient moisture
(H2O), as water molecules also have characteristic frequencies in the IR region.
14
Figure 9. Principle of molecular vibration upon IR irradiation of a CO2 molecule and corresponding
spectrum.
Typically, frequencies in IR applications are given in terms of wavenumbers [cm-1], which is the
inverse wavelength (1/λ) of the frequency. IR spectra then plot either the transmission or the
absorption of radiation that goes through a material as a function of the inverse wavelength of
the incoming radiation.
In summary, the following principles apply:
IR peaks are a result of the absorption of energy that is used for the vibration of bonds
formed by at least two different types of atoms.
Each vibration happens at a characteristic frequency.
Every bond may have more than one characteristic IR peaks depending on the type of the
vibration.
Another term that is frequently used in IR spectroscopy, derived from organic chemistry, is the
concept of a functional group. A functional group is a group of atoms that have specific bonds
and are typically responsible for certain chemical properties in a material. The most common
functional groups relevant to construction materials and specifically asphalt are shown on
Figure 10, along with the frequency regions, in which their vibrations typically appear. FTIR
spectroscopy is mostly applicable to organic compounds that contain such bonds, for example

15
C=C, -COOH, -C=O, and others. However, inorganic compounds with similar properties are also
detectable. For example, ions such as phosphate (PO43-) and ammonium (NH4
+) are also
detectable by FTIR spectroscopy (6).
Figure 10. Typical IR Absorption Ranges for Common Organic Functional Groups (reproduced after Wade [8])
If the observed peaks are only vibrations of isolated functional groups, then the question
becomes, how are we able to use these in order to fingerprint complex materials that may have
different combinations of these groups in their structure? To accomplish this, we utilize a
principle that is often applied in spectroscopic techniques to conduct qualitative and/or
quantitative analysis: through of comparison of the unknown spectra with spectra of pure
compounds obtained under controlled conditions.
This mean that FTIR analysis can only occur in a meaningful way when spectra of pure compounds
are available to the user; it is not possible to detect a compound that has not been previously
investigated in a pure form through this method. Databases of pure compounds are available for
download or purchase, for example the National Institute of Science and Technology (NIST) has
published a comprehensive database or pure IR spectra. For most applications discussed here, it
is necessary to obtain spectra of pure materials in the laboratory prior to field testing.
3.2 Applications
FTIR technology for construction and transportation material analyses is an evolving field and
different applications have different level for field readiness. More mature applications include:
Identifying and quantifying of polymers in asphalt—Polymers such as SBS can be
identified through characteristic peaks at 966 and 700 cm-1 (1). Quantification is also
possible at low concentrations, even though calibration curves have to be set up for
individual binder types and error was found to be substantial (1).

16
Identifying curing compounds and other admixtures in PCC (draft AASHTO method
developed by Techniques to Fingerprint Construction Materials User Guide)— PCC
admixtures include water reducers, air entraining admixtures, accelerators and retarders.
This application is based on the qualitative comparison of the IR absorbance spectrum of
a pure admixture sample with the spectrum of the fresh PCC-chemical mixture. The
success of this method depends on whether the characteristic peaks of the admixture
overlap with the PCC peaks and the level of the admixture (levels below 0.4 percent by
weight are likely below the noise level).
Identifying lime in asphalt—FHWA has developed an AASHTO provisional method (TP 72-
08) to implement FTIR to identify lime in asphalt (9). This application relies on the same
principle, i.e. it utilizes the characteristic peak of Ca(OH)2 at 3640 inverse centimeters
(cm-1) to fingerprint the addition of lime (CaO), since asphalt does not contain peaks in
this area of the spectrum.
Some additional applications have been identified that are still at the research stage, including:
Evaluating oxidation level in recycled asphalt pavement (RAP) mixtures (draft AASHTO
method developed by Techniques to Fingerprint Construction Materials User Guide)—
Tt\his method utilizes the characteristic peaks of two functional groups that contain
oxygen (carbonyl [C=O] and sulfoxide [S=O]) to evaluate the degree of oxidation of the
binder, which is correlated with the presence of these oxidized groups. Abbas et al. (10)
and Bowers et al. (11) used this approach to evaluate the properties of asphalt binders
extracted using a solvent and mixed with RAP. When aggregate is present, the Si-O
vibrations in the aggregate interfere with the S=O vibration, but not with the C=O
vibration. Additional research is required to establish wider correlation of oxidation and
RAP presence, especially in aged asphalt and in the presence of aggregate in order to
avoid the binder extraction step.
Identifying recycled engine oil bottoms in asphalt—Jia et al. (12) used FTIR to evaluate
the presence of waste oil in artificial mixtures of asphalt binders and RAP, using a similar
approach to the Techniques to Fingerprint Construction Materials User Guide method for
RAP testing. While this method has not been vetted in a wide variety of samples, it does
show promise for further exploration and field application.
Identifying miscellaneous modifiers in asphalt—Yao et al. (13) employed the same
approach as Jia et al. (12) to evaluate the presence of asphalt binders modified with
nanoclay and carbon microfibers. Similar to Jia et al. (12), the sample mixtures were
artificial, so that the type of admixture was known in advance. As will be described in the
limitations section, the functional groups used (carbonyl and sulfoxide) are non-specific
to a material (i.e., they may be derived from any admixture containing carbonyl; thus, the

17
type of admixture has to be known for this method to be applicable – this is rarely the
case).
Identifying diesel, oils, tar in soils, and other inorganic media—This may be done by
identifying characteristic carbon peaks in inorganic matrices that have distinct IR
vibrations.
3.3 Equipment
There are three types of FTIR equipment: stationary, benchtop – portable and handheld.
Stationary equipment typically operate in absorption or transmission mode and are used to
analyze gases, liquids and solids, while benchtop and handheld equipment operate on the basis
of reflection and can be used to probe liquids and solids (6). Field equipment only utilize
reflectance and will thus be discussed here. There are two main types of field FTIR equipment,
using ATR or diffuse reflectance (DRIFT), Several vendors offer benchtop or handheld equipment
with accessories that can switch between the two methods; examples are shown on Figure 11.
Details on the principles of each method are provided by Stuart (7) and other literature sources.
For construction materials discussed here, an important consideration is the amount of sample
probed and sample variability.

18
Figure 11. Handheld (top) and benchtop (bottom) ATR equipment presented at the R06B
showcase at UCONN (November 2, 2016).
Both ATR and DRIFT spectroscopy obtain information only from the surface of solid samples,
penetrating only a few micrometers into the material (Table 4). This is especially important to
keep in mind when evaluating spectra, considering the composition of the outermost thin layer
of a material; the interior of grains cannot be analyzed. The difference between ATR and DRIFT
lies in the number of surfaces probed to obtain the overall signal. As seen on Figure 11, the
probing interface for ATR is very small, typically 1-2 mm in diameter. Obtaining a representative
sample spectrum for a heterogeneous material is thus more challenging and requires the
collection of multiple spectra from multiple subsamples. DRIFT spectroscopy may be performed
on powdered samples without any preparation and the sample size is 1 to 2 grams (g), with IR
signals obtained from a multitude of grains within that sample. This is especially useful for
applications involving asphalt, concrete and soils or aggregates.
ATR spectrometers may use different internal reflection elements (IREs), with the most common
being diamond, germanium [Ge] and zinc selenide [ZnSe]. The main differences between these
IREs (in addition to cost) is durability, with diamond being the hardest and ZnSe the most prone
to damage, and the refractive index, which limits the spectral range available and the depth of
penetration (Table 4). For construction materials the spectral range of all three elements is
adequate, but ZnSe is not recommended for general use, especially considering applications
involving lime (basic) or PPA (acidic).
Special features provided by some manufacturers is the use of a pressure element to enhance
the contact between a solid sample and the IRE, which is necessary for quality spectra acquisition,
and the availability of a heating element that can soften materials such as asphalt and improve
contact with the IRE.
Table 4. Properties of the most common ATR internal reflection elements
Spectral range
(cm-1)
Depth of penetration*
(μm)
Resistance to acid/base
Hardness Uses
Diamond 25,000 to 100
2.01 High High General and hard/caustic
materials
ZnSe 15,000 to 650
2.01 Medium Low General
Ge 5,500 to 675 0.66 Medium/High Medium High absorbance
materials

19
Table 4. Properties of the most common ATR internal reflection elements
Spectral range
(cm-1)
Depth of penetration*
(μm)
Resistance to acid/base
Hardness Uses
(polymers, rubber)
Note: *at 1,000 cm-1
In terms of portability, benchtop equipment can be used in the laboratory and in the field, for
example on the back of a truck (Figure 12). This type of equipment does not offer the ability to
conduct point-and-shoot analysis, bringing the IRE in contact with the surface in situ. A sample
has to be extracted and placed on the equipment. Handheld equipment does offer the ability to
point-and-shoot, but the user still has to take into account the small probing interface and take
multiple spectra in order to obtain a representative result. Handheld equipment often have
docking stations, so that they may also be used in the laboratory with more convenience (for
example during the standard development phase).
A final consideration during equipment purchase is the accompanying software, what capabilities
it provides for qualitative and quantitative analysis, and how user-friendly it is. While using
freeware or purchasing software separately is possible, including software acquisition and
training in the equipment purchase is more cost-effective.
Figure 12. Field Use of a benchtop ATR FTIR Spectrometer

20
3.4 Test Procedure
In general, ATR and DRIFT do not require any sample preparation for liquid or solid samples. That
said, pretreating samples to reduce matrix interferences (e.g., from aggregate material in
asphalt) or obtaining a representative sample suitable to be in good contact with the IRE (e.g., by
reducing particle size or sieving) may be necessary. This is, however, specific to the application
and type of material analyzed and not inherent to the technique. Sample analysis includes the
following steps:
Power the instrument and provide the necessary warm up time, as required by the
manufacturer.
Clean the IRE with an appropriate solvent.
Obtain a background spectrum, which may be air, water, or another solution, depending
on the particular application. This spectrum is subtracted from the sample spectrum in
order to reduce interfering peaks from water, CO2 or other compounds.
Place the sample on the IRE and insure full coverage and good contact for optimal
spectrum quality.
Use the equipment software to program the necessary parameters, including spectral
range (typically 3000-400 cm-1), spectral resolution (4 cm-1 or higher) and number of co-
averaged scans. Taking multiple scans of the same material reduces noise and increases
the signal, improving the overall signal-to-noise ratio for good qualitative analysis. This
number can be as low as 24 or as high as 1200 for high quality spectra; the higher the
number, the longer the duration of the test. Spectra acquisition is typically a few minutes
and the spectrum is displayed at the end of the test.
Spectral processing and qualitative and quantitative analysis are then performed using the
software functions. Spectral processing generally includes atmospheric compensation
(interference of atmospheric carbon dioxide [CO2] and moisture [H2O]) and background removal,
if a background other than the atmosphere was used.
Qualitative analysis involves comparing the spectrum of a pure material that has been previously
stored or is available in databases. There are several databases available for organic compounds,
which may have some applicability to construction materials:
• https://guides.lib.utexas.edu/chemistry/spectra comprehensive list of online libraries
• NIST database (16,000 compounds):
https://srdata.nist.gov/gateway/gateway?property=IR+spectra and
http://webbook.nist.gov/chemistry/vib-ser.html to search by vibration energies

21
• EPA database (organic contaminants, solvents):
https://www3.epa.gov/ttnemc01/ftir/refnam.html
• Free library for organic compounds, searchable by wavenumber:
http://sdbs.db.aist.go.jp/sdbs/cgi-bin/cre_index.cgi
• Commercial libraries such as http://www.fdmspectra.com/
In addition, the SHRP2 R06B project provided spectral libraries of materials tested during the
project, available at http://www.trb.org/Main/Blurbs/167279.aspx. Finally, the analysis software
provided by equipment vendors typically includes some basic libraries. In general, it is
recommended to experimentally obtain reference spectra for quality assurance purposes.
There are two modes to implement FTIR: fingerprinting for QA purposes and conducting forensic
analysis to identify foreign compounds in a mixture. Fingerprinting is potentially easier to
conduct, as the analyst is looking for a compound with known properties. Some difficulties that
can arise are:
Interference of background matrix spectrum with compound spectrum. This principle is
illustrated on Figure 13. The hot mix asphalt (HMA) mix has strong reflections in the
regions around 2900 and 1500 cm-1, which cannot be used for identification of any added
compounds. The pure SBS polymer has characteristic peaks at several lower
wavenumbers (963, 910, 694, 668 cm-1). The pure HMA does not have any peaks in these
regions, so that the peaks may still be identified in the spectrum of the mixture. In this
case, interference of the matrix is not a problem for fingerprinting of the spectrum,
however that is not always the case. Obtaining pure spectra of both the compound of
interest and the matrix is critical for proper fingerprinting.
Detection limit: In Figure 13, 6% polymer was easily observed in the mixture, however,
as the concentration decreased to 1% the SBS peaks decreased to noise. In general, 1
wt.% is an average LOD for many compounds in a complex mixture.
Change of the compound structure upon addition to the matrix. As seen on Figure 13,
the SBS peaks observed at the lower wavenumbers shifted to 700 cm-1 and only one peak
is observed instead of two. This may potentially be due to the fact that the original
styrene group present in SBS reacted with the HMA in some fashion, changing the
bonding environment and thus the observed frequencies.

22
Figure 13. Example of ATR spectrum of HMA spectrum, pure SBS polymer (structure shown) and mixture
of HMA with 6% SBS. The right image shows a limited part of the spectrum for clarity.
For forensic investigations, the objective is to determine the nature of unknown peaks present
in a spectrum. An example of this is shown on Figure 14. When an asphalt binder was tested after
a pavement failure, a peak was identified that was not present in the sample that the supplier
had submitted for certification prior to use. Thus, the objective of this analysis was to determine
the nature of the peak and examine whether its presence had any connection to the apparent
failure of the pavement. It is important to distinguish between these two questions, i.e. the
identification of a foreign substance does not imply correlation to failure. As with any forensic
investigation, multiple lines of evidence are necessary to establish the culprit.

23
Figure 14. Example of FTIR spectrum of asphalt binder, tested as certified sample (green) and during
project application (red) (courtesy of Jerry McMahan, Vermont Agency of Transportation)
In order to determine the nature of the peak, two avenues were pursued:
Looking for potential admixtures (engine bottom oil, vegetable oil) that could account for
this peak.
Looking for functional groups that present peak positions in this area and then matching
the chemistry of the group to a potential source.
From the second approach, it was determined that the peak could be related to two functional
groups: -Si-O-Si- present in silicates and -S=O or sulfoxide. The first could potentially be present
if fine aggregate was present in the material, which would be possible if the sample came from
HMA. However, this sample was only asphalt binder prior to mixing with aggregate and thus
silicate should not be present. The second group has been found to be related to the presence
of asphalt aging and was therefore determined to be the best match for the peak.
Complementary XRF to determine the presence of Si or S could help elucidate the nature of the
peak in this case. Whether the presence of sulfoxide was related to the pavement failure could
not be established through IR alone.
Quantitative analysis with IR is also possible, but significantly more challenging. requires building
a calibration curve by using standard additions of the compound of interest to a background

24
matrix and measuring the absorbance in the characteristic peaks of the compound. A basic
introduction to qualitative and quantitative analysis is provided by Stuart (7) and software
manuals. It is, however, recommended for personnel to obtain training from the specific
manufacturer, if there is no prior experience with spectroscopy.
Overall, the following best practices are suggested for FTIR analysis:
Establishing a library of reference spectra for specific material types is key
Having a general idea of what it is you are looking for helps
Use existing databases to narrow down the type of functional group you are looking for
Use complementary techniques to corroborate your suspicions
3.5 Limitations
Following are the main limitations of FTIR:
It is only applicable to functional groups that have molecular vibrations in the IR region,
i.e. polar, asymmetric, covalent bonds.
FTIR detects polar functional groups, not entire molecules, and as such the observed
peaks are not necessarily unique to a single compound. For example, asphalt binders may
contain similar concentrations of polar functional groups such as carbonyl and sulfonyl,
which are observable by IR, but have different matrices that are not sensitive to IR. In
addition, as discussed in the applications section, different types of asphalt admixtures
may contain these functional groups, and FTIR alone cannot distinguish between them.
Water molecules have very strong IR active vibrations, which can easily obscure IR active
vibrations of other molecules when water presence is substantial, such as in aqueous
solutions.
Detection of admixtures has a LOD of about 1%.
References
1. Zofka, A., M. Chrysochoou, I. Yut, C. Johnston, M. Shaw, S.-P. Sun, J. Mahoney, S. Farquharson,
and M. Donahue. Evaluating Applications of Field Spectroscopy Devices to Fingerprint
Commonly Used Construction Materials. Report S2-R06B-RR-1, Strategic Highway Research
Program 2, Transportation Research Board, 2013.

25
2. Ruth, B. (ed.). Evaluation and Prevention of Water Damage to Asphalt Pavement Materials.
ASTM Special Technical Publication 899, American Society for Testing and Materials,
Baltimore, MD, 1985.
3. Arnold, T. The Use of Phosphoric Acid to Stiffen Hot Mix Asphalt Binders. Report No. FHWA-
HRT-14-086, Federal Highway Administration Pavement Materials Team (HRDI-10), McLean,
VA, 2014.
4. Hesp, S.A. and H.G. Shurvell. X-ray Fluorescence Detection of Waste Engine Oil Residue in
asphalt and its effect on cracking in service. International Journal of Pavement Engineering,
Vol. 11(6), 2010, pp. 541-553.
5. Arnold, T. What’s in Your Asphalt, Public Roads, Vol. 81(2), 2017, FHWA-HRT-17-006.
6. American Society for Testing Materials, Standard Guide for X-Ray Fluorescence (XRF)
Spectroscopy of Pigments and Extenders, ASTM D5381 – 93, 2014.
7. Stuart, B. Infrared Spectroscopy: Fundamentals and Applications. John Wiley & Sons, Inc.,
New Jersey, 2005.
8. Wade, Jr., L.G. Organic Chemistry, 8th edition, Pearson Education, Upper Saddle River, NJ,
2012.
9. Arnold T., J. Rosario and J. Youtcheff. New Lime Test for Hot Mix Asphalt Unveiled. Public
Roads, Vol. 70(5), 2007, FHWA-HRT-07-003.
10. Abbas A. R., U. A. Mannan and S. Dessouky. Effect of recycled asphalt shingles on physical and
chemical properties of virgin asphalt binders. Construction and Building Materials, Vol. 45,
2013, pp. 162-172.
11. Bowers, B.F., B. Huang, X. Shu and B.C. Miller. Investigation of Reclaimed Asphalt Pavement
blending efficiency through GPC and FTIR. Construction and Building Materials, Vol. 50, 2014,
pp. 517-523.
12. Jia, X., B. Huang, B.F. Bowers and S. Zhao. Infrared spectra and rheological properties of
asphalt cement containing waste engine oil residues. Construction and Building Materials,
Vol. 50, 2014, pp. 683-691.
13. Yao H., Z. You, L. Li, S.W. Goh, C. H. Lee, Y. K. Yap and X. Shi. Rheological properties and
chemical analysis of nanoclay and carbon microfiber modified asphalt with Fourier transform
infrared spectroscopy. Construction and Building Materials, Vol. 38, 2013, pp. 327-337.

Divider
Appendix title