
Primer on Statistics for Interventional Cardiologists Giuseppe Sangiorgi, MD Pierfrancesco Agostoni,...
39
Primer on Statistics for Interventional Cardiologists Giuseppe Sangiorgi, MD Pierfrancesco Agostoni, MD Giuseppe Biondi-Zoccai, MD
-
Upload
randolf-sims -
Category
Documents
-
view
221 -
download
2
Transcript of Primer on Statistics for Interventional Cardiologists Giuseppe Sangiorgi, MD Pierfrancesco Agostoni,...

Primer on Statistics for Interventional
Cardiologists
Giuseppe Sangiorgi, MDPierfrancesco Agostoni, MDGiuseppe Biondi-Zoccai, MD

What you will learn• Introduction
• Basics
• Descriptive statistics
• Probability distributions
• Inferential statistics
• Finding differences in mean between two groups
• Finding differences in mean between more than 2 groups
• Linear regression and correlation for bivariate analysis
• Analysis of categorical data (contingency tables)
• Analysis of time-to-event data (survival analysis)
• Advanced statistics at a glance
• Conclusions and take home messages

What you will learn
• Probability distributions– what is it and what is it for– discrete: binomial, Poisson– continuous: normal, Chi-square, F and t– central limit theorem

What you will learn
• Probability distributions– what is it and what is it for– discrete: binomial, Poisson– continuous: normal, Chi-square, F and t– central limit theorem

What is a probability distribution?

What is a probability distribution?

Probability distribution: definition• It identifies either the probability of each value of an
unidentified random variable (for discrete variables), or the probability of the value falling within a particular interval (for continuous variables)
• The probability function describes the range of possible values that a random variable can attain and the probability that the value of the random variable is within any (measurable) subset of that range
• More roughly, a probability distribution is the universe of all possible cases for a given variable or function

Probability distribution: definition
• There are thus discrete probability distributions, when their cumulative distribution function only increases in jumps. More precisely, a probability distribution is discrete if there is a finite or countable set whose probability is 1.
• Otherwhise, probability distributions are called continuous if their cumulative distribution function is continuous, which means that it belongs to a random variable X.

Probability distribution: what for?
• Probability distributions are powerful tools which are routinely used (either explictly or implicitly) for making statistical inferences
• It is pivotal to identify the most appropriate distribution to be exploited for each given biostatistical problem
• Should you really be concerned?

Probability distribution: what for?• Probability distributions are powerful tools which are
routinely used (either explictly or implicitly) for making statistical inferences
• It is pivotal to identify the most appropriate distribution to be exploited for each given biostatistical problem
• Should you really be concerned?…
• Actually no, because when you correctly identify a given statistical test, you by default choose its corresponding probability distribution
What you will learn
• Probability distributions– what is it and what is it for– discrete: binomial, Poisson– continuous: normal, Chi-square, F and t– central limit theorem

Binomial distribution• The binomial distribution is the discrete
probability distribution of the number of successes in a sequence of n independent yes/no experiments, each of which yields success with probability p

Binomial distribution• The binomial distribution and the
corresponding binomial test are seldom used in clinical research, but they are the most basic example of probability distribution
• But, how can I recognize a biased die?• Using the binomial distribution:
I roll the dice 40 times, and compare my results to the results expected by the binomial model with n = 40 and p = 1/6

Poisson distribution• The Poisson distribution is a discrete probability
distribution that expresses the probability of a number of events occurring in a fixed period of time if these events occur with a known average rate and independently of the time since the last event. The Poisson distribution can also be used for the number of events in other specified intervals such as distance, area or volume

Poisson distribution• The Poisson distribution provides a useful and efficient
way to assess the percentage of time when a given range of results will be expected.
• You might wish to project a reasonable upper limit on some event after making a number of observations.
• Another potential application would be comparing rates of very rare adverse events, which occur sparsely in time and space
• The Poisson distribution and the corresponding tests are however seldom used in clinical research

What you will learn
• Probability distributions– What is it and what is it for– discrete: binomial, Poisson– continuous: normal, Chi-square, F and t– central limit theorem

Normal distribution
• The normal distribution, also called the Gaussian distribution, is an important family of continuous probability distributions, applicable in many fields
• Each member of the family may be defined by two parameters, location and scale: the mean ("average", μ) and variance (standard deviation squared, σ2) respectively
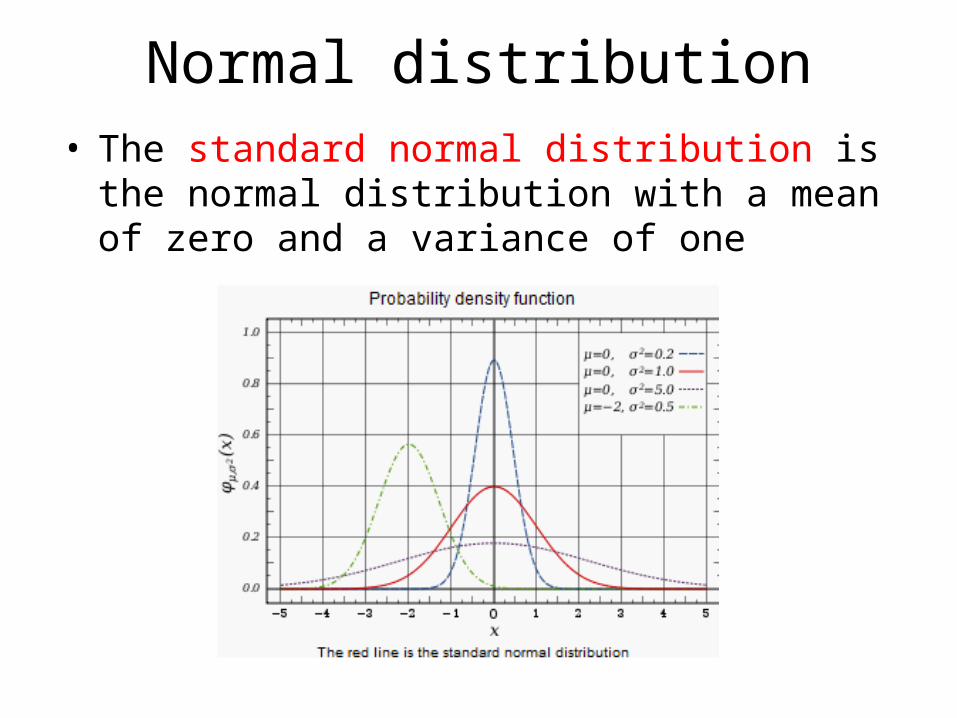
Normal distribution• The standard normal distribution is the normal
distribution with a mean of zero and a variance of one

Normal distribution• The normal distribution is probably the most
powerful tool in biostatistics, with thousand uses. Why?– It can be summarized quickly and efficiently by just two
numbers (μ and σ) – Many probability distributions look normal for large
samples (see central limit theorem)

Chi-square distribution• Describes the probability distribution of
a random sum (Q) of k independent, normally distributed random variables with mean 0 and variance 1

Chi-square distribution• It is commonly used for chi-square tests for
goodness of fit of an observed distribution to a theoretical one, and of the independence of two criteria of classification of qualitative data
• It is a very powerful and robust tool in biostatistics, second only to the normal distribution, for comparing categorical variables and/or goodness of fit

F distribution
• The F distribution is a continuous probability distribution

F distribution• Named by Snedecor as F for Ronald
Aylmer Fisher, is a continuous probability distribution exploited for the comparison of continuous variables
• It is a complex but very potent tool in biostatistics, and forms the basis of analysis of variance (ANOVA), as well as many other complex statistical models and analyses (eg multivariable linear regression models)

t distribution
• Student t distribution (or simply the t distribution) is a probability distribution that arises in the problem of estimating the mean of a normally distributed population when the sample size is small
• Student's distribution arises when (as in nearly all practical statistical work) the population standard deviation is unknown and has to be estimated from the data.

t distribution
• Student t distribution (or simply the t distribution) is a probability distribution that arises in the problem of estimating the mean of a normally distributed population when the sample size is small
• t distribution arises when (as in nearly all practical statistical work) the population standard deviation is unknown and has to be estimated from the data
Gosset

t distribution
If you look behind a t distribution, you will find a…

t distribution
If you look behind a t distribution, you will find a…
GUINNESS!!!

t distribution• The t distribution was developed in 1908 by
William Sealy Gosset, while he worked at aGuinness Brewery in Dublin, as he was prohibited from publishing under his own name. So the paper was written under the pseudonym Student
• The t test and the associated frequentist theory became well-known through the work of R.A. Fisher, who called the distribution “Student's distribution”

t distribution• The t test is a very useful and friendly test in
biostatistics, probably the most commonly used one with the chi-square test

t distribution• The t test is a very useful and friendly test in
biostatistics, probably the most commonly used one with the chi-square test
What you will learn
• Probability distributions– what is it and what is it for– discrete: binomial, Poisson– continuous: normal, Chi-square, F and t– central limit theorem

Central limit theorem• The central limit theorem (CLT) states that the re-
averaged sum of a sufficiently large number of identically distributed independent random variables each with finite mean and variance will be approximately normally distributed
• In other words, any sum of many independent identically distributed random variables will tend to be distributed according to a particular "attractor distribution”
• Since many real populations yield distributions with finite variance (eg weight, height, IQ), this explains the prevalence of the normal probability distribution

Central limit theoremHistogram plot of average proportion of heads in a fair coin toss, over a large number of sequences of coin tosses.
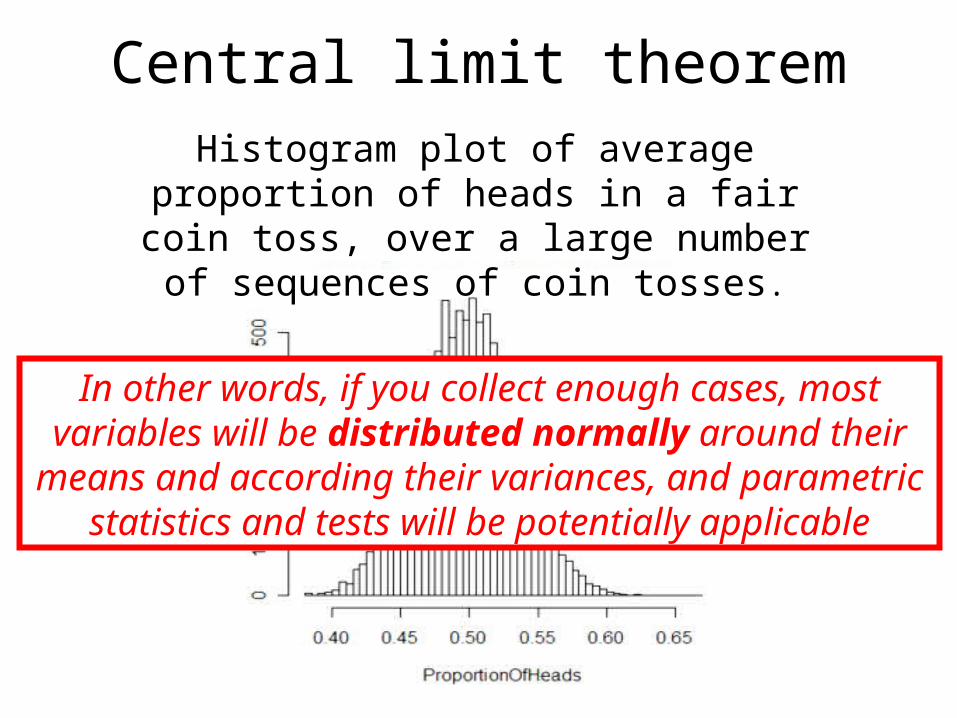
Central limit theoremHistogram plot of average proportion of heads in a fair coin toss, over a large number of sequences of coin tosses.
In other words, if you collect enough cases, most variables will be distributed normally around their
means and according their variances, and parametric statistics and tests will be potentially applicable
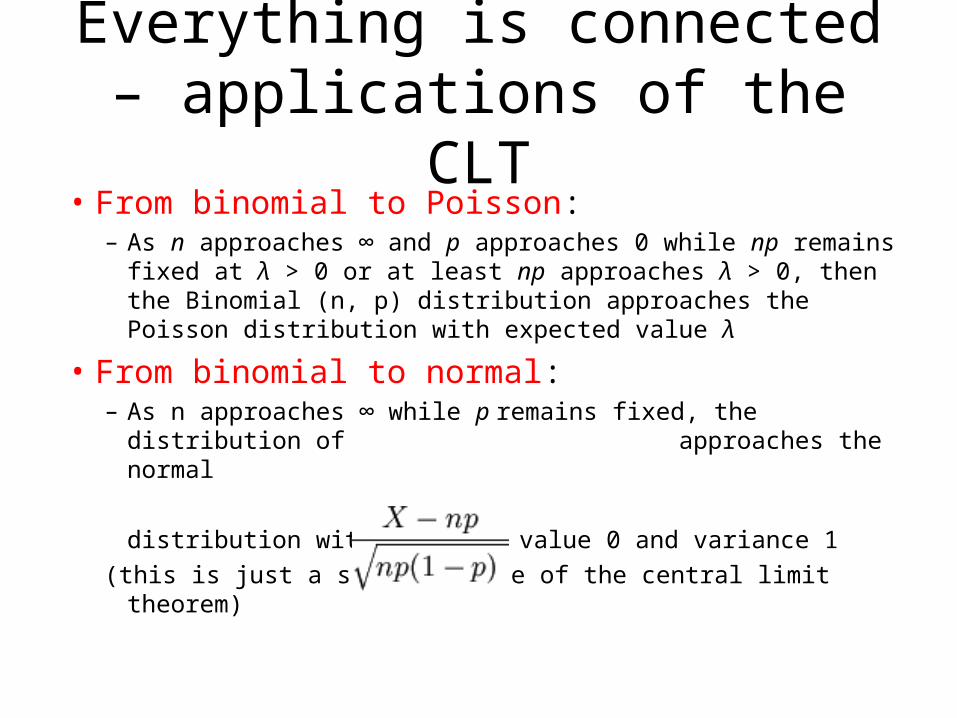
Everything is connected – applications of the CLT
• From binomial to Poisson:– As n approaches ∞ and p approaches 0 while np
remains fixed at λ > 0 or at least np approaches λ > 0, then the Binomial (n, p) distribution approaches the Poisson distribution with expected value λ
• From binomial to normal:– As n approaches ∞ while p remains fixed, the
distribution of approaches the normal
distribution with expected value 0 and variance 1
(this is just a specific case of the central limit theorem)
Value
Fre
qu
en
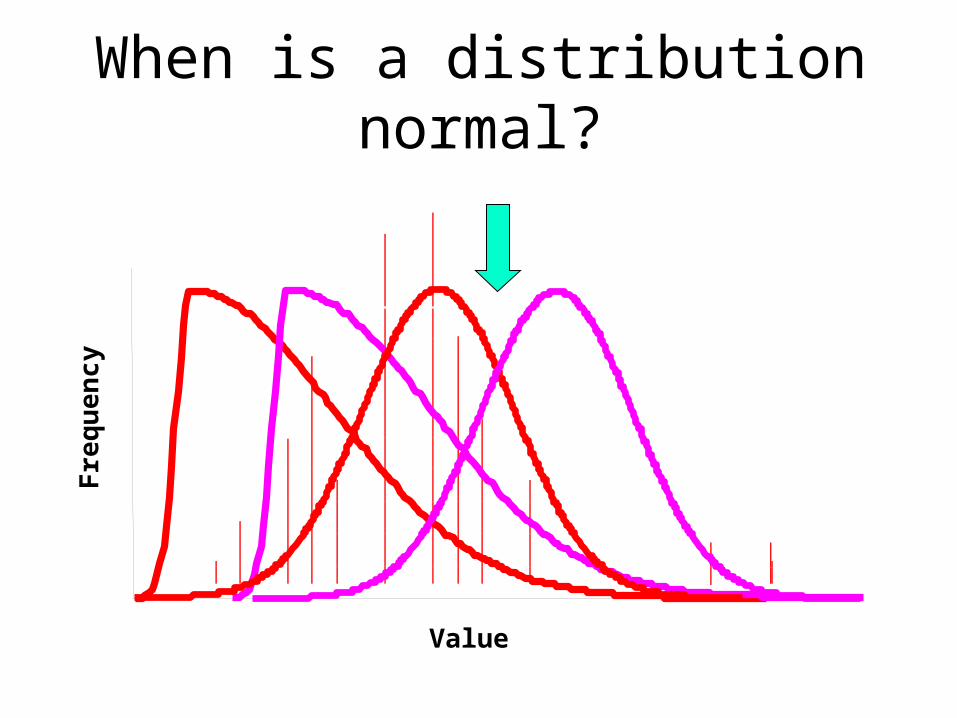
cyWhen is a distribution normal?

Testing normality assumptions Rules of thumbRules of thumb
1. Refer to previous data or analyses (eg landmark articles, large databases)
2. Inspect tables and graphs (eg outliers, histograms)
3. Check rough equality of mean, median, mode
4. Perform ad hoc statistical tests• Levene test for equality of variances
• Kolmogodorov-Smirnov test
• Moses-Shapiro test ...
When is a distribution normal?
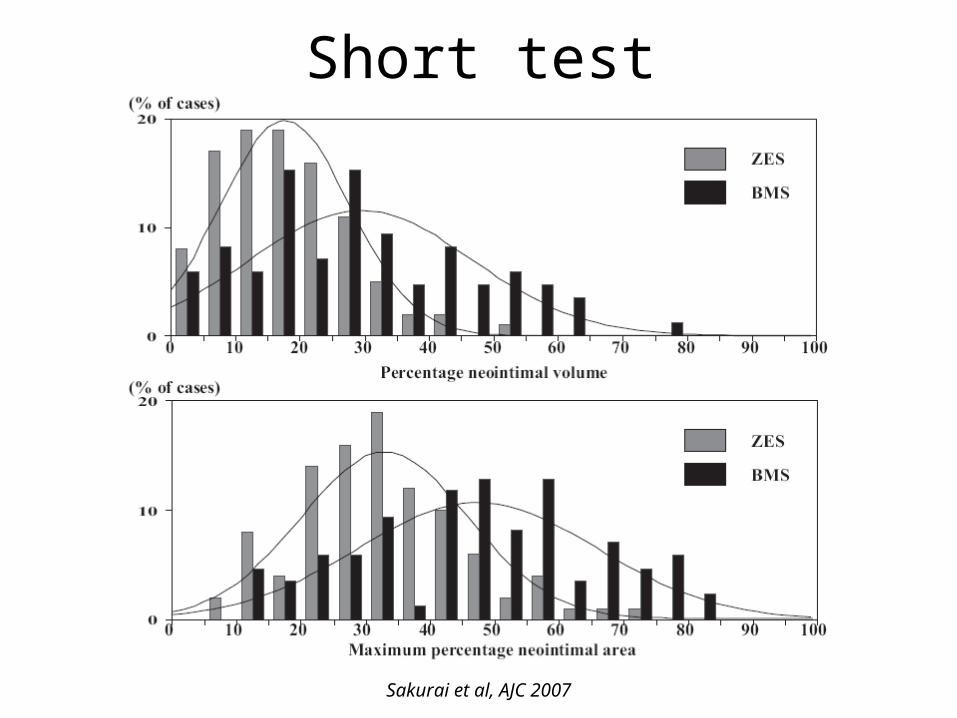
Short test
Sakurai et al, AJC 2007

Thank you for your attention
For any correspondence: [email protected]
For further slides on these topics feel free to visit the metcardio.org website:
http://www.metcardio.org/slides.html