
Primary photosynthetic processes: from supercomplex to leaf
136
Primary Photosynthetic Processes: From Supercomplex to Leaf
Transcript of Primary photosynthetic processes: from supercomplex to leaf

Primary Photosynthetic Processes: From Supercomplex to Leaf

Promotor:
Prof. dr. H. van Amerongen
Hoogleraar Biofysica
Wageningen Universiteit, Nederland
Promotiecommissie:
Dr. A.V. Ruban (Queen Mary University of London, United Kingdom)
Prof. Dr. T.J. Aartsma (Universiteit Leiden, Nederland)
Dr. J.P. Dekker (Vrije Universiteit Amsterdam, Nederland)
Prof. Dr. Ir. P. Struik (Wageningen Universiteit, Nederland)
Dit onderzoek is uitgevoerd binnen de onderzoeksschool EPS.

Primary Photosynthetic Processes: From Supercomplex to Leaf
Koen Broess
Proefschrift
ter verkrijging van de graad van doctor
op gezag van de rector magnificus
van Wageningen Universiteit,
Prof. dr. M.J. Kropff
In het openbaar te verdedigen
Op maandag 5 januari 2009
des namiddags te half twee in de Aula

Koen Broess 2009
Primary Photosynthetic Processes: From Supercomplex to Leaf
PhD thesis, Wageningen University, The Netherlands
Met een samenvatting in het Nederlands
ISBN: 978-90-8585-298-8

Old Man of the Sea


Contents Abbreviations Chapter 1 Introduction 1 Chapter 2 Excitation energy transfer and charge separation in 15
photosystem II membranes revisited Chapter 3 Determination of the excitation migration time in 47
photosystem II. Consequences for the membrane organization and charge separation parameters
Chapter 4 Excitation energy transfer in photosystem II 71
supercomplexes of higher plants with increasing antenna size
Chapter 5 Applying two-photon excitation fluorescence lifetime 91
imaging microscopy to study photosynthesis in plant leaves Chapter 6 Summarizing discussion 111
Chpater 7 Nederlandse samenvatting 117
Dankwoord 122
List of publications 123
Curriculum Vitae 124
Education Statement of the Graduate School 125
Experimental Plant Sciences

Abbreviations
ATP adenosine triphosphate
ADP adenosine diphosphate
Car carotenoid
CP24/26/29/43/47 chlorophyll protein with molecular mass 24/26/29/43/47 kDa
Cyt b6ƒ cytochrome b6ƒ
DAS decay associated spectra
DCMU 3-(3,4-dichloro-phenyl)-1,1-dimethyl-urea
α-DM n-dodecyl α-D-maltoside
β-DM n-dodecyl β-D-maltoside
EET excitation energy transfer
EM electron microscopy
ERPE exciton / radical-pair-equilibrium
Fd ferodoxin
fwhm full width at half maximum
FNR ferrodoxin NADP+ reductase
FLIM fluorescence lifetime imaging microscopy
IRF instrument response function
LHC light-harvesting complex
LHCI light-harvesting complex I
LHCII light-harvesting complex II
MA magic angle
NADP+ nicotinamide adenine dinucleotide phosphate (oxidized form)
NAPH nicotinamide adenine dinucleotide phosphate (reduced form)
NPQ nonphotochemical quenching

OPE one-photon excitation
Pheo pheophytin
PQ plastoquinon
PQH2 plastoquinol
PC plastocyanin
PSI photosystem I
PSII photosystem II
QA plastoquinone A
QB plastoquinone B
RC reaction center
TPA two-photon absorption
TPE two-photon excitation
TCSPC time-correlated single photon counting


Chapter 1 General Introduction

General Introduction
2
Introduction
Photosynthesis is the conversion of light energy of the sun into chemical energy by plants, green algae and cyanobacteria and literally means ‘synthesis with light’. It’s initial substrates are carbon dioxide and water, the end-products are oxygen and carbohydrates like sucrose, glucose or starch. This production of oxygen and assimilation of carbon dioxide into organic matter determines the composition of our atmosphere and provides all life forms with essential food and fuel [1].
The importance of photosynthesis was not understood until an English chemist Joseph Priestley (1733-1824) did a series of elegant experiments. He burned a candle in a closed vessel of air until the air could no longer support combustion; then he put a living plant into the container and found that, after a few days, the air in the vessel could again enable a candle to burn for a short time [2]. These experiments were the first to demonstrate that plants produce oxygen. Seven years later the Dutch physician Jan Ingenhousz discovered that also light was a crucial factor for Priestley’s experiment [3]. In the late 1700s biologists knew that at least carbon dioxide and oxygen were involved in photosynthesis, especially because of work of Lavoisier and Laplace. The work on the subject of photosynthesis that started with Priestley is continuing today and will probably be a subject of research for many more years, because photosynthesis serves as the vital link between light energy of the sun and all living creatures [4].
In plants photosynthesis occurs in organelles called chloroplasts. Chloroplasts have a diameter of 5-10 µm and a dept of 3-4 µm and contain a matrix called the thylakoid membranes that consist of stacks of membranes, the so called grana. The grana are connected by non-stacked membranes called stroma lamellae. The fluid compartment that surrounds the thylakoids is known as the stroma, and the space inside the thylakoids is the lumen. There are many similarities between photosynthetic bacteria and chloroplasts including the proteins in the photosynthetic reaction center [5]. Therefore it was suggested in 1905 that chloroplasts evolved from cyanobacteria and where taken inside cells as symbionts [6]. Chloroplasts possess their own DNA separate from the nuclear DNA of the plant host cells. Much of the genetic information has nowadays been transferred to the host nuclei, so they are no longer able to synthesize all of their own nucleic

Chapter 1
3
acids and proteins. Recent discoveries show that not only plants use chloroplasts for energy production, but also animals like solar-powered sea slugs [7, 8].
Organization of the Photosynthetic Membrane
There are four large membrane-protein complexes called photosystem I (PSI), photosystem II (PSII), Cytochrome b6/ƒ and F-ATPsynthase in thylakoid membranes that drive oxygenic photosynthesis (figure 1) [1, 9, 10].
A photosystem is a trans-membrane pigment-protein supercomplex embedded in the thylakoid membrane which consists of an inner-antenna system with a reaction center (RC) and the outer-antenna complexes responsible for light-harvesting. PSI and PSII can work in series for the production of high-energy molecules as ATP and NADPH (figure 1). The plant uses NADPH and ATP in the Calvin cycle to produce glucose, sucrose and starch amongst other things. The linear electron flux (LEF) is coupled with proton release during water oxidation in PSII. This leads to a proton gradient across the thylakoid membrane which is used by ATPase to make ATP. The electrons from water are transferred by a number of electron carriers and cofactors (e.g. QA, QB, PQ, PQH2, Cyt b6/ƒ and PC) to PSI. In PSI an additional photon is absorbed to finally produce NADPH via electrons of ferredoxin (Fd) (upper side of the thylakoid in figure 1).
Cyclic electron flux (CEF) around PSI (lower part of the thylakoid in figure 1) can also result in the release of a proton and contribute to the proton gradient. The two electron transport systems are thought to allow the regulation of the ATP and NADPH production to meet changing metabolic demands [11-13].
All these processes are initialized by the absorption of a photon which results in an excited state of a pigment molecule. This excited state migrates towards the reaction center (RC), where a charge-separation is created.

General Introduction
4
Figure 1 Schematic model of electron (arrows) and proton transfer (arrows) with the four main complexes PSII, PSI, Cyt b6/ƒ, ATP synthase and electron carriers plastoquinone (PQ), plastocyanin (PC) and ferredoxin (Fd). The upper part of the thylakoid membrane illustrates the linear electron transport and the lower part of the thylakoid shows the cyclic electron transport [1, 13].
Pigments and Pigment-Protein Complexes
The most abundant light-harvesting pigment is chlorophyll (Chl) a. Its structure (figure 2) consists of a tetrapyrrole ring with a magnesium atom in the center and a long phytol chain attached to the ring. The main absorption occurs in the Soret (~350-450 nm) and the Qy bands (~650-700 nm). The low absorption in the ~450-650 nm gives Chl a a green appearance. The second most abundant light-

Chapter 1
5
harvesting pigment is Chl b and its structure is almost identical to that of Chl a, but instead of a methyl group at the star position (figure 2) it has a formyl group. The absorption is slightly shifted compared to that of Chl a. The absorption for Chl b occurs around ~400-500 nm in the Soret band and around 625-675 nm in the Qy band.
Another important group of photosynthetic pigments is the one of the carotenoids (Car). These molecules consist of a polyene chain of alternating single and double bonds, with two rings at the end of the molecule (figure 2). They absorb in the blue-green region with pronounced absorption bands between 450 and 550 nm. Cars fulfill several important functions in photosynthesis, such as light harvesting, photo-protection by quenching Chl a triplet states, protection against singlet oxygen, dissipation of excess energy as heat and structural stabilization [14].
The proteins of the photosystems have specific binding sites for the pigments. The spectral properties of the pigments are influenced by the protein environment in vivo [15].
Figure 2 Structure of several photosynthetic pigments: chlorophylls (left) and carotenoids (right).
Recently the plant (Pisum sativum) structure of the PSI supercomplex was resolved at 3.4 Å resolution [16]. The plant PSI complex consists of a core complex which contains ~100 Chl a and 20 β-Cars [17] and an outer antenna complex with four
N
*
N N
OH3COOC
O
O
CH3CH3
NMg
*For Chl a this is a methyl group*For Chl b this is a formyl group
OH
OH
OH
OH
OH
OH
O
O
ß-carotene
lutein
zeaxanthin
violaxanthin

General Introduction
6
light-harvesting complex I (LHCI) proteins named Lhca1-4. Together they bind ~56 Chls and ~Cars [16, 17]. PSI contains also some Chls that absorb between 700 and 740 nm (i.e. at wavelengths longer than P700, the primary electron donor) that decrease the rate of charge separation [18], but may play an important role in light-harvesting in shade conditions [19, 20].
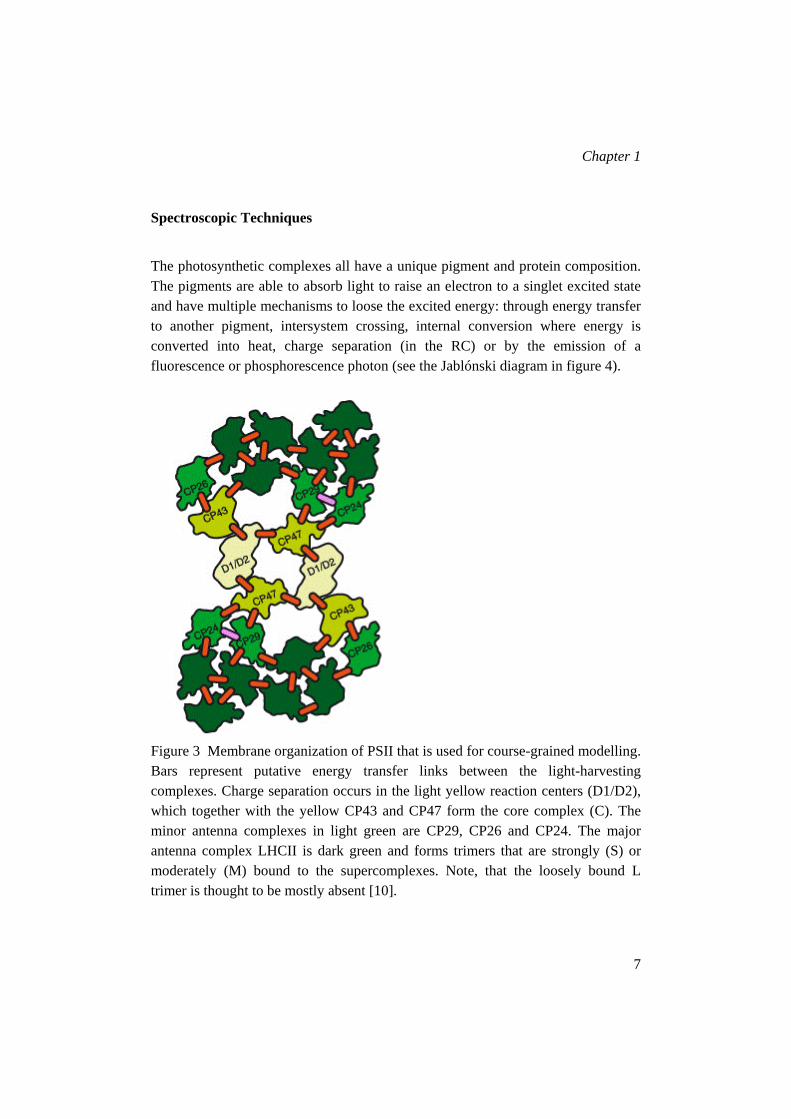
PSII is a unique complex because it can reduce water to molecular oxygen, protons and electrons in the oxygen-evolving complex (OEC) [21]. In higher plants PSII is present mainly as a dimeric structure. The core contains in total 35 Chl a molecules, 2 pheophytins a and 8-11 molecules of β-carotene [22]. These pigments are associated to several proteins: (i) D1 and D2 complexes, which coordinate the RC, the primary electron donor P680, and all cofactors of the electron transport chain; (ii) CP47 and CP43 which coordinate Chl a and β-Car molecules and act as an inner antenna and (iii) several low molecular weight subunits whose role is not fully understood [23]. The outer antenna system is composed of members of the light-harvesting complex (LHC) multigenic family [24]. The major antenna complex, light-harvesting complex II (LHCII), composed of the products of the genes Lhcb1-3, is organized in trimers, and coordinates 8 Chl a, 6 Chl b and 4 xanthophyll molecules per monomeric subunit [25]. Three more complexes, the so-called minor complexes CP29 (Lhcb4), CP26 (Lhcb5) and CP24 (Lhcb6) are present as monomers in the membrane and they coordinate respectively 8, 9 and 10 chlorophyll molecules and 2-3 xanthophyll molecules [26]. All these complexes are involved in light absorption, transfer of excitation energy to the reaction center and regulation of the excitation energy levels [27, 28]. The amount of these complexes in the membrane is variable and depends on the growing conditions of the plant [29]. The general membrane organization of PSII is known [10, 30-32] and is used in this thesis for the course-grained modeling of excitation energy transfer and charge separation as is illustrated in figure 3. In supercomplexes three different LHCII trimers have been identified and were named S, M and L, referring to strong, moderate and loose binding [10, 30-32].
Chapter 1
7
Spectroscopic Techniques
The photosynthetic complexes all have a unique pigment and protein composition. The pigments are able to absorb light to raise an electron to a singlet excited state and have multiple mechanisms to loose the excited energy: through energy transfer to another pigment, intersystem crossing, internal conversion where energy is converted into heat, charge separation (in the RC) or by the emission of a fluorescence or phosphorescence photon (see the Jablónski diagram in figure 4).
Figure 3 Membrane organization of PSII that is used for course-grained modelling. Bars represent putative energy transfer links between the light-harvesting complexes. Charge separation occurs in the light yellow reaction centers (D1/D2), which together with the yellow CP43 and CP47 form the core complex (C). The minor antenna complexes in light green are CP29, CP26 and CP24. The major antenna complex LHCII is dark green and forms trimers that are strongly (S) or moderately (M) bound to the supercomplexes. Note, that the loosely bound L trimer is thought to be mostly absent [10].

General Introduction
8
In this thesis time-resolved fluorescence of Chl molecules is used for studying the ultrafast kinetics in photosynthesis. It is based on exciting a sample with a very short laser pulse and detecting fluorescence intensity as a function of time. The fluorescence kinetics reflects the singlet excited state kinetics of the Chl a molecules.
In general, the experimentally determined fluorescence decay can be described by a sum of exponential decay functions, convolved with the instrument response function of the fluorescence setup:
it
N
ii eatf τ−
=
⋅= ∑,..2,1
)(
where ai reflects the various amplitudes and τi the fluorescence lifetimes.
Figure 4 Jablónski diagram of a pigment molecule. S0 is the ground state, S1, S2 and SN are excited states and T1 is the triplet state. The photosynthesis by photochemical quenching is directly competing to the fluorescence.
In this thesis the fluorescence lifetimes are detected by time-correlated single photon counting (TCSPC). For bulk fluorescence lifetime experiments in a cuvette the TCSPC setup is used in chapters 2, 3 and 4. Fluorescence lifetime imaging

Chapter 1
9
microscopy (FLIM) is used in chapter 5. The possibility to spatially resolve the fluorescence kinetics with a microscope is particularly useful for heterogeneous leaf samples. Leaf tissue is studied with two-photon excitation because it allows imaging up to ~500 µm depth in living plant tissue [33, 34] instead of a depth of ~100 µm with one-photon excitation. In the FLIM setup the beam is focused into a voxel of 0.5x0.5x2 µm and scanned over the sample. The resulting fluorescence is detected by TCSPC and this results in a fluorescence decay curve in each pixel of the image. This is demonstrated in figure 5 with an image of a crystal of LHCII [35]. The image consists of 64 x 64 pixels and the false color code shows the lifetime distribution in the crystal. One trace from the image is plotted, showing a mono-exponential decay curve with a lifetime of 890 ps. The lifetimes of the LHCII crystals are much shorter than those of LHCII in solution (not shown) and therefore LHCII is in a quenched state.
Figure 5 (left) Fluorescence lifetime image of an LHCII crystal. (right) Fluorescence decay trace in one pixel (red square in image)[35].
Outline
This thesis describes experiments on photosynthetic complexes that cover the first steps of photosynthesis, from the absorption of light by photosynthetic pigments to a charge separation in the RC.

General Introduction
10
In chapter 2, time-resolved fluorescence measurements of PSII membranes, the so called BBY particles [36], are performed in low-light conditions with open RCs. The average fluorescence decay time of 150 ps, taking also into account previous results obtained for LHCII [37], suggests that excitation migration from the antenna complexes contributes significantly to the overall charge separation time, in disagreement with most previous models. A simple course-grained method is proposed, based on the supramolecular organization of PSII and LHCII in grana membranes (C2S2M2) [10]. The simulations reveal that there is a significant drop in free energy upon primary charge separation.
In chapter 3, the fluorescence kinetics of BBY particles with open RCs are compared after preferential excitation of Chl a and Chl b, which causes a difference in the initial excited-state populations of the inner and outer antenna system. The fluorescence decay is somewhat slower upon preferential excitation of Chl b. Using the course-grained model it can be concluded that the average migration time contributes ~25% to the overall trapping time.
In chapter 4, four different PSII supercomplex preparations were studied. The main difference between these supercomplexes concerns the size of the outer antenna. The average lifetime of the supercomplexes becomes longer upon increasing the antenna size. The results indicate that the rate constants obtained from the course-grained method for BBY preparations, which is based on the supercomplex composition C2S2M2, should be slightly faster (~10%).
In chapter 5, the fluorescence kinetics of individual chloroplasts in leaves with open and closed RCs are measured. The kinetics are very similar to those obtained on chloroplasts in vitro and no variations are observed when scanning throughout the leaves. Within individual chloroplasts some variation is detected for the relative contributions of PSI and PSII to the fluorescence.

Chapter 1
11
References
[1] N. Nelson, A. Ben-Shem, The complex architecture of oxygenic photosynthesis, Nat Rev Mol Cell Biol 5 (2004) 971-982.
[2] J. Priestley, An Account of Further Discoveries in Air. By the Rev. Joseph Priestley, LL.D. F. R. S. in Letters to Sir John Pringle, Bart. P. R. S. and the Rev. Dr. Price, F. R. S, Philosophical Transactions (1683-1775) 65 (1775) 384-394.
[3] J. Ingenhousz, Experiments upon Vegetables, Discovering Their great Power of purifying the Common Air in the Sun-shine, and of Injuring it in the Shade and at Night. To Which is Joined, A new Method of examining the accurate Degree of Salubrity of the Atmosphere, London, 1779.
[4] K. Bacon, Photosynthesis, Vol. 10, Kluwer Academic Publishers 2001.
[5] A. Reyes-Prieto, A.P.M. Weber, D. Bhattacharya, The Origin and Establishment of the Plastid in Algae and Plants, Annual Review of Genetics 41 (2007) 147-168.
[6] C. Mereschkowski, Über Natur und Ursprung der Chromatophoren im Pflanzenreiche, Biol Centralbl 25 (1905) 593-604.
[7] M.E. Rumpho, E.J. Summer, J.R. Manhart, Solar-Powered Sea Slugs. Mollusc/Algal Chloroplast Symbiosis, Plant Physiol. 123 (2000) 29-38.
[8] E. Pennisi, ECOLOGY: Plant Wannabes, Science 313 (2006) 1229-.
[9] R. Moore, W.D. Clark, D.S. Vodopich, Botany McGraw-Hill Companies, Inc. 1998.
[10] J.P. Dekker, E.J. Boekema, Supramolecular organization of thylakoid membrane proteins in green plants, Biochim. Biophys. Acta 1706 (2005) 12-39.
[11] S. Berry, B. Rumberg, H+/ATP coupling ratio at the unmodulated CF0CF1-ATP synthase determined by proton flux measurements, Biochimica et Biophysica Acta (BBA) - Bioenergetics 1276 (1996) 51-56.
[12] P. Joliot, D. Béal, A. Joliot, Cyclic electron flow under saturating excitation of dark-adapted Arabidopsis leaves, Biochimica et Biophysica Acta (BBA) - Bioenergetics 1656 (2004) 166-176.

General Introduction
12
[13] N.R. Baker, J. Harbinson, D.M. Kramer, Determining the limitations and regulation of photosynthetic energy transduction in leaves, Plant, Cell and Environment 30 (2007) 1107-1125.
[14] K.K. Niyogi, Photoprotection revisited: Genetic and Molecular Approaches, Annual Review of Plant Physiology and Plant Molecular Biology 50 (1999) 333-359.
[15] H. van Amerongen, L. Valkunas, R. van Grondelle, Photosynthetic excitons, World Scientific Publishing Co. Pte. Ltd, Singapore, 2000.
[16] A. Amunts, O. Drory, N. Nelson, The structure of a plant photosystem I supercomplex at 3.4 Å resolution, Nature 447 (2007) 58-63.
[17] R. Croce, T. Morosinotto, S. Castelletti, J. Breton, R. Bassi, The Lhca antenna complexes of higher plants photosystem I, Biochimica et Biophysica Acta (BBA) - Bioenergetics 1556 (2002) 29-40.
[18] P.E. Jensen, R. Bassi, E.J. Boekema, J.P. Dekker, S. Jansson, D. Leister, C. Robinson, H.V. Scheller, Structure, function and regulation of plant photosystem I, Biochimica et Biophysica Acta (BBA) - Bioenergetics 1767 (2007) 335-352.
[19] A. Rivadossi, G. Zucchelli, F.M. Garlaschi, R.C. Jennings, The importance of PS I chlorophyll red forms in light-harvesting by leaves, Photosynthesis Research 60 (1999) 209-215.
[20] R. Croce, G. Zucchelli, F.M. Garlaschi, R.C. Jennings, A Thermal Broadening Study of the Antenna Chlorophylls in PSI-200, LHCI, and PSI Core, Biochemistry 37 (1998) 17355-17360.
[21] K.N. Ferreira, T.M. Iverson, K. Maghlaoui, J. Barber, S. Iwata, Architecture of the Photosynthetic Oxygen-Evolving Center, Science 303 (2004) 1831-1838.
[22] B. Loll, J. Kern, W. Saenger, A. Zouni, J. Biesiadka, Towards complete cofactor arrangement in the 3.0 Å resolution structure of photosystem II, Nature 438 (2005) 1040-1044.
[23] L. Shi, W.P. Schröder, The low molecular mass subunits of the photosynthetic supracomplex, photosystem II, Biochimica et Biophysica Acta (BBA) - Bioenergetics 1608 (2004) 75-96.

Chapter 1
13
[24] S. Jansson, A guide to the Lhc genes and their relatives in Arabidopsis, Trends in Plant Science 4 (1999) 236-240.
[25] Z. Liu, H. Yan, K. Wang, T. Kuang, J. Zhang, L. Gui, X. An, W. Chang, Crystal structure of spinach major light-harvesting complex at 2.72 Å resolution, Nature 428 (2004) 287-292.
[26] D. Sandona, R. Croce, A. Pagano, M. Crimi, R. Bassi, Higher plants light harvesting proteins. Structure and function as revealed by mutation analysis of either protein or chromophore moieties, Biochimica et Biophysica Acta (BBA) - Bioenergetics 1365 (1998) 207-214.
[27] H. van Amerongen, J.P. Dekker. in (Green, B.R. and Parson, W.W., eds.) Light-Harvesting Antennas in Photosynthesis, Kluwer Academic Publishers 2003, pp. 219-251.
[28] H. van Amerongen, R. Croce, Structure and Function of Photosystem II, The Royal Society of Chemistry, Cambridge, 2008.
[29] J.M. Anderson, B. Andersson, The dynamic photosynthetic membrane and regulation of solar energy conversion, Trends in Biochemical Sciences 13 (1988) 351-355.
[30] E.J. Boekema, B. Hankamer, D. Bald, J. Kruip, J. Nield, A.F. Boonstra, J. Barber, M. Rögner, Supramolecular structure of the photosystem II complex from green plants and cyanobacteria, Proceedings of the National Academy of Sciences of the United States of America 92 (1995) 175-179.
[31] E.J. Boekema, H. Van Roon, F. Calkoen, R. Bassi, J.P. Dekker, Multiple types of association of photosystem II and its light-harvesting antenna in partially solubilized photosystem II membranes, Biochemistry 38 (1999) 2233-2239.
[32] E.J. Boekema, J.F.L. van Breemen, H. van Roon, J.P. Dekker, Arrangement of photosystem II supercomplexes in crystalline macrodomains within the thylakoid membrane of green plant chloroplasts, Journal of Molecular Biology 301 (2000) 1123-1133.
[33] R.M. Williams, W.R. Zipfel, W.W. Webb, Multiphoton microscopy in biological research, Current Opinion in Chemical Biology 5 (2001) 603-608.

General Introduction
14
[34] W.R. Zipfel, R.M. Williams, W.W. Webb, Nonlinear magic: multiphoton microscopy in the biosciences, Nat Biotech 21 (2003) 1369-1377.
[35] A.A. Pascal, Z. Liu, K. Broess, B. van Oort, H. van Amerongen, C. Wang, P. Horton, B. Robert, W. Chang, A. Ruban, Molecular basis of photoprotection and control of photosynthetic light-harvesting, Nature 436 (2005) 134-137.
[36] D.A. Berthold, G.T. Babcock, C.F. Yocum, A highly-resolved, oxygen-evolving photosystem II preparation from spinach thylakoid membranes, FEBS Lett 134 (1981) 231-234.
[37] V. Barzda, V. Gulbinas, R. Kananavicius, V. Cervinskas, H. van Amerongen, R. van Grondelle, L. Valkunas, Singlet-singlet annihilation kinetics in aggregates and trimers of LHCII, Biophysical J. 80 (2001) 2409-2421.

Chapter 2
Excitation Energy Transfer and
Charge Separation in Photosystem II
Membranes Revisited

EET and CS in PSII
16
Abstract
We have performed time-resolved fluorescence measurements on photosystem II (PSII) containing membranes (BBY particles) from spinach with open reaction centers. The decay kinetics can be fitted with two main decay components with an average decay time of 150 ps. Comparison with recent kinetic exciton annihilation data on the major light-harvesting complex of PSII (LHCII) suggests that excitation diffusion within the antenna contributes significantly to the overall charge separation time in PSII, which disagrees with previously proposed trap-limited models. In order to establish to which extent excitation diffusion contributes to the overall charge separation time, we propose a simple coarse-grained method, based on the supramolecular organization of PSII and LHCII in grana membranes, to model the energy migration and charge separation processes in PSII simultaneously in a transparent way. All simulations have in common that the charge separation is fast and nearly irreversible, corresponding to a significant drop in free energy upon primary charge separation, and that in PSII membranes energy migration imposes a larger kinetic barrier for the overall process than primary charge separation.
Based on: Koen Broess, Gediminas Trinkunas, Chantal D. van der Weij - de Wit, Jan P. Dekker, Arie van Hoek, and Herbert van Amerongen. Excitation energy transfer and charge separation in photosystem II membranes revisited, (2006). Biophysical J. 91: 3776-3786
Introduction
Photosystem II (PSII) is a large supramolecular pigment-protein complex embedded in the thylakoid membranes of green plants, algae and cyanobacteria. It uses sunlight to split water into molecular oxygen, protons and electrons. PSII is conventionally subdivided into 1) a core consisting of light-harvesting complexes

Chapter 2
17
CP43 and CP47 and the reaction center (RC), where excitation energy is used to create a charge separation that is stabilized by secondary electron transfer processes, and 2) an outer antenna of chlorophyll (Chl) a/b binding proteins, containing the majority of the light-harvesting pigments. The latter proteins, of which the trimeric light-harvesting complex II (LHCII) is by far the most abundant, are not only required for the efficient absorption of light and the transfer of excitation energy to the RC under light-limiting conditions, they also play essential roles in several regulation mechanisms of the photosynthesis process under light-saturating conditions, like state transitions and non-photochemical quenching (See e.g. Pascal et al)(1).
The overall quantum efficiency of the charge separation process depends on the relative rate constants of various processes: 1) excitation energy transfer (EET) from chlorophylls in the light-harvesting antenna to the chlorophylls in the RC that perform the charge separation (CS), 2) charge separation and charge recombination in the RC, 3) stabilization of the charge separation by secondary electron transfer, and 4) trivial relaxation or loss processes of the excited state: intersystem crossing, internal conversion and fluorescence.
It is important to know which of the above-mentioned processes determine the overall rate of charge separation in open, fully functional PSII (with an RC in which the secondary electron acceptor QA is oxidized). This knowledge is needed for a detailed understanding of the kinetics of regulation processes like non-photochemical quenching. For a long time it has been assumed by many authors that the charge-separation process in PSII is trap-limited, i.e. the excitation energy diffusion through the antenna to the RC is much faster than the overall charge separation time. Since the eighties the so-called exciton/radical-pair-equilibrium (ERPE) model (2,3) has been a popular way to interpret time-resolved and steady-state fluorescence data of PSII containing preparations. More recently, Klug and coworkers concluded from the study of a whole range of PSII containing preparations possessing different antenna sizes that the charge separation is indeed trap-limited (4). However, from singlet-singlet annihilation studies on LHCII trimers and aggregates it was concluded that the excitation diffusion within the outer antenna is relatively slow (5) and that charge separation in LHCII-containing

EET and CS in PSII
18
PSII systems cannot be entirely trap-limited (6,7). Also Jennings and coworkers came to the same conclusion (8).
At the moment a large number of experimental data is available on the charge-separation kinetics of isolated PSII RC’s and PSII core complexes (9,10). In PSII RC and CP47-RC preparations (which contain 6 and 22 chlorophylls, respectively, and 2 pheophytins, but do not contain the secondary electron acceptor QA) the kinetics were strongly multi-exponential. They could be explained by three reversible radical pair states, of which the first is nearly isoenergetic with the singlet-excited state of the primary electron donor (P680*), in combination with the absence of severe kinetic limitation for the excitation energy transfer between CP47 and the RC (11). PSII core complexes (with 35 chlorophylls and 2 pheophytins) do contain QA, and in open centers (with QA oxidized) the decay kinetics are dominated by a major phase in the 30-60 ps time range and a minor phase of about 200 ps (12-14). The energy difference between the first radical pair state and P680* is probably much larger than in PSII RC and CP47-RC preparations (14).
It is unknown to which extent these systems give kinetics compatible with more native-like systems like chloroplasts, thylakoid membranes and PSII membranes (the so-called BBY preparations). Most studies on entire chloroplasts or thylakoid membranes suggested average values for the trapping time in PSII in the range from ~300 to ~500 ps (15-17). However, fast PSI fluorescence may partly mask faster PSII decay processes for these preparations. Moreover, unconnected light-harvesting complexes may be present in the stroma lamellae, which can further complicate the identification of the PSII fluorescence (18).
PSII grana membranes (BBY preparations) do not contain PSI or stroma lamellae, but do contain a much larger antenna than PSII core particles. Due to the presence of trimeric and monomeric Chl a/b containing complexes, these membranes contain about 150 Chls a per PSII, about 4 times more than isolated PSII core particles (19). The kinetics in these membranes were described by a single lifetime of about 210 ps (20) or with a major lifetime of 140 ps and a minor lifetime of 330 ps (12). A number of other studies revealed slower kinetics, which can be

Chapter 2
19
explained by a ‘contamination’ of closed centers (with QA single or double reduced).
In this paper we present new time-resolved fluorescence data on BBY preparations and propose a coarse-grained model in which previously reported antenna and RC kinetics can easily be incorporated, allowing a comparison with the obtained fluorescence kinetics of PSII in grana membranes. To this end we make use of available knowledge about the supramolecular organization of PSII (19). The results reveal a number of essential differences in primary charge separation in isolated RC’s, PSII cores and PSII membranes, and stress that diffusion of the excitation energy in the membranes contributes significantly to the overall charge separation kinetics. The presented framework will facilitate new studies that are directed at the contributions of individual complexes to the overall kinetics by using mutant preparations with altered PSII composition or organization.
Materials and Methods
Sample Preparation
PSII membranes (BBY particles) were prepared according to Berthold et al. (21) from fresh spinach leaves. An analysis by diode-array-assisted gel filtration chromatography, performed as described previously (22), showed that the preparations contained at most 1-2% of PSI.
Time-Correlated Single Photon Counting
Steady-state fluorescence spectra were measured with a Fluorolog-3.22 (SPEX Industries, USA) at room temperature. Time-correlated single photon counting (TCSPC) measurements were performed at magic angle (54.7o) polarization as described previously (23). The BBY particles where diluted to an OD of 0.08 per cm in a buffer of 20 mM Hepes pH 7.5 , 15 mM NaCl and 5 mM MgCl2. The repetition rate of excitation pulses was 3.8 MHz and the excitation wavelength was

EET and CS in PSII
20
430 nm. Pulse energies of sub-pJ were used with pulse duration of 0.2 ps and spot diameter of 1 mm. The samples were placed in a 3.5 mL and 10 mm light path fused silica cuvet and stirred in a temperature controlled (20 oC) sample holder. In combination with the low intensities of excitation this guaranteed that close to 100% of the reaction centers stayed open (see also results) and significant build-up of triplet states was avoided. The full-width at half maximum (fwhm) of the system response function was 60 ps with a resolution of 2.51 ps per channel. The dynamic instrumental response function of the setup was obtained from pinacyanol in methanol with a lifetime of 10 ps. The following interference filters were used for detection: 671, 679, 688, 693, 701, 707, 713, and 724 nm (Balzers, Liechtenstein model B40). Data analysis was performed using a home built computer program (24,25). A fast component (~5 ps) was needed in most cases to fit the time range around the rising edge of the excitation pulse but this component is not relevant for this study and is omitted in the further modelling.
Synchroscan Streak Camera
For the streak-camera measurements the BBY particles were diluted to an OD of 0.7 per cm in a buffer of 20 mM BisTris pH 6.5 and 5 mM MgCl2. Ferricyanide (1 mM) was added to keep the reaction centers open. 400 nm excitation pulses of ~100 fs were generated using a Ti:sapphire laser (VITESSE, Coherent St. Clara, CA) with a regenerative amplifier (REGA, Coherent). The repetition rate was 150 kHz, and the pulse energy was 1 nJ. The excitation light was focused with a 15 cm focal length lens, resulting in a focal diameter of 150 µm in the sample. To refresh the sample between the excitation pulses, the sample was placed into a 2 mm thick spinning cell of 10 cm diameter, rotating at a speed of 20 Hz. The fluorescence was detected in a direction at 90º from the excitation beam through a detection polarizer at magic angle, an orange sharp cut-off filter glass, a Chromex 250IS spectrograph and a Hamamatsu C 5680 synchroscan streak camera. The streak images were recorded with a cooled, Hamamatsu C4880 CCD camera. The FWHM of the overall time response of the experiment was 5 ps. Global analysis was applied, using a model with a number of parallel decaying compartments, which yields decay associated spectra (DAS) (26).

Chapter 2
21
Results and Discussion
Time-Resolved Fluorescence Measurements
In Fig. 1 a typical TCSPC decay curve for PSII grana membranes with open RC and Chl a excitation (430 nm) is shown. To obtain a good multi-exponential fit, at least 4 decay times are needed. The contribution of a 2.9 ns component is very small (less than 0.5%) and is probably due to very small amounts of PSII with closed RC’s, free Chl and/or detached pigment-protein complexes. Most of the decay can be described by two major components and a minor one: 77 ps (41%), 206 ps (56%) and 540 ps (3%). The excitation intensity was low enough to avoid excitation annihilation (singlet-singlet or singlet-triplet) or accumulation of closed RC’s. Increasing the excitation intensity with a factor of 10 led to identical decay kinetics, whereas an increase with a factor of 1000 led to substantially longer decay times because of the closure of RC’s (data not shown).
Decay curves were measured at different detection wavelengths and the decay times were very similar in all cases. The result of a global analysis of all decay curves is given in Fig. 2, showing decay-associated spectra (DAS). At all detection wavelengths the two longest decay times are nearly absent. The fitted decay times are 80 ps and 212 ps for the two major components. The contribution from a 633 ps component is small and the 2.9 ns component has negligible amplitude. The DAS are dominated by a main fluorescence band peaking between 680 and 690 nm and show small vibronic bands above 700 nm. The average lifetime of 150 ps is significantly shorter than previously estimated values for chloroplasts and thylakoid membranes (300 to 500 ps), but it is closer to the values obtained for BBY by Schilstra et al. (20) and Van Mieghem et al. (12). To determine whether processes are present that are faster than the time resolution of the photon counting setup, the experiments were also performed with a streak-camera with 3 ps time resolution. The results are shown in Fig. 3. The data are rather similar; the decay is dominated by two components with lifetimes 81 ps (60%) and 258 ps (40%).

EET and CS in PSII
22
Figure 1. Room temperature fluorescence decay curve (measured with TCSPC) for open BBY preparations together with a fit. The sample was excited at 430 nm and fluorescence was detected at 693 nm. The decay times and their relative amplitude are 77 ps (41%), 206 ps (56%) and 540 ps (3%). Also shown are the residuals (difference between data and fit)
No short-lived component was resolved. Note that the times are similar but not identical to those obtained with the TCSPC measurements. This is mainly due to some variability in the samples. However, this variability is irrelevant for the main conclusions drawn in this paper and leave some uncertainty in the presented parameters. Note that the difference in excitation wavelength can also cause some variability but it is less outspoken (work in progress).

Chapter 2
23
Figure 2. Decay associated fluorescence spectra (measured with TCSPC) of BBY preparations at room temperature. The sample was excited at 430 nm.
Figure 3. Decay associated fluorescence spectra (measured with streak-camera) of BBY preparations at room temperature. The sample was excited at 400 nm.
0
2
4
6
8
10
12
640 660 680 700 720 740 760 780Wavelength, nm
Am
plitu
de,
rel.
u.
83 ps259 ps

EET and CS in PSII
24
Modelling of the fluorescence kinetics
The overall average charge separation time τ can be considered as the sum of two times, the first passage time or migration time τmig, representing the average time that it takes for an excitation created somewhere in PSII to reach the RC (primary donor), and the trapping time τtrap (7) (27), page 23-27. The trapping time is the product of the intrinsic charge separation time τιCS (when the excitation is located on the primary donor) and the probability that the excitation is located on the primary donor after Boltzmann equilibration of the excitation over PSII. In a system with N isoenergetic pigments this would mean that τtrap = N τιCS. Note that τmig can be split into an equilibration time in the antenna and a transfer-to-the-trap time (7) (27), page 23-27(7) (27), page 23-27.. but this approach is not needed here.
First we introduce a simple basic model to describe the overall CS kinetics in PSII in terms of the CS kinetics in the RC and EET in the antenna complexes. Thereafter, we show how the results are affected when the model is extended. In Fig. 4 we show the dimeric supercomplex of PSII (28) that is used for our coarse-grained modelling. It is a basic unit that can be further associated in different ways to form larger organization patterns (19,29). Besides two RC’s it contains 2 CP47, 2 CP43, 2 CP24, 2 CP26, 2 CP29 monomers and 4 LHCII trimers. We define a hopping rate kh for transfer between all neighbouring monomeric complexes and/or subunits that are connected via a bar in Fig 4. It is worth mentioning that also EET between monomeric LHCII subunits in the trimer is modelled in this way. The reason that we take the same hopping rate in all cases is the fact that all outer antenna complexes are rather homologous and that energy transfer is largely determined by the transfer within the complexes (see also below). The situation may be different for hopping from CP43 or CP47 to the RC and this case will be discussed separately. Forward and backward rates between complexes have been adjusted by rescaling the single hopping rate in accordance with the differences in the Chl a numbers (see Appendix for the details and figure 4 for the number of Chl a molecules). The outer antenna complexes all transfer their excitations to the RC via CP47 or CP43. Excitations can leave the RC again into the antenna.

Chapter 2
25
Figure 4. Membrane organization of PSII that is used for our coarse-grained modelling. Besides two RC’s (D1/D2) (2 Phe a and 6 Chl a per RC) this dimeric supercomplex contains 1 CP47 (16 Chl a), 1 CP43 (13 Chl a), 1 CP24 ( 5 Chl a and 5 Chl b), 1 CP26 (6 Chl a and 3 Chl b), 1 CP29 (6 Chl a and 2 Chl b) monomer and 2 LHCII ( 8 Chl a and 6 Chl b per LHCII) trimers per RC. LHCII trimers are represented by 4-5-6, 7-8-9, 16-17-18, 19-20-21. Also indicated are added putative energy transfer links (short thick bars) between the light-harvesting pigment-protein complexes.
It should be noted that we also examined the effect of increasing the number of (connected) supercomplexes, based on the various models for megacomplexes (dimeric supercomplexes) that have been detected thus far (19). However, no essential differences were observed. Therefore it is sufficient to consider the basic unit with only two RC’s. All complexes are taken to be isoenergetic (30).
At first we assume that irreversible charge separation takes place in the RC, which in our definition consists of the 6 central chlorins in the RC, with a rate kCS. Note that this is different from the intrinsic CS rate kiCS. The 2 peripheral Chls in the RC are assumed to be part of the antenna system and one of them is assigned to CP47 and the other to CP43. This is justified because the distance of these peripheral

EET and CS in PSII
26
chlorophylls to the nearest chlorophylls in CP47 or CP43 is shorter than to the nearest central chlorin in the RC (31). In the simplest (but non-realistic) case of 6 isoenergetic central chlorins in the RC with primary CS occurring from one pigment, kiCS would be equal to 6 kCS.
Fig. 4 shows 2 LHCII trimers per RC but it is known that on average 4 LHCII trimers are present per RC (7). The other two trimers can be in a different membrane layer organized in such a way that they can still transfer the excitation energy to the RC’s (29), but they can also be located close to a PSII-LHCII supercomplex in the same layer, in particular in membranes without ordered arrays of PSII. Because it is unknown how the extra 2 LHCII’s are connected to the RC it is only possible to guess their contribution to the overall trapping time. We consider two extreme cases. If these four LHCII trimers per PSII would be in the same membrane layer as the RC, the overall τmig would become close to 160 ps, as was concluded from singlet-singlet annihilation (5). The only assumption in that case is that the connectivity between the additional light-harvesting complexes and the others is the same as between the ones that were already present. The important point is that the migration time increases. The value of 160 ps is approximately equal to the observed average lifetime for BBY preparations, which would imply that the charge separation is nearly diffusion limited. Although we cannot rule out this possibility, it seems highly unlikely. We will return to this point later.
As another extreme case we assume that a regular 2-dimensional lattice with 100 sites (the approximate number of Chl a per RC in the supercomplex shown in Fig. 4) is extended to a regular 3-dimensional lattice with 148 sites (2 extra trimers) with the same hopping rates. This reduces τmig with approximately 10% (Ref. (27), page 406). The same hopping rates may not be realistic, but energy transfer between membranes in a grana stack will very likely occur within the excited state lifetime (32,33). On the other hand τtrap increases with 48% because the equilibrium distribution of excited states is shifted further towards the antenna. For the purpose of this paper it is not necessary to discuss explicitly all the different possible organizations. They will be discussed implicitly by considering different combinations of the hopping rates and charge-separation rates.

Chapter 2
27
The overall fluorescence decay (reflecting decay of excited-state population) can now be calculated for the model system in Fig. 4 for any initial excitation distribution (see Appendix). It can be compared to the fluorescence kinetics of PSII membranes with open centers (Figs. 1-3). In other words we reconstruct the experimental decay by including only the dominating components and the minor component of 633 ps (Fig. 2). We assume an initial distribution between the various complexes which is proportional to the number of Chls a per complex. Fig. 5 shows the reconstructed decay and the best fit of the above model over the time range 0-700 ps for the TCSPC data. This simple model provides a good description of the kinetics. The fitted hopping rate is (17 ps)-1 and the charge separation rate is (1.2 ps)-1. It should be noted that the experimentally observed non-exponentiality in this case is not modelled because it is explicitly assumed that charge separation is irreversible. We will show the effect of including charge recombination below. In this way non-exponentiality is introduced. However, it is also possible that the non-exponentiality is due to some structural heterogeneity and in this case one might expect to obtain a distribution of trapping time and the fitted value should be considered to be an average trapping time.
Before we discuss more realistic models and the uniqueness of the fit, it is worthwhile to look at the consequences of these rates. The hopping rate (17 ps)-1 is rather slow and corresponds to a value of τmig of 130 ps (see Appendix for method of calculation). The charge-separation rate kCS of (1.2 ps)-1 is the effective rate for the whole RC, i.e. the central 6 chlorins. If primary CS occurs from one specific Chl, then kiCS = (1.2 ps)-1 / 6 = (0.2 ps)-1 in the case of isoenergetic pigments. This would mean that τtrap = τιCS x N = 0.2 ps x 100 = 20 ps if an organization as in Fig. 4 is considered, or τtrap = 0.2 ps x 150 = 30 ps if the Chl a content in PSII membranes is considered. Clearly, in this case the overall trapping time is dominated by the migration time. The streak-camera data were modelled in the same way and led to kh = (17.5 ps)-1 and kCS = (0.4 ps)-1. The observed differences in the fluorescence lifetime can easily be explained by some variability in the preparations. At this point it is not useful to discuss the differences in fitting results because the fitting outcome is not unique (see below).

EET and CS in PSII
28
Figure 5. Reconstructed BBY fluorescence decay (dots) using the three main decay components (80, 212 and 639 ps) and the best fit (line) assuming irreversible charge separation (see text) over the time range 0-700 ps. The fitted hopping rate is (17 ps)-1 and the charge separation rate is (1.2 ps)-1.
The given rates do not uniquely describe the data within the context of the above model. In Fig. 6 we show different combinations of kh and kCS that lead to a reasonable description of the TCSPC data. The results were obtained as follows: We chose a particular value for τh (= kh
-1) and looked for the best fit of τCS (= kCS-1).
Varying for instance τh from 10 to 20 ps leads to fits for which the quality is rather similar (see Fig. 6), τmig varies from 77 to 150 ps whereas the charge separation time varies from 4.3 to 0 ps. A slower migration towards the RC requires a faster charge separation in order to obtain the same experimentally observed decay rates. It is clear that different combinations of hopping and charge separation times can explain the observed kinetics. Given the approximate nature of the modelling, no strong conclusions can be drawn from the differences between the simulated and the experimental curves.

Chapter 2
29
Figure 6. Different combinations (circles) of kh and kCS that lead to the best description of the BBY decay kinetics, assuming irreversible charge separation (see text). The numbers were obtained as follows: We chose a particular value for τh (= kh
-1) and looked for the best fit of τCS (= kCS-1). Indicated are also the difference
between the model and the experimental BBY curve defined as sum of least squares of the deviates (diamonds). The squares indicate the fraction of the trapping time that is due to migration at a particular value for the hopping time. The arrows indicate which vertical axis corresponds to which curve.
Modulating Excitation Energy Transfer from CP47 or CP43 to the RC
In the above model we assumed that CP47 can transfer energy to two different RC’s (see Fig. 4). It is not entirely clear from the crystal structure whether this really is the case. Therefore, we also considered the case that CP47 can transfer to only one RC. Then a hopping time of 15.2 ps is obtained for the best fit and a charge separation time of 0.23 ps. Because there are less routes for reaching the RC, one needs to speed up the transfer and charge separation process in order to arrive at a good fit. The migration time is 147 ps, i.e. the contribution from the

EET and CS in PSII
30
migration time remains dominant. This illustrates the fact that the outer antenna determines to a large extent the total migration time. However, in this case the charge separation becomes unrealistically fast and in the following we consider the situation that CP47 is connected to two RC’s.
Although it has been argued that energy transfer from CP47 or CP43 to the RC is relatively slow (7,34), we also consider a rather extreme case in which this transfer time is 3 times shorter than the general hopping time. This would be in agreement with measurements on RC and CP47-RC preparations, which indicated that the energy transfer between CP47 and RC is not rate-limiting (11) and that the connecting chlorophylls of CP47 and CP43 are optimally oriented for fast energy transfer (35). The best fit now requires a value of τh of 24.8 ps and τmig is 100 ps, meaning that the migration time is still dominant.
Reversible Charge Separation
Above we made the assumption that the charge separation is irreversible. Although it leads to a satisfactory description of the data, it contrasts with the general opinion that substantial charge recombination occurs. Therefore, we extended our model by including recombination and a second charge-separated state. It is not required for the fitting to specify the nature of such a second charge-separated state but it might for instance be the reduced QA in combination with the oxidized primary donor. The electron back-transfer rate (kbCS) to the primary donor is related to the intrinsic charge-separation rate from this primary donor via the detailed balanced relation kbCS / kiCS = e-∆G/kT where ∆G is the drop in free energy upon primary charge separation, k is the Boltzmann constant and T is the absolute temperature. The rate and time constant of secondary charge separation are called kRP and τRP, respectively. The data can now be fitted in different ways, depending on the starting values of the different fitting parameters. Two fits are shown in Fig. 7. The dashed line corresponds to a slow hopping time (17 ps). In this case the times for primary and secondary charge separation are 1.24 and 13.3 ps, respectively and ∆G = 2380 cm-1. The solid line is a fit with an extremely fast hopping time (1.3 ps). The times for primary and secondary charge separation are 6.6 and 168 ps, respectively and ∆G = 890 cm-1. The crucial point is that although the rates of

Chapter 2
31
hopping and secondary charge separation cannot be separately estimated from these fits, fast primary charge separation in combination with a large drop in free energy is needed to describe the data.
Figure 7. The BBY kinetics (dots) are fitted with reversible charge separation into a primary charge separated state and subsequent irreversible charge separation into a secondary charge separated state. The solid line is a fit with a slow hopping time (17 ps). In this case the times for primary and secondary charge separation are 1.24 and 13.3 ps, respectively and ∆G = 2380 cm-1. The dashed line is a fit with an extremely fast hopping time (1.3 ps). The times for primary and secondary charge separation are now 6.6 and 168 ps, respectively and ∆G = 890 cm-1.
Comparison with charge separation in isolated reaction centres and core complexes
We make a comparison with models for charge separation that have been presented in literature based on measurements on isolated PSII RC and core complexes. We

EET and CS in PSII
32
inspect what happens to the calculated trapping kinetics for BBY particles when charge separation in the PSII RC is described according to these models. We restrict ourselves to the most recent ones that can be directly incorporated into the above framework.
Figure 8. Models for charge separation in the PSII RC taken from literature. These models are based on measurements on isolated RC’s, Fig. 8a model 1 (11) and Fig. 8b model 2 (43) and on measurements on PSII cores, Fig. 8c model 3 (13) and Fig. 8d model 4 (39).
The model of (open) PSII core complexes from Vassiliev et al. (13) is given in Fig. 8 (model 3). It is characterized by many fast electron transfer steps, the first one being the intrinsic charge separation rate from the presumed lowest exciton state of the “special pair” or two accessory chlorophylls. This model is incorporated in our initial description above, i.e. instead of a unidirectional charge separation step in the RC with τCS = 1.2 ps we use the charge separation scheme from Fig. 8c. The first step in the latter scheme is slowed down by a factor of 6/4 because CS can

Chapter 2
33
take place from 4 out of 6 chlorophylls. The results are given in Fig. 9b (thick, solid line). The hopping time is taken to be 17 ps, i.e. the time that we found in the best fit of the first model. The simulated kinetics show a slightly faster initial decay and a larger contribution from a slow decay component when compared to the experimentally observed decay for BBY preparations. We inspected how we could bring the model into accordance with the BBY data by keeping everything the same except the first rate of charge separation and the corresponding change in free energy. It was possible to obtain a very good fit (not shown) by changing τCS from 0.15 ps into 0.75 ps and ∆G from -464 cm-1 into -826 cm-1 respectively, with a hopping time of 17 ps. The charge separation is slowed down in order to match the initial part of the decay curve and the drop in free energy is increasing, making the charge separation less reversible, leading to smaller contributions from slow components. It is exactly this lack of slow component in the BBY data that requires a large drop in free energy upon fast charge separation. The presence of two additional trimers per RC will shift the equilibrium further towards the excited states, leading to even more fluorescence at longer times in the modelled curve, i.e. to a greater discrepancy.
Alternatively, we tried to fit their PSII core model to the BBY data by optimizing the hopping rate. The result can also be seen in Fig. 9b (thick, dashed line) and the fitted hopping time in this case is 13.4 ps. The fit is better than in the first case above, but the decay remains too fast at early times and the contribution of the slow component is too large. So independent of the details of the model, the large drop in free energy upon initial charge separation appears to be essential to describe the BBY data. It is unclear whether the core preparations contain a fraction of complexes in which the lifetimes are too long, or whether the drop in free energy in (cyanobacterial) core particles is indeed less pronounced than in BBY particles. The latter possibility could arise from a different ligation of the pheophytin that serves as electron acceptor. The residue that is involved in a H-bond with pheophytin is a Gln in cyanobacteria and a Glu in higher plant PSII, which can give rise to a shift of the redox potential of the pheophytin by about 30 meV (36-38). It should be noted that the presence of two additional trimers per RC will shift the equilibrium further towards the excited states, leading to even more fluorescence at longer times in the modelled curve, i.e. to a greater discrepancy.

EET and CS in PSII
34
Figure 9a. Solid circles represent reconstructed experimental fluorescence kinetics (TCSPC) of BBY (see text for details). Solid and dashed line represent simulated decay curves, using the 2 RC models of figures 8a and 8b. Electron transfer to the quinone is implemented by assuming irreversible transfer from RP2 with a rate constant of (200 ps)-1. The thick lines (1) refer to model 8a, the thin ones (2) to model 8b. For the solid lines a hopping time of 17 ps is taken and an infinitely fast hopping time for the dashed ones.
Figure 9b. Solid circles represent reconstructed experimental fluorescence kinetics (TCSPC) of BBY (see text for details). Solid and dashed line represent simulated

Chapter 2
35
decay curves, using the 2 core models of figures 8c and 8d. The thick lines (3) refer to model 8c, the thin ones (4) to model 8d. For the solid lines a hopping time of 17 ps is taken. For the dashed lines a hopping time of 13.4 ps is taken for case 3 (thick dashed) and 0 ps for case 4 (thin dashed).
Very recently, new data on isolated cores were obtained and a different model was proposed by Miloslavina et al.(39). The model assumes ultrafast energy transfer from CP47 and CP43 to the RC, and the authors conclude that the kinetics are trap-limited in these complexes and that charge separation can be described by a scheme that includes reversible charge separation to several radical pair states (Fig. 8d). When we incorporate this scheme for charge separation into our model (hopping time 17 ps) the resulting kinetics are far too slow (Fig. 9b, thin, solid line). Even when we assume the excitation energy transfer throughout the antenna to be infinitely fast, the resulting kinetics are still too slow (Fig. 9b, thin, dashed line). To improve the fit, like before, a larger drop in free energy is needed (648 cm-1 instead of 294 cm-1) and the charge separation time should decrease: 2.1 ps instead of 5.9 ps. It should be noted that the scheme of Miloslavina et al.(39) does not include the fitting of a 111 ps component (amplitude 10%) that was observed in their experiments. Incorporating this component in the model would further increase the discrepancy.
Other models have been proposed that were based on the measurements on isolated PSII RC complexes. Two recent ones are represented in Figs. 8a and 8b. They cannot directly be compared directly to the BBY results because the isolated RC’s do not contain the electron acceptor QA. Therefore, we tested the hypothesis that the initial charge separation kinetics/energetics in isolated RC’s are the same as in the open BBY’s. We used the models as presented in 8a and 8b up to state RP2, whereas electron transfer to QA was modelled by an irreversible decay of state RP2 with rate constant (200 ps)-1. With a hopping time of 17 ps the modelled kinetics are far too slow for both models (Fig. 9a, solid lines). Even when the hopping is assumed to be infinitely fast, the simulated kinetics are still much slower. Again, the agreement between the BBY data and the RC model can only be improved by using a fast charge separation in combination with a large drop in free energy. However, a fast charge separation and a large drop in free energy are not in

EET and CS in PSII
36
agreement with the measured fluorescence kinetics of isolated PSII RC complexes. Note that the inclusion of back transfer of an electron from the QA would only increase the discrepancy.
One might compare the RC in isolated PSII RC’s (without QA) with closed RC’s in QA-containing PSII preparations. It was already observed many years ago (40) that closed RC’s show considerably slower fluorescence kinetics than open RC’s, which could be modelled by a 6-fold slower rate constant for charge separation and a 400 cm-1 higher energy of the primary radical pair (3). The slowing down of the primary charge separation reaction was explained by electrostatic repulsion due to the negative charge on QA, but other authors suggested that the charge on QA has a minor effect on the energy level of the primary radical pair (4,14). The relative importance of electrostatic repulsion for slowing down charge separation was demonstrated by Van Mieghem et al. (12), who found a considerable difference in charge separation kinetics between centers with singly and doubly reduced QA in PSII membranes (where the fluorescence kinetics and integrated emission yield in centers with doubly reduced QA was just in between those with oxidized and singly reduced QA) but not in PSII core particles. In conclusion, the RC in isolated PSII RC’s has indeed a closer resemblance to closed RC’s in QA-containing PSII complexes, already at the level of primary charge separation, despite the absence of a reduced QA.
Contribution of the Migration Time to the Overall T rapping Time
It was recently suggested that the overall charge separation process cannot be entirely trap-limited in grana membranes (41). From singlet-singlet annihilation studies (5) on LHCII trimers and aggregates it was apparent that the spatial equilibration time per trimer is several tens of ps. A value of 48 ps was determined for trimers whereas this number was approximately 32 ps per trimer in lamellar LHCII aggregates. It was argued (6) that the latter time might be faster because excitations have the tendency to be located at the outside of the trimer, thereby facilitating energy transfer and thus annihilation in aggregates. The fact that the annihilation in trimers is slower than in aggregates indicates that it is not limited by
Chapter 2
37
hopping between different complexes but by relatively slow transfer within the complexes, in agreement with pump-probe and photon-echo data (6,42).
Therefore, the contribution of the time of transfer in or between LHCII trimers to the overall migration is approximately equal to the number of trimers per RC multiplied by the equilibration time per trimer, provided that they are in “intimate contact” within one plane. The supercomplex in Fig. 4 contains 2 LHCII trimers per RC which contribute each ~32 ps to the τmig (5). Moreover, CP24, CP26, and CP29 each show high homology to an LHCII monomer, and together they add another ~32 ps. For CP47 and CP43 these numbers are less well known, but they are probably faster. The overall migration time would thus be around 100 ps, which constitutes a large fraction of the overall trapping time. This number would even be larger when the 2 “missing trimers” are located in the same plane, but if they would be in a different layer this value might be slightly smaller (see above). In the simulations that we showed above it was found that a hopping time of 17 ps leads to a total migration time of 130 ps. To arrive at a migration time of 100 ps, the hopping time has to be decreased proportionally, i.e. from 17 ps to (100/130)x 17 ps = 13 ps. At the moment it is uncertain to what extent the excitation migration times determined for isolated LHCII trimers and lamellar aggregates are directly applicable to the BBY preparations. The organization of the complexes will have some influence, although it was argued above that migration is to a large extent determined by migration within the individual complexes. Also the details of the annihilation process from which the migration times were determined have some influence. This issue will be addressed in a future study.
Of course, the proposed modelling procedure for BBY is approximate. However, it provides an easy way to incorporate existing knowledge and models for individual complexes and despite remaining uncertainties it is demonstrated that valuable conclusions can be drawn about both the excitation energy transfer and the charge separation. The exact contribution of excitation diffusion (migration time) to the overall charge separation remains somewhat uncertain, which results in uncertainty in τCS. However, the relation and consequences are transparent and can easily be extracted. It is also clear that charge separation should be rather fast and is accompanied with a large drop in free energy. This contrasts with existing models

EET and CS in PSII
38
for primary charge separation in isolated PSII RC’s without quinone and in PSII RC’s with quinone as present in core preparations.
Possible future experiments include preferential excitation of different pigments to study the effect on the overall kinetics. Mutants are available that are lacking specific pigment-protein complexes and the kinetics can be measured and modelled. Moreover, the effect on the fluorescence kinetics by introducing quenchers in different positions can be predicted and tested in case of the occurrence of nonphotochemical quenching. As such, the proposed method offers a way to study PSII performance as a whole in a directed way, which hopefully contributes to a gradual improvement of the knowledge about PSII functioning.
Acknowledgements
This work is part of the research programme of the ‘Stichting voor Fundamenteel Onderzoek der Materie (FOM)’, which is financially supported by the ‘Nederlandse Organisatie voor Wetenschappelijk Onderzoek (NWO)’. K.B and C.D.W.W. were both supported by FOM. J.P.D. acknowledges support from the European Union (Grant MRTN-CT-2003-505069, Intro2). GT acknowledges support (visitor grant) from the ‘Nederlandse Organisatie voor Wetenschappelijk Onderzoek (NWO)’. The authors thank Henny van Roon for help with the biochemical analysis of the samples. The authors thank Dr. Roberta Croce for critically reading the manuscript.

Chapter 2
39
Appendix
In this appendix it is demonstrated how the excited-state population is calculated as a function of the time after excitation. This population kinetics is compared to the fluorescence kinetics in the text. A so-called coarse–grained model is used in which energy transfer between individual pigments in an antenna or RC complex is not considered but only an effective hopping rate between different pigment-protein complexes. Such a hopping rate thus represents both energy transfer within and between complexes. The complexes form a superlattice of “supersites” (individual complexes) as represented in figure 4 for which we consider a random walk of excitations.
The time course of the excitation population follows the Pauli master equation:
)(ˆ)( tt PTP =& , (A1)
where the )(tP stands for the vector of supersite occupancies at time t. The dot above it represents the time derivative. The transfer matrix ijTˆ ≡T is related to the adjacency matrix via AT ˆˆ 1−−= hτ . The nonzero elements of the matrix A conform to the energy transfer steps depicted by bars in figure 4 and are defined as follows:
=+++
≠<−
≥−
=
∑≠ )(
12,0, ,)(A
,,
,1
A
ik diss
hii
CS
hki
jij
i
ji
ij
ji
jinnn
nnn
ττδδ
ττ
, (A2)
where in is the number of chlorophyll a molecules in complex i and dissτ is the time of excited-state decay in a complex in the absence of intercomplex energy transfer. This time is typically a few ns (44) and it is neglected in the simulations because it is much longer than the fluorescence decay time under consideration. Differences in numbers of molecules per complex introduce a retardation effect for the energy transfer step from the larger ( jn ) complex to

EET and CS in PSII
40
the smaller one (in ). It can be simply assimilated into the activation term by a change in entropy
)/ln( ijBij nnkS −=∆ , (A3)
for the presumably isoenergetic complexes (8) resulting in rescaling of the hopping rate as given in eqn (A2). The solution of equation (A1) can be presented in the following matrix form:
)0(ˆˆ)( 1ˆPCCP Λ −= tet ,
(A4)
where C is a matrix of eigenvectors, Λ is a diagonal matrix { }ttt eee 2310 ,...,, λλλ of eigenvalues of the transfer matrix T and vector
)0(P stands for the initial population of the supersites. The mean lifetime of the excited system >< τ can then be expressed as
)0(ˆˆˆ 11 PCΛC −−−>=< τ (A5)
where { }123
11
10
1 ,...,,ˆ −−−− = λλλΛ is a diagonal matrix with the inverse eigenvalues on the diagonal.
This model contains just two free parameters to be determined: hτ - hopping time (we assume that all the intercomplex transfer rates are similar) and CSτ - charge separation time in the reaction center (sites #0 and #12 in Figure 4). The intrinsic charge separation time iCSτ from a single Chl molecule is N times shorter (if the pigments are isoenergetic) where N is number of chromophores in the RC. From the hopping time one can calculate the first passage time or migration timemigτ to the RC by assuming an infinitesimal charge separation time:

Chapter 2
41
>==< )0( CSmig τττ . (A6)
This provides the splitting of the mean lifetime into the migration and trapping components via
trapmig τττ +>=< (A7)
and it is useful in estimating the dominant process in the trapping process.
To simulate the reversible charge separation in the RCs the transfer matrix T in the Pauli equation (A1) is augmented as follows
→1212
00
120
R0'T
0R'T
TTT
Τ
ˆˆˆ
ˆˆˆ
ˆˆˆ
ˆ . (A8)
Symmetric matrices 0R and ˆ 12R describe the reversible radical pair relaxation in the RCs (labeled with 0 and 12) corresponding to the kinetic RC models presented in Figure 8 .0 stands for matrices with zero elements. The dimensions of these matrices are determined by the number of the radical pair states taken into account. Rectangular matrixes ˆ 0T , ˆ 12T , ˆ 0T' and ˆ 12T' containing just one nonzero matrix element per matrix couple the excited
primary electron donor to the first radical pair RP1:
12
0
12
0
1,0,1
,12
1,0,1
,0
1,12,1
,12
1,0,1
,0
)exp(T'
)exp(T'
T
T
RPqpCSqp
RPqpCSqp
RPqpCSqp
RPqpCSqp
kT
GkT
G
δδτ
δδτ
δδτδδτ
∆−≡
∆−≡
≡≡
−
−
−
−
. (A9)
Here G∆ stands for the drop in free energy upon primary charge separation.
EET and CS in PSII
42
References
1. Pascal, A.A., Z. Liu, K. Broess, B. van Oort, H. van Amerongen, C. Wang, P. Horton, B. Robert, W. Chang, and A. Ruban. 2005. Molecular basis of photoprotection and control of photosynthetic light-harvesting. Nature 436:134-137.
2. van Grondelle, R. 1985. Excitation-energy transfer, trapping and annihilation in photosynthetic systems. Biochim. Biophys. Acta 811:147-195.
3. Schatz, G.H., H. Brock, and A.R. Holzwarth. 1988. Kinetic and energetic model for the primary processes in photosystem II. Biophys. J 54:397-195.
4. Barter, L.M.C., M. Bianchetti, C. Jeans, M.J. Schilstra, B. Hankamer, B.A. Dinner, J. Barber, and J.R. Durrant. 2001. Relationship between excitation energy transfer, trapping, and antenna size in photosystem II. Biochemistry 40:4026-4034.
5. Barzda, V., V. Gulbinas, R. Kananavicius, V. Cervinskas, H. Van Amerongen, R. Van Grondelle, and L. Valkunas. 2001. Singlet-singlet annihilation kinetics in aggregates and trimers of LHCII. Biophys. J. 80:2409-2421.
6. van Amerongen, H., and R. van Grondelle. 2001. Understanding the energy transfer function of LHCII, the major light-harvesting complex of green plants. J. Phys. Chem. B 105:604-617.
7. van Amerongen, H., and J.P. Dekker. 2003. Light-Harvesting in Photosystem II. In Light-Harvesting Antennas in Photosynthesis. Green BR, Parson WW, editors. Kluwer Academic Publishers. 219-251.
8. Jennings, R., G. Elli, F.M. Garlaschi, S. Santabarnara, and G. Zucchelli. 2000. Selective quenching of the fluorescence of core chlorophyll-protein complexes by photochemistry indicates that Photosystem II is partly diffusion limited. Photosynth. Res 66:225-233.
9. Dekker, J.P., and R. van Grondelle. 2000. Primary charge separation in photosystem II. Photosynth. Res 63:195-208.

Chapter 2
43
10. Dinner, B.A., and F. Rappaport. 2002. Structure, dynamics, and energetics of the primary photochemistry of photosystem II of oxygenic photosynthesis. Ann. Rev. Plant Biol 53:551-560.
11. Andrizhiyevskaya, E.G., D. Frolov, R. van Grondelle, and J.P. Dekker. 2004. On the role of the CP47 core antenna in the energy transfer and trapping dynamics of photosystem II. Phys. Chem. Chem. Phys 6:4810-4819.
12. van Mieghem, F.J.E., G.F.W. Searle, A.W. Rutherford, and T.J. Schaafsma. 1992. The influence of the double reduction of QA on the fluorescence decay kinetics of photosystem II. Biochim. Biophys. Acta 1100:98-206.
13. Vassiliev, S., C.-I. Lee, G.W. Brudvig, and D. Bruce. 2002. Structure-based kinetic modelling of excited-state transfer and trapping in histidine-tagged PSII core complexes from Synechocystis. Biochemistry 41:12236-12243.
14. Andrizhiyevskaya, E.G. 2005. Energy transfer and trapping in photosynthetic complexes with variable size. Vrije Universiteit Amsterdam.
15. Roelofs, T.A., C.-I. Lee, and A.R. Holzwarth. 1992. Global target analysis of picosecond chlorophyll fluorescence kinetics from pea chloroplasts – a new approach to the characterization of the primary processes in photosystem II alpha-units and beta-units. Biophys. J 61:1147-1163.
16. Gilmore, A.M., T.L. Hazlett, P.G. Debrunner, and Govindjee. 1996. Photosystem II chlorophyll a fluorescence lifetimes and intensity are independent of the antenna size differences between barley wild-type and chlorina mutants: Photochemical quenching and xanthophyll cycle-dependent nonphotochemical quenching of fluorescence. Photosynth. Res 48:171-187.
17. Vasil'ev, S., S. Wiebe, and D. Bruce. 1998. Non-photochemical quenching of chlorophyll fluorescence in photosynthesis. 5-hydroxy-1,4-naphthoquinone in spinach thylakoids as a model for antenna based quenching mechanisms. Biochim. Biophys. Acta 1363:147-156.

EET and CS in PSII
44
18. Zhang, S., and H.V. Scheller. 2004. Light-harvesting Complex II Binds to Several Small Subunits of Photosystem I. The Journal of Biological Chemistry 279(5):3180-3187.
19. Dekker, J.P., and E.J. Boekema. 2005. Supramolecular organization of thylakoid membrane proteins in green plants. Biochim. Biophys. Acta 1706:12-39.
20. Schilstra, M.J., J. Nield, W. Dörner, B. Hankamer, M. Carradus, L.M.C. Barter, J. Barber, and D.R. Klug. 1999. Similarity between electron donor side reactions in the solubilized Photosystem II-LHC II supercomplex and Photosystem-II-containing membranes. Photosynth. Res 60:191-198.
21. Berthold, D.A., G.T. Babcock, and C.F. Yocum. 1981. A highly-resolved, oxygen-evolving photosystem II preparation from spinach thylakoid membranes. FEBS Lett 134:231-234.
22. van Roon, H., F.L. van Breemen, F.L. De Weerd, J.P. Dekker, and E.J. Boekema. 2000. Solubilization of green plant thylakoid membranes with n-dodecyl-a,D-maltoside. Implications for the structural organization of the photosystem II, photosystem I, ATP synthase and cytochrome b6f complexes. Photosynth. Res 64:155-166.
23. Somsen, O.J.G., A. van Hoek, and H. van Amerongen. 2005. Fluorescence quenching of 2-aminopurine in dinucleotides. Chem. Phys. Lett 402:61-65.
24. Digris, A.V., V.V. Skakoun, E.G. Novikov, A. van Hoek, A. Claiborne, and A.J.W.G. Visser. 1999. Thermal stability of a flavoprotein assessed from associative analysis of polarized time-resolved fluorescence spectroscopy. Eur. Biophys. J. 28:526-531.
25. Novikov, E.G., A. van Hoek, A.J.W.G. Visser, and J.W. Hofstraat. 1999. Linear algorithms for stretched exponential decay analysis. Opt. Commun. 166:189-198.
26. van Stokkum, I.H.M., D.S. Larsen, and R. van Grondelle. 2004. Global and target analysis of time-resolved spectra. Biochim. Biophys. Acta 1657:82-104.
27. van Amerongen, H., L. Valkunas, and R. van Grondelle. 2000. Photosynthetic excitons. World Scientific Publishing Co. Pte. Ltd, Singapore.

Chapter 2
45
28. Boekema, E.J., H. van Roon, F. Calkoen, R. Bassi, and J.P. Dekker. 1999. Multiple types of association of photosystem II and its light-harvesting antenna in partially solubilized photosystem II membranes. Biochemistry 38:2233-2239.
29. Boekema, E.J., F.L. van Breemen, H. van Roon, and J.P. Dekker. 2000. Arrangement of photosystem II supercomplexes in crystalline macrodomains within the thylakoid membranes of green plants. J. Mol. Biol 301:1123-1133.
30. Jennings, R.C., R. Bassi, F.M. Garlaschi, P. Dainese, and G. Zucchelli. 1993. Distribution of the chlorophyll spectral forms in the chlorophyll-protein complexes of photosystem II antenna. Biochemistry 32:3203-3210.
31. Loll, B., J. Kern, W. Saenger, A. Zouni, and J. Biesiadka. 2005. Towards complete cofactor arrangement in the 3.0 Å resolution structure of photosystem II. Nature 438:1040-1044.
32. Leibl, W., J. Breton, J. Deprez, and H.-W. Trissl. 1989. Photoelectric study on the kinetics of trapping and charge stabilization in oriented PS-II membranes. Photosynth. Res 22:257-275.
33. Kirchhoff, H., M. Borinski, S. Lehnert, L.F. Chi, and C. Büchel. 2004. Transversal and lateral exciton energy transfer in grana thylakoids of spinach. Biochemistry 43:14508-14516.
34. Vasil'ev, S., P. Orth, A. Zouni, T.G. Owens, and D. Bruce. 2001. Excited-state dynamics in photosystem II: Insights from the x-ray crystal structure. Proc. Natl. Acad. Sci. USA 98:6802-6807.
35. Vasil'ev, S., and D. Bruce. 2004. Optimation and evolution of light-harvesting in photosynthesis: the role of antenna chlorophyll conserved between photosystem II and photosystem I. Plant Cell 16:3059-3068.
36. Merry, S.A.P., P.J. Nixon, L.M.C. Barter, M. Schilstra, G. Porter, J. Barber, J.R. Durrant, and D.R. Klug. 1998. Modulation of Quantum Yield of Primary Radical Pair Formation in Photosystem II by Site-Directed Mutagenesis Affecting Radical Cations and Anions. Biochemistry 37:17439-17447.

EET and CS in PSII
46
37. Rappaport, F., M. Guergova-Kuras, P.J. Nixon, B.A. Diner, and J. Lavergne. 2002. Kinetics and Pathways of Charge Recombination in Photosystem II. Biochemistry 41:8518-8527.
38. Cuni, A., L. Xiong, R. Sayre, F. Rappaport, and J. Lavergne. 2004. Modification of the pheophytin midpoint potential in photosystem II: Modulation of the quantum yield of charge separation and of charge recombination pathways. Phys.Chem.Chem.Phys. 6:4825-4831.
39. Miloslavina, Y., M. Szczepaniak, M.G. Müller, J. Sander, M. Nowaczyk, M. Rögner, and A.R. Holzwarth. 2006. Charge Separation Kinetics in Intact Photosystem II Core Particles Is Trap-Limited. A Picosecond Fluorescence Study. Biochemistry 45:2436-2442.
40. Schatz, G.H., H. Brock, and A.R. Holzwarth. 1987. Picosecond kinetics of fluorescence and absorbancy changes in photosystem II particles excited at low photon density. Proc. Natl. Acad. Sci. USA 84:8414-8418.
41. Engelmann, E.C.M., G. Zucchelli, F.M. Garlaschi, A.P. Casazza, and R.C. Jennings. 2005. The effect of outer antenna complexes on the photochemical trapping rate in barley thylakoid photosystem II. Biochim. Biophys. Acta 1706:276-286.
42. Novoderezhkin, V.I., M.A. Palacios, H. van Amerongen, and R. van Grondelle. 2005. Excitation Dynamics in the LHCII Complex of Higher Plants: Modeling Based on the 2.72 Å Crystal Structure. J. Phys. Chem. B 109:10493-10504.
43. Groot, M.L., N.P. Pawlowicz, L.J.G.W. van Wilderen, J. Breton, I.H.M. van Stokkum, and R. van Grondelle. 2005. Initial donor and acceptor in isolated photosystem II reaction centers identified with femtosecond mid-IR spectroscopy. Proc. Natl. Acad. Sci. USA 102:13087-13092.

Chapter 3
Determination of the Excitation
Migration Time in Photosystem II.
Consequences for the Membrane
Organization and Charge Separation
Parameters.

PSII excited at 420 and 483 nm
48
Abstract
The fluorescence decay kinetics of Photosystem II (PSII) membranes from spinach with open reaction centers (RCs), were compared after exciting at 420 and 484 nm. These wavelengths lead to preferential excitation of chlorophyll (Chl) a and Chl b, respectively, which causes different initial excited-state populations in the inner and outer antenna system. The non-exponential fluorescence decay appears to be 4.3 ± 1.8 ps slower upon 484 nm excitation for preparations that contain on average 2.45 LHCII (light-harvesting complex II) trimers per reaction center. Using a recently introduced coarse-grained model it can be concluded that the average migration time of an electronic excitation towards the RC contributes ~23% to the overall average trapping time. The migration time appears to be approximately two times faster than expected based on previous ultrafast transient absorption and fluorescence measurements. It is concluded that excitation energy transfer in PSII follows specific energy transfer pathways that require an optimized organization of the antenna complexes with respect to each other. Within the context of the coarse-grained model it can be calculated that the rate of primary charge separation of the RC is (5.5 ± 0.4 ps)-1, the rate of secondary charge separation is (137 ± 5 ps)-1 and the drop in free energy upon primary charge separation is (826±30) cm-1. These parameters are in rather good agreement with recently published results on isolated core complexes [Miloslavina et al, Biochemistry 45 (2006) 2436-2442].
Based on: Koen Broess, Gediminas Trinkunasa, Arie van Hoek, Roberta Croce, and Herbert van Amerongen. Determination of the excitation migration time in photosystem II. Consequences for the membrane organization and charge separation parameters, (2008) Biochimica et Biophysica Acta – Bioenergetics. 1777: 404-409.
Introduction
Photosystem II (PSII) is a large supramolecular pigment-protein complex embedded in the thylakoid membranes of green plants, algae, and cyanobacteria. It

Chapter 3
49
uses sunlight to split water into molecular oxygen, protons, and electrons. PSII in higher plants can be subdivided into 1) a core, consisting of the reaction center (RC) and the light-harvesting complexes CP43 and CP47 and 2) the outer antenna complexes CP24, CP26, CP29 and light-harvesting complex II (LHCII) (figure 1) [1]. In the RC the excitations are used to create a charge separation (CS), and to transport the electron to quinone A (QA) and then further along the electron transfer pathway. The outer antennae are not only important for harvesting light, but also play essential roles in several regulation mechanisms like state transition and nonphotochemical quenching [2-4].
The quantum efficiency of the CS process depends on the rate- or time constants of various processes: 1) excitation energy transfer (EET) from the antenna to the RC, 2) CS and charge recombination, 3) stabilization of the CS by secondary electron transfer and 4) relaxation or loss processes of the excited state: intersystem crossing, internal conversion, and fluorescence.
In a previous article [5] we provided a coarse-grained method to correlate these processes to the fluorescence kinetics of PSII membranes with open RC’s, i.e. with the secondary electron acceptor QA being oxidized. The dimeric supercomplex of PSII (figure 1) forms the basic unit for this coarse-grained model. A hopping rate ĸhop was defined for excitation energy transfer between neighboring monomeric (sub)units, indicated by the bars in the same figure. Forward and backward rates were adjusted by rescaling the single hopping rates in accordance with the differences in the number of Chl a molecules per monomeric unit. The outer antenna complexes all transfer their excitations to the RC via CP47 or CP43. Excitations can leave the RC again into the antenna. Charge separation in the reaction center is represented either by one irreversible charge separation step with rate kCS or by reversible charge transfer to the primary acceptor followed by irreversible charge transfer to the secondary acceptor.

PSII excited at 420 and 483 nm
50
Figure 1. Membrane organization of PS II that is used for the coarse-grained modelling. Bars represent putative energy transfer links between the light-harvesting complexes. Transfer from one complex to the other along a bar occurs with hopping rate khop. Charge separation occurs in the reaction centers (D1/D2) with rate kCS
It was concluded that the excitation diffusion to the RC contributes significantly to the overall charge separation time and that the charge separation is fast and corresponds to a significant drop in free energy upon primary charge separation. However, the data provided a large distribution of fits of similar quality and therefore the outcome was not unique. In the present work we provide a refinement of the previous method by measuring and modeling the difference in fluorescence kinetics after preferential excitation of Chl a and Chl b in PSII membranes (so-called BBY preparations) [6]. Because there is no Chl b in the core, the difference in the fluorescence lifetimes is a measure for the migration time τmig, which is defined as the average time for an excitation to reach the RC for the first time (also

Chapter 3
51
called first passage time). Determination of the migration time is important because it also allows determination of the rate(s) of electron transfer and the drop in free energy upon charge separation in the membrane system. This allows direct comparison with values obtained for isolated RCs and cores, for which it was proposed that the drop in free energy upon charge separation occurs on a slower time scale than for more intact systems [5, 7, 8]. Recently, the coarse-grained model [5] was used to determine the characteristics of the charge separation of PSII at different locations in the thylakoid membranes [7]. The migration time was not known at that time and a hopping time of 17 ps was taken, reflecting excitation energy transfer from one pigment-protein complex to the other. It was concluded that the charge separation characteristics are strongly dependent on the location in the membrane. An accurate determination of the migration time will allow a refined determination of these characteristics, because it scales linearly with the hopping time. Finally, the relative contribution of the migration time to the overall trapping time is relevant for the mechanism of nonphotochemical quenching (NPQ), which protects plants from dangerous excess light conditions [5]. In the case of very fast excitation migration [9, 10] one quencher per RC may be enough to explain the quenching kinetics, whereas a higher number might be needed in the case of slow migration.
Materials and Methods
Sample preparation
PSII membranes (BBY particles) were prepared according to Berthold et al. [6] from fresh spinach leaves. The amount of PSI (on a Chl basis) was undetectably low and at most 2%. Absorption spectra were measured with a Cary 5E spectrophotometer (Varian, Palo Alto, CA). From the absorption spectrum of the acetonic extract the Chl a / Chl b ratio was determined (See Appendix) to be 2.11 ± 0.01 and 2.04 ± 0.01 for the preparations with the fastest and slowest average fluorescence decay time. This corresponds to 2.35 and 2.55 trimers per reaction center, respectively (see Appendix). The average value for the six different preparations was 2.45.

PSII excited at 420 and 483 nm
52
Steady-state fluorescence spectra were measured with a Fluorolog-3.22 (Jobin Yvon-Spex, Edison, NJ) at room temperature. Time-correlated single photon counting (TCSPC) measurements were performed at magic angle (54.7o) polarization as described previously [11]. The BBY particles were diluted to an optical density of 0.08 per cm at 420 nm in a buffer of 20 mM Hepes pH 7.5, 15 mM NaCl, 5 mM MgCl2, 0.0003% β-DM and 0.3 mM ferricyanide [12]. The repetition rate of the excitation pulses was 3.8 MHz and the excitation wavelength was either 420 nm or 484 nm. Sub-pJ pulse energies were used with pulse duration of 0.2 ps and spot diameter of 1 mm. The samples were placed in a 3.5 mL and 10 mm light path fused silica cuvette and stirred in a temperature controlled (13 oC) sample holder. In combination with the low intensities of excitation and the use of ferricyanide this guaranteed that close to 100% of the reaction centers stayed open whereas significant build-up of triplet states was avoided [5]. The full-width at half maximum (fwhm) of the system response function was 60 ps and the kinetics were recorded with a resolution of 1 and 2 ps per channel (total 4096 channels). The dynamic instrumental response function of the setup was obtained from pinacyanol (Exciton, inc., Dayton, Ohio) in methanol with a lifetime of 10 ps. A 688 nm interference filter (Balzers, Liechtenstein model B40) was used for detection. Data analysis was performed using a home-built computer program [13, 14].
Results
We have measured the fluorescence decay kinetics of PSII membranes with open RC’s upon excitation at 420 nm and 484 nm. At 420 nm the absorption is mainly due to Chl a and carotenoid molecules whereas excitation at 484 nm leads to excitation of predominantly Chl b (only present in the outer antenna) and carotenoids (see Appendix for further quantification). The probability to excite the outer antenna complexes is calculated to be approximately 0.74 upon 420 nm excitation and 0.89 upon 484 nm excitation (see Appendix). Excitation energy transfer from carotenoids and Chls b to Chls a in LHCII (the dominant complex of the outer antenna) has been studied extensively in the past [15-24] and occurs with an average rate that is substantially faster than 1 ps-1. Therefore, energy transfer to the Chl a molecules within LHCII does hardly contribute to the overall migration time. The identified pigment binding sites in the minor complexes are the same as

Chapter 3
53
in LHCII and their steady-state spectroscopic properties point to a similar structural organization [25-29] so that also for these complexes a similar fast transfer rate should occur. This has indeed been confirmed experimentally for CP29 [30-34]. Figure 2 shows both (420 and 484 nm excitation) fluorescence decay curves of one of the preparations. Excitation at 420 nm leads to a slightly faster decay, which is hard to see by eye because of the relatively broad instrument response function (IRF). Quantifying the difference between the two decay curves requires accurate fitting. For a good fit four decay times are needed in all cases. After excitation at 420 nm the decay is dominated by three components: 74 ps (41.7 %), 175 ps (51.0 %) and 377 ps (7.1%) for the decay presented in figure 2. The contribution of a slow component of 2.2 ns is very small (0.1%) and it is probably due to a small amount of PSII with closed RCs, free Chl or detached pigment-protein complexes and will not be used for the modelling. The exact fitting values are not directly interpreted but are used to reconstruct the fluorescence decay curves, thereby eliminating the contribution of the IRF. This reconstructed decay is then used for further modelling (vide infra). The decay can also be fitted with slightly different values but this leads to very similar modelling results and the deviation is insignificant for any of the conclusions drawn. The first three components correspond to a weighted average decay time of 147.0 ps which is similar to our previous results [5].
Also upon excitation at 484 nm the decay is dominated by the fastest three components: 81.3 ps (41.4%), 179 (51.9%), 380 ps (6.6%). Again, there is a minor contribution from a slow component (1.8 ns, 0.1%) which will be ignored below. The weighted average of the first three decay times is 151.5 ps.
Repetition of the experiments on this preparation consistently showed a difference in the average decay times (∆τavg), i.e. preferential excitation of the outer antenna leads to slightly slower overall trapping.

PSII excited at 420 and 483 nm
54
Figure 2, Fluorescence decay curves of PSII membranes with 2.35 LHCII trimers per RC, measured at 13 0C. The black trace (Chl a ) corresponds to excitation at 420 nm and the fitted decay times and relative amplitude are 74 ps (41.7 %), 175 ps (51 %), 377 ps (7.1%) and 2.2 ns (0.1%). The red trace (Chl b ) corresponds to excitation at 484 nm detection and the fitted decay times and relative amplitude are: 81.3 ps (41.4%), 179 (51.9%), 380 ps (6.6%) and 1.8 ns (0.1%). Fluorescence is detected with a 688 nm band-pass filter. The inset focuses on the first part of the decay and the fluorescence is represented on a log scale.
The experiments were performed for six different prepared BBY samples. The average decay time of all samples was 154.5 ps upon 420 nm excitation and on average the decay was 4.3ps slower upon 484 nm excitation. The standard deviation of the determined lifetimes (0.3 ps) as determined by repeating the measurement on individual samples is small. Upon comparison of the six different samples the standard deviation of the mean is 1.8 ps (table 1). Therefore, the former standard deviation of 0.3 ps can safely be neglected.

Chapter 3
55
Table 1, Results of simultaneous fitting of the reconstructed 420 nm and 484 nm decay curves with the coarse-grained model (figure 1)[5].
Six different preparations were measured and analyzed independently. The average obtained values are presented together with the standard error of the mean. All parameters are defined in the text. τmig and τavg show the separately times for the 420 and 484 nm excitation. a Standard error of the mean.
Discussion
In (Broess et al.[5]) it was found that the overall trapping time of excitations in PSII BBY’s can already be described rather well with a very simple course-grained model, describing excitation energy transfer and charge separation in PSII supercomplexes with 2 parameters: one hopping rate for excitation transfer from one complex to the other and one effective charge separation rate, when an excitation is located anywhere in the reaction center (see fig. 1). The description with this simple model was optimal for a hopping rate of (17 ps)-1 and a charge separation rate of (1.2 ps)-1. Below the terms hopping time τh and charge separation time τCS are used, being the reciprocal of the corresponding rates. The migration time τmig is linearly proportional to the hopping time [5]. The overall trapping time τ (fluorescence lifetime in this case) is the sum of τmig and τtrap in this simplified approach. Here τtrap is the charge separation time when the excitation is spatially/thermodynamically equilibrated over PSII (core + outer antenna). As
PSII excited at 420 and 483 nm
56
mentioned above different combinations of τh and τCS lead to comparable description of the data, with a nearly linear relationship between the optimal values for τh and τCS [5]: larger values for the hopping time require a smaller charge separation time in order to describe the data. Since at that time no direct experimental results were available that could provide the best combination of τhop and τCS, estimates were made in an indirect way making use of earlier results from singlet-singlet annihilation experiments on isolated LHCII trimers and LHCII aggregates [35]. This led to a hopping time of 13 ps and a corresponding charge separation time of 4.1 ps. It should be noted that this model is oversimplified because reversible charge recombination is not taken into account.
In the present study the fluorescence kinetics of BBY particles were compared after excitation at 420 and 484 nm. The difference in average lifetime scales linearly with the migration (and thus the hopping) time and the proportionality constant depends on the relative probabilities of exciting the various complexes. By determining the relative protein composition of the BBY preparations, these probabilities can be estimated rather accurately using the absorption spectra of the individual complexes (see Appendix) and the expected kinetics can be calculated within the context of the coarse-grained model. In this way τh and τCS can be determined. For instance, ∆τavg is expected to be 0 ps in case of infinitely fast excitation migration (τh = 0 ps) like in the exciton radical-pair equilibrium (ERPE) model [36, 37], thereby also fixing τCS. However, finite values of ∆τavg imply that the hopping time is non-zero and consequently τCS decreases. Once the excitation reaches the RC it can move into the antenna again or lead to a charge separation but the subsequent kinetic behaviour is independent of the excitation wavelength i.e. τtrap is independent of excitation wavelength (for an overview of the modelling principles see e.g. [38]).
Reversible Charge Separation
In general, the overall charge separation process in the RC of PSII is considered to be partially reversible [10, 39-42]. Also in our preceding study on BBY particles

Chapter 3
57
[5] it was shown that the fitting of the data improved when reversible charge separation was included in the modelling. What is the effect of reversible charge separation on the observed kinetics? The value of τmig is determined by the hopping time and the initial probability distribution of excitations over the membrane and in any model its fitted value will be fixed by the value of ∆τavg. Upon raising the rate of charge recombination within the model, the overall fluorescence lifetime will increase when keeping the hopping time and charge separation time identical. In order to keep the modelled average lifetime in accordance with the experimentally determined one, an increased rate of back transfer needs to be compensated by an increased rate of charge separation. The ratio of these two rates is determined by the drop in free energy upon charge separation via the detailed-balance relation.
Here we modelled further electron transfer to the quinone QA with one irreversible electron transfer rate. Note that in general, an additional reversible electron transfer step is supposed to take place before irreversible transfer to QA occurs. This is often taken into account for the modelling of charge separation in PSII cores and RC’s [10, 39-41]. However, the BBY particles are too large to allow such detailed modelling and therefore the multi-step reversible electron transfer has to be replaced by one effective electron-transfer process.
It is now possible to fit the 420 and 484 nm results simultaneously with a two-step electron transfer model and 4 parameters: The hopping time τh and charge separation time τCS, the drop in free energy ∆G upon primary charge separation and the secondary charge separation time τRP. The results are given in Table 1 (average of the results for six different BBY preparations) and are summarized by the values τh = 3.5 ± 0.9 ps, τCS = 5.5 ± 0.4 ps, ∆G = 826 ± 30 cm-1 and τRP = 137 ± 5 ps, where the errors indicate the standard error of the mean (see also Figure 3). The fitting results are not shown but they are virtually indistinguishable from the reconstructed decay curves. Whereas in our previous study there was a large uncertainty in these values, the simultaneous analysis of the 420 and 484 nm data provide relatively accurate values for all parameters because the value of ∆τavg essentially fixes the value of τmig and thus of τh. As was mentioned above, the hopping time scales linearly with the migration time τmig and it is found to be 35 ps upon 420 nm excitation and 39 ps upon 484 nm excitation, i.e. around 22-24% of the average overall trapping time of 154.5 or 158.8 ps (note that both τmig and τtrap

PSII excited at 420 and 483 nm
58
are expected to increase upon increasing the number of antenna complexes, but not the values for τCS, ∆G, and τRP). Jennings et al [8] found a percentage of 30% based on steady-state fluorescence quenching measurements and kinetic modelling but in that case the results might be influenced by the presence of some Chl that is not connected to the RC. It should be noted that the obtained number of LHCII trimers per RC is higher than the number of 2 used for the modelling (figure 1). This obtained number may even be higher because of some uncertainty in the actual number of pigments in the minor complexes. The effect of the number of LHCII trimers per RC will be investigated in a future study in which the antenna size will be changed in a systematic way. Here we note that the preparation with the highest LHCII content showed a somewhat larger overall trapping time. However, the fitting results did not change to a large extent when either a number of 2.35 or 2.55 trimers per RC was assumed for a particular data set.
The values for τCS, τRP and ∆G obtained here for PSII preparations with outer antenna are similar to the most recent results obtained with time-resolved fluorescence by Holzwarth and coworkers [10] for core preparations without outer antenna. Their value of 863 cm-1 [10] (drop in free energy before irreversible electron transfer to the QA occurs) is nearly identical to the value found in the present study: ∆G = 826 ± 30 cm-1. The charge separation time of 5.5 ± 0.4 ps in our case is somewhat slower than the effective time of 4.5 ps given in [43]. It should be kept in mind that the cores used by Holzwarth and coworkers [10, 22] were prepared from Thermosynechococcus elongatus whereas our samples were from spinach. Two different values for the secondary charge separation time for core preparations (313 ps [10] and 175 ps [43]) were reported by Holzwarth and coworkers. The origin of this difference is unclear. The latter value is closest to the one of 137 ± 5 ps found in the present study.

Chapter 3
59
Figure 3, Summary of the obtained results obtained on PSII membrane preparations (BBY’s). Excitation of light-harvesting complex somewhere in PSII (upper figure) is followed by excitation energy transfer throughout the membrane (the grey shading in the left figure schematically represents the excitation probability distribution over the different complexes) and the average time needed to reach the RC for the first time (τmig) is 35 ps after 420 nm excitation and 39 ps after 484 nm excitation. Energy migration is followed by primary charge separation. The rate of reversible primary charge separation from the excited RC is (5.5 ps)-1 and it is accompanied by a drop in free energy of 826 cm-1. Subsequent electron transfer to QA occurs with a rate constant of (137 ps)-1.
PSII excited at 420 and 483 nm
60
As was mentioned above, a value of τhop = 17 ps was used in [7] to draw the conclusion that the PSII charge-separation kinetics is substantially different in the various parts of the thylakoid membrane. In light of the much faster hopping time (3.5 ps) obtained in the present study, these conclusions should be reconsidered.
Here a migration time of 35 or 39 ps is obtained upon excitation at 420 and 484 nm, respectively. It is interesting to compare these values to the value that can be estimated from a singlet-singlet annihilation study on LHCII [35]. It was concluded in that study that the average migration time in PSII would be close to N x ~32 ps, N being the number of LHCII trimers per reaction center and ~32 ps being the approximate spatial equilibration time of an excitation over an LHCII trimer in a random aggregate of trimers. For a preparation with N = 2.45 we might therefore expect a contribution of 78 ps, two times larger than the 35-39 ps found in the present study. In a recent study it was demonstrated that upon applying high hydrostatic pressure to LHCII trimers, the fluorescence of a large fraction of the trimers is quenched with a time constant of 25 ps, which reflects the time it takes for an excitation to reach a quencher within the trimer that is being created upon applying high pressure [44]. This value is only somewhat faster than the 32 ps mentioned above, not enough to explain the above mentioned difference of a factor of two. The most obvious explanation for the remarkably fast migration time in PSII is the presence of specific transfer pathways. The excitations in LHCII trimers tend to be localized on the outside of these oligomers [19, 45]. Therefore, excitation energy transfer within the trimer, where the low-energy states of the constituting monomers are relatively far apart, might be significantly slower than energy transfer from one trimer to the other, or to a different light-harvesting complex, when the low-energy pigments of the different complexes come closer together. Future determination of high-resolution electron-microscopy maps of PSII will be invaluable to determine the relative orientation of the complexes allowing for more detailed calculations.

Chapter 3
61
Acknowledgements
This work is part of the research programme of the ‘Stichting voor Fundamenteel Onderzoek der Materie (FOM)’, which is financially supported by the ‘Nederlandse Organisatie voor Wetenschappelijk Onderzoek (NWO)’. K.B. was supported by FOM. G.T. and R.C. acknowledge support (visitor grant) from the ‘Nederlandse Organisatie voor Wetenschappelijk Onderzoek (NWO)’.

PSII excited at 420 and 483 nm
62
Appendix
The Chl a/b ratio of the samples was determined by fitting the absorption spectrum of the acetone extract with the spectra of individual pigments in acetone [26] (three repetitions). The Chl a/b ratio was used to estimate the number of LHCII trimers present in the preparation, while all the other complexes were considered to be present in a 1:1 ratio with respect to the reaction center, according to literature [4, 46]. As an example we report the calculation for the sample with a Chl a/Chl b ratio of 2.11 ± 0.01 below. To estimate the number of complexes the pigment to protein stoichiometry of the individual complexes was used [47, 48] and they are reported in Table 2a.
Table 2a, The number of pigments per pigment-protein complex that was used for the calculations (see Appendix).
Per RC there is one core complex (containing 1 CP47, 1 CP43 and 1 RC), 1 CP24, 1 CP26 and 1 CP29, and an unknown number of n LHCII trimers, which can be determined in the following way. The number # of Chl a and Chl b molecules per RC depends on the number of trimers n according to:
#Chl a = 53 + 24n and #Chl b = 10 + 18n. For the subsequent calculations the two Pheo a molecules were replaced by 1 Chl a, which has a similar amount of absorption. The measured Chl a/Chl b ratio of 2.11 should then be equal to (53 + 24n)/(10 + 18n). This leads to a number of 2.35 trimers per RC.
To determine the percentage of initial excitation of the individual complexes, the PSII spectrum was reconstructed using the spectra of individual complexes in their

Chapter 3
63
native state, normalised to the Chl content, and multiplied by the number of each complex in the membrane as obtained from the pigment analysis (i.e. the spectrum of the LHCII trimer was multiplied by 2.35, while all other spectra were multiplied by 1). Note that the reconstructed spectrum cannot be directly compared to the measured BBY spectrum because of sieving effects. Using the normalized spectra the percentage of excitation at 420 and 484 nm was estimated for all complexes, looking at their relative contribution at the excitation wavelengths (Table 2b). The probability to excite the outer antenna complexes was found to be 0.74 upon 420 nm excitation and 0.91 upon 484 nm excitation. Fitting the (distorted) BBY spectrum with spectra of Chls and carotenoids in protein [49] and using the known pigment and protein stoichiometries, led to the same numbers showing the robustness of the method. The main reason is that Chl a and Chl b hardly absorb at 484 and 420 nm, respectively.
Table 2b, Percentage of direct excitation of the individual complexes upon excitation at 420 and 484 nm (see Appendix).

PSII excited at 420 and 483 nm
64
References
[1] J.P. Dekker, E.J. Boekema, Supramolecular organization of thylakoid membrane proteins in green plants, Biochim. Biophys. Acta 1706 (2005) 12-39.
[2] A.A. Pascal, Z. Liu, K. Broess, B. van Oort, H. van Amerongen, C. Wang, P. Horton, B. Robert, W. Chang, A. Ruban, Molecular basis of photoprotection and control of photosynthetic light-harvesting, Nature 436 (2005) 134-137.
[3] P. Horton, M. Wentworth, A.V. Ruban, Control of the light harvesting function of chloroplast membranes: The LHCII-aggregation model for non-photochemical quenching, FEBS Lett. (2005) 4201-4206.
[4] H. van Amerongen, J.P. Dekker. in (Green, B.R. and Parson, W.W., eds.) Light-Harvesting Antennas in Photosynthesis, Kluwer Academic Publishers 2003, pp. 219-251.
[5] K. Broess, G. Trinkunas, C.D. van der Weij-de Wit, J.P. Dekker, A. van Hoek, H. van Amerongen, Excitation Energy Transfer and Charge Separation in Photosystem II Membranes Revisited, Biophysical J. 91 (2006) 3776-3786.
[6] D.A. Berthold, G.T. Babcock, C.F. Yocum, A highly-resolved, oxygen-evolving photosystem II preparation from spinach thylakoid membranes, FEBS Lett 134 (1981) 231-234.
[7] J. Veerman, M.D. McConnell, S. Vasil'ev, F. Mamedov, S. Styring, D. Bruce, Functional Heterogeneity of Photosystem II in Domain Specific Regions of the
Thylakoid Membrane of Spinach (Spinacia oleracea L.), Biochemistry 46 (2007) 3443-3453.
[8] R.C. Jennings, G. Elli, F.M. Garlaschi, S. Santabarbara, G. Zucchelli, Selective quenching of the fluorescence of core chlorophyll-protein complexes by photochemistry indicates that Photosystem II is partly diffusion limited, Photosynth. Res 66 (2000) 225-233.

Chapter 3
65
[9] G.H. Schatz, H. Brock, A.R. Holzwarth, Picosecond kinetics of fluorescence and absorbance changes in photosystem II particles excited at low photon density, Proc. Natl. Acad. Sci. USA 84 (1987) 8414-8418.
[10] Y. Miloslavina, M. Szczepaniak, M.G. Muller, J. Sander, M. Nowaczyk, M. Rögner, A.R. Holzwarth, Charge Separation Kinetics in Intact Photosystem II Core Particles Is Trap-Limited. A Picosecond Fluorescence Study, Biochemistry 45 (2006) 2436-2442.
[11] O.J.G. Somsen, A. van Hoek, H. van Amerongen, Fluorescence quenching of 2-aminopurine in dinucleotides, Chem. Phys. Lett 402 (2005) 61-65.
[12] R. Barr, F.L. Crane, Ferricyanide Reduction in Photosystem II of Spinach Chloroplasts, Plant. Physiol. 67 (1981) 1190-1194.
[13] A.V. Digris, V.V. Skakoun, E.G. Novikov, A. Van Hoek, A. Claiborne, A.J.W.G. Visser, Thermal stability of a flavoprotein assessed from associative analysis of polarized time-resolved fluorescence spectroscopy, Eur. Biophys. J. 28 (1999) 526-531.
[14] E.G. Novikov, A. van Hoek, A.J.W.G. Visser, H.J. W., Linear algorithms for stretched exponential decay analysis, Opt. Commun. 166 (1999) 189-198.
[15] R. Croce, M.G. Muller, R. Bassi, A.R. Holzwarth, Carotenoid-to-Chlorophyll Energy Transfer in Recombinant Major Light-Harvesting Complex (LHCII) of Higher Plants. I. Femtosecond Transient Absorption Measurements, Biophys. J. 80 (2001) 901-915.
[16] C.C. Gradinaru, A.A. Pascal, F. van Mourik, B. Robert, P. Horton, R. van Grondelle, H. van Amerongen, Ultrafast Evolution of the Excited States in the Chlorophyll a/b Complex CP29 from Green Plants Studied by Energy-Selective Pump-Probe Spectroscopy, Biochemistry 37 (1998) 1143-1149.
[17] F.J. Kleima, C.C. Gradinaru, F. Calkoen, I.H.M. van Stokkum, R. van Grondelle, H. van Amerongen, Energy Transfer in LHCII Monomers at 77K Studied by Sub-Picosecond Transient Absorption Spectroscopy, Biochemistry 36 (1997) 15262-15268.
[18] V.I. Novoderezhkin, M.A. Palacios, H. van Amerongen, R. van Grondelle, Energy-Transfer Dynamics in the LHCII Complex of Higher Plants: Modified Redfield Approach, J. Phys. Chem. B 108 (2004) 10363-10375.

PSII excited at 420 and 483 nm
66
[19] V.I. Novoderezhkin, M.A. Palacios, H. van Amerongen, R. van Grondelle, Excitation Dynamics in the LHCII Complex of Higher Plants: Modeling Based on the 2.72 Å Crystal Structure, J. Phys. Chem. B 109 (2005) 10493-10504.
[20] M.A. Palacios, J. Standfuss, M. Vengris, B.F. van Oort, I.H.M. van Stokkum, W. Kühlbrandt, H. van Amerongen, R. van Grondelle, A comparison of the three isoforms of the light-harvesting complex II using transient absorption and time-resolved fluorescence measurements, Photosynthesis Research 88 (2006) 269-285.
[21] E.J.G. Peterman, R. Monshouwer, I.H.M. van Stokkum, R. van Grondelle, H. van Amerongen, Ultrafast singlet excitation transfer from carotenoids to chlorophylls via different pathways in light-harvesting complex II of higher plants, Chemical Physics Letters 264 (1997) 279-284.
[22] J.M. Salverda, M. Vengris, B.P. Krueger, G.D. Scholes, A.R. Czarnoleski, V.I. Novoderezhkin, H. van Amerongen, R. van Grondelle, Energy Transfer in Light-Harvesting Complexes LHCII and CP29 of Spinach Studied with Three Pulse Echo Peak Shift and Transient Grating, Biophys. J. 84 (2003) 450-465.
[23] H. van Amerongen, R. van Grondelle, Understanding the Energy Transfer Function of LHCII, the Major Light-Harvesting Complex of Green Plants, J. Phys. Chem. B 105 (2001) 604-617.
[24] H.M. Visser, F.J. Kleima, I.H.M. van Stokkum, R. van Grondelle, H. van Amerongen, Probing the many energy-transfer processes in the photosynthetic light-harvesting complex II at 77 K using energy-selective sub-picosecond transient absorption spectroscopy, Chemical Physics 210 (1996) 297-312.
[25] R. Bassi, R. Croce, D. Cugini, D. Sandona, Mutational analysis of a higher plant antenna protein provides identification of chromophores bound into multiple sites, PNAS 96 (1999) 10056-10061.
[26] R. Croce, G. Canino, F. Ros, R. Bassi, Chromophore Organization in the Higher-Plant Photosystem II Antenna Protein CP26, Biochemistry 41 (2002) 7334-7343.

Chapter 3
67
[27] H.A. Frank, S.K. Das, J.A. Bautista, D. Bruce, S. Vasilrev, M. Crimi, R. Croce, R. Bassi, Photochemical Behavior of Xanthophylls in the Recombinant Photosystem II Antenna Complex, CP26, Biochemistry 40 (2001) 1220-1225.
[28] A. Pascal, C. Gradinaru, U. Wacker, E. Peterman, F. Calkoen, K.-D. Irrgang, P. Horton, G. Renger, R. van Grondelle, B. Robert, H. van Amerongen, Spectroscopic characterization of the spinach Lhcb4 protein (CP29), a minor light-harvesting complex of photosystem II, European Journal of Biochemistry 262 (1999) 817-823.
[29] R. Simonetto, M. Crimi, D. Sandona, R. Croce, G. Cinque, J. Breton, R. Bassi, Orientation of Chlorophyll Transition Moments in the Higher-Plant Light-Harvesting Complex CP29, Biochemistry 38 (1999) 12974-12983.
[30] G. Cinque, R. Croce, A. Holzwarth, R. Bassi, Energy Transfer among CP29 Chlorophylls: Calculated Forster Rates and Experimental Transient Absorption at Room Temperature, Biophys. J. 79 (2000) 1706-1717.
[31] R. Croce, M.G. Muller, S. Caffarri, R. Bassi, A.R. Holzwarth, Energy Transfer Pathways in the Minor Antenna Complex CP29 of Photosystem II: A Femtosecond Study of Carotenoid to Chlorophyll Transfer on Mutant and WT Complexes, Biophys. J. 84 (2003) 2517-2532.
[32] R. Croce, M.G. Muller, R. Bassi, A.R. Holzwarth, Chlorophyll b to Chlorophyll a Energy Transfer Kinetics in the CP29 Antenna Complex: A Comparative Femtosecond Absorption Study between Native and Reconstituted Proteins, Biophys. J. 84 (2003) 2508-2516.
[33] C.C. Gradinaru, S. Ozdemir, D. Gulen, I.H.M. van Stokkum, R. van Grondelle, H. van Amerongen, The Flow of Excitation Energy in LHCII Monomers: Implications for the Structural Model of the Major Plant Antenna, Biophys. J. 75 (1998) 3064-3077.
[34] C.C. Gradinaru, I.H.M. van Stokkum, A.A. Pascal, R. van Grondelle, H. van Amerongen, Identifying the Pathways of Energy Transfer between Carotenoids and Chlorophylls in LHCII and CP29. A Multicolor, Femtosecond Pump-Probe Study, J. Phys. Chem. B 104 (2000) 9330-9342.
[35] V. Barzda, V. Gulbinas, R. Kananavicius, V. Cervinskas, H. van Amerongen, R. van Grondelle, L. Valkunas, Singlet-singlet annihilation

PSII excited at 420 and 483 nm
68
kinetics in aggregates and trimers of LHCII, Biophysical J. 80 (2001) 2409-2421.
[36] G.H. Schatz, H. Brock, A.R. Holzwarth, Kinetic and energetic model for the primary processes in photosystem II, Biophys. J 54 (1988) 397-195.
[37] R. van Grondelle, Excitation-energy transfer, trapping and annihilation in photosynthetic systems, Biochim. Biophys. Acta 811 (1985) 147-195.
[38] H. van Amerongen, L. Valkunas, R. van Grondelle, Photosynthetic Excitons, World Scientific Publishing Co. Pte. Ltd. 2000.
[39] E.G. Andrizhiyevskaya, D. Frolov, R. van Grondelle, J.P. Dekker, On the role of the CP47 core antenna in the energy transfer and trapping dynamics of photosystem II, Phys. Chem. Chem. Phys 6 (2004) 4810-4819.
[40] M.L. Groot, N.P. Pawlowicz, L.J.G.W. van Wilderen, J. Breton, I.H.M. van Stokkum, R. van Grondelle, Initial donor and acceptor in isolated photosystem II reaction centers identified with femtosecond mid-IR spectroscopy, Proc. Natl. Acad. Sci. USA 102 (2005) 13087-13092.
[41] S. Vassiliev, C.-I. Lee, G.W. Brudvig, D. Bruce, Structure-based kinetic modelling of excited-state transfer and trapping in histidine-tagged PSII core complexes from Synechocystis, Biochemistry 41 (2002) 12236-12243.
[42] F.L. de Weerd, I.H.M. van Stokkum, H. van Amerongen, J.P. Dekker, R. van Grondelle, Pathways for Energy Transfer in the Core Light-Harvesting Complexes
CP43 and CP47 of Photosystem II, Biophysical J. 82 (2002) 1586-1597.
[43] A.R. Holzwarth, M.G. Müller, M. Reus, M. Nowaczyk, J. Sander, M. Rögner, Kinetics and mechanism of electron transfer in intact photosystem II and in the isolated reaction center: Pheophytin is the primary electron acceptor, Proc. Natl. Acad. Sci. USA 103 (2006) 6895-6900.
[44] B. van Oort, A. van Hoek, A.V. Ruban, H. van Amerongen, The equilibrium between quenched and non-quenched conformations of the major plant light-harvesting complex studied with high-pressure time-resolved fluorescence., J. Phys. Chem. B 111 (2007) 7631-7637.

Chapter 3
69
[45] R. Remelli, C. Varotto, D. Sandona, R. Croce, R. Bassi, Chlorophyll Binding to Monomeric Light-harvesting Complex. A Mutation Analysis of Chromophore-Binding Residues, J. Biol. Chem. 274 (1999) 33510-33521.
[46] R. Bassi, P. Dainese, A supramolecular light-harvesting complex from chloroplast photosystem-II membranes, European Journal of Biochemistry 204 (1992) 317-326.
[47] D. Sandona, R. Croce, A. Pagano, M. Crimi, R. Bassi, Higher plants light harvesting proteins. Structure and function as revealed by mutation analysis of either protein or chromophore moieties, Biochimica et Biophysica Acta (BBA) - Bioenergetics 1365 (1998) 207-214.
[48] B. Loll, J. Kern, W. Saenger, A. Zouni, J. Biesiadka, Towards complete cofactor arrangement in the 3.0 Å resolution structure of photosystem II, Nature 438 (2005) 1040-1044.
[49] R. Croce, G. Cinque, A. Holzwarth, R. Bassi, The Soret absorption properties of carotenoids and chlorophylls in antenna complexes of higher plants, Photosynthesis Research 64 (2000) 221-231.

PSII excited at 420 and 483 nm
70

Chapter 4
Excitation Energy Transfer in
Photosystem II Supercomplexes of
Higher Plants with Increasing Antenna
Size

Supercomplexes
72
Abstract
Picosecond fluorescence measurements were performed on four different Photosystem II (PSII) supercomplexes with open reaction centers. The complexes were taken from a sucrose gradient where they were present in sharp bands, named B8, B9, B10 and B11. Their structural organization was resolved with the use of single particle electron-microscopy analysis and their biochemical composition was determined. The main difference between these supercomplexes concerns the size of the outer light-harvesting antenna, which increases upon going from B8 to B11. The smallest complex (present in B8) contains a dimeric core of PSII with one trimer of the major light-harvesting complex LHCII associated, together with the minor light-harvesting complexes CP26 and CP29. The largest complex contains four LHCII trimers and two copies of CP24, CP26 and CP29 per dimeric core. The average lifetime corresponding to the major part of the fluorescence decay increases upon increasing the antenna size from 123 ps for B8 to 155 ps for B11 in the presence of 0.01% α-DM. In the presence of 0.001% α-DM these lifetimes become somewhat faster and range from 104 ps to 143 ps. The results indicate that the rate constants for energy transfer and charge separation as obtained in chapter 3 for BBY preparations should be slightly faster (~9%).
Based on: Stefano Caffarri, Koen Broess, Gediminas Trinkunas, Roberta Croce, Herbert van Amerongen. Excitation energy transfer in Photosystem II supercomplexes of higher plants with increasing antenna size. In preparation.
Introduction
Photosystem II (PSII) is a water-plastoquinone oxydo-reductase embedded in the thylakoid membrane of plants, algae and cyanobacteria. In higher plants PSII is present mainly as a dimeric structure, each monomer consisting of at least 27-28 subunits most of which coordinate chlorophylls (Chls) and carotenoids [1]. It can be divided into two moieties: the core complex and the outer antenna system.

Chapter 4
73
The core contains in total 35 Chl a molecules, 2 pheophytins a and 8-11 molecules of β-carotene [2]. These pigments are associated to several proteins: (i) D1 and D2 complexes, which coordinate the reaction centre, the primary electron donor P680, and all cofactors of the electron transport chain; (ii) CP47 and CP43 which coordinate Chl a and β-carotene molecules and act as an inner antenna and (iii) several low molecular subunits whose role has not been fully understood [3]. The peripheral antenna system is composed of members of the light-harvesting complex (LHC) multigenic family [4]. The major antenna complex, LHCII, composed of the products of the genes Lhcb1-3, is organized in trimers, and it coordinates 8 Chl a, 6 Chl b and 4 xanthophyll molecules per monomeric subunit [5]. Three more complexes, the so-called minor complexes CP29 (Lhcb4), CP26 (Lhcb5) and CP24 (Lhcb6) are present as monomers in the membrane and they coordinate respectively 8, 9 and 10 chlorophyll molecules and 2-3 xanthophyll molecules [6]. All these complexes are involved in light absorption, transfer of excitation energy to the reaction center and regulation of the excitation energy levels [1, 7]. The amount of these complexes in the membrane is variable and depends on the growing conditions of the plant [8].
Although PSII represents the most important part of the thylakoid membranes, information about its structure and function in higher plants is lagging behind due to the impossibility to purify these complexes to homogeneity. Information about the supramolecular organization of the complex has been obtained by electron microscopy and single particle image averaging analysis on heterogeneous preparations obtained from mildly solubilized membranes integrated with biochemical data [9, 10]. It has been shown that the largest supercomplex of Arabidopsis thaliana is composed of a dimeric core (C2), 2 trimeric LHCIIs (trimer S, where S means strongly bound) in contact with CP43, CP26 and CP29 and 2 more trimers, (trimer M, moderately bound) in contact with CP29 and CP24. This complex is generally known as the C2S2M2 supercomplex [11]. Complexes with smaller antenna size have also been described.
The impossibility to purify PSII supercomplexes to homogeneity not only has limited the amount of structural information but it has also prevented functional and spectroscopic studies. The available data on the light-harvesting processes in PSII have been obtained for grana membrane preparations which are enriched in

Supercomplexes
74
PSII-LHCII (BBY preparations), but which constitute a very complex and inhomogeneous system.
Most picosecond studies on entire chloroplasts or thylakoid membranes suggested average values for the trapping time in PSII in the range from ~300 to ~500 ps [12-14]. For the interpretation of the kinetics, the exciton/radical-pair-equilibrium (ERPE) model was often used. In this model it is assumed that the excitation energy transfer through the antenna to the reaction center (RC) is extremely fast and hardly contributes to the overall charge separation time [15-17]. This assumption was criticized in later studies [1, 18-22]. Recent studies on BBY preparations showed average lifetimes in the order of 150 ps [21, 22]. The validity of the ERPE model was recently studied making use of picosecond fluorescence measurements after excitation at different wavelengths and applying a coarse-grained model [22]. It was concluded that excitation energy transfer is slower than is assumed in the ERPE model but its contribution to the overall excitation energy trapping time is not a major one (~23%). In the coarse-grained model it is assumed that the organization of PSII in the BBY particles is the same as that of PSII in supercomplexes [21]. However, it was indicated in that study that the modelling can only be approximately correct because the average number of LHCII complexes in the BBY particles is higher than that in the supercomplexes, the composition and structure of which was used for the modelling.
Recently, we were able to isolate homogeneous PSII supercomplexes with different antenna size and the exact composition and structural organization of the complexes could be determined. This offers the possibility to study and model the fluorescence kinetics of PSII preparations including the outer antenna in far more detail. In the present work these preparations have been studied with the use of picosecond fluorescence spectroscopy. The results obtained for different supercomplexes are compared to each other and to the previous results obtained for BBY preparations.

Chapter 4
75
Materials and Methods
PSII supercomplexes preparation. PSII enriched membranes (BBY) were prepared according to (Berthold et al. 1981[23]) and stored at -80°C. For PSII supercomplexes preparation, the membranes were washed once with 5 mM EDTA, 10 mM Hepes pH 7.5, then with 10 mM Hepes pH 7.5 and finally solubilized with 0.3 % n-dodecyl- α, D-maltoside (α-DM) in 10 mM Hepes 7.5. The solubilized samples were centrifuged at 12000 g for 10 min to eliminate unsolubilized material and then fractionated by ultracentrifugation on a sucrose gradient in a SW41 rotor, for 14-16 hr at 4 °C and maximum speed. The gradient was formed directly in the tube by freezing at -80°C and thawing at 4°C a 0.65 M sucrose solution containing 0.008% α-DM and 10 mM Hepes pH 7.5. Twelve bands were separated in the gradient and were harvested with a syringe. All the measurements were performed on freshly prepared complexes.
SDS-PAGE. 1D electrophoresis was performed using the Tris-Tricine system [24] at 14.5% acrylamide concentration.
Absorption spectroscopy. Absorption spectra were recorded using a Cary4000 (Varian Inc.). When dilution was necessary, the same solution was used as for the gradient.
TCSPC
Time-correlated single photon counting (TCSPC) measurements were performed at magic angle (54.7o) polarization as described previously [25]. The repetition rate of the excitation pulses was 3.8 MHz and the excitation wavelength was 420 nm. Sub-pJ pulse energies were used with pulse duration of 0.2 ps and spot diameter of 1 mm. The samples were placed in a 3.5 mL and 10 mm light path fused silica cuvette and stirred in a temperature-controlled (13 oC) sample holder. In combination with the low excitation intensities and the use of ferricyanide this guaranteed that close to 100% of the reaction centers stayed open whereas significant build-up of triplet states was avoided [21]. The full-width at half maximum (fwhm) of the system response function was 60 ps and the kinetics were

Supercomplexes
76
recorded with a resolution of 2 ps per channel (total 4096 channels). The dynamic instrumental response function of the setup was obtained from pinacyanol (Exciton, INC. Dayton, Ohio) in methanol with a lifetime of 6 ps [26]. A 688 nm interference filter and a 645 LP filter (Balzers, Liechtenstein model B40) was used for detection. Data analysis was performed using a home-built computer program [27, 28].
Results and Discussion
Photosystem II supercomplexes with different antenna size were purified from grana membranes upon mild detergent solubilization followed by sucrose gradient ultracentrifugation. Twelve different fractions were obtained and their protein composition determined by SDS page (not shown, Caffarri et al. in preparation).
The data show that fractions 8 to 11 contain Photosystem II supercomplexes with increased antenna size. This result was confirmed by the analysis of the absorption spectra of the individual bands at RT (figure 1) which showed an increase in the absorption of Chl b going from band 8 to band 11, indicating an increase of the amount of LHC complexes in the different fractions. The absorption spectra of the supercomplexes could be fitted with the spectra of LHCII trimer, PSII dimeric core, LHCII-CP29-CP24 complex and a sucrose gradient fraction containing Lhc monomeric antenna enriched in CP26 (figure 1). Supramolecular organization of the complexes was determined by biochemical and electron microscopy and single particle average analysis. The results of these analyses are presented in figure 2 as cartoons. Band 8 contains mainly C2S supercomplexes (90%) and a small fraction of C2M complexes (10%). Band 9 is a mixture (50:50) of C2S2 and C2SM. Band 10 contains C2S2M and band 11 C2S2M2, the largest supercomplex observed in Arabidopsis thaliana. Note that the structure of this supercomplex was used before for modeling the fluorescence kinetics of BBY particles [11]. The data are summarized in table 1 where also the minor antenna complex composition is given.

Chapter 4
77
Figure 1, Absorption spectra (in black) of the different supercomplex fractions are shown together with the fitted spectra (in red) using as a basis set the absorption of different components of PSII: LHCII trimers (green), PSII core (dark blue), a small supercomplex containing LHCII M trimer/CP29/CP24 (light blue) and a gradient fraction enriched in CP26 (violet). The Lhc/PSII monomeric core ratio and the Chls a/b ratio found by biochemical analyses and fitting of the absorption spectra are indicated.
Table 1, Protein composition and supramolecular organization of the supercomplexes of the sucrose gradient bands. Number of light-harvesting complexes is given per RC.
composition LHCII S LHCII M CP29 CP26 CP24
B8 90% C2S + 10% C2M 0.45 0.05 0.5 0.45 0.05
B9 50% C2S2 + 50% C2SM 0.75 0.25 0.75 0.75 0.25
B10 100% C2S2M 1 0.5 1 1 0.5
B11 100% C2S2M2 1 1 1 1 1
400 500 600 700
0.0
0.2
0.4
0.6
0.8
1.0
1.2
1.4
1.6
400 500 600 700
0.0
0.2
0.4
0.6
0.8
1.0
1.2
1.4
1.6
400 500 600 700
0.0
0.2
0.4
0.6
0.8
1.0
1.2
1.4
1.6
400 500 600 700
0.0
0.2
0.4
0.6
0.8
1.0
1.2
1.4
1.6
FittingLhc/PSII mon Chls a/b3.09 4.32
BiochemistryLhc/PSII mon Chls a/b3 4.32
abs
wavelength (nm)
B8 fitting LHCII trimer PSII core LHCII-CP29-CP24 CP26
FittingLhc/PSII mon Chls a/b4.92 3.30
BiochemistryLhc/PSII mon Chls a/b4.75 3.09
abs
wavelength (nm)
B9 fitting LHCII trimer PSII core LHCII-CP29-CP24 CP26
FittingLhc/PSII mon Chls a/b6.91 2.74
BiochemistryLhc/PSII mon Chls a/b7 2.53
abs
wavelength (nm)
B10 fitting LHCII trimer PSII core LHCII-CP29-CP24 CP26
FittingLhc/PSII mon Chls a/b8.11 2.52
BiochemistryLhc/PSII mon Chls a/b9 2.28
abs
wavelength (nm)
B11 fitting LHCII trimer PSII core LHCII-CP29-CP24 CP26

Supercomplexes
78
Figure 2, Membrane organization of PSII supercomplexes in the isolated fractions B8, B9, B10 and B11. Bars represent putative energy transfer links between the light-harvesting complexes. Charge separation occurs in the light yellow reaction centers (D1/D2), and together with the yellow CP43 and CP47 they form the core complex (C). The minor antenna complexes in light green are CP29, CP26 and

Chapter 4
79
CP24. The major antenna complex LHCII are dark green and form trimers that are strongly (S) or moderately (M) bound to the supercomplexes. B8 consist for 90% out of C2S supercomplexes and 10% C2M, B9 is a 50:50 distribution of C2S2 and C2SM, B10 and B11 are pure C2S2M and C2S2M2 supercomplexes respectively.
Time-resolved fluorescence (TCSPC) measurements were performed on fractions B8, B9, B10 and B11 in a solution containing 0.01% α-DM, and the results are given in figure 3.
0.0 0.5 1.0 1.5 2.0 2.5 3.0
0.1
1
log(
fluor
esce
nce)
, au
Time, ns
C2S C2S2 / C2SM C2S2M C2S2M2
Figure 3, Fluorescence decay curves of supercomplexes upon 420 nm excitation measured at 13 0C in the presence of 0.01 α-DM.
With the increase of the size of the supercomplexes the fluorescence decay becomes progressively slower. The kinetics can well be described as a sum of four exponential decays in all cases and the fitting results are given in table 2. It should be noted that these fits are not unique and the individual components do not necessarily correspond to specific physical processes [21]. In all cases a component of around ~3 ns is observed and its amplitude increases somewhat (from 5 to 8%)

Supercomplexes
80
upon increasing the size of the supercomplex. In principle, this component can be due to either some badly connected LHCs, completely disconnected LHCs, free Chl or closed RCs. Whatever the exact origin is, this component can be discarded below. The average fluorescence lifetimes that are also presented in table 2, are calculated without including the contribution of the 3 ns component.
Table 2, Fluorescence decay fitting results for 420 nm excitation of samples containing 0.01% α-DM (decay curves in figure 2). Average lifetimes are calculated from the first three lifetimes, according to
∑∑ ⋅=−=
iii
iAVG ααττ /31
Table 2b, Fluorescence decay fitting results for 420 nm excitation of samples containing 0.001% α-DM
136 psτavg119 psτavg115 psτavg103 psτavg
3.5%2348 ps2.3%2335 ps2.2%2262 ps1.9%2223 ps
15.9%377 ps12.9%379 ps12.5%377 ps10.4%382 ps
53.0%120 ps48.3%120 ps49.0%114 ps48.4%108 ps
27.6%27 ps36.5%25 ps36.3%25 ps39.3%24 ps
420 nmB11420 nmB10420 nmB9 420 nmB8
136 psτavg119 psτavg115 psτavg103 psτavg
3.5%2348 ps2.3%2335 ps2.2%2262 ps1.9%2223 ps
15.9%377 ps12.9%379 ps12.5%377 ps10.4%382 ps
53.0%120 ps48.3%120 ps49.0%114 ps48.4%108 ps
27.6%27 ps36.5%25 ps36.3%25 ps39.3%24 ps
420 nmB11420 nmB10420 nmB9 420 nmB8
159 psτavg149 psτavg142 psτavg123 psτavg
8.0%3215 ps7.0%3256 ps6.1%3201 ps4.6%2989 ps
16.2%439 ps15.7%421 ps14.9%421 ps13.8%393 ps
48.7%137 ps50.2%128 ps48.6%127 ps48.8%112 ps
27.1%31 ps27.0%30 ps30.4%29 ps32.7%25 ps
420 nmB11420 nmB10420 nmB9 420 nmB8
159 psτavg149 psτavg142 psτavg123 psτavg
8.0%3215 ps7.0%3256 ps6.1%3201 ps4.6%2989 ps
16.2%439 ps15.7%421 ps14.9%421 ps13.8%393 ps
48.7%137 ps50.2%128 ps48.6%127 ps48.8%112 ps
27.1%31 ps27.0%30 ps30.4%29 ps32.7%25 ps
420 nmB11420 nmB10420 nmB9 420 nmB8

Chapter 4
81
0.0 0.5 1.0 1.5
0.1
1
log(
fluor
esce
nce)
, au
Time, ns
C2S C2S2 / C2SM C2S2M C2S2M2
Figure 4, Fluorescence decay curves of supercomplexes upon 420 nm excitation measured at 13 0C in the presence of 0.001 α-DM.
The measurements were repeated in the presence of 0.001% α-DM because in the case of BBY preparations, detergent is only used for the isolation of the BBY particles but it is absent in the final preparations that are studied with time-resolved fluorescence [21, 22]. The decay curves in the presence of 0.001% α-DM are given in figure 4 and the fitting results are presented in table 2. Again, increasing the size of the complexes leads to slowing down of the fluorescence kinetics, and the decay curves can be satisfactorily fitted with the sum of 4 exponential decays in all cases. For all preparations (B8-11) the presence of 0.001% α-DM leads to somewhat faster kinetics than in the presence of 0.01% α-DM and this is illustrated for a few cases in figure 5.
The amplitude of the slowest component has decreased substantially, now being only ~2%. The average values of the three fastest lifetimes are given in table 2.

Supercomplexes
82
0.0 0.5 1.0
1
log(
fluor
esce
nce)
, au
Time, ns
C2S (0.01 α DM) C2S2M2 (0.01 α DM) C2S (0.001 α DM) C2S2M2 (0.001 α DM)
Figure 5, Fluorescence decay curves of supercomplexes upon 420 nm excitation measured at 13 0C. Black and light grey traces correspond to C2S supercomplexes with 0.01 and 0.001 α-DM concentration, respectively. Dark blue and light blue correspond to C2S2M2 supercomplexes with 0.01 and 0.001 α-DM concentration, respectively.
The average lifetime for all preparations both in 0.01% α-DM and 0.001% α-DM are plotted vs. the number of Chl a molecules in figure 6. In the same figure the average lifetime obtained for BBY particles after excitation at 420 nm is indicated, taking 2.45 LHCII trimers per reaction center [22], i.e. 111 Chls a per RC. The figure shows that the results on BBY complexes are more or less in line with those on the supercomplexes in 0.001% α-DM. The observed difference between the two detergent concentrations and the fact that the lifetimes of the supercomplexes measured in low detergent are more similar to that of the BBY membranes can be due to the influence of the overall packing on the structure of the individual supercomplexes. Indeed in the BBY membranes the individual PSII

Chapter 4
83
supercomplexes are packed together and they form microscrystalline arrays [11]. Moreover, the ratio proteins/lipids in these membranes is extremely high. In the presence of DM above the critical micelle concentration (CMC), PSII is present as isolated complexes, surrounded by detergent [29]. Lowering the amount of detergent leads to a packing of several complexes together, a condition that is similar to the one occurring in the membrane. It is likely that the packing has an effect on the overall organization of the system resulting in a better connection between the individual subunits in the supercomplex and thus in a faster migration of the excitation energy. Note that the observed effect is not due to aggregation because no new lifetimes are created in these conditions, but only a slight decrease of all lifetimes is observed.

Supercomplexes
84
50 60 70 80 90 100 110100
110
120
130
140
150
160
Ave
rage
Life
time,
ps
Number of chlorophyll molecules
0.01% αDM 0.001% αDM BBY
Figure 6 The average lifetimes for all preparations with 420 nm excitation vs. the number of Chl a molecules. Black squares correspond to the average lifetimes of B8, B9, B10 and B11 in the presence of 0.01% α-DM. Round open circles correspond to the average lifetimes of B8, B9, B10 and B11 in the presence of 0.001% α-DM. Dashed lines are linear fits through the 0.01% and 0.001% α-DM points. The open triangle is the average lifetime of BBYs obtained with 420 nm excitation [22].
In [21] the fluorescence kinetics of BBY preparations were fitted with a coarse-grained model, yielding an average excitation energy hopping rate between individual light-harvesting complexes, a rate constant that reflects primary charge separation, a secondary charge separation rate, and a drop in free energy ∆G upon charge separation. However, it was assumed that the organization is the same as the one that was now found to be associated with supercomplex B11. The linear relation between the number of Chls and the average fluorescence lifetime

Chapter 4
85
presented in figure 6 implies that the BBY fluorescence decay kinetics should be scaled down a bit (shifting along the 0.001% α-DM line in figure 6). This leads to minor adjustments of the decay kinetics and thus also of the obtained rate constants in [22]. They all become ~9% faster. Note that ∆G remains the same, since it only depends on fluorescence amplitudes and not on fluorescence lifetimes. It should be noted that the straight lines in figure 6 do not pass through the point (0, 0). This observation will require further analysis in the future.
Acknowledgements
This work is part of the research programme of the ‘Stichting voor Fundamenteel Onderzoek der Materie (FOM)’, which is financially supported by the ‘Nederlandse Organisatie voor Wetenschappelijk Onderzoek (NWO)’.

Supercomplexes
86
References
[1] H. van Amerongen, J.P. Dekker. in (Green, B.R. and Parson, W.W., eds.) Light-Harvesting Antennas in Photosynthesis, Kluwer Academic Publishers 2003, pp. 219-251.
[2] B. Loll, J. Kern, W. Saenger, A. Zouni, J. Biesiadka, Towards complete cofactor arrangement in the 3.0 Å resolution structure of photosystem II, Nature 438 (2005) 1040-1044.
[3] L. Shi, W.P. Schröder, The low molecular mass subunits of the photosynthetic supracomplex, photosystem II, Biochimica et Biophysica Acta (BBA) - Bioenergetics 1608 (2004) 75-96.
[4] S. Jansson, A guide to the Lhc genes and their relatives in Arabidopsis, Trends in Plant Science 4 (1999) 236-240.
[5] Z. Liu, H. Yan, K. Wang, T. Kuang, J. Zhang, L. Gui, X. An, W. Chang, Crystal structure of spinach major light-harvesting complex at 2.72 Å resolution, Nature 428 (2004) 287-292.
[6 D. Sandona, R. Croce, A. Pagano, M. Crimi, R. Bassi, Higher plants light harvesting proteins. Structure and function as revealed by mutation analysis of either protein or chromophore moieties, Biochimica et Biophysica Acta (BBA) - Bioenergetics 1365 (1998) 207-214.
[7] H. van Amerongen, R. Croce, Structure and Function of Photosystem II, The Royal Society of Chemistry, Cambridge, 2008.
[8] J.M. Anderson, B. Andersson, The dynamic photosynthetic membrane and regulation of solar energy conversion, Trends in Biochemical Sciences 13 (1988) 351-355.
[9] E.J. Boekema, H. Van Roon, F. Calkoen, R. Bassi, J.P. Dekker, Multiple types of association of photosystem II and its light-harvesting antenna in partially solubilized photosystem II membranes, Biochemistry 38 (1999) 2233-2239.
[10] A.E. Yakushevska, P.E. Jensen, W. Keegstra, H. Van Roon, H.V. Scheller, E.J. Boekema, J.P. Dekker, Supermolecular organization of photosystem II

Chapter 4
87
and its associated light-harvesting antenna in Arabidopsis thaliana Eur. Biophys. J. 268 (2001) 6020-6028.
[11] J.P. Dekker, E.J. Boekema, Supramolecular organization of thylakoid membrane proteins in green plants, Biochim. Biophys. Acta 1706 (2005) 12-39.
[12] T.A. Roelofs, C.-I. Lee, A.R. Holzwarth, Global target analysis of picosecond chlorophyll fluorescence kinetics from pea chloroplasts – a new approach to the characterization of the primary processes in photosystem II alpha-units and beta-units, Biophys. J 61 (1992) 1147-1163.
[13] A.M. Gilmore, T.L. Hazlett, P.G. Debrunner, Govindjee, Photosystem II chlorophyll a fluorescence lifetimes and intensity are independent of the antenna size differences between barley wild-type and chlorina mutants: Photochemical quenching and xanthophyll cycle-dependent nonphotochemical quenching of fluorescence, Photosynth. Res 48 (1996) 171-187.
[14] S. Vasil'ev, S. Wiebe, D. Bruce, Non-photochemical quenching of chlorophyll fluorescence in photosynthesis. 5-hydroxy-1,4-naphthoquinone in spinach thylakoids as a model for antenna based quenching mechanisms, Biochim. Biophys. Acta 1363 (1998) 147-156.
[15] G.H. Schatz, H. Brock, A.R. Holzwarth, Picosecond kinetics of fluorescence and absorbance changes in photosystem II particles excited at low photon density, Proc. Natl. Acad. Sci. USA 84 (1987) 8414-8418.
[16] G.H. Schatz, H. Brock, A.R. Holzwarth, Kinetic and energetic model for the primary processes in photosystem II, Biophys. J 54 (1988) 397-195.
[17] R. van Grondelle, Excitation-energy transfer, trapping and annihilation in photosynthetic systems, Biochim. Biophys. Acta 811 (1985) 147-195.
[18] V. Barzda, V. Gulbinas, R. Kananavicius, V. Cervinskas, H. van Amerongen, R. van Grondelle, L. Valkunas, Singlet-singlet annihilation kinetics in aggregates and trimers of LHCII, Biophysical J. 80 (2001) 2409-2421.

Supercomplexes
88
[19] H. van Amerongen, R. van Grondelle, Understanding the energy transfer function of LHCII, the major light-harvesting complex of green plants, J. Phys. Chem. B 105 (2001) 604-617.
[20] R.C. Jennings, G. Elli, F.M. Garlaschi, S. Santabarbara, G. Zucchelli, Selective quenching of the fluorescence of core chlorophyll-protein complexes by photochemistry indicates that Photosystem II is partly diffusion limited, Photosynth. Res 66 (2000) 225-233.
[21] K. Broess, G. Trinkunas, C.D. van der Weij-de Wit, J.P. Dekker, A. van Hoek, H. van Amerongen, Excitation Energy Transfer and Charge Separation in Photosystem II
Membranes Revisited, Biophysical J. 91 (2006) 3776-3786.
[22] K. Broess, G. Trinkunas, A. van Hoek, R. Croce, H. van Amerongen, Determination of the excitation migration time in Photosystem II: Consequences for the membrane organization and charge separation parameters, Biochimica et Biophysica Acta (BBA) - Bioenergetics 1777 (2008) 404-409.
[23] D.A. Berthold, G.T. Babcock, C.F. Yocum, A highly-resolved, oxygen-evolving photosystem II preparation from spinach thylakoid membranes, FEBS Lett 134 (1981) 231-234.
[24] H. Schagger, Tricine-SDS-PAGE, Nat. Protocols 1 (2006) 16-22.
[25] O.J.G. Somsen, A. van Hoek, H. van Amerongen, Fluorescence quenching of 2-aminopurine in dinucleotides, Chem. Phys. Lett 402 (2005) 61-65.
[26] B. van Oort, A. Amunts, J.W. Borst, A. van Hoek, N. Nelson, H. van Amerongen, R. Croce, Picosecond fluorescence of intact and dissolved PSI-LHCI crystals, Biophys. J (2008) in press.
[27] A.V. Digris, V.V. Skakoun, E.G. Novikov, A. Van Hoek, A. Claiborne, A.J.W.G. Visser, Thermal stability of a flavoprotein assessed from associative analysis of polarized time-resolved fluorescence spectroscopy, Eur. Biophys. J. 28 (1999) 526-531.
[28] E.G. Novikov, A. van Hoek, A.J.W.G. Visser, H.J. W., Linear algorithms for stretched exponential decay analysis, Opt. Commun. 166 (1999) 189-198.

Chapter 4
89
[29] I.M. Folea, P. Zhang, E.-M. Aro, E.J. Boekema, Domain organization of photosystem II in membranes of the cyanobacterium Synechocystis PCC6803 investigated by electron microscopy, FEBS Letters 582 (2008) 1749-1754.

Supercomplexes
90

Chapter 5
Applying Two-Photon Excitation
Fluorescence Lifetime Imaging
Microscopy to Study Photosynthesis in
Plant Leaves

FLIM in Plant Leaves
92
Abstract In this study it is investigated to which extent two-photon excitation (TPE) fluorescence lifetime imaging microscopy (FLIM) can be applied to study picosecond chlorophyll (Chl) fluorescence kinetics of individual chloroplasts in leaves. With the use of femtosecond TPE at 860 nm it appears to be possible to measure fluorescence lifetimes throughout the entire leaves of Arabidopsis thaliana and Alocasia wentii. It turns out that the excitation intensity can be kept sufficiently low to avoid artifacts due to singlet-singlet and singlet-triplet annihilation, while the reaction centers can be kept in the open state (the so-called F0 state) during the measurements. The Fm state, corresponding to a state in which all reaction centers are closed, is induced by vacuum infiltration of the leaves with a buffer containing 3-(3,4-dichloro-phenyl)-1,1-dimethyl-urea (DCMU). The average fluorescence lifetimes obtained for individual chloroplasts of Arabidopsis thaliana and Alocasia wentii in the open and closed state, are approximately ~250 ps and 1.5 ns, respectively. These results are similar to in vitro results reported in literature and to results of isolated chloroplasts obtained with the current FLIM setup. The average fluorescence lifetimes appear to be the same for individual chloroplasts in the top, middle and bottom layer of the leaves. It was also investigated to which extent it is possible to spatially resolve the grana stacks, containing mainly photosystem II (PSII), and the stroma lamellae, containing mainly photosystem I (PSI), making use of the fact that the average fluorescence lifetime of PSI is below 100 ps, while that of ‘closed’ PSII is in the nanosecond range. With the resolution of ~500 nm in the focal (xy) plane and 2 µm in the z direction it appeared to be impossible to fully resolve grana stacks or stroma lamellae, but variations in the relative contributions of PSI and PSII fluorescence on a pixel-to-pixel base could be observed. The present results open up the possibility to use fluorescence lifetime imaging microscopy (FLIM) for the in vivo study of the primary processes of photosynthesis at the level of single chloroplasts under all kinds of (stress) conditions.
Based on: Koen Broess, Jan Willem Borst, Herbert van Amerongen. Applying two-photon excitation fluorescence lifetime imaging microscopy to study photosynthesis in plant leaves. Submitted.

Chapter 5
93
Introduction All photosynthetic organisms contain thylakoid membranes to convert solar energy into high-energy molecules like ATP and NADPH which are used to fix carbon in energy-rich molecules that are used for reproduction, growth and maintenance. The thylakoids contain the membrane-protein complexes called photosystem I (PSI), photosystem II (PSII), cytochrome b6/ƒ and F-ATPase, which are the major players in oxygenic photosynthesis [1-3]. PSI and PSII both contain a reaction center which is surrounded by a large “antenna”, which consists of light-harvesting pigment-protein complexes. The chlorophylls (Chls) and other pigments in the antenna harvest light and funnel a large part of the corresponding energy to the reaction center in which charge separation takes place. In most plants and some green algae the thylakoid membrane is differentiated into grana stacks and stroma lamellae (figure 1) [3-5]. Other classes of photosynthetic organisms have their own unique membrane stacking which is considerably different from that of higher plants [6]. The dominant antenna species of PSII in higher plants is light-harvesting complex II (LHCII) which is not only important for ‘harvesting light’, but it also plays a role in nonphotochemical quenching [7, 8] and it is essential for grana stacking [9]. PSI contains a large part that sticks out of the membrane and does not fit into the inner stacks of the grana. This leads to a separation of the two photosystems (figure 1) [3]. This separation is thought to allow the regulation of ATP production, by balancing the linear and cyclic electron transport [10, 11] and to avoid ‘spill-over’. In higher plants about ~85% of PSII is located in the grana and about ~15% is present in the stroma lamellae (figure 1). On the other hand, it was reported that PSI is located for about ~36% in the grana end membranes and about ~64% in the stroma lamellae [12]. These percentages are not fixed but can differ between plant species and they depend on growth conditions. However, the relative proportion of stroma lamellae and grana is rather constant [12]. The opposite is true for the number of layers in a single granum. Plants like Alocasia that are grown in low-light intensities can have more than 50 layers in one granum, which can extend across the whole chloroplast [13], whereas most other plants have only ~10 till 20 layers. However, the diameter of the disc layer in the grana is more or less constant among plant species (300-600 nm) [3, 5]. Plants keep the ratio of grana and stroma lamellae constant by fusing membranes [12]. With the decrease of light intensity

FLIM in Plant Leaves
94
the amount of LHCII per PSII increases, whereas the PSII/ PSI ratio decreases. The PSII/PSI reaction centers (RCs) ratio for Alocasia in low-light conditions of 10 µmol photons m-2 s-1 is 1.43 [14]. In the present study the same low-low light growing conditions are used (see Materials and Methods). The Alocasia plant was used in many chloroplast visualization studies because of its giant grana stacks [4, 13, 14].
Figure 1, Schematic model of the thylakoid membrane. The margins are the strongly curved membranes, the end membranes are located at the bottom and the top of the grana stack and the stroma lamella is the non-stacked region. The best noninvasive optical imaging technique for measuring photosynthetic systems in leaves is multiphoton fluorescence microscopy, because it allows imaging up to a depth of 500 µm in living plant tissue [15, 16]. The leaves of Arabidopsis thaliana and Alocasia wentii are 200 µm and 300 µm thick respectively, and suitable for complete scanning by FLIM with two-photon excitation (TPE) at 860 nm. In contrast, one-photon excitation (OPE) microscopy only allows imaging up to a depth of ~100 µm [15, 17]. Two-photon (nonlinear) microscopy depends on the simultaneous (within ~10-16 s) interaction of two photons with a molecule, resulting in a quadratic dependence of light absorption on light intensity as opposed to the linear dependence of one-photon fluorescence
Margins
End membrane
Stroma lamellae
Grana

Chapter 5
95
microscopy. For pigment molecules like chlorophylls (Chl) and carotenoids (Car) the two-photon absorption spectra are significantly different from their one-photon counterparts, but the emission spectra are in general identical [18]. For Chls and Cars the TPE spectra are only partially known. For LHCII the TPE spectrum was measured in the region from 1000 to 1600 nm, ‘corresponding’ to one-photon wavelengths of 500-800 nm [19]. This work combines microscopy with fluorescence lifetime measurements to investigate to which extent it is possible to study the primary steps in photosynthesis in living tissue and to determine at which spatial time resolution this is possible. This should be considered as an intermediate step towards studying these primary events in vivo under a variety of (stress) conditions. In the present study the two-photon absorption of 860 nm light is used for excitation. The instrument response function (IRF) of the FLIM setup is 25 ps [20]. Because carotenoids and Chl b transfer most of their excitation energy to Chl a in less than one ps [21-28]only fluorescence from Chl a is observed [29]. In this study we focus on detecting the fluorescence lifetimes of Chl in PSI and PSII in intact leaves, both in low-light conditions and in conditions in which the PSII reaction centers are closed by DCMU. The shade plant Alocasia wentii is used to make it easier to try to spatially resolve the different photosystems, because it is known to form giant grana stacks [12, 13]. Moreover, Arabidopsis thaliana is studied because it is widely used as one of the model organisms in plant sciences. Materials and Methods Fluorescence Lifetime Imaging Microscopy Multiphoton imaging was performed on a multiphoton dedicated Biorad Radiance 2100 MP system, coupled to a Nikon TE300 inverted microscope [30]. A tunable Ti-Sapphire laser (Coherent Mira) was used as an excitation source which was pumped with a 5 Watt (Coherent) Verdi laser, resulting in excitation pulses of ~ 200 fs at a repetition rate of 76 MHz. In the beam-conditioning unit (BCU) the excitation power was tuned by a pockell cell. The laser beam was collimated in the scanhead and focused by a Nikon 60x water immersion Apochromat objective lens

FLIM in Plant Leaves
96
(NA 1.2) into the sample. The fluorescence was detected by non-descanned direct detectors (NDD), which were coupled to the sideport of the microscope. Using this type of detection the loss of fluorescence light was reduced and 3-5 times more signal was obtained compared to internal detectors. The emission light was split into two channels using a dichroic mirror filter wheel. FLIM measurements were performed by directing the fluorescence via a secondary dichroic (770DCXR, Chroma Technology Corp.) into a Hamamatsu R3809U photomultiplier, operated at 3.1 kV. Fluorescence was selected using a dichroic (FF 495 – DiO2, Semrock) and 2x a bandpass filter (HQ700 / 75, Chroma Technology Corp). In the excitation branch a longpass filter (RG 780 3mm, Schott) was used for reduction of the excitation light. The multichannel-plate photomultiplier allows single photon detection at high time-resolution, with an IRF of 25 ps (van Oort in press [20]). The output of the detector was coupled to a Becker & Hickl single photon counting module (SPC 830) [31]. The signal from the Hamamatsu triggers the START of the time ramping for the time correlated single photon counting (TCSPC). The pulses from the Ti-Sapphire laser serve as the SYNC signal in order to stop the time ramping and allowing the timing of the arrival of the fluorescent photons. The time window (ADC) was set to 1024 channels and typically fluorescence was recorded for 2 minutes at a photon count rate of approximately 20 kHz. The signal from the PMT is combined with the pixel clock and line predivider signals from the Biorad scanhead to create 2D lifetime images. Growth Condition and Sample Preparation Arabidopsis was grown in growth chambers of 23 0C with 16 hours of light at a light intensity of 60-100 µE m-2 s-1. Alocasia was grown at room temperature with 16 hours of low light intensities of 10-15 µE m-2 s-1 . For closing reaction centers of PSII in leaves a vacuum infiltration was performed with 0.1 mM DCMU 20 mM Hepes, 5 mM NaCl and 5 mM MgCl2 buffer with pH 7.5. Isolation of chloroplasts: Alocasia wentii leaves were ground in semi-frozen buffer 1 (0.45 M sorbitol, 20 mM Tricine, 10 mM EDTA, 10 mM NaHCO3 and 0.1% BSA, pH 8.4) using a blender for five seconds and then filtrated through 8 layers of cheesecloth and centrifuged at 3000 g for 20 s at 4 0C. Supernatant was discarded and pellet washed with buffer 2 ( 0.3 M Sorbitol, 20mM Tricine, 5 mM MgCl2 and

Chapter 5
97
2.1 mM EDTA, pH 7.4). The collected resuspended chloroplasts were put on 50% Percoll / 50% buffer 3 ( 0.6 M Sorbitol, 20 mM Tricine and 5 mM MgCl2, pH 7.6) and centrifuged at 3500 g for 10 minutes at 4 0C. The supernatant was disposed and the pellet was diluted in buffer 2 before measuring. Results and discussion It has been demonstrated that FLIM can be a noninvasive tool [32, 33] for measuring Chl a fluorescence lifetimes in plants and algae and correlating them to the response of the photosynthetic apparatus to for instance the effect of dehydration. However, measurements have only been performed under high-light conditions at maximum fluorescence level (FM) and average lifetimes were found to be 1.7 ns ± 0.2 ns [32] and 611 ps [33], corresponding to lifetimes of PSII with (partially) closed reaction centers. With the FLIM setup used in the present study it is possible to measure under low-light conditions. In figure 2 two images with 1024 pixels are presented of Alocasia wentii chloroplasts. The presented fluorescence images are intensity-based, but also the fluorescence kinetics is obtained for each pixel and were analyzed with a combination of SPCimage2.3 software (Becker & Hickl) and home-built software using a exponential decay model [34-36]. The fitted chloroplast fluorescence lifetimes and amplitudes averaged over all pixels of figure 2b are as follows: τ1 = 59.5 ps (44.1%), τ2 = 205 ps (35.3%) and τ3 = 588 ps (20.6%). Scanning at different depths in the leaf did not result in different average lifetimes or different amplitudes. Figures 2 a and b are intensity-based images with a linear grey scale. Pixels with zero fluorescence counts are dark and pixels with maximum fluorescence are white. The chloroplasts in figure 2b appear to be heterogeneous and small white dots can be observed within the chloroplast. Similar heterogeneity was observed earlier in microscope measurements [4, 37, 38], and it is likely that the white spots correspond to the grana stacks. The Chl concentration is higher in the grana and moreover, they contain mainly PSII, which leads to more fluorescence than PSI because of the longer fluorescence lifetimes. It is known from TPE FLIM measurements on LHCII aggregates [39] that pulse repetition rates of more than 1 MHz can lead to the shortening of fluorescence lifetimes of photosynthetic systems because of excitation quenching by Car and

FLIM in Plant Leaves
98
Figure 2, Room temperature fluorescence intensity-based image (1024 pixels) with a linear grey scale as measured with FLIM. The chloroplasts in Alacosia wentii leaves are excited with TPE at 860 nm and detected with a bandpass filter centered at 700 nm and with a bandwidth of 75 nm. For each pixel a fluorescence decay trace is measured. The average lifetimes and amplitudes in the 1024 pixels in this image are: τ1 59.5 ps (44.1%), τ2 205 ps (35.3%) and τ3 588 ps (20.6%). Chl triplets (singlet-triplet annihilation). Moreover, singlet-singlet annihilation can occur, also leading to a shortening of the lifetime [40]. Since the number of triplets formed is expected to increase upon increasing the number of excitations, the fluorescence lifetimes were measured as a function of laser intensity. In figure 3, three decay traces are presented that were obtained at 150, 330 and 1600 µW (laser power measured directly at the sample holder of the setup). The 150 and 330 µW decay traces are identical after normalization at the top, whereas the 1600 µW trace is substantially faster. It should be noted that the initial number of excitations for TPE scales quadratically with the light intensity and thus the number of excitations
20.3 µm
1.57 µm
20.3 µm
1.57 µm

Chapter 5
99
increases by a factor of 4.8 when going from 150 to 330 µW. Therefore, the results clearly demonstrate the absence of singlet-triplet (and singlet-singlet) annihilation at relatively low intensities. By using extremely high powers of 1600 µW the RCs are closed, but the kinetics is faster, which is ascribed to a combination of singlet-singlet and singlet-triplet annihilation.
1.5 2.0 2.50.01
0.1
1
log(
fluor
esce
nce)
, au
Time, ns
150 µW 330 µW 1600 µW
Figure 3, Room temperature fluorescence decay traces (measured with FLIM) of chloroplasts in Arabidopsis thaliana leaves. The chloroplasts are excited with TPE at 860 nm and detected with a bandpass filter centered at 700 nm with a bandwidth of 75 nm. Identical traces are observed for chloroplasts with laser powers of 150 µW (black squares) and 330 µW (red open circles) and correspond to PSII with open reaction centers. The green open triangles represent a decay trace obtained with a laser power of 1600 µW which is faster than the black and red decay traces due to annihilation processes.

FLIM in Plant Leaves
100
The fluorescence decay traces of isolated chloroplasts were also measured with FLIM and compared to those of leaf tissue (figure 4). The in vivo fluorescence kinetics of chloroplasts are similar to those of the isolated chloroplasts for the first 170 ps part of the trace. There is a small discrepancy in the middle part of the trace, but overall the traces are nearly identical. The chloroplasts were isolated with percoll and are smaller in size (not shown) than the chloroplasts in leaves.
1.6 1.8 2.0 2.2 2.4 2.6 2.80
1
log(
fluor
esce
nce)
, au
Time, ns
In vivo In vitro
Figure 4 Room temperature fluorescence decay traces (measured with FLIM). The chloroplasts in Alocasia wentii are excited with TPE at 860 nm and detected with a bandpass filter centered at 700 nm with a bandwidth of 75 nm. Round open circles are isolated chloroplasts (In vitro) with an average lifetime of 180 ps. Black squares correspond to chloroplasts in leaves (In vivo) with an average lifetime of 212 ps.

Chapter 5
101
Figure 5. Room temperature fluorescence decay traces (measured with FLIM). The chloroplasts in Arabidopsis thaliana leaves are excited with TPE at 860 nm and are detected with a bandpass filter of centered at 700 nm with a bandwidth of 75 nm. Black squares represent a ‘normal’ fluorescence decay trace of chloroplasts in an Arabidopsis leaf with an average lifetime of 290 ps. Round open circles represent a fluorescence decay trace of a vacuum infiltrated leaf with a 0.1 mM DCMU buffer with an average lifetime of 1.3 ns. In order to try to distinguish between PSI and PSII in the microscopic images, the difference in fluorescence lifetimes between the two photosystems was increased by closing the reaction centers of PSII by vacuum infiltration of Arabidopsis thaliana with 0.1 mM DCMU in 20 mM Hepes, 5 mM NaCl and 5 mM MgCl2 buffer with pH 7.5. The average lifetime for the leaf infiltrated with DCMU is 1.3 ns (figure 5) whereas for ‘normal’ leaves the average lifetime is 290 ps. Both photosystems are separated in space and have substantially different lifetimes in the presence of DCMU [33, 41, 42], because the average lifetime of PSI with antenna complexes is reported to be ~60 ps [20, 43] and that of closed PSII is ~1.5 ns [41]. This is visible in the traces and images of the chloroplasts of Alocasia wentii in figure 6. The expectation is that pixels with more grana stacks have a higher intensity compared to pixels with relatively more stroma lamellae [37]. In
1 2 3 4 5 6 7 8 9
log
(flu
ore
scen
ce),
au
Time, ns
Normal DCMU

FLIM in Plant Leaves
102
figure 6b the fluorescence kinetics of 10 high-intensity pixels (white) are compared with those of 10 low-intensity pixels (grey). The 10 high- and low-intensity pixels have 623 (266342) and 541(195833) counts in the peak (and total number of fluorescence counts), respectively. The global fitting results with linked lifetimes and independent amplitudes are τ1 = 116 ps (53.3%, 59.6%), τ2 = 1027 ps (35.1%, 29.5%) and τ3 = 3957 ps (11.6%, 10.9%). The first amplitude for each lifetime refers to the high-intensity pixels and the second amplitude to the low-intensity pixels. The first lifetime of 116 ps probably reflects a mixture of PSI and open PSII reaction centers[29, 44], because Alocasia grown under low-light conditions have a PSII / PSI RCs ratio of 1.43 [14]. This corresponds to 59% Chl of PSII and 41% Chl of PSI. If all PSII is closed, on might expect 59% Chl contribution of slow lifetimes and 41% of fast lifetime. The amplitudes of the lifetime of 116 ps for both groups of pixels is more than 41%, so the conclusion should be that not all PSII reaction centers are closed by the DCMU. The two slow lifetimes of ~1 ns and ~4 ns must correspond to closed PSII reaction centers, because these lifetimes are absent for open RCs. The 6.3% difference in the amplitude of the slow lifetimes for the high- and low-intensity pixels is probably caused by the fact that the high-intensity pixels comprise more PSII than PSI. This is expected because the grana, where PSII is concentrated, have a higher chlorophyll concentration per pixel than the stroma lamellae. There are two explanations for the lifetime differences in the pixel groups: (i) The DCMU buffer is not penetrated evenly in every part of the chloroplasts which results in different lifetimes and intensities for each pixel; (ii) In one pixel group there are more grana than in the other pixel group which will also result in different lifetimes and intensities for each pixel. In figure 6b the intensity of the different pixels seem to have a random distribution in the chloroplast, which is not expected as a result of varying penetration of the DCMU buffer. The differences in lifetimes for the two pixel groups can thus best be explained by pixels with more or less grana, but a DCMU penetration effect cannot be ruled out completely. Whatever the real reason may be, it appears to be very difficult to distinguish between regions with more or less grana. For Arabidopsis thaliana leaves it appeared not to be possible at all to resolve variations in lifetimes between pixels, which is probably due to the fact that for Arabidopsis thaliana the grana stacks are smaller than those of Alocasia wentii.

Chapter 5
103
Figure 6a Room temperature fluorescence decay traces (measured with FLIM) of chloroplasts in Alocasia wentii leaves excited with TPE at 860 nm detected with a bandpass filter centered at 700 nm with a bandwidth of 75 nm. The leaves are vacuum infiltrated with a 0.1 mM DCMU buffer for closing the PSII reaction centers. The black (1) trace with its fit corresponds to the summed fluorescence decay of 10 white (high) pixels from the chloroplast in the intensity-based image in figure 6b. The blue (2) trace with its fit corresponds to the summed fluorescence decay of 10 grey (low) pixels from the chloroplast in the intensity-based image in figure 6b.
1.5 2.0 2.50.2
0.4
0.6
0.8
1
lo
g (f
luor
esce
nce)
, rel
. u.
Time, ns
1 Fit 2 Fit

FLIM in Plant Leaves
104
Figure 6b (right) Room temperature fluorescence intensity-based image (measured with FLIM). The chloroplast in Alacosia wentii leaves are excited with TPE at 860 nm and detected with a bandpass filter centered at 700 nm with a bandwidth of 75 nm. The pixel size is 0.26 µm. Fluorescence in each pixel is detected in 4096 channels with a time resolution of 3 ps per channel. (left) Global fitting with linked lifetimes (τ1, τ2 and τ3) and independent amplitudes for the black trace (1) and blue trace (2) shown in figure 6a.
10.9%11.6%3957 psτ3
29.5%35.1%1027 psτ2
59.6%53.3%116 psτ1
21
10.9%11.6%3957 psτ3
29.5%35.1%1027 psτ2
59.6%53.3%116 psτ1
21

Chapter 5
105
Conclusions - In vivo measurements on chloroplast are possible under low-light conditions with TPE FLIM and the obtained fluorescence kinetics are very similar to those observed in in vitro measurements on isolated chloroplasts. - When scanning through the leaves of Alocasia wentii and Arabidopsis thaliana no differences are observed in the fluorescence kinetics, indicating no variation in the chloroplast composition/organization as a function of depth. The spatial resolution of the FLIM measurements does not allow to observe individual grana stacks in Arabidopsis thaliana chloroplasts,but for chloroplasts of Alocasia wentii variations in the lifetimes are observed that may be ascribed to variations in the grana density. In the future the TPE fluorescence lifetime imaging microscope can be used to study individual chloroplasts in leaves under different stress conditions. Acknowledgements This work is part of the research programme of the ‘Stichting voor Fundamenteel Onderzoek der Materie (FOM)’, which is financially supported by the ‘Nederlandse Organisatie voor Wetenschappelijk Onderzoek (NWO)’.

FLIM in Plant Leaves
106
References [1] R. Moore, W.D. Clark, D.S. Vodopich, Botany McGraw-Hill Companies,
Inc. 1998. [2] N. Nelson, A. Ben-Shem, The complex architecture of oxygenic
photosynthesis, Nat Rev Mol Cell Biol 5 (2004) 971-982. [3] J.P. Dekker, E.J. Boekema, Supramolecular organization of thylakoid
membrane proteins in green plants, Biochim. Biophys. Acta 1706 (2005) 12-39.
[4] J.M. Anderson, Insights into the consequences of grana stacking of thylakoids membranes in vascular plants: a personal perspective, Aust. J. Plant Physiol. 26 (1999) 625-639.
[5] L. Mustárdy, G. Garab, Granum revisited. A three-dimensional model - where things fall into place, Trends in Plant Science 8 (2003) 117-122.
[6] B.E.S. Gunning, O.M. Schwartz, Confocal microscopy of thylakoid autofluorescence in relation of grana and phylogeny in the green algae, Aust. J. Plant Physiol. 26 (1999) 695-708.
[7] A.V. Ruban, R. Berera, C. Ilioaia, I.H.M. van Stokkum, J.T.M. Kennis, A.A. Pascal, H. van Amerongen, B. Robert, P. Horton, R. van Grondelle, Identification of a mechanism of photoprotective energy dissipation in higher plants, Nature 450 (2007) 575-578.
[8] A.A. Pascal, Z. Liu, K. Broess, B. van Oort, H. van Amerongen, C. Wang, P. Horton, B. Robert, W. Chang, A. Ruban, Molecular basis of photoprotection and control of photosynthetic light-harvesting, Nature 436 (2005) 134-137.
[9] P.H. Lambrev, Z. Várkonyi, S. Krumova, L. Kovács, Y. Miloslavina, A.R. Holzwarth, G. Garab, Importance of trimer-trimer interactions for the native state of the plant light-harvesting complex II, Biochimica et Biophysica Acta (BBA) - Bioenergetics 1767 (2007) 847-853.
[10] S. Berry, B. Rumberg, H+/ATP coupling ratio at the unmodulated CF0CF1-ATP synthase determined by proton flux measurements, Biochimica et Biophysica Acta (BBA) - Bioenergetics 1276 (1996) 51-56.
[11] P. Joliot, D. Béal, A. Joliot, Cyclic electron flow under saturating excitation of dark-adapted Arabidopsis leaves, Biochimica et Biophysica Acta (BBA) - Bioenergetics 1656 (2004) 166-176.
[12] P.Ä. Albertsson, A. E., The constant proportion of grana and stroma lamellae in plant chloroplasts, Physiologia Plantarum 121 (2004) 334-342.
[13] D.J. Goodchild, O. Björkman, N.A. Pyliotis, Chloroplast ultrastructure, leaf anatomy, and content ofchlorophyll and soluble protein in rainforest species. , Carnegie Institution of Washington Yearbook 71 (1972) 102-107.

Chapter 5
107
[14] W.S. Chow, J.M. Anderson, A.B. Hope, Variable stoichiometries of photosystem II to photosystem I reaction centres, Photosynthesis Research 17 (1988) 277-281.
[15] R.M. Williams, W.R. Zipfel, W.W. Webb, Multiphoton microscopy in biological research, Current Opinion in Chemical Biology 5 (2001) 603-608.
[16] W.R. Zipfel, R.M. Williams, W.W. Webb, Nonlinear magic: multiphoton microscopy in the biosciences, Nat Biotech 21 (2003) 1369-1377.
[17] W.F. Cheong, S.A. Prahl, A.J. Welch, A review of the optical properties of biological tissues, IEEE Journal of Quantum Electronics 26 (1990) 2166-2185.
[18] C. Xu, W. Zipfel, J.B. Shear, R.M. Williams, W.W. Webb, Multiphoton fluorescence excitation: New spectral windows for biological nonlinear microscopy, Proc. Natl. Acad. Sci. USA 93 (1996) 10763-10768.
[19] P.J. Walla, J. Yom, B.P. Krueger, G.R. Fleming, Two-Photon Excitation Spectrum of Light-Harvesting Complex II and Fluorescence Upconversion after One- and Two-Photon Excitation of the Carotenoids, J. Phys. Chem. B 104 (2000) 4799-4806.
[20] B. van Oort, A. Amunts, J.W. Borst, A. van Hoek, N. Nelson, H. van Amerongen, R. Croce, Picosecond fluorescence of intact and dissolved PSI-LHCI crystals, Biophys. J (2008) in press.
[21] H.M. Visser, F.J. Kleima, I.H.M. van Stokkum, R. van Grondelle, H. van Amerongen, Probing the many energy-transfer processes in the photosynthetic light-harvesting complex II at 77 K using energy-selective sub-picosecond transient absorption spectroscopy, Chemical Physics 210 (1996) 297-312.
[22] C.C. Gradinaru, I.H.M. van Stokkum, A.A. Pascal, R. van Grondelle, H. van Amerongen, Identifying the Pathways of Energy Transfer between Carotenoids and Chlorophylls in LHCII and CP29. A Multicolor, Femtosecond Pump-Probe Study, J. Phys. Chem. B 104 (2000) 9330-9342.
[23] R. Croce, M.G. Muller, R. Bassi, A.R. Holzwarth, Carotenoid-to-Chlorophyll Energy Transfer in Recombinant Major Light-Harvesting Complex (LHCII) of Higher Plants. I. Femtosecond Transient Absorption Measurements, Biophys. J. 80 (2001) 901-915.
[24] R. Croce, M.G. Muller, R. Bassi, A.R. Holzwarth, Chlorophyll b to Chlorophyll a Energy Transfer Kinetics in the CP29 Antenna Complex: A Comparative Femtosecond Absorption Study between Native and Reconstituted Proteins, Biophys. J. 84 (2003) 2508-2516.
[25] D.D. Eads, E.W. Castner, R.S. Alberte, L. Mets, G.R. Fleming, Direct observation of energy transfer in a photosynthetic membrane: chlorophyll b to chlorophyll a transfer in LHC, J. Phys. Chem. 93 (1989) 8271-8275.

FLIM in Plant Leaves
108
[26] H. van Amerongen, R. van Grondelle, Understanding the Energy Transfer Function of LHCII, the Major Light-Harvesting Complex of Green Plants, J. Phys. Chem. B 105 (2001) 604-617.
[27] H. van Amerongen, R. van Grondelle, Understanding the energy transfer function of LHCII, the major light-harvesting complex of green plants, J. Phys. Chem. B 105 (2001) 604-617.
[28] E.J.G. Peterman, R. Monshouwer, I.H.M. van Stokkum, R. van Grondelle, H. van Amerongen, Ultrafast singlet excitation transfer from carotenoids to chlorophylls via different pathways in light-harvesting complex II of higher plants, Chemical Physics Letters 264 (1997) 279-284.
[29] K. Broess, G. Trinkunas, A. van Hoek, R. Croce, H. van Amerongen, Determination of the excitation migration time in Photosystem II: Consequences for the membrane organization and charge separation parameters, Biochimica et Biophysica Acta (BBA) - Bioenergetics 1777 (2008) 404-409.
[30] J.W. Borst, M.A. Hink, A. Van Hoek, A.J.W.G. Visser, Multiphoton microspectroscopy in living plant cells Proc. Spie 4963 (2003) 231-238.
[31] W. Becker, A. Bergmann. Becker & Hickl GmbH, Berlin. 2002. [32] O. Holub, M.J. Seufferheld, C. Gohlke, Govindjee, R.M. Clegg,
Fluorescence lifetime imaging (FLI) in real time - a new technique in photosynthesis research, Photosynthetica 38 (2000) 581-599.
[33] P.B. Lukins, S. Rehman, G.B. Stevens, D. George, Time-resolved spectroscopic fluorescence imaging, transient absorption and vibrational spectroscopy of intact and photo-inhibited photosynthetic tissue, Luminescence 20 (2005) 143-151.
[34] A.V. Digris, V.V. Skakoun, E.G. Novikov, A. Van Hoek, A. Claiborne, A.J.W.G. Visser, Thermal stability of a flavoprotein assessed from associative analysis of polarized time-resolved fluorescence spectroscopy, Eur. Biophys. J. 28 (1999) 526-531.
[35] E.G. Novikov, A. van Hoek, A.J.W.G. Visser, H.J. W., Linear algorithms for stretched exponential decay analysis, Opt. Commun. 166 (1999) 189-198.
[36] K.M. Mullen, I.H.M. van Stokkum, S. Laptenok, J.W. Borst, V.V. Apanasovich, A.J.W.G. Visser, Fluorescence Lifetime Imaging Microscopy (FLIM) data analysis with TIMP Journal of Statistical Software 18 (2007) 1-20.
[37] D. Spencer, S.G. Wildman, Observations on structure of grana-containing chloroplast and a proposed model of chloroplast structure., Australian Journal of Biological Science 15 (1962) 599-610.

Chapter 5
109
[38] E.A. van Spronsen, V. Sarafis, G.J. Brakenhoff, H.T.M. van der Voort, N. Nanninga, Three-dimensional structure of living chloroplasts as visualized by confocal scanning laser microscopy, Protoplasma 148 (1989) 8-14.
[39] V. Barzda, C.J. de Grauw, J. Vroom, F.J. Kleima, R. van Grondelle, H. van Amerongen, H.C. Gerritsen, Fluorescence Lifetime Heterogeneity in Aggregates of LHCII Revealed by Time-Resolved Microscopy, Biophys. J. 81 (2001) 538-546.
[40] V. Barzda, V. Gulbinas, R. Kananavicius, V. Cervinskas, H. van Amerongen, R. van Grondelle, L. Valkunas, Singlet-singlet annihilation kinetics in aggregates and trimers of LHCII, Biophysical J. 80 (2001) 2409-2421.
[41] G. Zucchelli, R.C. Jennings, F.M. Garlaschi, Independent fluorescence emission of the chlorophyll spectral forms in higher plant Photosystem II, Biochimica et Biophysica Acta (BBA) - Bioenergetics 1099 (1992) 163-169.
[42] E. Pfündel, Estimating the contribution of Photosystem I to total leaf chlorophyll fluorescence, Photosynthesis Research 56 (1998) 185-195.
[43] R. Croce, D. Dorra, A.R. Holzwarth, R.C. Jennings, Fluorescence Decay and Spectral Evolution in Intact Photosystem I of Higher Plants, Biochemistry 39 (2000) 6341-6348.
[44] K. Broess, G. Trinkunas, C.D. van der Weij-de Wit, J.P. Dekker, A. van Hoek, H. van Amerongen, Excitation Energy Transfer and Charge Separation in Photosystem II Membranes Revisited, Biophysical J. 91 (2006) 3776-3786.

FLIM in Plant Leaves
110

Chapter 6
Summarizing Discussion
Summarizing Discussion
112
Introduction This thesis describes fluorescence spectroscopy experiments on photosynthetic
complexes that cover the primary photosynthetic processes, from the absorption of
light by photosynthetic pigments to a charge separation (CS) in the reaction center
(RC). Fluorescence spectroscopy is a useful tool in photosynthetic particles,
because the latter are densely packed with fluorescence pigments like chlorophylls
(Chl). The fluorescence of each pigment is affected by its environment and provide
information about structure and dynamics of the photosynthetic complexes. In this
thesis time-resolved fluorescence of Chl molecules is used for studying the
ultrafast kinetics in membrane particles of photosystem II (PSII) (chapter 2, 3 and
4). In chapter 5 fluorescence lifetime imaging microscopy (FLIM) of is applied to
study entire chloroplasts, either in the leaf or in isolated chloroplast form. The
advantage of FLIM is that the interactions of the fluorescence pigments in both
photosystems can be spatially resolved up to a resolution of 0.5 x 0.5 x 2 µm to
indentify and quantify photosynthetic processes in their natural environment.
Excitation energy transfer and charge separation in PSII membranes (chapter
2,3 and 4)
In this thesis time-resolved fluorescence measurements of PSII containing
membranes, the so called BBY particles, are performed in low-light conditions
with open reaction centers. The BBY particles do not contain photosystem I (PSI)
or stroma lamellae, but do support electron transfer and carry out oxygen evolution
with high activity and are comparable with the grana in vivo. The fluorescence
decay kinetics of the BBY particles are faster than observed in previous studies and
also faster than observed for PSII in chloroplasts and thylakoid preparations. The
average lifetime is 150 ps, which, together with previous annihilation experiments

Chapter 6
113
on light-harvesting complex II (LHCII) suggests that excitation migration from the
antenna complexes contributes significantly to the overall charge separation time.
This is in disagreement with the commonly applied exciton / radical-pair-
equilibrium (ERPE) model that assumes that excitation energy diffusion through
the antenna to the RC is much faster than the overall charge-separation time.
A simple coarse-grained method is proposed, based on the supramolecular
organization of PSII and LHCII in grana membranes (C2S2M2). The proposed
modelling procedure for BBY particles is only approximate and many different
combinations of excitation migration time and the charge separation time can
explain the observed fluorescence kinetics. However it is clear that charge transfer
should be rather fast and is accompanied with a large drop in free energy.
In chapter 3, the fluorescence kinetics of BBY particles with open RCs are
compared after preferential excitation at 420 and 484 nm, which causes a
difference in the initial excited-state populations of the inner and outer antenna
system. The fluorescence decay is somewhat slower upon preferential excitation of
chlorophyll (Chl) b, which is exclusively present in the outer antenna. Using the
coarse-grained model it was possible to fit the 420 and 484 nm results
simultaneously with a two-step electron transfer model and four parameters: the
hopping rate between the protein-pigment complexes, the CS rate, the drop in free
energy upon primary charge separation and a secondary charge separation rate. The
conclusion is that the average migration time contributes ~25% to the overall
trapping time. The hopping time obtained in chapter 3 is significantly faster than
might be expected based on studies on trimeric and aggregated LHCII and it is
concluded that excitation energy transfer in PSII follows specific pathways that
require an optimized organization of the antenna complexes with respect to each
other. Analysis of the composition of the BBY particles indicates that the size of
the light-harvesting system in PSII is smaller than commonly found for PSII in
chloroplasts and explains why the fluorescence lifetimes are smaller for the BBY’s.

Summarizing Discussion
114
In chapter 4, four different PSII supercomplex preparations were studied. The main
difference between these supercomplexes concerns the size of the outer antenna.
The average lifetime of the supercomplexes becomes longer upon increasing the
antenna size. The results indicate that the rate constants obtained from the coarse-
grained method for BBY preparations, which is based on the supercomplex
composition C2S2M2, should be slightly faster (~10%) as predicted in chapter 3.
The observation that the average lifetime of the supercomplexes is relatively slow
compared to what one might expect based on the measurements on BBY particles,
and this will require further future studies.
Photosynthesis in plant leaves (Chapter 5)
With the use of femtosecond two-photon excitation TPE at 860 nm it appears to be
possible to measure fluorescence lifetimes throughout the entire leaves of
Arabidopsis thaliana and Alocasia wentii. It turns out that the excitation intensity
can be kept sufficiently low to avoid artifacts due to singlet-singlet and singlet-
triplet annihilation, while the reaction centers can be kept in the open state during
the measurements. The average fluorescence lifetimes obtained for individual
chloroplasts of Arabidopsis thaliana and Alocasia wentii in the open and closed
state, are approximately ~250 ps and ~1.5 ns, respectively. The maximum
fluorescence state correspond to a state in which all reaction centers are closed. The
kinetics are very similar to those obtained for chloroplasts in vitro with the FLIM
setup and to in vivo results reported in literature. No variations between
chloroplasts are observed when scanning throughout the leaves of Arabidopsis
thaliana and Alocasia wentii. Within individual chloroplasts some variation is
detected for the relative contributions of PSI and PSII to the fluorescence. The
results open up the possibility to use FLIM for the in vivo study of the primary

Chapter 6
115
processes of photosynthesis at the level of single chloroplasts under all kinds of
(stress) conditions.
General conclusions
This thesis gives new insight of the kinetic processes in PSII membranes. With the
use of a coarse-grained method that provides an easy way to incorporate existing
knowledge and models for individual complexes, valuable conclusions can be
drawn about the excitation energy transfer and the CS which hopefully contributes
to an improvement of the knowledge about PSII functioning. In general it was
shown that a large drop in free energy is needed in PSII membranes for all
simulations with the coarse-grained method.
The presented results on the kinetics of chloroplasts obtained in vitro and in vitro
are very similar and verify that conclusions drawn from isolated chloroplasts can
be extrapolated to photosynthetic processes in their natural environment.

Summarizing Discussion
116

Chapter 7 Nederlandse Samenvatting

Nederlandse Samenvatting
118
Nederlandse samenvatting Zonlicht is de belangrijkste energiebron voor het leven op aarde. Via fotosynthese zetten planten en sommige micro-organismen dit zonlicht, water en koolstofdioxide om in chemische energie in de vorm van suikers. Een bijproduct is zuurstof waardoor de atmosfeer ongeveer 20% zuurstof bevat en hogere organisme zoals de mens dit kunnen gebruiken voor hun energiehuishouding. Dit maakt fotosynthese één van de belangrijkste processen op aarde. Een beter inzicht in de fotosynthese kan ons helpen met het verhogen van gewasopbrengsten en het maken van biobrandstof. Hoewel er al meer dan honderd jaar onderzoek naar fotosynthese wordt gedaan, is op moleculaire schaal nog niet alles bekend. Daarom houden er tot op de dag van vandaag nog veel wetenschappers zich bezig met fotosynthese onderzoek. In dit proefschrift worden fluorescentie spectroscopische experimenten aan fotosynthetische complexen beschreven vanaf de absorptie van licht tot en met de ladingscheiding in het reactiecentrum. Fluorescentie spectroscopie is een goede techniek om metingen aan fotosynthetische complexen te doen. Deze complexen hebben van nature al fluorescentie pigmenten, waardoor fluorescente labels niet nodig zijn. De fluorescentie van elk pigment wordt beïnvloed door zijn omgeving en kan informatie geven over de structuur en het gedrag van de fotosynthetische complexen. In hoofdstuk 2, 3 en 4 worden tijdsopgeloste experimenten aan bladgroen pigmenten beschreven voor het bestuderen van snelle processen in fotosysteem II (PSII) deeltjes. In hoofdstuk 5 is gebruikt gemaakt van “fluorescence lifetime imaging microscopy” (FLIM) om geïsoleerde chloroplasten of chloroplasten in blad te bestuderen. Het voordeel van FLIM metingen is dat je met een ruimtelijke resolutie tot 0.5 x 0.5 x 2 µm naar fotosynthetische processen kan kijken. Geëxciteerde energie overdracht en lading scheiding in PSII membranen (hoofdstuk 2, 3 en 4) In deze hoofdstukken zijn tijdsopgeloste fluorescentie metingen onder lage licht intensiteit gedaan aan BBY deeltjes ( PSII membranen) met open reactiecentra. De BBY deeltjes bevatten geen fotosysteem I (PSI) of lamellen, maar ze

Chapter 7
119
transporterenwel elektronen en hebben een vergelijkbare zuurstofproductie als de grana in vivo. De kinetiek van het fluorescentie verval van de BBY deeltjes is sneller dan waargenomen in eerdere studies. De gemiddelde levensduur is 150 ps wat, samen met eerdere annihilatie experimenten aan “light-harvesting complex II” (LHCII), suggereert dat de migratietijd van de antennecomplexen naar het reactiecentrum een significante bijdrage levert aan de totale tijd van de ladingscheiding. Dit is in tegenstelling met het algemene gebruikte “exciton / radical-pair-equilibrium” (ERPE) model dat er vanuit gaat dat diffusie van geëxciteerde energie door de antenna veel sneller is. In hoofdstuk wordt een vereenvoudigde “coarse-grained” methode voorgesteld op basis van de organisatie van PSII en LHCII in grana membranen (C2S2M2). De voorgestelde modelleerprocedure voor BBY deeltjes is globaal. Meerdere combinaties van de migratietijd en de ladingscheidingstijd kunnen de geobserveerde fluorescentie kinetica verklaren. Het is echter duidelijk dat in alle gevallen de ladingoverdracht relatief snel is en gepaard gaat met een substantieel verval in vrije energie. In hoofdstuk 3 worden fluorescentie kinetieken van BBY deeltjes met open reactiecentra na excitatie bij 420 en 484 nm vergeleken. Dit veroorzaakt in het begin een verschil in de populaties van excitaties(of kun je ook zeggen een verschil in excitatiepopulaties of populatie-excitaties) in het binnenste en buitenste antennasysteem. Het fluorescentie verval is iets trager als chlorofyl b (484 nm excitatie) wordt geëxciteerd. Dit komt omdat chlorofyl b alleen in de buitenste antenna aanwezig is. Met behulp van de “coarse-grained” methode wordt de gezamenlijke fit van 420 en 483 nm excitatie gemodelleerd in een twee stappen-elektron-model met vier parameters: de “hopping” tijd tussen eiwitcomplexen, de ladingscheidingstijd, de val in vrije energie voor de primaire ladingscheiding en de snelheid van de secundaire ladingscheiding. De conclusie is dat de gemiddelde migratietijd ongeveer 25% bijdraagt aan de totale “trapping time”. De in hoofdstuk 3 verkregen “hopping” tijd is significant sneller dan wat men kan verwachen op basis van studies met “trimeric”en geaggregeerd LHCII. Geconcludeerd kan worden dat de geëxciteerde energiemigratie in PSII specifieke paden volgt die een optimale organisatie van de antenna complexen vergt. Analyse van de compositie van de BBY deeltjes wijst op een kleiner aantal antenna complexen van het “light-harvesting” systeem in PSII dan gebruikelijk voor PSII in chloroplasten. Dit verklaart dat de fluorescentie levensduren sneller zijn voor de BBY deeltjes.

Nederlandse Samenvatting
120
In hoofdstuk 4 zijn vier verschillende PSII supercomplexen bestudeerd. Het belangrijkste verschil tussen deze supercomplexen betreft het aantal eiwitcomplexen in de buitenste antenna. De resultaten laten zien dat de snelheidsconstante, verkregen via het modelleren voor de BBY deeltjes (gebaseerd op de supercomplex structuur C2S2M2), ongeveer 10% sneller moeten zijn als voorspeld in hoofdstuk 3. Waarom de gemiddelde levensduur van de supercomplexen relatief langzamer zijn dan wat men mag verwachten op basis van de metingen aan de BBY deeltjes vereist vervolgonderzoek in de toekomst. Fotosynthese in bladeren van planten (Hoofdstuk 5) Met behulp van twee fotonen excitatie bij 860 nm is het mogelijk om fluorescentie levensduur metingen uit te voeren door het gehele blad van Arabidopsis thaliana en Alocasia wentii. De excitatie-intensiteit is laag genoeg om artefacten door “singlet-singlet” en “singlet-triplet” annihilatie te voorkomen, terwijl de reactiecentra in een open staat bleven gedurende de metingen. Voor individuele chloroplasten van Arabidopsis thaliana en Alocasia wentii in de open en gesloten staat is een gemiddelde levensduur van ongeveer 250 ps en 1.5 ns respectievelijk verkregen. De maximale fluorescentie correspondeert met een staat waarin alle reactiecentra zijn gesloten. De fluorecentie kinetieken, gemeten met behulp van de FLIM opstelling van chloroplasten in vitro en in vivo, zijn ongeveer hetzelfde en vergelijkbaar met literatuurwaarden. Er zijn geen variaties gemeten tussen verschillende chloroplasten tijdens het maken van een dwarsdoorsnede van de bladeren van Arabidopsis thaliana en Alocasia wentii met de FLIM opstelling. In individuele chloroplasten is wel variatie gemeten voor relatieve contributies van PSI en PSII fluorescentie. De resultaten laten zien dat het mogelijk is om de FLIM opstelling te gebruiken in studies naar de primaire fotosynthetische processen op individuele chloroplast in vivo onder verschillende stress condities. Algemene conclusie Dit proefschrift heeft nieuwe inzichten opgeleverd in de kinetieken in PSII membranen. Met behulp van de “coarse-grained” methode kan bestaande kennis en modellen van individuele complexen worden ingepast, waarbij belangrijke conclusies kunnen worden getrokken over de verplaatsing van de excitatie-energie

Chapter 7
121
en de ladingscheiding wat hopelijk leidt tot een verbetering van kennis over de werking van PSII. Over het algemeen is gebleken dat er een substantieel verval van vrije energie nodig is voor PSII membranen in de simulaties met de “coarse-grained” methode. De gepresenteerde resultaten van de kinitieken van individuele chloroplasten kan worden geëxtrapoleerd tot fotosynthetische processen in hun natuurlijke omgeving.

Dankwoord
122
Dankwoord Ik wil iedereen bedanken die direct of indirect heeft geholpen met het onderzoek waarvan het resultaat dit proefschrift is. Bij het promotieonderzoek zijn velen mensen betrokken die allemaal met hun specifieke kennis en vaardigheden hebben bijgedragen waardoor er soms verrassende resultaten gevonden werden. Ten eerste wil ik Herbert bedanken als inspirerende mentor. Zijn enthousiasme en kennis over de fotosynthese zal nog hopelijk velen komende studenten en promovendi inspireren om onderzoek te gaan doen in de fotosynthese. Maar ook je kritische houding en discussies hebben zeker bijgedragen aan het promotieonderzoek. Je open houding en dat ik altijd welkom was om de resultaten van experimenten te bespreken ondanks je overvolle agenda heb ik altijd zeer gewaardeerd. Natuurlijk zijn er veel mensen betrokken geweest bij het onderzoek en opleiding. Ik wil graag een aantal mensen specifiek bedanken die veel hebben betekend voor het promotieonderzoek. Zo wil ik Sasha bedanken om mij in te wijden in alle NPQ gerelateerde materie met zijn cursus. Jan voor zijn hulp met het eerste artikel en natuurlijk al de onvergetelijke Intro 2 cursussen en congressen die ik mocht volgen, ondanks dat ik officieel geen lid was van Intro 2. Gediminas voor de prettige samenwerking en specifiek al het modelleer werk wat gebruikt is voor de eerste drie artikelen. Roberta voor de goede discussies en ideeën over het onderzoek in het algemeen en specifiek voor het biochemisch werk. Natuurlijk wil ik ook Stefano bedanken voor dit laatste en zijn tomeloze energie om steeds maar met nieuwe monsters naar Wageningen te komen. Op het technische gebied moet ik Arie en Jan Willem bedanken voor het altijd klaar zetten van de laser opstellingen en het meedenken hoe het onderzoek het beste uitgevoerd kon worden. Natuurlijk zijn ook al de (ex) collega’s op de vakgroep onmisbaar geweest voor de gezelligheid, discussies en hulp, hiervoor mijn dank. Specifiek wil ik graag Bart, mijn kamergenoot, hartelijk bedanken voor alle discussies, hulp, kritische houding, maar ook je gezelligheid. Natuurlijk moet ik ook de mensen thuis bedanken. Als eerste mijn vriendin Linda die mij altijd gelukkig weet te maken en er altijd voor mij is. Mijn ouders Hans en Iene en mijn broertje Gijs die mij hebben gevormd tot de persoon die ik nu ben. En natuurlijk is het altijd fijn om weer op de boot te staan naar Texel om jullie te bezoeken en lekker “uit te waaien” op het eiland.

Chapter 7
123
Publicaties K. Broess, G. Trinkunas, A. van Hoek, R. Croce, H. van Amerongen (2008) Determination of the excitation migration time in Photosystem II. Consequences for the membrane organization and charge separation parameters, BBA, 1777, 404-409 K. Broess, G. Trinkunas, C.D. van der Weij-de Wit, J.P. Dekker, A. van Hoek, H. van Amerongen (2006) Excitation Energy Transfer and Charge Separation in Photosystem II Membranes Revisited, Biophys. J. 91, 3776-3786 A.A. Pascal, Z. Liu, K. Broess, B. van Oort, H. van Amerongen, C. Wang, P. Horton, B. Robert, W. Chang, A. Ruban (2005) Molecular basis of photoprotection and control of photosynthetic light-harvesting, Nature, 436, 134-137 Stefano Caffarri, Koen Broess, Gediminas Trinkunas, Roberta Croce, Herbert van Amerongen. Excitation energy transfer in Photosystem II supercomplexes of higher plants with increasing antenna size. In preparation. Koen Broess, Jan Willem Borst, Herbert van Amerongen. Applying two-photon excitation fluorescence lifetime imaging microscopy to study photosynthesis in plant leaves. Submitted.

Curriculum Vitae
124
Curriculum Vitae Koen Lie Broess werd geboren op 4 maart 1977 te Oss. In 1994 behaalde hij zijn HAVO diploma en in 1996 zijn atheneum aan de OSG de Hoge Berg op Texel. Vervolgens volgde hij de studie Moleculaire wetenschappen aan de Wageningen Universiteit. Deze studie werd afgerond in 2004 met als afstudeerrichtingen organische chemie en biofysica. Bij organische chemie heb ik gewerkt aan de synthese en karakterisatie van een zwavel bevattende polydiacetylene die gebruikt zou kunnen worden voor een organische zonnecel. Bij biofysica heb ik gewerkt aan de fotosynthese in thylakoid membranen waar ik tijdens mijn PhD in verder ben gegaan. Van 2004 tot begin 2009 werkte hij als OIO aan de Universiteit Wageningen bij de vakgroep biofysica gedetacheerd door de stichting Fundamenteel Onderzoek der Materie (FOM). Tijdens mijn PhD heb ik verschillende eiwit complexen van het fotosysteem bestudeerd van geïsoleerde supercomplexen tot chloroplasten in bladeren.


![Original Research Response of Net Photosynthetic Rate to ... of Net.pdf · affecting photosynthesis [12, 13]. Since the physiological indicators (leaf water potential, transpiration](https://static.fdocuments.us/doc/165x107/5fcaf8fd79e34c24456a7cff/original-research-response-of-net-photosynthetic-rate-to-of-netpdf-affecting.jpg)


![Developmental Changes of the Photochemical …Chlorophyll fluorescence emanates primarily from chlorophyll a in photosystem II [21] and leaf photosynthetic status, as indicated by](https://static.fdocuments.us/doc/165x107/5f0c18fe7e708231d433baa2/developmental-changes-of-the-photochemical-chlorophyll-fluorescence-emanates-primarily.jpg)

![Leaf Amino Acid Supply Affects Photosynthetic and Plant ...Plant NUE is a complex Leaf Amino Acid Supply Affects Photosynthetic and Plant Nitrogen Use Efficiency under Nitrogen Stress1[OPEN]](https://static.fdocuments.us/doc/165x107/5e8b89ce48ec8737463a416b/leaf-amino-acid-supply-affects-photosynthetic-and-plant-plant-nue-is-a-complex.jpg)
