Primary English Language Arts 2006-07 · 2007-11-25 · Content VoiceWord Choice Sentence Fluency...
150
CRT School Results Primary English Language Arts 2006-07 #133 - Memorial Academy, Botwood Grades: K-6 District 3 - Nova Central Reading Listening Multiple Choice School vs Province School vs District Mark School District Province Number of Students : Rubrics Process Writing Content Organization Sentence Fluency Voice Word Choice Conventions Poetic Reading Informational Reading Visual Reading Listening Speaking School District Province School District Province School District Province School District Province School District Province School District Province School District Province School District Province School District Province School District Province School District Province School District Province 86.6 91.0 83.3 51 50.0 66.7 50.0 100.0 83.3 43.3 47.4 7.9 52.2 42.9 88.3 81.9 83.0 81.9 91.5 91.5 65.8 74.0 43.6 63.6 85.1 81.4 77.7 77.0 73.9 86.1 85.7 65.7 74.4 42.5 64.0 85.7 91.4 89.8 92.1 89.7 Demand Writing School District Province 73.7 78.7 74.5 p p p q q q q q q q q q q q q q q q q q q q q q q q q q J:\PUBLIC07\PATPAM\CRTS\ELA03_W.RPT 190 24/11/2007 10:27:42PM Source: Division of Evaluation and Research, Department of Education
Transcript of Primary English Language Arts 2006-07 · 2007-11-25 · Content VoiceWord Choice Sentence Fluency...

CRT School Results
Primary English Language Arts
2006-07
#133 - Memorial Academy, BotwoodGrades: K-6
District 3 - Nova Central
Reading
Listening
Multiple Choice
School
vs
Province
School
vs
District
Mark
School
District
Province
Number of Students :
Rubrics
Process Writing
Content
Organization
Sentence Fluency
Voice
Word Choice
Conventions
Poetic Reading
Informational Reading
Visual Reading
Listening
Speaking
School
District
Province
School
District
Province
School
District
Province
School
District
Province
School
District
Province
School
District
Province
School
District
Province
School
District
Province
School
District
Province
School
District
Province
School
District
Province
School
District
Province
86.6
91.0
83.3
51
50.0
66.7
50.0
100.0
83.3
43.3
47.4
7.9
52.2
42.9
88.3
81.9
83.0
81.9
91.5
91.5
65.8
74.0
43.6
63.6
85.1
81.4
77.7
77.0
73.9
86.1
85.7
65.7
74.4
42.5
64.0
85.7
91.4
89.8
92.1
89.7
Demand Writing
School
District
Province
73.7
78.7
74.5
p
p
p
q q
q
q q
q q
q q
q q
q q
q q
q q
q q
q q
J:\PUBLIC07\PATPAM\CRTS\ELA03_W.RPT
190
24/11/2007
10:27:42PMSource: Division of Evaluation and Research, Department of Education

CRT School Results
Primary English Language Arts
2006-07
#133 - Memorial Academy, BotwoodGrades: K-6
District 3 - Nova Central
3 Year CRT (Subtest) Mark Trend 2005-2007
OrganizationContent Voice
Sentence
Fluency
Word Choice Convention
Multiple Choice
ListeningReading
Rubrics Results: Percentage of students performing at Level 3 and Above 2005-2007
Demand WritingInformational
Reading
Poetic Reading Visual Reading Listening Speaking
20052006
2007
Process Writing (10 % Sample)
Rubrics Results: Percentage of students performing at Level 3 and Above 2005-2007
J:\PUBLIC07\PATPAM\CRTS\ELA03_W.RPT
191
24/11/2007
10:27:42PMSource: Division of Evaluation and Research, Department of Education

CRT School Results
Primary English Language Arts
2006-07
#133 - Memorial Academy, BotwoodGrades: K-6
District 3 - Nova Central
Difference from Provincial Mean, 2005-07
Multiple Choice
ListeningReading
2005 2006 2007
Process Writing (10 % Sample)
Rubrics Results: Percentage of students performing at Level 3 and Above 2005-2007
Content Word ChoiceVoice
Sentence
Fluency
Organization Convention
Rubrics Results: Percentage of students performing at Level 3 and Above 2005-2007
Demand WritingInformational
Reading
Poetic Reading Visual Reading Listening Speaking
Difference from Provincial Mean, 2005-07
Difference from Provincial Mean, 2005-07
J:\PUBLIC07\PATPAM\CRTS\ELA03_W.RPT
192
24/11/2007
10:27:42PMSource: Division of Evaluation and Research, Department of Education

CRT School Results
Primary English Language Arts
2006-07
#138 - Victoria Academy, GaultoisGrades: K,2-5,7-12
District 3 - Nova Central
Reading
Listening
Multiple Choice
School
vs
Province
School
vs
District
Mark
School
District
Province
Number of Students :
Rubrics
Process Writing
Content
Organization
Sentence Fluency
Voice
Word Choice
Conventions
Poetic Reading
Informational Reading
Visual Reading
Listening
Speaking
School
District
Province
School
District
Province
School
District
Province
School
District
Province
School
District
Province
School
District
Province
School
District
Province
School
District
Province
School
District
Province
School
District
Province
School
District
Province
School
District
Province
4
88.3
81.9
83.0
81.9
91.5
91.5
65.8
74.0
43.6
63.6
85.1
81.4
77.7
77.0
73.9
86.1
85.7
65.7
74.4
42.5
64.0
85.7
91.4
89.8
92.1
89.7
Demand Writing
School
District
Province
78.7
74.5
p
p
p
p
p
p
p
p
p
p
p
p
p
p
p
p
p
p
p
p
p
p
p
p
p
p
p
p
School data with 5 or
fewer students withheld
for reasons of
confidentiality.
J:\PUBLIC07\PATPAM\CRTS\ELA03_W.RPT
193
24/11/2007
10:27:42PMSource: Division of Evaluation and Research, Department of Education
CRT School Results
Primary English Language Arts
2006-07
#138 - Victoria Academy, GaultoisGrades: K,2-5,7-12
District 3 - Nova Central
3 Year CRT (Subtest) Mark Trend 2005-2007
OrganizationContent Voice
Sentence
Fluency
Word Choice Convention
Multiple Choice
ListeningReading
Rubrics Results: Percentage of students performing at Level 3 and Above 2005-2007
Demand WritingInformational
Reading
Poetic Reading Visual Reading Listening Speaking
20052006
2007
Process Writing (10 % Sample)
Rubrics Results: Percentage of students performing at Level 3 and Above 2005-2007
School data with 5 or fewer
students withheld for reasons
of confidentiality.
School data with 5 or fewer
students withheld for reasons
of confidentiality.
School data with 5 or fewer
students withheld for reasons
of confidentiality.
J:\PUBLIC07\PATPAM\CRTS\ELA03_W.RPT
194
24/11/2007
10:27:42PMSource: Division of Evaluation and Research, Department of Education
CRT School Results
Primary English Language Arts
2006-07
#138 - Victoria Academy, GaultoisGrades: K,2-5,7-12
District 3 - Nova Central
Difference from Provincial Mean, 2005-07
Multiple Choice
ListeningReading
2005 2006 2007
Process Writing (10 % Sample)
Rubrics Results: Percentage of students performing at Level 3 and Above 2005-2007
Content Word ChoiceVoice
Sentence
Fluency
Organization Convention
Rubrics Results: Percentage of students performing at Level 3 and Above 2005-2007
Demand WritingInformational
Reading
Poetic Reading Visual Reading Listening Speaking
Difference from Provincial Mean, 2005-07
Difference from Provincial Mean, 2005-07
School data with 5 or fewer
students withheld for reasons
of confidentiality.
School data with 5 or fewer
students withheld for reasons
of confidentiality.
School data with 5 or fewer
students withheld for reasons
of confidentiality.
J:\PUBLIC07\PATPAM\CRTS\ELA03_W.RPT
195
24/11/2007
10:27:42PMSource: Division of Evaluation and Research, Department of Education

CRT School Results
Primary English Language Arts
2006-07
#142 - Woodland Primary, Grand Falls-WindsorGrades: K-3
District 3 - Nova Central
Reading
Listening
Multiple Choice
School
vs
Province
School
vs
District
Mark
School
District
Province
Number of Students :
Rubrics
Process Writing
Content
Organization
Sentence Fluency
Voice
Word Choice
Conventions
Poetic Reading
Informational Reading
Visual Reading
Listening
Speaking
School
District
Province
School
District
Province
School
District
Province
School
District
Province
School
District
Province
School
District
Province
School
District
Province
School
District
Province
School
District
Province
School
District
Province
School
District
Province
School
District
Province
91.9
90.1
100.0
89
100.0
100.0
100.0
100.0
100.0
80.4
64.3
32.2
60.9
100.0
88.3
81.9
83.0
81.9
91.5
91.5
65.8
74.0
43.6
63.6
85.1
81.4
77.7
77.0
73.9
86.1
85.7
65.7
74.4
42.5
64.0
85.7
91.4
89.8
92.1
89.7
Demand Writing
School
District
Province
77.4
78.7
74.5
p
p
p
p
p
p
p
p
p
p
p
p
p
p
p
p
p
p
p
q
q q
q q
q q
J:\PUBLIC07\PATPAM\CRTS\ELA03_W.RPT
196
24/11/2007
10:27:42PMSource: Division of Evaluation and Research, Department of Education
CRT School Results
Primary English Language Arts
2006-07
#142 - Woodland Primary, Grand Falls-WindsorGrades: K-3
District 3 - Nova Central
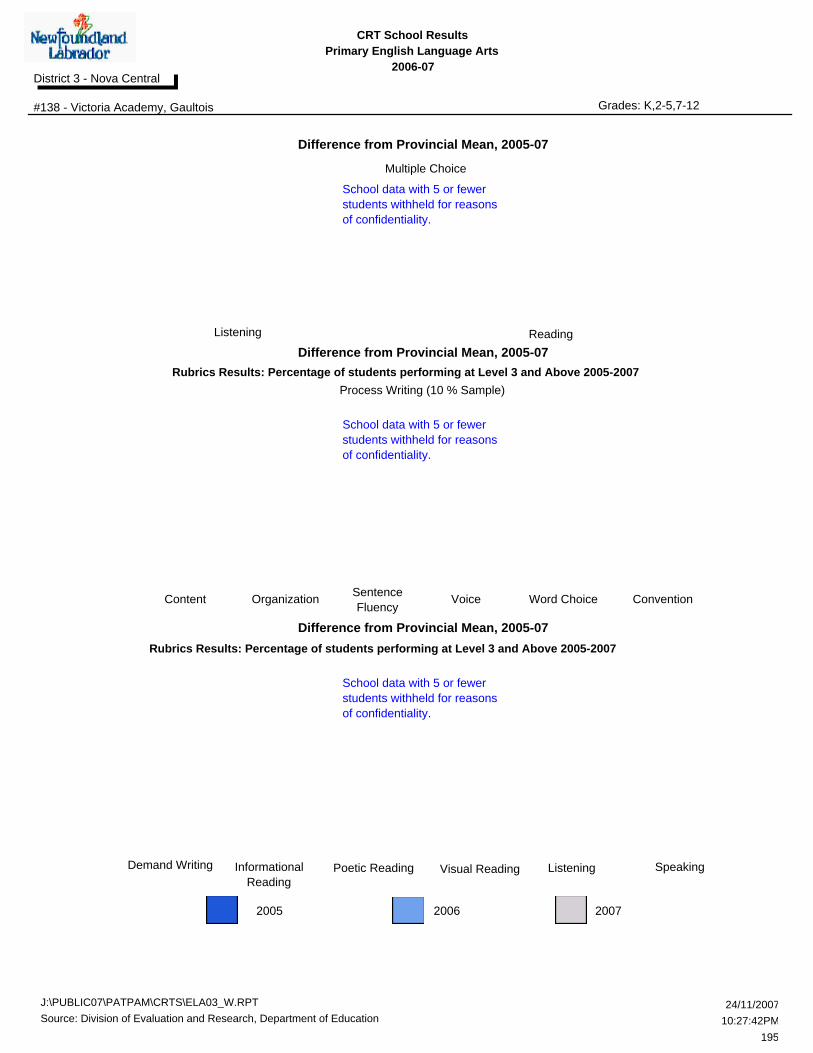
3 Year CRT (Subtest) Mark Trend 2005-2007
OrganizationContent Voice
Sentence
Fluency
Word Choice Convention
Multiple Choice
ListeningReading
Rubrics Results: Percentage of students performing at Level 3 and Above 2005-2007
Demand WritingInformational
Reading
Poetic Reading Visual Reading Listening Speaking
20052006
2007
Process Writing (10 % Sample)
Rubrics Results: Percentage of students performing at Level 3 and Above 2005-2007
J:\PUBLIC07\PATPAM\CRTS\ELA03_W.RPT
197
24/11/2007
10:27:42PMSource: Division of Evaluation and Research, Department of Education

CRT School Results
Primary English Language Arts
2006-07
#142 - Woodland Primary, Grand Falls-WindsorGrades: K-3
District 3 - Nova Central
Difference from Provincial Mean, 2005-07
Multiple Choice
ListeningReading
2005 2006 2007
Process Writing (10 % Sample)
Rubrics Results: Percentage of students performing at Level 3 and Above 2005-2007
Content Word ChoiceVoice
Sentence
Fluency
Organization Convention
Rubrics Results: Percentage of students performing at Level 3 and Above 2005-2007
Demand WritingInformational
Reading
Poetic Reading Visual Reading Listening Speaking
Difference from Provincial Mean, 2005-07
Difference from Provincial Mean, 2005-07
J:\PUBLIC07\PATPAM\CRTS\ELA03_W.RPT
198
24/11/2007
10:27:42PMSource: Division of Evaluation and Research, Department of Education

CRT School Results
Primary English Language Arts
2006-07
#144 - Sprucewood Academy, Grand Falls-WindsorGrades: K-6
District 3 - Nova Central
Reading
Listening
Multiple Choice
School
vs
Province
School
vs
District
Mark
School
District
Province
Number of Students :
Rubrics
Process Writing
Content
Organization
Sentence Fluency
Voice
Word Choice
Conventions
Poetic Reading
Informational Reading
Visual Reading
Listening
Speaking
School
District
Province
School
District
Province
School
District
Province
School
District
Province
School
District
Province
School
District
Province
School
District
Province
School
District
Province
School
District
Province
School
District
Province
School
District
Province
School
District
Province
88.8
90.6
100.0
53
66.7
100.0
100.0
100.0
100.0
85.1
83.0
36.2
72.5
85.7
88.3
81.9
83.0
81.9
91.5
91.5
65.8
74.0
43.6
63.6
85.1
81.4
77.7
77.0
73.9
86.1
85.7
65.7
74.4
42.5
64.0
85.7
91.4
89.8
92.1
89.7
Demand Writing
School
District
Province
93.3
78.7
74.5
p
p
p
p
p
p
p
p
p
p
p
p
p
p
p
p
p
p
p
p
q q
q q
q q
J:\PUBLIC07\PATPAM\CRTS\ELA03_W.RPT
199
24/11/2007
10:27:42PMSource: Division of Evaluation and Research, Department of Education

CRT School Results
Primary English Language Arts
2006-07
#144 - Sprucewood Academy, Grand Falls-WindsorGrades: K-6
District 3 - Nova Central
3 Year CRT (Subtest) Mark Trend 2005-2007
OrganizationContent Voice
Sentence
Fluency
Word Choice Convention
Multiple Choice
ListeningReading
Rubrics Results: Percentage of students performing at Level 3 and Above 2005-2007
Demand WritingInformational
Reading
Poetic Reading Visual Reading Listening Speaking
20052006
2007
Process Writing (10 % Sample)
Rubrics Results: Percentage of students performing at Level 3 and Above 2005-2007
J:\PUBLIC07\PATPAM\CRTS\ELA03_W.RPT
200
24/11/2007
10:27:42PMSource: Division of Evaluation and Research, Department of Education

CRT School Results
Primary English Language Arts
2006-07
#144 - Sprucewood Academy, Grand Falls-WindsorGrades: K-6
District 3 - Nova Central
Difference from Provincial Mean, 2005-07
Multiple Choice
ListeningReading
2005 2006 2007
Process Writing (10 % Sample)
Rubrics Results: Percentage of students performing at Level 3 and Above 2005-2007
Content Word ChoiceVoice
Sentence
Fluency
Organization Convention
Rubrics Results: Percentage of students performing at Level 3 and Above 2005-2007
Demand WritingInformational
Reading
Poetic Reading Visual Reading Listening Speaking
Difference from Provincial Mean, 2005-07
Difference from Provincial Mean, 2005-07
J:\PUBLIC07\PATPAM\CRTS\ELA03_W.RPT
201
24/11/2007
10:27:42PMSource: Division of Evaluation and Research, Department of Education

CRT School Results
Primary English Language Arts
2006-07
#150 - St. Joseph's Elementary, Harbour BretonGrades: K-6
District 3 - Nova Central
Reading
Listening
Multiple Choice
School
vs
Province
School
vs
District
Mark
School
District
Province
Number of Students :
Rubrics
Process Writing
Content
Organization
Sentence Fluency
Voice
Word Choice
Conventions
Poetic Reading
Informational Reading
Visual Reading
Listening
Speaking
School
District
Province
School
District
Province
School
District
Province
School
District
Province
School
District
Province
School
District
Province
School
District
Province
School
District
Province
School
District
Province
School
District
Province
School
District
Province
School
District
Province
91.3
84.0
100.0
27
100.0
100.0
100.0
100.0
100.0
72.0
72.0
36.0
69.2
100.0
88.3
81.9
83.0
81.9
91.5
91.5
65.8
74.0
43.6
63.6
85.1
81.4
77.7
77.0
73.9
86.1
85.7
65.7
74.4
42.5
64.0
85.7
91.4
89.8
92.1
89.7
Demand Writing
School
District
Province
87.5
78.7
74.5
p
p
p
p
p
p
p
p
p
p
p
p
p
p
p
p
p
p
p
p
p
p
q q
q q
J:\PUBLIC07\PATPAM\CRTS\ELA03_W.RPT
202
24/11/2007
10:27:42PMSource: Division of Evaluation and Research, Department of Education

CRT School Results
Primary English Language Arts
2006-07
#150 - St. Joseph's Elementary, Harbour BretonGrades: K-6
District 3 - Nova Central
3 Year CRT (Subtest) Mark Trend 2005-2007
OrganizationContent Voice
Sentence
Fluency
Word Choice Convention
Multiple Choice
ListeningReading
Rubrics Results: Percentage of students performing at Level 3 and Above 2005-2007
Demand WritingInformational
Reading
Poetic Reading Visual Reading Listening Speaking
20052006
2007
Process Writing (10 % Sample)
Rubrics Results: Percentage of students performing at Level 3 and Above 2005-2007
J:\PUBLIC07\PATPAM\CRTS\ELA03_W.RPT
203
24/11/2007
10:27:42PMSource: Division of Evaluation and Research, Department of Education
CRT School Results
Primary English Language Arts
2006-07
#150 - St. Joseph's Elementary, Harbour BretonGrades: K-6
District 3 - Nova Central
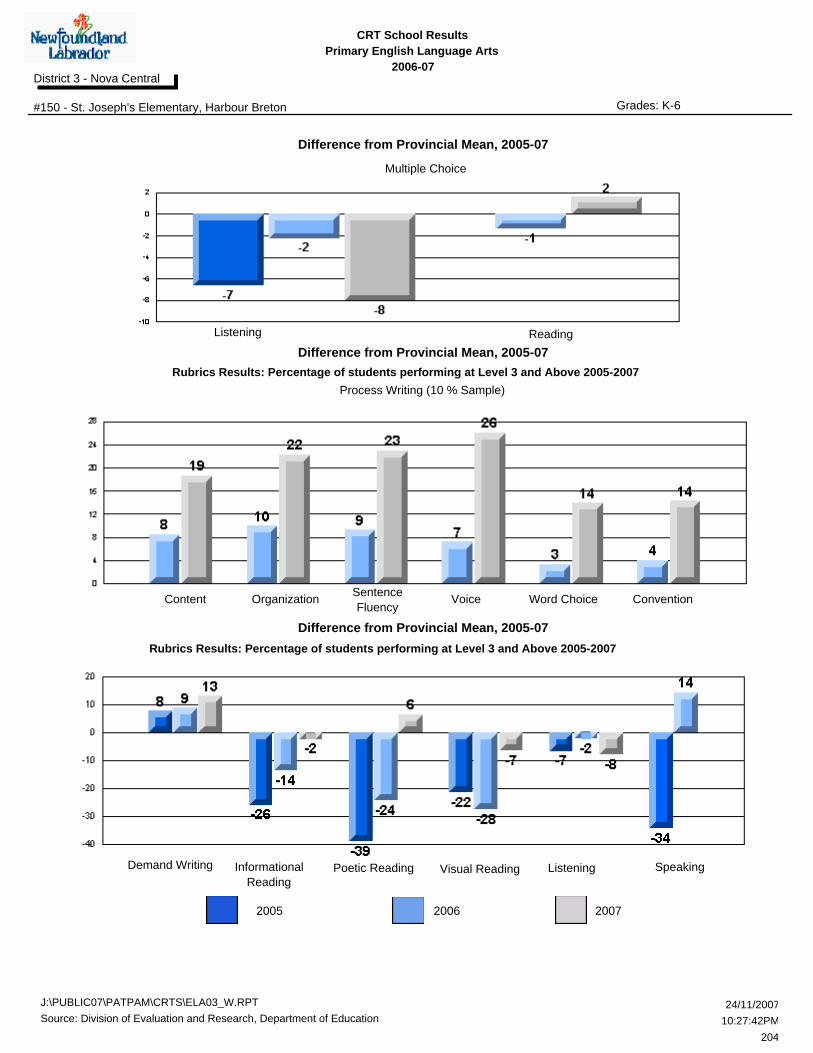
Difference from Provincial Mean, 2005-07
Multiple Choice
ListeningReading
2005 2006 2007
Process Writing (10 % Sample)
Rubrics Results: Percentage of students performing at Level 3 and Above 2005-2007
Content Word ChoiceVoice
Sentence
Fluency
Organization Convention
Rubrics Results: Percentage of students performing at Level 3 and Above 2005-2007
Demand WritingInformational
Reading
Poetic Reading Visual Reading Listening Speaking
Difference from Provincial Mean, 2005-07
Difference from Provincial Mean, 2005-07
J:\PUBLIC07\PATPAM\CRTS\ELA03_W.RPT
204
24/11/2007
10:27:42PMSource: Division of Evaluation and Research, Department of Education

CRT School Results
Primary English Language Arts
2006-07
#151 - John Watkins Academy, HermitageGrades: K-12
District 3 - Nova Central
Reading
Listening
Multiple Choice
School
vs
Province
School
vs
District
Mark
School
District
Province
Number of Students :
Rubrics
Process Writing
Content
Organization
Sentence Fluency
Voice
Word Choice
Conventions
Poetic Reading
Informational Reading
Visual Reading
Listening
Speaking
School
District
Province
School
District
Province
School
District
Province
School
District
Province
School
District
Province
School
District
Province
School
District
Province
School
District
Province
School
District
Province
School
District
Province
School
District
Province
School
District
Province
95.4
92.6
100.0
9
100.0
100.0
100.0
100.0
100.0
55.6
75.0
55.6
44.4
0.0
88.3
81.9
83.0
81.9
91.5
91.5
65.8
74.0
43.6
63.6
85.1
81.4
77.7
77.0
73.9
86.1
85.7
65.7
74.4
42.5
64.0
85.7
91.4
89.8
92.1
89.7
Demand Writing
School
District
Province
88.9
78.7
74.5
p
p
p
p
p
p
p
p
p
p
p
p
p
p
p
p
p
p
p
p
p
p
q q
q q
q q
J:\PUBLIC07\PATPAM\CRTS\ELA03_W.RPT
205
24/11/2007
10:27:42PMSource: Division of Evaluation and Research, Department of Education

CRT School Results
Primary English Language Arts
2006-07
#151 - John Watkins Academy, HermitageGrades: K-12
District 3 - Nova Central
3 Year CRT (Subtest) Mark Trend 2005-2007
OrganizationContent Voice
Sentence
Fluency
Word Choice Convention
Multiple Choice
ListeningReading
Rubrics Results: Percentage of students performing at Level 3 and Above 2005-2007
Demand WritingInformational
Reading
Poetic Reading Visual Reading Listening Speaking
20052006
2007
Process Writing (10 % Sample)
Rubrics Results: Percentage of students performing at Level 3 and Above 2005-2007
J:\PUBLIC07\PATPAM\CRTS\ELA03_W.RPT
206
24/11/2007
10:27:42PMSource: Division of Evaluation and Research, Department of Education

CRT School Results
Primary English Language Arts
2006-07
#151 - John Watkins Academy, HermitageGrades: K-12
District 3 - Nova Central
Difference from Provincial Mean, 2005-07
Multiple Choice
ListeningReading
2005 2006 2007
Process Writing (10 % Sample)
Rubrics Results: Percentage of students performing at Level 3 and Above 2005-2007
Content Word ChoiceVoice
Sentence
Fluency
Organization Convention
Rubrics Results: Percentage of students performing at Level 3 and Above 2005-2007
Demand WritingInformational
Reading
Poetic Reading Visual Reading Listening Speaking
Difference from Provincial Mean, 2005-07
Difference from Provincial Mean, 2005-07
J:\PUBLIC07\PATPAM\CRTS\ELA03_W.RPT
207
24/11/2007
10:27:42PMSource: Division of Evaluation and Research, Department of Education

CRT School Results
Primary English Language Arts
2006-07
#152 - Valmont Academy, King's PointGrades: K-12
District 3 - Nova Central
Reading
Listening
Multiple Choice
School
vs
Province
School
vs
District
Mark
School
District
Province
Number of Students :
Rubrics
Process Writing
Content
Organization
Sentence Fluency
Voice
Word Choice
Conventions
Poetic Reading
Informational Reading
Visual Reading
Listening
Speaking
School
District
Province
School
District
Province
School
District
Province
School
District
Province
School
District
Province
School
District
Province
School
District
Province
School
District
Province
School
District
Province
School
District
Province
School
District
Province
School
District
Province
99.1
83.3
100.0
10
100.0
100.0
100.0
100.0
100.0
100.0
77.8
44.4
77.8
100.0
88.3
81.9
83.0
81.9
91.5
91.5
65.8
74.0
43.6
63.6
85.1
81.4
77.7
77.0
73.9
86.1
85.7
65.7
74.4
42.5
64.0
85.7
91.4
89.8
92.1
89.7
Demand Writing
School
District
Province
77.8
78.7
74.5
p
p
p
p
p
p
p
p
p
p
p
p
p
p
p
p
p
p
p
p
p
p
p
p
p
q
J:\PUBLIC07\PATPAM\CRTS\ELA03_W.RPT
208
24/11/2007
10:27:42PMSource: Division of Evaluation and Research, Department of Education

CRT School Results
Primary English Language Arts
2006-07
#152 - Valmont Academy, King's PointGrades: K-12
District 3 - Nova Central
3 Year CRT (Subtest) Mark Trend 2005-2007
OrganizationContent Voice
Sentence
Fluency
Word Choice Convention
Multiple Choice
ListeningReading
Rubrics Results: Percentage of students performing at Level 3 and Above 2005-2007
Demand WritingInformational
Reading
Poetic Reading Visual Reading Listening Speaking
20052006
2007
Process Writing (10 % Sample)
Rubrics Results: Percentage of students performing at Level 3 and Above 2005-2007
J:\PUBLIC07\PATPAM\CRTS\ELA03_W.RPT
209
24/11/2007
10:27:42PMSource: Division of Evaluation and Research, Department of Education

CRT School Results
Primary English Language Arts
2006-07
#152 - Valmont Academy, King's PointGrades: K-12
District 3 - Nova Central
Difference from Provincial Mean, 2005-07
Multiple Choice
ListeningReading
2005 2006 2007
Process Writing (10 % Sample)
Rubrics Results: Percentage of students performing at Level 3 and Above 2005-2007
Content Word ChoiceVoice
Sentence
Fluency
Organization Convention
Rubrics Results: Percentage of students performing at Level 3 and Above 2005-2007
Demand WritingInformational
Reading
Poetic Reading Visual Reading Listening Speaking
Difference from Provincial Mean, 2005-07
Difference from Provincial Mean, 2005-07
J:\PUBLIC07\PATPAM\CRTS\ELA03_W.RPT
210
24/11/2007
10:27:42PMSource: Division of Evaluation and Research, Department of Education

CRT School Results
Primary English Language Arts
2006-07
#154 - Hillside Elementary, La ScieGrades: K-6
District 3 - Nova Central
Reading
Listening
Multiple Choice
School
vs
Province
School
vs
District
Mark
School
District
Province
Number of Students :
Rubrics
Process Writing
Content
Organization
Sentence Fluency
Voice
Word Choice
Conventions
Poetic Reading
Informational Reading
Visual Reading
Listening
Speaking
School
District
Province
School
District
Province
School
District
Province
School
District
Province
School
District
Province
School
District
Province
School
District
Province
School
District
Province
School
District
Province
School
District
Province
School
District
Province
School
District
Province
86.9
85.7
100.0
14
100.0
100.0
100.0
100.0
100.0
35.7
57.2
21.4
42.9
100.0
88.3
81.9
83.0
81.9
91.5
91.5
65.8
74.0
43.6
63.6
85.1
81.4
77.7
77.0
73.9
86.1
85.7
65.7
74.4
42.5
64.0
85.7
91.4
89.8
92.1
89.7
Demand Writing
School
District
Province
85.7
78.7
74.5
p
p
p
p
p
p
p
p
p
p
p
p
p
p
p
p
q q
q q
q q
q q
q q
J:\PUBLIC07\PATPAM\CRTS\ELA03_W.RPT
211
24/11/2007
10:27:42PMSource: Division of Evaluation and Research, Department of Education
CRT School Results
Primary English Language Arts
2006-07
#154 - Hillside Elementary, La ScieGrades: K-6
District 3 - Nova Central
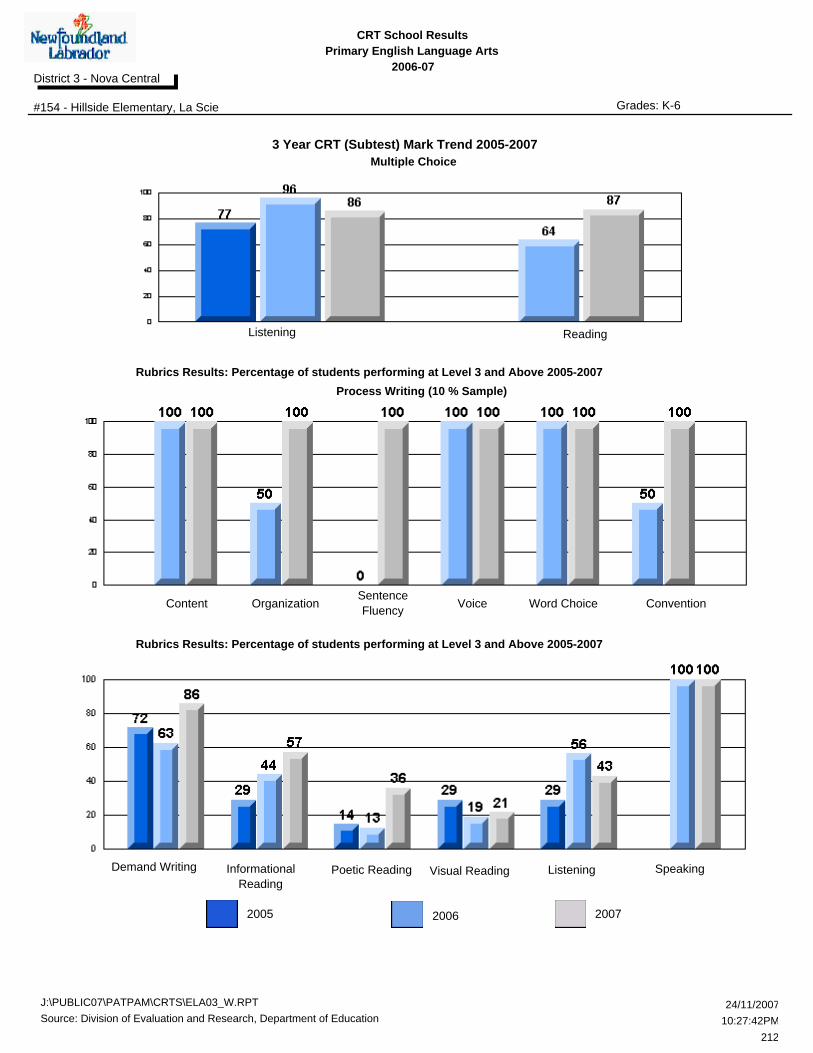
3 Year CRT (Subtest) Mark Trend 2005-2007
OrganizationContent Voice
Sentence
Fluency
Word Choice Convention
Multiple Choice
ListeningReading
Rubrics Results: Percentage of students performing at Level 3 and Above 2005-2007
Demand WritingInformational
Reading
Poetic Reading Visual Reading Listening Speaking
20052006
2007
Process Writing (10 % Sample)
Rubrics Results: Percentage of students performing at Level 3 and Above 2005-2007
J:\PUBLIC07\PATPAM\CRTS\ELA03_W.RPT
212
24/11/2007
10:27:42PMSource: Division of Evaluation and Research, Department of Education

CRT School Results
Primary English Language Arts
2006-07
#154 - Hillside Elementary, La ScieGrades: K-6
District 3 - Nova Central
Difference from Provincial Mean, 2005-07
Multiple Choice
ListeningReading
2005 2006 2007
Process Writing (10 % Sample)
Rubrics Results: Percentage of students performing at Level 3 and Above 2005-2007
Content Word ChoiceVoice
Sentence
Fluency
Organization Convention
Rubrics Results: Percentage of students performing at Level 3 and Above 2005-2007
Demand WritingInformational
Reading
Poetic Reading Visual Reading Listening Speaking
Difference from Provincial Mean, 2005-07
Difference from Provincial Mean, 2005-07
J:\PUBLIC07\PATPAM\CRTS\ELA03_W.RPT
213
24/11/2007
10:27:42PMSource: Division of Evaluation and Research, Department of Education

CRT School Results
Primary English Language Arts
2006-07
#155 - Leading Tickles Primary, Leading TicklesGrades: K-3
District 3 - Nova Central
Reading
Listening
Multiple Choice
School
vs
Province
School
vs
District
Mark
School
District
Province
Number of Students :
Rubrics
Process Writing
Content
Organization
Sentence Fluency
Voice
Word Choice
Conventions
Poetic Reading
Informational Reading
Visual Reading
Listening
Speaking
School
District
Province
School
District
Province
School
District
Province
School
District
Province
School
District
Province
School
District
Province
School
District
Province
School
District
Province
School
District
Province
School
District
Province
School
District
Province
School
District
Province
94.4
94.4
100.0
6
0.0
100.0
100.0
100.0
100.0
16.7
16.7
0.0
16.7
100.0
88.3
81.9
83.0
81.9
91.5
91.5
65.8
74.0
43.6
63.6
85.1
81.4
77.7
77.0
73.9
86.1
85.7
65.7
74.4
42.5
64.0
85.7
91.4
89.8
92.1
89.7
Demand Writing
School
District
Province
66.7
78.7
74.5
p
p
p
p
p
p
p
p
p
p
p
p
p
p
p
p
q q
q q
q q
q q
q q
J:\PUBLIC07\PATPAM\CRTS\ELA03_W.RPT
214
24/11/2007
10:27:42PMSource: Division of Evaluation and Research, Department of Education

CRT School Results
Primary English Language Arts
2006-07
#155 - Leading Tickles Primary, Leading TicklesGrades: K-3
District 3 - Nova Central
3 Year CRT (Subtest) Mark Trend 2005-2007
OrganizationContent Voice
Sentence
Fluency
Word Choice Convention
Multiple Choice
ListeningReading
Rubrics Results: Percentage of students performing at Level 3 and Above 2005-2007
Demand WritingInformational
Reading
Poetic Reading Visual Reading Listening Speaking
20052006
2007
Process Writing (10 % Sample)
Rubrics Results: Percentage of students performing at Level 3 and Above 2005-2007
J:\PUBLIC07\PATPAM\CRTS\ELA03_W.RPT
215
24/11/2007
10:27:42PMSource: Division of Evaluation and Research, Department of Education

CRT School Results
Primary English Language Arts
2006-07
#155 - Leading Tickles Primary, Leading TicklesGrades: K-3
District 3 - Nova Central
Difference from Provincial Mean, 2005-07
Multiple Choice
ListeningReading
2005 2006 2007
Process Writing (10 % Sample)
Rubrics Results: Percentage of students performing at Level 3 and Above 2005-2007
Content Word ChoiceVoice
Sentence
Fluency
Organization Convention
Rubrics Results: Percentage of students performing at Level 3 and Above 2005-2007
Demand WritingInformational
Reading
Poetic Reading Visual Reading Listening Speaking
Difference from Provincial Mean, 2005-07
Difference from Provincial Mean, 2005-07
J:\PUBLIC07\PATPAM\CRTS\ELA03_W.RPT
216
24/11/2007
10:27:42PMSource: Division of Evaluation and Research, Department of Education

CRT School Results
Primary English Language Arts
2006-07
#156 - H.L. Strong Academy, Little Bay IslandsGrades: 1,3-5,8-11
District 3 - Nova Central
Reading
Listening
Multiple Choice
School
vs
Province
School
vs
District
Mark
School
District
Province
Number of Students :
Rubrics
Process Writing
Content
Organization
Sentence Fluency
Voice
Word Choice
Conventions
Poetic Reading
Informational Reading
Visual Reading
Listening
Speaking
School
District
Province
School
District
Province
School
District
Province
School
District
Province
School
District
Province
School
District
Province
School
District
Province
School
District
Province
School
District
Province
School
District
Province
School
District
Province
School
District
Province
1
88.3
81.9
83.0
81.9
91.5
91.5
65.8
74.0
43.6
63.6
85.1
81.4
77.7
77.0
73.9
86.1
85.7
65.7
74.4
42.5
64.0
85.7
91.4
89.8
92.1
89.7
Demand Writing
School
District
Province
78.7
74.5
p
p
p
p
p
p
p
p
p
p
p
p
p
p
q q
q q
q q
q q
q q
q q
School data with 5 or
fewer students withheld
for reasons of
confidentiality.
J:\PUBLIC07\PATPAM\CRTS\ELA03_W.RPT
217
24/11/2007
10:27:42PMSource: Division of Evaluation and Research, Department of Education

CRT School Results
Primary English Language Arts
2006-07
#156 - H.L. Strong Academy, Little Bay IslandsGrades: 1,3-5,8-11
District 3 - Nova Central
3 Year CRT (Subtest) Mark Trend 2005-2007
OrganizationContent Voice
Sentence
Fluency
Word Choice Convention
Multiple Choice
ListeningReading
Rubrics Results: Percentage of students performing at Level 3 and Above 2005-2007
Demand WritingInformational
Reading
Poetic Reading Visual Reading Listening Speaking
20052006
2007
Process Writing (10 % Sample)
Rubrics Results: Percentage of students performing at Level 3 and Above 2005-2007
School data with 5 or fewer
students withheld for reasons
of confidentiality.
School data with 5 or fewer
students withheld for reasons
of confidentiality.
School data with 5 or fewer
students withheld for reasons
of confidentiality.
J:\PUBLIC07\PATPAM\CRTS\ELA03_W.RPT
218
24/11/2007
10:27:42PMSource: Division of Evaluation and Research, Department of Education

CRT School Results
Primary English Language Arts
2006-07
#156 - H.L. Strong Academy, Little Bay IslandsGrades: 1,3-5,8-11
District 3 - Nova Central
Difference from Provincial Mean, 2005-07
Multiple Choice
ListeningReading
2005 2006 2007
Process Writing (10 % Sample)
Rubrics Results: Percentage of students performing at Level 3 and Above 2005-2007
Content Word ChoiceVoice
Sentence
Fluency
Organization Convention
Rubrics Results: Percentage of students performing at Level 3 and Above 2005-2007
Demand WritingInformational
Reading
Poetic Reading Visual Reading Listening Speaking
Difference from Provincial Mean, 2005-07
Difference from Provincial Mean, 2005-07
School data with 5 or fewer
students withheld for reasons
of confidentiality.
School data with 5 or fewer
students withheld for reasons
of confidentiality.
School data with 5 or fewer
students withheld for reasons
of confidentiality.
J:\PUBLIC07\PATPAM\CRTS\ELA03_W.RPT
219
24/11/2007
10:27:42PMSource: Division of Evaluation and Research, Department of Education

CRT School Results
Primary English Language Arts
2006-07
#157 - St. Peter's AG, McCallumGrades: 1,3-7,9-12
District 3 - Nova Central
Reading
Listening
Multiple Choice
School
vs
Province
School
vs
District
Mark
School
District
Province
Number of Students :
Rubrics
Process Writing
Content
Organization
Sentence Fluency
Voice
Word Choice
Conventions
Poetic Reading
Informational Reading
Visual Reading
Listening
Speaking
School
District
Province
School
District
Province
School
District
Province
School
District
Province
School
District
Province
School
District
Province
School
District
Province
School
District
Province
School
District
Province
School
District
Province
School
District
Province
School
District
Province
1
88.3
81.9
83.0
81.9
91.5
91.5
65.8
74.0
43.6
63.6
85.1
81.4
77.7
77.0
73.9
86.1
85.7
65.7
74.4
42.5
64.0
85.7
91.4
89.8
92.1
89.7
Demand Writing
School
District
Province
78.7
74.5
p
p
p
p
p
p
p
p
p
p
p
p
p
p
p
p
p
p
p
p
p
p
p
p
p
p
p
p
School data with 5 or
fewer students withheld
for reasons of
confidentiality.
J:\PUBLIC07\PATPAM\CRTS\ELA03_W.RPT
220
24/11/2007
10:27:42PMSource: Division of Evaluation and Research, Department of Education

CRT School Results
Primary English Language Arts
2006-07
#157 - St. Peter's AG, McCallumGrades: 1,3-7,9-12
District 3 - Nova Central
3 Year CRT (Subtest) Mark Trend 2005-2007
OrganizationContent Voice
Sentence
Fluency
Word Choice Convention
Multiple Choice
ListeningReading
Rubrics Results: Percentage of students performing at Level 3 and Above 2005-2007
Demand WritingInformational
Reading
Poetic Reading Visual Reading Listening Speaking
20052006
2007
Process Writing (10 % Sample)
Rubrics Results: Percentage of students performing at Level 3 and Above 2005-2007
School data with 5 or fewer
students withheld for reasons
of confidentiality.
School data with 5 or fewer
students withheld for reasons
of confidentiality.
School data with 5 or fewer
students withheld for reasons
of confidentiality.
J:\PUBLIC07\PATPAM\CRTS\ELA03_W.RPT
221
24/11/2007
10:27:42PMSource: Division of Evaluation and Research, Department of Education

CRT School Results
Primary English Language Arts
2006-07
#157 - St. Peter's AG, McCallumGrades: 1,3-7,9-12
District 3 - Nova Central
Difference from Provincial Mean, 2005-07
Multiple Choice
ListeningReading
2005 2006 2007
Process Writing (10 % Sample)
Rubrics Results: Percentage of students performing at Level 3 and Above 2005-2007
Content Word ChoiceVoice
Sentence
Fluency
Organization Convention
Rubrics Results: Percentage of students performing at Level 3 and Above 2005-2007
Demand WritingInformational
Reading
Poetic Reading Visual Reading Listening Speaking
Difference from Provincial Mean, 2005-07
Difference from Provincial Mean, 2005-07
School data with 5 or fewer
students withheld for reasons
of confidentiality.
School data with 5 or fewer
students withheld for reasons
of confidentiality.
School data with 5 or fewer
students withheld for reasons
of confidentiality.
J:\PUBLIC07\PATPAM\CRTS\ELA03_W.RPT
222
24/11/2007
10:27:42PMSource: Division of Evaluation and Research, Department of Education

CRT School Results
Primary English Language Arts
2006-07
#158 - MSB Regional Academy, Middle ArmGrades: K-12
District 3 - Nova Central
Reading
Listening
Multiple Choice
School
vs
Province
School
vs
District
Mark
School
District
Province
Number of Students :
Rubrics
Process Writing
Content
Organization
Sentence Fluency
Voice
Word Choice
Conventions
Poetic Reading
Informational Reading
Visual Reading
Listening
Speaking
School
District
Province
School
District
Province
School
District
Province
School
District
Province
School
District
Province
School
District
Province
School
District
Province
School
District
Province
School
District
Province
School
District
Province
School
District
Province
School
District
Province
98.3
88.9
100.0
6
100.0
100.0
100.0
100.0
100.0
80.0
100.0
60.0
83.3
100.0
88.3
81.9
83.0
81.9
91.5
91.5
65.8
74.0
43.6
63.6
85.1
81.4
77.7
77.0
73.9
86.1
85.7
65.7
74.4
42.5
64.0
85.7
91.4
89.8
92.1
89.7
Demand Writing
School
District
Province
100.0
78.7
74.5
p
p
p
p
p
p
p
p
p
p
p
p
p
p
p
p
p
p
p
p
p
p
p
p
p
p
J:\PUBLIC07\PATPAM\CRTS\ELA03_W.RPT
223
24/11/2007
10:27:42PMSource: Division of Evaluation and Research, Department of Education

CRT School Results
Primary English Language Arts
2006-07
#158 - MSB Regional Academy, Middle ArmGrades: K-12
District 3 - Nova Central
3 Year CRT (Subtest) Mark Trend 2005-2007
OrganizationContent Voice
Sentence
Fluency
Word Choice Convention
Multiple Choice
ListeningReading
Rubrics Results: Percentage of students performing at Level 3 and Above 2005-2007
Demand WritingInformational
Reading
Poetic Reading Visual Reading Listening Speaking
20052006
2007
Process Writing (10 % Sample)
Rubrics Results: Percentage of students performing at Level 3 and Above 2005-2007
J:\PUBLIC07\PATPAM\CRTS\ELA03_W.RPT
224
24/11/2007
10:27:42PMSource: Division of Evaluation and Research, Department of Education

CRT School Results
Primary English Language Arts
2006-07
#158 - MSB Regional Academy, Middle ArmGrades: K-12
District 3 - Nova Central
Difference from Provincial Mean, 2005-07
Multiple Choice
ListeningReading
2005 2006 2007
Process Writing (10 % Sample)
Rubrics Results: Percentage of students performing at Level 3 and Above 2005-2007
Content Word ChoiceVoice
Sentence
Fluency
Organization Convention
Rubrics Results: Percentage of students performing at Level 3 and Above 2005-2007
Demand WritingInformational
Reading
Poetic Reading Visual Reading Listening Speaking
Difference from Provincial Mean, 2005-07
Difference from Provincial Mean, 2005-07
J:\PUBLIC07\PATPAM\CRTS\ELA03_W.RPT
225
24/11/2007
10:27:42PMSource: Division of Evaluation and Research, Department of Education

CRT School Results
Primary English Language Arts
2006-07
#160 - Bayview Primary, Nipper's HarbourGrades: K-3
District 3 - Nova Central
Reading
Listening
Multiple Choice
School
vs
Province
School
vs
District
Mark
School
District
Province
Number of Students :
Rubrics
Process Writing
Content
Organization
Sentence Fluency
Voice
Word Choice
Conventions
Poetic Reading
Informational Reading
Visual Reading
Listening
Speaking
School
District
Province
School
District
Province
School
District
Province
School
District
Province
School
District
Province
School
District
Province
School
District
Province
School
District
Province
School
District
Province
School
District
Province
School
District
Province
School
District
Province
2
88.3
81.9
83.0
81.9
91.5
91.5
65.8
74.0
43.6
63.6
85.1
81.4
77.7
77.0
73.9
86.1
85.7
65.7
74.4
42.5
64.0
85.7
91.4
89.8
92.1
89.7
Demand Writing
School
District
Province
78.7
74.5
p
p
p
p
p
p
p
p
p
p
p
p
p
p
p
p
p
p
p
p
q q
q q
q q
q q
School data with 5 or
fewer students withheld
for reasons of
confidentiality.
J:\PUBLIC07\PATPAM\CRTS\ELA03_W.RPT
226
24/11/2007
10:27:42PMSource: Division of Evaluation and Research, Department of Education

CRT School Results
Primary English Language Arts
2006-07
#160 - Bayview Primary, Nipper's HarbourGrades: K-3
District 3 - Nova Central
3 Year CRT (Subtest) Mark Trend 2005-2007
OrganizationContent Voice
Sentence
Fluency
Word Choice Convention
Multiple Choice
ListeningReading
Rubrics Results: Percentage of students performing at Level 3 and Above 2005-2007
Demand WritingInformational
Reading
Poetic Reading Visual Reading Listening Speaking
20052006
2007
Process Writing (10 % Sample)
Rubrics Results: Percentage of students performing at Level 3 and Above 2005-2007
School data with 5 or fewer
students withheld for reasons
of confidentiality.
School data with 5 or fewer
students withheld for reasons
of confidentiality.
School data with 5 or fewer
students withheld for reasons
of confidentiality.
J:\PUBLIC07\PATPAM\CRTS\ELA03_W.RPT
227
24/11/2007
10:27:42PMSource: Division of Evaluation and Research, Department of Education
CRT School Results
Primary English Language Arts
2006-07
#160 - Bayview Primary, Nipper's HarbourGrades: K-3
District 3 - Nova Central
Difference from Provincial Mean, 2005-07
Multiple Choice
ListeningReading
2005 2006 2007
Process Writing (10 % Sample)
Rubrics Results: Percentage of students performing at Level 3 and Above 2005-2007
Content Word ChoiceVoice
Sentence
Fluency
Organization Convention
Rubrics Results: Percentage of students performing at Level 3 and Above 2005-2007
Demand WritingInformational
Reading
Poetic Reading Visual Reading Listening Speaking
Difference from Provincial Mean, 2005-07
Difference from Provincial Mean, 2005-07
School data with 5 or fewer
students withheld for reasons
of confidentiality.
School data with 5 or fewer
students withheld for reasons
of confidentiality.
School data with 5 or fewer
students withheld for reasons
of confidentiality.
J:\PUBLIC07\PATPAM\CRTS\ELA03_W.RPT
228
24/11/2007
10:27:42PMSource: Division of Evaluation and Research, Department of Education

CRT School Results
Primary English Language Arts
2006-07
#163 - Point Leamington Academy, Point LeamingtonGrades: K-12
District 3 - Nova Central
Reading
Listening
Multiple Choice
School
vs
Province
School
vs
District
Mark
School
District
Province
Number of Students :
Rubrics
Process Writing
Content
Organization
Sentence Fluency
Voice
Word Choice
Conventions
Poetic Reading
Informational Reading
Visual Reading
Listening
Speaking
School
District
Province
School
District
Province
School
District
Province
School
District
Province
School
District
Province
School
District
Province
School
District
Province
School
District
Province
School
District
Province
School
District
Province
School
District
Province
School
District
Province
4
88.3
81.9
83.0
81.9
91.5
91.5
65.8
74.0
43.6
63.6
85.1
81.4
77.7
77.0
73.9
86.1
85.7
65.7
74.4
42.5
64.0
85.7
91.4
89.8
92.1
89.7
Demand Writing
School
District
Province
78.7
74.5
p
p
p
p
p
p
p
p
p
p
p
p
p
p
p
p
p
q q
q q
q q
q
q q
q q
School data with 5 or
fewer students withheld
for reasons of
confidentiality.
J:\PUBLIC07\PATPAM\CRTS\ELA03_W.RPT
229
24/11/2007
10:27:42PMSource: Division of Evaluation and Research, Department of Education

CRT School Results
Primary English Language Arts
2006-07
#163 - Point Leamington Academy, Point LeamingtonGrades: K-12
District 3 - Nova Central
3 Year CRT (Subtest) Mark Trend 2005-2007
OrganizationContent Voice
Sentence
Fluency
Word Choice Convention
Multiple Choice
ListeningReading
Rubrics Results: Percentage of students performing at Level 3 and Above 2005-2007
Demand WritingInformational
Reading
Poetic Reading Visual Reading Listening Speaking
20052006
2007
Process Writing (10 % Sample)
Rubrics Results: Percentage of students performing at Level 3 and Above 2005-2007
School data with 5 or fewer
students withheld for reasons
of confidentiality.
School data with 5 or fewer
students withheld for reasons
of confidentiality.
School data with 5 or fewer
students withheld for reasons
of confidentiality.
J:\PUBLIC07\PATPAM\CRTS\ELA03_W.RPT
230
24/11/2007
10:27:42PMSource: Division of Evaluation and Research, Department of Education

CRT School Results
Primary English Language Arts
2006-07
#163 - Point Leamington Academy, Point LeamingtonGrades: K-12
District 3 - Nova Central
Difference from Provincial Mean, 2005-07
Multiple Choice
ListeningReading
2005 2006 2007
Process Writing (10 % Sample)
Rubrics Results: Percentage of students performing at Level 3 and Above 2005-2007
Content Word ChoiceVoice
Sentence
Fluency
Organization Convention
Rubrics Results: Percentage of students performing at Level 3 and Above 2005-2007
Demand WritingInformational
Reading
Poetic Reading Visual Reading Listening Speaking
Difference from Provincial Mean, 2005-07
Difference from Provincial Mean, 2005-07
School data with 5 or fewer
students withheld for reasons
of confidentiality.
School data with 5 or fewer
students withheld for reasons
of confidentiality.
School data with 5 or fewer
students withheld for reasons
of confidentiality.
J:\PUBLIC07\PATPAM\CRTS\ELA03_W.RPT
231
24/11/2007
10:27:42PMSource: Division of Evaluation and Research, Department of Education

CRT School Results
Primary English Language Arts
2006-07
#165 - St. Stephen's AG, Rencontre EastGrades: 1-7,9-12
District 3 - Nova Central
Reading
Listening
Multiple Choice
School
vs
Province
School
vs
District
Mark
School
District
Province
Number of Students :
Rubrics
Process Writing
Content
Organization
Sentence Fluency
Voice
Word Choice
Conventions
Poetic Reading
Informational Reading
Visual Reading
Listening
Speaking
School
District
Province
School
District
Province
School
District
Province
School
District
Province
School
District
Province
School
District
Province
School
District
Province
School
District
Province
School
District
Province
School
District
Province
School
District
Province
School
District
Province
1
88.3
81.9
83.0
81.9
91.5
91.5
65.8
74.0
43.6
63.6
85.1
81.4
77.7
77.0
73.9
86.1
85.7
65.7
74.4
42.5
64.0
85.7
91.4
89.8
92.1
89.7
Demand Writing
School
District
Province
78.7
74.5
p
p
p
p
p
p
p
p
p
p
p
p
p
p
p
p
p
p
p
p
p
p
p
p
p
p
p
p
School data with 5 or
fewer students withheld
for reasons of
confidentiality.
J:\PUBLIC07\PATPAM\CRTS\ELA03_W.RPT
232
24/11/2007
10:27:42PMSource: Division of Evaluation and Research, Department of Education

CRT School Results
Primary English Language Arts
2006-07
#165 - St. Stephen's AG, Rencontre EastGrades: 1-7,9-12
District 3 - Nova Central
3 Year CRT (Subtest) Mark Trend 2005-2007
OrganizationContent Voice
Sentence
Fluency
Word Choice Convention
Multiple Choice
ListeningReading
Rubrics Results: Percentage of students performing at Level 3 and Above 2005-2007
Demand WritingInformational
Reading
Poetic Reading Visual Reading Listening Speaking
20052006
2007
Process Writing (10 % Sample)
Rubrics Results: Percentage of students performing at Level 3 and Above 2005-2007
School data with 5 or fewer
students withheld for reasons
of confidentiality.
School data with 5 or fewer
students withheld for reasons
of confidentiality.
School data with 5 or fewer
students withheld for reasons
of confidentiality.
J:\PUBLIC07\PATPAM\CRTS\ELA03_W.RPT
233
24/11/2007
10:27:42PMSource: Division of Evaluation and Research, Department of Education

CRT School Results
Primary English Language Arts
2006-07
#165 - St. Stephen's AG, Rencontre EastGrades: 1-7,9-12
District 3 - Nova Central
Difference from Provincial Mean, 2005-07
Multiple Choice
ListeningReading
2005 2006 2007
Process Writing (10 % Sample)
Rubrics Results: Percentage of students performing at Level 3 and Above 2005-2007
Content Word ChoiceVoice
Sentence
Fluency
Organization Convention
Rubrics Results: Percentage of students performing at Level 3 and Above 2005-2007
Demand WritingInformational
Reading
Poetic Reading Visual Reading Listening Speaking
Difference from Provincial Mean, 2005-07
Difference from Provincial Mean, 2005-07
School data with 5 or fewer
students withheld for reasons
of confidentiality.
School data with 5 or fewer
students withheld for reasons
of confidentiality.
School data with 5 or fewer
students withheld for reasons
of confidentiality.
J:\PUBLIC07\PATPAM\CRTS\ELA03_W.RPT
234
24/11/2007
10:27:42PMSource: Division of Evaluation and Research, Department of Education
CRT School Results
Primary English Language Arts
2006-07
#167 - Green Bay South Academy, Robert's ArmGrades: K-6
District 3 - Nova Central
Reading
Listening
Multiple Choice
School
vs
Province
School
vs
District
Mark
School
District
Province
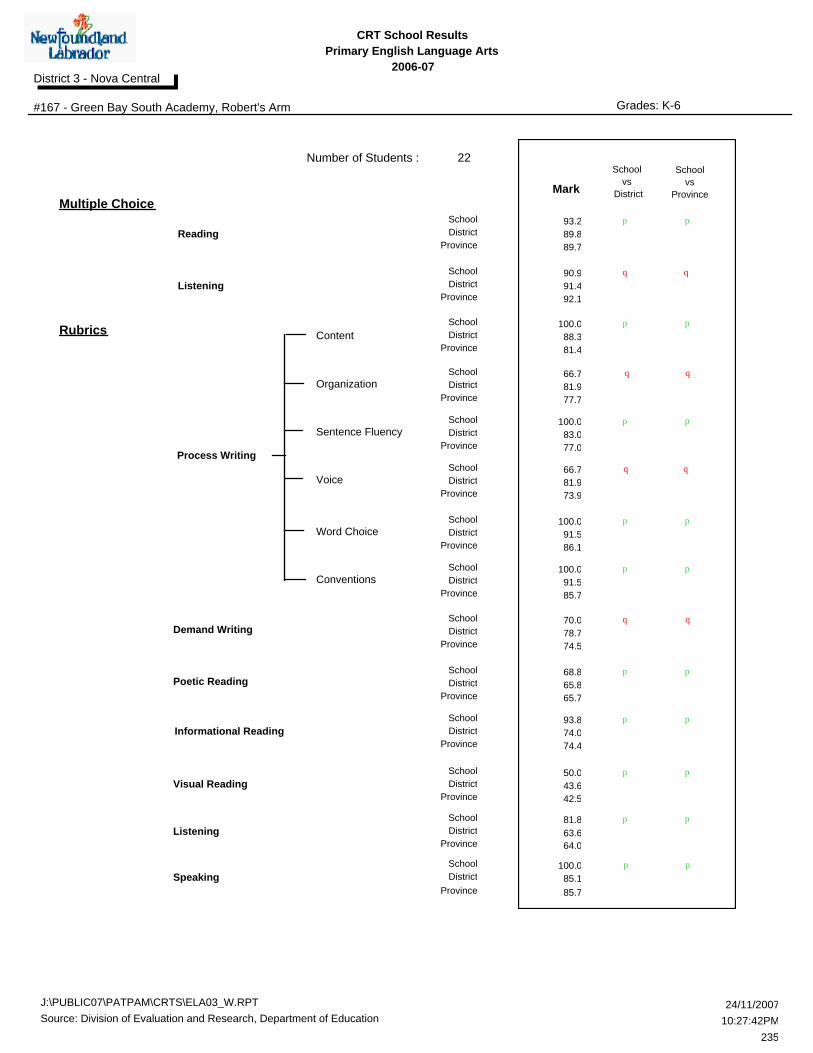
Number of Students :
Rubrics
Process Writing
Content
Organization
Sentence Fluency
Voice
Word Choice
Conventions
Poetic Reading
Informational Reading
Visual Reading
Listening
Speaking
School
District
Province
School
District
Province
School
District
Province
School
District
Province
School
District
Province
School
District
Province
School
District
Province
School
District
Province
School
District
Province
School
District
Province
School
District
Province
School
District
Province
93.2
90.9
100.0
22
66.7
100.0
66.7
100.0
100.0
68.8
93.8
50.0
81.8
100.0
88.3
81.9
83.0
81.9
91.5
91.5
65.8
74.0
43.6
63.6
85.1
81.4
77.7
77.0
73.9
86.1
85.7
65.7
74.4
42.5
64.0
85.7
91.4
89.8
92.1
89.7
Demand Writing
School
District
Province
70.0
78.7
74.5
p
p
p
p
p
p
p
p
p
p
p
p
p
p
p
p
p
p
p
p
q q
q q
J:\PUBLIC07\PATPAM\CRTS\ELA03_W.RPT
235
24/11/2007
10:27:42PMSource: Division of Evaluation and Research, Department of Education

CRT School Results
Primary English Language Arts
2006-07
#167 - Green Bay South Academy, Robert's ArmGrades: K-6
District 3 - Nova Central
3 Year CRT (Subtest) Mark Trend 2005-2007
OrganizationContent Voice
Sentence
Fluency
Word Choice Convention
Multiple Choice
ListeningReading
Rubrics Results: Percentage of students performing at Level 3 and Above 2005-2007
Demand WritingInformational
Reading
Poetic Reading Visual Reading Listening Speaking
20052006
2007
Process Writing (10 % Sample)
Rubrics Results: Percentage of students performing at Level 3 and Above 2005-2007
J:\PUBLIC07\PATPAM\CRTS\ELA03_W.RPT
236
24/11/2007
10:27:42PMSource: Division of Evaluation and Research, Department of Education

CRT School Results
Primary English Language Arts
2006-07
#167 - Green Bay South Academy, Robert's ArmGrades: K-6
District 3 - Nova Central
Difference from Provincial Mean, 2005-07
Multiple Choice
ListeningReading
2005 2006 2007
Process Writing (10 % Sample)
Rubrics Results: Percentage of students performing at Level 3 and Above 2005-2007
Content Word ChoiceVoice
Sentence
Fluency
Organization Convention
Rubrics Results: Percentage of students performing at Level 3 and Above 2005-2007
Demand WritingInformational
Reading
Poetic Reading Visual Reading Listening Speaking
Difference from Provincial Mean, 2005-07
Difference from Provincial Mean, 2005-07
J:\PUBLIC07\PATPAM\CRTS\ELA03_W.RPT
237
24/11/2007
10:27:42PMSource: Division of Evaluation and Research, Department of Education

CRT School Results
Primary English Language Arts
2006-07
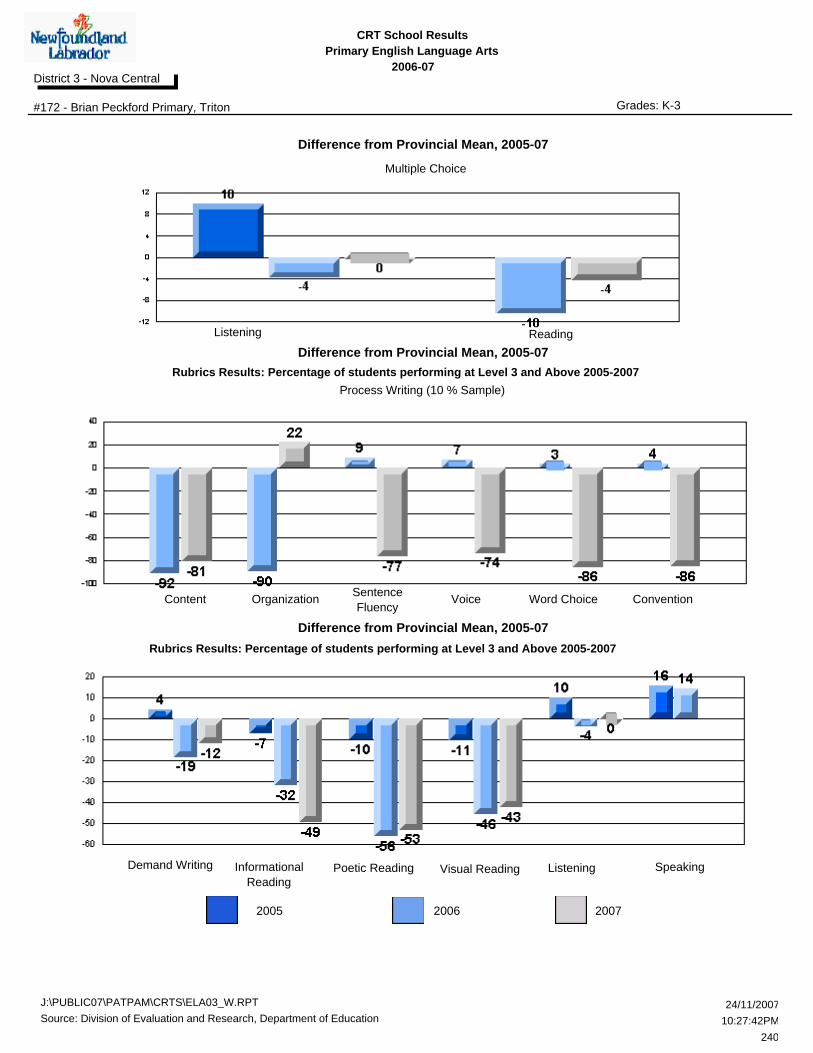
#172 - Brian Peckford Primary, TritonGrades: K-3
District 3 - Nova Central
Reading
Listening
Multiple Choice
School
vs
Province
School
vs
District
Mark
School
District
Province
Number of Students :
Rubrics
Process Writing
Content
Organization
Sentence Fluency
Voice
Word Choice
Conventions
Poetic Reading
Informational Reading
Visual Reading
Listening
Speaking
School
District
Province
School
District
Province
School
District
Province
School
District
Province
School
District
Province
School
District
Province
School
District
Province
School
District
Province
School
District
Province
School
District
Province
School
District
Province
School
District
Province
85.4
91.7
0.0
8
100.0
0.0
0.0
0.0
0.0
12.5
25.0
0.0
50.0
100.0
88.3
81.9
83.0
81.9
91.5
91.5
65.8
74.0
43.6
63.6
85.1
81.4
77.7
77.0
73.9
86.1
85.7
65.7
74.4
42.5
64.0
85.7
91.4
89.8
92.1
89.7
Demand Writing
School
District
Province
62.5
78.7
74.5
p
p
p
p
p
q q
q
q q
q q
q q
q q
q q
q q
q q
q q
q q
J:\PUBLIC07\PATPAM\CRTS\ELA03_W.RPT
238
24/11/2007
10:27:42PMSource: Division of Evaluation and Research, Department of Education

CRT School Results
Primary English Language Arts
2006-07
#172 - Brian Peckford Primary, TritonGrades: K-3
District 3 - Nova Central
3 Year CRT (Subtest) Mark Trend 2005-2007
OrganizationContent Voice
Sentence
Fluency
Word Choice Convention
Multiple Choice
ListeningReading
Rubrics Results: Percentage of students performing at Level 3 and Above 2005-2007
Demand WritingInformational
Reading
Poetic Reading Visual Reading Listening Speaking
20052006
2007
Process Writing (10 % Sample)
Rubrics Results: Percentage of students performing at Level 3 and Above 2005-2007
J:\PUBLIC07\PATPAM\CRTS\ELA03_W.RPT
239
24/11/2007
10:27:42PMSource: Division of Evaluation and Research, Department of Education
CRT School Results
Primary English Language Arts
2006-07
#172 - Brian Peckford Primary, TritonGrades: K-3
District 3 - Nova Central
Difference from Provincial Mean, 2005-07
Multiple Choice
ListeningReading
2005 2006 2007
Process Writing (10 % Sample)
Rubrics Results: Percentage of students performing at Level 3 and Above 2005-2007
Content Word ChoiceVoice
Sentence
Fluency
Organization Convention
Rubrics Results: Percentage of students performing at Level 3 and Above 2005-2007
Demand WritingInformational
Reading
Poetic Reading Visual Reading Listening Speaking
Difference from Provincial Mean, 2005-07
Difference from Provincial Mean, 2005-07
J:\PUBLIC07\PATPAM\CRTS\ELA03_W.RPT
240
24/11/2007
10:27:42PMSource: Division of Evaluation and Research, Department of Education

CRT School Results
Primary English Language Arts
2006-07
#174 - St. Peter's Academy, WestportGrades: K-3,5-8,10-12
District 3 - Nova Central
Reading
Listening
Multiple Choice
School
vs
Province
School
vs
District
Mark
School
District
Province
Number of Students :
Rubrics
Process Writing
Content
Organization
Sentence Fluency
Voice
Word Choice
Conventions
Poetic Reading
Informational Reading
Visual Reading
Listening
Speaking
School
District
Province
School
District
Province
School
District
Province
School
District
Province
School
District
Province
School
District
Province
School
District
Province
School
District
Province
School
District
Province
School
District
Province
School
District
Province
School
District
Province
1
88.3
81.9
83.0
81.9
91.5
91.5
65.8
74.0
43.6
63.6
85.1
81.4
77.7
77.0
73.9
86.1
85.7
65.7
74.4
42.5
64.0
85.7
91.4
89.8
92.1
89.7
Demand Writing
School
District
Province
78.7
74.5
p
p
p
p
p
p
p
p
p
p
q q
q q
q q
q q
q q
q q
q q
q q
School data with 5 or
fewer students withheld
for reasons of
confidentiality.
J:\PUBLIC07\PATPAM\CRTS\ELA03_W.RPT
241
24/11/2007
10:27:42PMSource: Division of Evaluation and Research, Department of Education

CRT School Results
Primary English Language Arts
2006-07
#174 - St. Peter's Academy, WestportGrades: K-3,5-8,10-12
District 3 - Nova Central
3 Year CRT (Subtest) Mark Trend 2005-2007
OrganizationContent Voice
Sentence
Fluency
Word Choice Convention
Multiple Choice
ListeningReading
Rubrics Results: Percentage of students performing at Level 3 and Above 2005-2007
Demand WritingInformational
Reading
Poetic Reading Visual Reading Listening Speaking
20052006
2007
Process Writing (10 % Sample)
Rubrics Results: Percentage of students performing at Level 3 and Above 2005-2007
School data with 5 or fewer
students withheld for reasons
of confidentiality.
School data with 5 or fewer
students withheld for reasons
of confidentiality.
School data with 5 or fewer
students withheld for reasons
of confidentiality.
J:\PUBLIC07\PATPAM\CRTS\ELA03_W.RPT
242
24/11/2007
10:27:42PMSource: Division of Evaluation and Research, Department of Education

CRT School Results
Primary English Language Arts
2006-07
#174 - St. Peter's Academy, WestportGrades: K-3,5-8,10-12
District 3 - Nova Central
Difference from Provincial Mean, 2005-07
Multiple Choice
ListeningReading
2005 2006 2007
Process Writing (10 % Sample)
Rubrics Results: Percentage of students performing at Level 3 and Above 2005-2007
Content Word ChoiceVoice
Sentence
Fluency
Organization Convention
Rubrics Results: Percentage of students performing at Level 3 and Above 2005-2007
Demand WritingInformational
Reading
Poetic Reading Visual Reading Listening Speaking
Difference from Provincial Mean, 2005-07
Difference from Provincial Mean, 2005-07
School data with 5 or fewer
students withheld for reasons
of confidentiality.
School data with 5 or fewer
students withheld for reasons
of confidentiality.
School data with 5 or fewer
students withheld for reasons
of confidentiality.
J:\PUBLIC07\PATPAM\CRTS\ELA03_W.RPT
243
24/11/2007
10:27:42PMSource: Division of Evaluation and Research, Department of Education

CRT School Results
Primary English Language Arts
2006-07
#177 - Greenwood Academy, CampbelltonGrades: K-9
District 3 - Nova Central
Reading
Listening
Multiple Choice
School
vs
Province
School
vs
District
Mark
School
District
Province
Number of Students :
Rubrics
Process Writing
Content
Organization
Sentence Fluency
Voice
Word Choice
Conventions
Poetic Reading
Informational Reading
Visual Reading
Listening
Speaking
School
District
Province
School
District
Province
School
District
Province
School
District
Province
School
District
Province
School
District
Province
School
District
Province
School
District
Province
School
District
Province
School
District
Province
School
District
Province
School
District
Province
89.7
96.8
100.0
22
100.0
100.0
100.0
100.0
100.0
90.5
95.2
81.0
90.5
100.0
88.3
81.9
83.0
81.9
91.5
91.5
65.8
74.0
43.6
63.6
85.1
81.4
77.7
77.0
73.9
86.1
85.7
65.7
74.4
42.5
64.0
85.7
91.4
89.8
92.1
89.7
Demand Writing
School
District
Province
90.9
78.7
74.5
p
p
p
p
p
p
p
p
p
p
p
p
p
p
p
p
p
p
p
p
p
p
p
p
p
p
q q
J:\PUBLIC07\PATPAM\CRTS\ELA03_W.RPT
244
24/11/2007
10:27:42PMSource: Division of Evaluation and Research, Department of Education

CRT School Results
Primary English Language Arts
2006-07
#177 - Greenwood Academy, CampbelltonGrades: K-9
District 3 - Nova Central
3 Year CRT (Subtest) Mark Trend 2005-2007
OrganizationContent Voice
Sentence
Fluency
Word Choice Convention
Multiple Choice
ListeningReading
Rubrics Results: Percentage of students performing at Level 3 and Above 2005-2007
Demand WritingInformational
Reading
Poetic Reading Visual Reading Listening Speaking
20052006
2007
Process Writing (10 % Sample)
Rubrics Results: Percentage of students performing at Level 3 and Above 2005-2007
J:\PUBLIC07\PATPAM\CRTS\ELA03_W.RPT
245
24/11/2007
10:27:42PMSource: Division of Evaluation and Research, Department of Education

CRT School Results
Primary English Language Arts
2006-07
#177 - Greenwood Academy, CampbelltonGrades: K-9
District 3 - Nova Central
Difference from Provincial Mean, 2005-07
Multiple Choice
ListeningReading
2005 2006 2007
Process Writing (10 % Sample)
Rubrics Results: Percentage of students performing at Level 3 and Above 2005-2007
Content Word ChoiceVoice
Sentence
Fluency
Organization Convention
Rubrics Results: Percentage of students performing at Level 3 and Above 2005-2007
Demand WritingInformational
Reading
Poetic Reading Visual Reading Listening Speaking
Difference from Provincial Mean, 2005-07
Difference from Provincial Mean, 2005-07
J:\PUBLIC07\PATPAM\CRTS\ELA03_W.RPT
246
24/11/2007
10:27:42PMSource: Division of Evaluation and Research, Department of Education

CRT School Results
Primary English Language Arts
2006-07
#178 - Phoenix Academy, CarmanvilleGrades: K-12
District 3 - Nova Central
Reading
Listening
Multiple Choice
School
vs
Province
School
vs
District
Mark
School
District
Province
Number of Students :
Rubrics
Process Writing
Content
Organization
Sentence Fluency
Voice
Word Choice
Conventions
Poetic Reading
Informational Reading
Visual Reading
Listening
Speaking
School
District
Province
School
District
Province
School
District
Province
School
District
Province
School
District
Province
School
District
Province
School
District
Province
School
District
Province
School
District
Province
School
District
Province
School
District
Province
School
District
Province
83.3
88.3
50.0
20
50.0
50.0
50.0
50.0
50.0
0.0
45.0
5.0
30.0
100.0
88.3
81.9
83.0
81.9
91.5
91.5
65.8
74.0
43.6
63.6
85.1
81.4
77.7
77.0
73.9
86.1
85.7
65.7
74.4
42.5
64.0
85.7
91.4
89.8
92.1
89.7
Demand Writing
School
District
Province
31.6
78.7
74.5
p p
q q
q q
q q
q q
q q
q q
q q
q q
q q
q q
q q
J:\PUBLIC07\PATPAM\CRTS\ELA03_W.RPT
247
24/11/2007
10:27:42PMSource: Division of Evaluation and Research, Department of Education

CRT School Results
Primary English Language Arts
2006-07
#178 - Phoenix Academy, CarmanvilleGrades: K-12
District 3 - Nova Central
3 Year CRT (Subtest) Mark Trend 2005-2007
OrganizationContent Voice
Sentence
Fluency
Word Choice Convention
Multiple Choice
ListeningReading
Rubrics Results: Percentage of students performing at Level 3 and Above 2005-2007
Demand WritingInformational
Reading
Poetic Reading Visual Reading Listening Speaking
20052006
2007
Process Writing (10 % Sample)
Rubrics Results: Percentage of students performing at Level 3 and Above 2005-2007
J:\PUBLIC07\PATPAM\CRTS\ELA03_W.RPT
248
24/11/2007
10:27:42PMSource: Division of Evaluation and Research, Department of Education

CRT School Results
Primary English Language Arts
2006-07
#178 - Phoenix Academy, CarmanvilleGrades: K-12
District 3 - Nova Central
Difference from Provincial Mean, 2005-07
Multiple Choice
ListeningReading
2005 2006 2007
Process Writing (10 % Sample)
Rubrics Results: Percentage of students performing at Level 3 and Above 2005-2007
Content Word ChoiceVoice
Sentence
Fluency
Organization Convention
Rubrics Results: Percentage of students performing at Level 3 and Above 2005-2007
Demand WritingInformational
Reading
Poetic Reading Visual Reading Listening Speaking
Difference from Provincial Mean, 2005-07
Difference from Provincial Mean, 2005-07
J:\PUBLIC07\PATPAM\CRTS\ELA03_W.RPT
249
24/11/2007
10:27:42PMSource: Division of Evaluation and Research, Department of Education

CRT School Results
Primary English Language Arts
2006-07
#179 - Centreville Academy, Centreville-WarehamGrades: K-8
District 3 - Nova Central
Reading
Listening
Multiple Choice
School
vs
Province
School
vs
District
Mark
School
District
Province
Number of Students :
Rubrics
Process Writing
Content
Organization
Sentence Fluency
Voice
Word Choice
Conventions
Poetic Reading
Informational Reading
Visual Reading
Listening
Speaking
School
District
Province
School
District
Province
School
District
Province
School
District
Province
School
District
Province
School
District
Province
School
District
Province
School
District
Province
School
District
Province
School
District
Province
School
District
Province
School
District
Province
92.8
88.9
100.0
16
100.0
100.0
100.0
100.0
100.0
80.0
86.7
60.0
50.0
100.0
88.3
81.9
83.0
81.9
91.5
91.5
65.8
74.0
43.6
63.6
85.1
81.4
77.7
77.0
73.9
86.1
85.7
65.7
74.4
42.5
64.0
85.7
91.4
89.8
92.1
89.7
Demand Writing
School
District
Province
80.0
78.7
74.5
p
p
p
p
p
p
p
p
p
p
p
p
p
p
p
p
p
p
p
p
p
p
p
p
q q
J:\PUBLIC07\PATPAM\CRTS\ELA03_W.RPT
250
24/11/2007
10:27:42PMSource: Division of Evaluation and Research, Department of Education

CRT School Results
Primary English Language Arts
2006-07
#179 - Centreville Academy, Centreville-WarehamGrades: K-8
District 3 - Nova Central
3 Year CRT (Subtest) Mark Trend 2005-2007
OrganizationContent Voice
Sentence
Fluency
Word Choice Convention
Multiple Choice
ListeningReading
Rubrics Results: Percentage of students performing at Level 3 and Above 2005-2007
Demand WritingInformational
Reading
Poetic Reading Visual Reading Listening Speaking
20052006
2007
Process Writing (10 % Sample)
Rubrics Results: Percentage of students performing at Level 3 and Above 2005-2007
J:\PUBLIC07\PATPAM\CRTS\ELA03_W.RPT
251
24/11/2007
10:27:42PMSource: Division of Evaluation and Research, Department of Education

CRT School Results
Primary English Language Arts
2006-07
#179 - Centreville Academy, Centreville-WarehamGrades: K-8
District 3 - Nova Central
Difference from Provincial Mean, 2005-07
Multiple Choice
ListeningReading
2005 2006 2007
Process Writing (10 % Sample)
Rubrics Results: Percentage of students performing at Level 3 and Above 2005-2007
Content Word ChoiceVoice
Sentence
Fluency
Organization Convention
Rubrics Results: Percentage of students performing at Level 3 and Above 2005-2007
Demand WritingInformational
Reading
Poetic Reading Visual Reading Listening Speaking
Difference from Provincial Mean, 2005-07
Difference from Provincial Mean, 2005-07
J:\PUBLIC07\PATPAM\CRTS\ELA03_W.RPT
252
24/11/2007
10:27:42PMSource: Division of Evaluation and Research, Department of Education

CRT School Results
Primary English Language Arts
2006-07
#180 - A. R. Scammell Academy, Change IslandsGrades: K-1,3-12
District 3 - Nova Central
Reading
Listening
Multiple Choice
School
vs
Province
School
vs
District
Mark
School
District
Province
Number of Students :
Rubrics
Process Writing
Content
Organization
Sentence Fluency
Voice
Word Choice
Conventions
Poetic Reading
Informational Reading
Visual Reading
Listening
Speaking
School
District
Province
School
District
Province
School
District
Province
School
District
Province
School
District
Province
School
District
Province
School
District
Province
School
District
Province
School
District
Province
School
District
Province
School
District
Province
School
District
Province
2
88.3
81.9
83.0
81.9
91.5
91.5
65.8
74.0
43.6
63.6
85.1
81.4
77.7
77.0
73.9
86.1
85.7
65.7
74.4
42.5
64.0
85.7
91.4
89.8
92.1
89.7
Demand Writing
School
District
Province
78.7
74.5
p
p
p
p
p
p
q q
q q
q q
q q
q q
q q
q q
q q
q q
q q
School data with 5 or
fewer students withheld
for reasons of
confidentiality.
J:\PUBLIC07\PATPAM\CRTS\ELA03_W.RPT
253
24/11/2007
10:27:42PMSource: Division of Evaluation and Research, Department of Education

CRT School Results
Primary English Language Arts
2006-07
#180 - A. R. Scammell Academy, Change IslandsGrades: K-1,3-12
District 3 - Nova Central
3 Year CRT (Subtest) Mark Trend 2005-2007
OrganizationContent Voice
Sentence
Fluency
Word Choice Convention
Multiple Choice
ListeningReading
Rubrics Results: Percentage of students performing at Level 3 and Above 2005-2007
Demand WritingInformational
Reading
Poetic Reading Visual Reading Listening Speaking
20052006
2007
Process Writing (10 % Sample)
Rubrics Results: Percentage of students performing at Level 3 and Above 2005-2007
School data with 5 or fewer
students withheld for reasons
of confidentiality.
School data with 5 or fewer
students withheld for reasons
of confidentiality.
School data with 5 or fewer
students withheld for reasons
of confidentiality.
J:\PUBLIC07\PATPAM\CRTS\ELA03_W.RPT
254
24/11/2007
10:27:42PMSource: Division of Evaluation and Research, Department of Education
CRT School Results
Primary English Language Arts
2006-07
#180 - A. R. Scammell Academy, Change IslandsGrades: K-1,3-12
District 3 - Nova Central
Difference from Provincial Mean, 2005-07
Multiple Choice
ListeningReading
2005 2006 2007
Process Writing (10 % Sample)
Rubrics Results: Percentage of students performing at Level 3 and Above 2005-2007
Content Word ChoiceVoice
Sentence
Fluency
Organization Convention
Rubrics Results: Percentage of students performing at Level 3 and Above 2005-2007
Demand WritingInformational
Reading
Poetic Reading Visual Reading Listening Speaking
Difference from Provincial Mean, 2005-07
Difference from Provincial Mean, 2005-07
School data with 5 or fewer
students withheld for reasons
of confidentiality.
School data with 5 or fewer
students withheld for reasons
of confidentiality.
School data with 5 or fewer
students withheld for reasons
of confidentiality.
J:\PUBLIC07\PATPAM\CRTS\ELA03_W.RPT
255
24/11/2007
10:27:42PMSource: Division of Evaluation and Research, Department of Education

CRT School Results
Primary English Language Arts
2006-07
#182 - Charlottetown Primary, Charlottetown, B.B.Grades: K-3
District 3 - Nova Central
Reading
Listening
Multiple Choice
School
vs
Province
School
vs
District
Mark
School
District
Province
Number of Students :
Rubrics
Process Writing
Content
Organization
Sentence Fluency
Voice
Word Choice
Conventions
Poetic Reading
Informational Reading
Visual Reading
Listening
Speaking
School
District
Province
School
District
Province
School
District
Province
School
District
Province
School
District
Province
School
District
Province
School
District
Province
School
District
Province
School
District
Province
School
District
Province
School
District
Province
School
District
Province
3
88.3
81.9
83.0
81.9
91.5
91.5
65.8
74.0
43.6
63.6
85.1
81.4
77.7
77.0
73.9
86.1
85.7
65.7
74.4
42.5
64.0
85.7
91.4
89.8
92.1
89.7
Demand Writing
School
District
Province
78.7
74.5
p
p
p
p
p
p
p
p
p
p
q q
q q
q q
q q
q q
q q
q q
q q
School data with 5 or
fewer students withheld
for reasons of
confidentiality.
J:\PUBLIC07\PATPAM\CRTS\ELA03_W.RPT
256
24/11/2007
10:27:42PMSource: Division of Evaluation and Research, Department of Education

CRT School Results
Primary English Language Arts
2006-07
#182 - Charlottetown Primary, Charlottetown, B.B.Grades: K-3
District 3 - Nova Central
3 Year CRT (Subtest) Mark Trend 2005-2007
OrganizationContent Voice
Sentence
Fluency
Word Choice Convention
Multiple Choice
ListeningReading
Rubrics Results: Percentage of students performing at Level 3 and Above 2005-2007
Demand WritingInformational
Reading
Poetic Reading Visual Reading Listening Speaking
20052006
2007
Process Writing (10 % Sample)
Rubrics Results: Percentage of students performing at Level 3 and Above 2005-2007
School data with 5 or fewer
students withheld for reasons
of confidentiality.
School data with 5 or fewer
students withheld for reasons
of confidentiality.
School data with 5 or fewer
students withheld for reasons
of confidentiality.
J:\PUBLIC07\PATPAM\CRTS\ELA03_W.RPT
257
24/11/2007
10:27:42PMSource: Division of Evaluation and Research, Department of Education

CRT School Results
Primary English Language Arts
2006-07
#182 - Charlottetown Primary, Charlottetown, B.B.Grades: K-3
District 3 - Nova Central
Difference from Provincial Mean, 2005-07
Multiple Choice
ListeningReading
2005 2006 2007
Process Writing (10 % Sample)
Rubrics Results: Percentage of students performing at Level 3 and Above 2005-2007
Content Word ChoiceVoice
Sentence
Fluency
Organization Convention
Rubrics Results: Percentage of students performing at Level 3 and Above 2005-2007
Demand WritingInformational
Reading
Poetic Reading Visual Reading Listening Speaking
Difference from Provincial Mean, 2005-07
Difference from Provincial Mean, 2005-07
School data with 5 or fewer
students withheld for reasons
of confidentiality.
School data with 5 or fewer
students withheld for reasons
of confidentiality.
School data with 5 or fewer
students withheld for reasons
of confidentiality.
J:\PUBLIC07\PATPAM\CRTS\ELA03_W.RPT
258
24/11/2007
10:27:42PMSource: Division of Evaluation and Research, Department of Education

CRT School Results
Primary English Language Arts
2006-07
#183 - William Mercer Academy, DoverGrades: K-8
District 3 - Nova Central
Reading
Listening
Multiple Choice
School
vs
Province
School
vs
District
Mark
School
District
Province
Number of Students :
Rubrics
Process Writing
Content
Organization
Sentence Fluency
Voice
Word Choice
Conventions
Poetic Reading
Informational Reading
Visual Reading
Listening
Speaking
School
District
Province
School
District
Province
School
District
Province
School
District
Province
School
District
Province
School
District
Province
School
District
Province
School
District
Province
School
District
Province
School
District
Province
School
District
Province
School
District
Province
82.0
97.6
100.0
14
50.0
50.0
100.0
50.0
50.0
27.3
100.0
50.0
28.6
100.0
88.3
81.9
83.0
81.9
91.5
91.5
65.8
74.0
43.6
63.6
85.1
81.4
77.7
77.0
73.9
86.1
85.7
65.7
74.4
42.5
64.0
85.7
91.4
89.8
92.1
89.7
Demand Writing
School
District
Province
35.7
78.7
74.5
p
p
p
p
p
p
p
p
p
p
p
p
q q
q q
q q
q q
q q
q q
q q
J:\PUBLIC07\PATPAM\CRTS\ELA03_W.RPT
259
24/11/2007
10:27:42PMSource: Division of Evaluation and Research, Department of Education

CRT School Results
Primary English Language Arts
2006-07
#183 - William Mercer Academy, DoverGrades: K-8
District 3 - Nova Central
3 Year CRT (Subtest) Mark Trend 2005-2007
OrganizationContent Voice
Sentence
Fluency
Word Choice Convention
Multiple Choice
ListeningReading
Rubrics Results: Percentage of students performing at Level 3 and Above 2005-2007
Demand WritingInformational
Reading
Poetic Reading Visual Reading Listening Speaking
20052006
2007
Process Writing (10 % Sample)
Rubrics Results: Percentage of students performing at Level 3 and Above 2005-2007
J:\PUBLIC07\PATPAM\CRTS\ELA03_W.RPT
260
24/11/2007
10:27:42PMSource: Division of Evaluation and Research, Department of Education

CRT School Results
Primary English Language Arts
2006-07
#183 - William Mercer Academy, DoverGrades: K-8
District 3 - Nova Central
Difference from Provincial Mean, 2005-07
Multiple Choice
ListeningReading
2005 2006 2007
Process Writing (10 % Sample)
Rubrics Results: Percentage of students performing at Level 3 and Above 2005-2007
Content Word ChoiceVoice
Sentence
Fluency
Organization Convention
Rubrics Results: Percentage of students performing at Level 3 and Above 2005-2007
Demand WritingInformational
Reading
Poetic Reading Visual Reading Listening Speaking
Difference from Provincial Mean, 2005-07
Difference from Provincial Mean, 2005-07
J:\PUBLIC07\PATPAM\CRTS\ELA03_W.RPT
261
24/11/2007
10:27:42PMSource: Division of Evaluation and Research, Department of Education

CRT School Results
Primary English Language Arts
2006-07
#186 - Heritage Academy, GreenspondGrades: K-3
District 3 - Nova Central
Reading
Listening
Multiple Choice
School
vs
Province
School
vs
District
Mark
School
District
Province
Number of Students :
Rubrics
Process Writing
Content
Organization
Sentence Fluency
Voice
Word Choice
Conventions
Poetic Reading
Informational Reading
Visual Reading
Listening
Speaking
School
District
Province
School
District
Province
School
District
Province
School
District
Province
School
District
Province
School
District
Province
School
District
Province
School
District
Province
School
District
Province
School
District
Province
School
District
Province
School
District
Province
1
88.3
81.9
83.0
81.9
91.5
91.5
65.8
74.0
43.6
63.6
85.1
81.4
77.7
77.0
73.9
86.1
85.7
65.7
74.4
42.5
64.0
85.7
91.4
89.8
92.1
89.7
Demand Writing
School
District
Province
78.7
74.5
p
p
p
p
p
p
p
p
p
p
p
p
p
p
p
p
p
p
p
p
p
p
p
p
q q
q q
School data with 5 or
fewer students withheld
for reasons of
confidentiality.
J:\PUBLIC07\PATPAM\CRTS\ELA03_W.RPT
262
24/11/2007
10:27:42PMSource: Division of Evaluation and Research, Department of Education

CRT School Results
Primary English Language Arts
2006-07
#186 - Heritage Academy, GreenspondGrades: K-3
District 3 - Nova Central
3 Year CRT (Subtest) Mark Trend 2005-2007
OrganizationContent Voice
Sentence
Fluency
Word Choice Convention
Multiple Choice
ListeningReading
Rubrics Results: Percentage of students performing at Level 3 and Above 2005-2007
Demand WritingInformational
Reading
Poetic Reading Visual Reading Listening Speaking
20052006
2007
Process Writing (10 % Sample)
Rubrics Results: Percentage of students performing at Level 3 and Above 2005-2007
School data with 5 or fewer
students withheld for reasons
of confidentiality.
School data with 5 or fewer
students withheld for reasons
of confidentiality.
School data with 5 or fewer
students withheld for reasons
of confidentiality.
J:\PUBLIC07\PATPAM\CRTS\ELA03_W.RPT
263
24/11/2007
10:27:42PMSource: Division of Evaluation and Research, Department of Education

CRT School Results
Primary English Language Arts
2006-07
#186 - Heritage Academy, GreenspondGrades: K-3
District 3 - Nova Central
Difference from Provincial Mean, 2005-07
Multiple Choice
ListeningReading
2005 2006 2007
Process Writing (10 % Sample)
Rubrics Results: Percentage of students performing at Level 3 and Above 2005-2007
Content Word ChoiceVoice
Sentence
Fluency
Organization Convention
Rubrics Results: Percentage of students performing at Level 3 and Above 2005-2007
Demand WritingInformational
Reading
Poetic Reading Visual Reading Listening Speaking
Difference from Provincial Mean, 2005-07
Difference from Provincial Mean, 2005-07
School data with 5 or fewer
students withheld for reasons
of confidentiality.
School data with 5 or fewer
students withheld for reasons
of confidentiality.
School data with 5 or fewer
students withheld for reasons
of confidentiality.
J:\PUBLIC07\PATPAM\CRTS\ELA03_W.RPT
264
24/11/2007
10:27:42PMSource: Division of Evaluation and Research, Department of Education

CRT School Results
Primary English Language Arts
2006-07
#188 - Sandstone Academy, Ladle CoveGrades: K-6
District 3 - Nova Central
Reading
Listening
Multiple Choice
School
vs
Province
School
vs
District
Mark
School
District
Province
Number of Students :
Rubrics
Process Writing
Content
Organization
Sentence Fluency
Voice
Word Choice
Conventions
Poetic Reading
Informational Reading
Visual Reading
Listening
Speaking
School
District
Province
School
District
Province
School
District
Province
School
District
Province
School
District
Province
School
District
Province
School
District
Province
School
District
Province
School
District
Province
School
District
Province
School
District
Province
School
District
Province
1
88.3
81.9
83.0
81.9
91.5
91.5
65.8
74.0
43.6
63.6
85.1
81.4
77.7
77.0
73.9
86.1
85.7
65.7
74.4
42.5
64.0
85.7
91.4
89.8
92.1
89.7
Demand Writing
School
District
Province
78.7
74.5
p
p
p
p
p
p
p
p
p
p
p
p
p
p
p
p
p
p
p
p
p
p
p
p
p
p
p
p
School data with 5 or
fewer students withheld
for reasons of
confidentiality.
J:\PUBLIC07\PATPAM\CRTS\ELA03_W.RPT
265
24/11/2007
10:27:42PMSource: Division of Evaluation and Research, Department of Education

CRT School Results
Primary English Language Arts
2006-07
#188 - Sandstone Academy, Ladle CoveGrades: K-6
District 3 - Nova Central
3 Year CRT (Subtest) Mark Trend 2005-2007
OrganizationContent Voice
Sentence
Fluency
Word Choice Convention
Multiple Choice
ListeningReading
Rubrics Results: Percentage of students performing at Level 3 and Above 2005-2007
Demand WritingInformational
Reading
Poetic Reading Visual Reading Listening Speaking
20052006
2007
Process Writing (10 % Sample)
Rubrics Results: Percentage of students performing at Level 3 and Above 2005-2007
School data with 5 or fewer
students withheld for reasons
of confidentiality.
School data with 5 or fewer
students withheld for reasons
of confidentiality.
School data with 5 or fewer
students withheld for reasons
of confidentiality.
J:\PUBLIC07\PATPAM\CRTS\ELA03_W.RPT
266
24/11/2007
10:27:42PMSource: Division of Evaluation and Research, Department of Education

CRT School Results
Primary English Language Arts
2006-07
#188 - Sandstone Academy, Ladle CoveGrades: K-6
District 3 - Nova Central
Difference from Provincial Mean, 2005-07
Multiple Choice
ListeningReading
2005 2006 2007
Process Writing (10 % Sample)
Rubrics Results: Percentage of students performing at Level 3 and Above 2005-2007
Content Word ChoiceVoice
Sentence
Fluency
Organization Convention
Rubrics Results: Percentage of students performing at Level 3 and Above 2005-2007
Demand WritingInformational
Reading
Poetic Reading Visual Reading Listening Speaking
Difference from Provincial Mean, 2005-07
Difference from Provincial Mean, 2005-07
School data with 5 or fewer
students withheld for reasons
of confidentiality.
School data with 5 or fewer
students withheld for reasons
of confidentiality.
School data with 5 or fewer
students withheld for reasons
of confidentiality.
J:\PUBLIC07\PATPAM\CRTS\ELA03_W.RPT
267
24/11/2007
10:27:42PMSource: Division of Evaluation and Research, Department of Education

CRT School Results
Primary English Language Arts
2006-07
#189 - Lewisporte Academy, LewisporteGrades: K-9
District 3 - Nova Central
Reading
Listening
Multiple Choice
School
vs
Province
School
vs
District
Mark
School
District
Province
Number of Students :
Rubrics
Process Writing
Content
Organization
Sentence Fluency
Voice
Word Choice
Conventions
Poetic Reading
Informational Reading
Visual Reading
Listening
Speaking
School
District
Province
School
District
Province
School
District
Province
School
District
Province
School
District
Province
School
District
Province
School
District
Province
School
District
Province
School
District
Province
School
District
Province
School
District
Province
School
District
Province
91.1
91.0
83.3
52
83.3
66.7
50.0
83.3
83.3
44.9
83.7
49.0
50.0
71.4
88.3
81.9
83.0
81.9
91.5
91.5
65.8
74.0
43.6
63.6
85.1
81.4
77.7
77.0
73.9
86.1
85.7
65.7
74.4
42.5
64.0
85.7
91.4
89.8
92.1
89.7
Demand Writing
School
District
Province
76.9
78.7
74.5
p
p
p
p
p
p
p
p
p
p
q
q q
q q
q q
q q
q
q q
q q
q q
J:\PUBLIC07\PATPAM\CRTS\ELA03_W.RPT
268
24/11/2007
10:27:42PMSource: Division of Evaluation and Research, Department of Education

CRT School Results
Primary English Language Arts
2006-07
#189 - Lewisporte Academy, LewisporteGrades: K-9
District 3 - Nova Central
3 Year CRT (Subtest) Mark Trend 2005-2007
OrganizationContent Voice
Sentence
Fluency
Word Choice Convention
Multiple Choice
ListeningReading
Rubrics Results: Percentage of students performing at Level 3 and Above 2005-2007
Demand WritingInformational
Reading
Poetic Reading Visual Reading Listening Speaking
20052006
2007
Process Writing (10 % Sample)
Rubrics Results: Percentage of students performing at Level 3 and Above 2005-2007
J:\PUBLIC07\PATPAM\CRTS\ELA03_W.RPT
269
24/11/2007
10:27:42PMSource: Division of Evaluation and Research, Department of Education
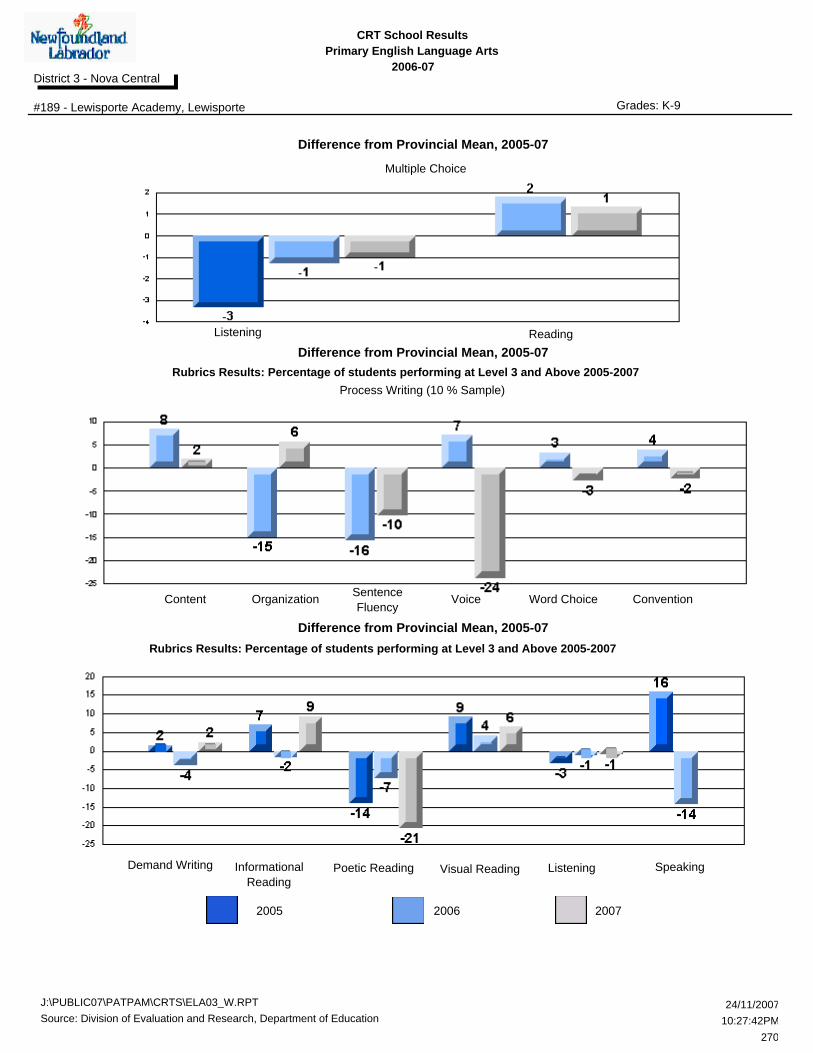
CRT School Results
Primary English Language Arts
2006-07
#189 - Lewisporte Academy, LewisporteGrades: K-9
District 3 - Nova Central
Difference from Provincial Mean, 2005-07
Multiple Choice
ListeningReading
2005 2006 2007
Process Writing (10 % Sample)
Rubrics Results: Percentage of students performing at Level 3 and Above 2005-2007
Content Word ChoiceVoice
Sentence
Fluency
Organization Convention
Rubrics Results: Percentage of students performing at Level 3 and Above 2005-2007
Demand WritingInformational
Reading
Poetic Reading Visual Reading Listening Speaking
Difference from Provincial Mean, 2005-07
Difference from Provincial Mean, 2005-07
J:\PUBLIC07\PATPAM\CRTS\ELA03_W.RPT
270
24/11/2007
10:27:42PMSource: Division of Evaluation and Research, Department of Education

CRT School Results
Primary English Language Arts
2006-07
#192 - Lumsden School Complex, LumsdenGrades: K-12
District 3 - Nova Central
Reading
Listening
Multiple Choice
School
vs
Province
School
vs
District
Mark
School
District
Province
Number of Students :
Rubrics
Process Writing
Content
Organization
Sentence Fluency
Voice
Word Choice
Conventions
Poetic Reading
Informational Reading
Visual Reading
Listening
Speaking
School
District
Province
School
District
Province
School
District
Province
School
District
Province
School
District
Province
School
District
Province
School
District
Province
School
District
Province
School
District
Province
School
District
Province
School
District
Province
School
District
Province
4
88.3
81.9
83.0
81.9
91.5
91.5
65.8
74.0
43.6
63.6
85.1
81.4
77.7
77.0
73.9
86.1
85.7
65.7
74.4
42.5
64.0
85.7
91.4
89.8
92.1
89.7
Demand Writing
School
District
Province
78.7
74.5
p
p
p
p
p
p
p
p
p
p
p
p
p
p
p
p
p
p
q q
q q
q q
School data with 5 or
fewer students withheld
for reasons of
confidentiality.
J:\PUBLIC07\PATPAM\CRTS\ELA03_W.RPT
271
24/11/2007
10:27:42PMSource: Division of Evaluation and Research, Department of Education

CRT School Results
Primary English Language Arts
2006-07
#192 - Lumsden School Complex, LumsdenGrades: K-12
District 3 - Nova Central
3 Year CRT (Subtest) Mark Trend 2005-2007
OrganizationContent Voice
Sentence
Fluency
Word Choice Convention
Multiple Choice
ListeningReading
Rubrics Results: Percentage of students performing at Level 3 and Above 2005-2007
Demand WritingInformational
Reading
Poetic Reading Visual Reading Listening Speaking
20052006
2007
Process Writing (10 % Sample)
Rubrics Results: Percentage of students performing at Level 3 and Above 2005-2007
School data with 5 or fewer
students withheld for reasons
of confidentiality.
School data with 5 or fewer
students withheld for reasons
of confidentiality.
School data with 5 or fewer
students withheld for reasons
of confidentiality.
J:\PUBLIC07\PATPAM\CRTS\ELA03_W.RPT
272
24/11/2007
10:27:42PMSource: Division of Evaluation and Research, Department of Education

CRT School Results
Primary English Language Arts
2006-07
#192 - Lumsden School Complex, LumsdenGrades: K-12
District 3 - Nova Central
Difference from Provincial Mean, 2005-07
Multiple Choice
ListeningReading
2005 2006 2007
Process Writing (10 % Sample)
Rubrics Results: Percentage of students performing at Level 3 and Above 2005-2007
Content Word ChoiceVoice
Sentence
Fluency
Organization Convention
Rubrics Results: Percentage of students performing at Level 3 and Above 2005-2007
Demand WritingInformational
Reading
Poetic Reading Visual Reading Listening Speaking
Difference from Provincial Mean, 2005-07
Difference from Provincial Mean, 2005-07
School data with 5 or fewer
students withheld for reasons
of confidentiality.
School data with 5 or fewer
students withheld for reasons
of confidentiality.
School data with 5 or fewer
students withheld for reasons
of confidentiality.
J:\PUBLIC07\PATPAM\CRTS\ELA03_W.RPT
273
24/11/2007
10:27:42PMSource: Division of Evaluation and Research, Department of Education

CRT School Results
Primary English Language Arts
2006-07
#194 - Gill Memorial Academy, Musgrave HarbourGrades: K-12
District 3 - Nova Central
Reading
Listening
Multiple Choice
School
vs
Province
School
vs
District
Mark
School
District
Province
Number of Students :
Rubrics
Process Writing
Content
Organization
Sentence Fluency
Voice
Word Choice
Conventions
Poetic Reading
Informational Reading
Visual Reading
Listening
Speaking
School
District
Province
School
District
Province
School
District
Province
School
District
Province
School
District
Province
School
District
Province
School
District
Province
School
District
Province
School
District
Province
School
District
Province
School
District
Province
School
District
Province
3
88.3
81.9
83.0
81.9
91.5
91.5
65.8
74.0
43.6
63.6
85.1
81.4
77.7
77.0
73.9
86.1
85.7
65.7
74.4
42.5
64.0
85.7
91.4
89.8
92.1
89.7
Demand Writing
School
District
Province
78.7
74.5
p
p
p
p
p
p
p
p
p
p
p
p
p
p
q q
q q
q q
q q
q q
q q
q q
School data with 5 or
fewer students withheld
for reasons of
confidentiality.
J:\PUBLIC07\PATPAM\CRTS\ELA03_W.RPT
274
24/11/2007
10:27:42PMSource: Division of Evaluation and Research, Department of Education

CRT School Results
Primary English Language Arts
2006-07
#194 - Gill Memorial Academy, Musgrave HarbourGrades: K-12
District 3 - Nova Central
3 Year CRT (Subtest) Mark Trend 2005-2007
OrganizationContent Voice
Sentence
Fluency
Word Choice Convention
Multiple Choice
ListeningReading
Rubrics Results: Percentage of students performing at Level 3 and Above 2005-2007
Demand WritingInformational
Reading
Poetic Reading Visual Reading Listening Speaking
20052006
2007
Process Writing (10 % Sample)
Rubrics Results: Percentage of students performing at Level 3 and Above 2005-2007
School data with 5 or fewer
students withheld for reasons
of confidentiality.
School data with 5 or fewer
students withheld for reasons
of confidentiality.
School data with 5 or fewer
students withheld for reasons
of confidentiality.
J:\PUBLIC07\PATPAM\CRTS\ELA03_W.RPT
275
24/11/2007
10:27:42PMSource: Division of Evaluation and Research, Department of Education

CRT School Results
Primary English Language Arts
2006-07
#194 - Gill Memorial Academy, Musgrave HarbourGrades: K-12
District 3 - Nova Central
Difference from Provincial Mean, 2005-07
Multiple Choice
ListeningReading
2005 2006 2007
Process Writing (10 % Sample)
Rubrics Results: Percentage of students performing at Level 3 and Above 2005-2007
Content Word ChoiceVoice
Sentence
Fluency
Organization Convention
Rubrics Results: Percentage of students performing at Level 3 and Above 2005-2007
Demand WritingInformational
Reading
Poetic Reading Visual Reading Listening Speaking
Difference from Provincial Mean, 2005-07
Difference from Provincial Mean, 2005-07
School data with 5 or fewer
students withheld for reasons
of confidentiality.
School data with 5 or fewer
students withheld for reasons
of confidentiality.
School data with 5 or fewer
students withheld for reasons
of confidentiality.
J:\PUBLIC07\PATPAM\CRTS\ELA03_W.RPT
276
24/11/2007
10:27:42PMSource: Division of Evaluation and Research, Department of Education

CRT School Results
Primary English Language Arts
2006-07
#202 - Twillingate Island Elementary, TwillingateGrades: K-6
District 3 - Nova Central
Reading
Listening
Multiple Choice
School
vs
Province
School
vs
District
Mark
School
District
Province
Number of Students :
Rubrics
Process Writing
Content
Organization
Sentence Fluency
Voice
Word Choice
Conventions
Poetic Reading
Informational Reading
Visual Reading
Listening
Speaking
School
District
Province
School
District
Province
School
District
Province
School
District
Province
School
District
Province
School
District
Province
School
District
Province
School
District
Province
School
District
Province
School
District
Province
School
District
Province
School
District
Province
95.8
98.6
100.0
23
100.0
100.0
100.0
100.0
100.0
72.7
81.8
50.0
78.3
100.0
88.3
81.9
83.0
81.9
91.5
91.5
65.8
74.0
43.6
63.6
85.1
81.4
77.7
77.0
73.9
86.1
85.7
65.7
74.4
42.5
64.0
85.7
91.4
89.8
92.1
89.7
Demand Writing
School
District
Province
82.6
78.7
74.5
p
p
p
p
p
p
p
p
p
p
p
p
p
p
p
p
p
p
p
p
p
p
p
p
p
p
p
p
J:\PUBLIC07\PATPAM\CRTS\ELA03_W.RPT
277
24/11/2007
10:27:42PMSource: Division of Evaluation and Research, Department of Education

CRT School Results
Primary English Language Arts
2006-07
#202 - Twillingate Island Elementary, TwillingateGrades: K-6
District 3 - Nova Central
3 Year CRT (Subtest) Mark Trend 2005-2007
OrganizationContent Voice
Sentence
Fluency
Word Choice Convention
Multiple Choice
ListeningReading
Rubrics Results: Percentage of students performing at Level 3 and Above 2005-2007
Demand WritingInformational
Reading
Poetic Reading Visual Reading Listening Speaking
20052006
2007
Process Writing (10 % Sample)
Rubrics Results: Percentage of students performing at Level 3 and Above 2005-2007
J:\PUBLIC07\PATPAM\CRTS\ELA03_W.RPT
278
24/11/2007
10:27:42PMSource: Division of Evaluation and Research, Department of Education

CRT School Results
Primary English Language Arts
2006-07
#202 - Twillingate Island Elementary, TwillingateGrades: K-6
District 3 - Nova Central
Difference from Provincial Mean, 2005-07
Multiple Choice
ListeningReading
2005 2006 2007
Process Writing (10 % Sample)
Rubrics Results: Percentage of students performing at Level 3 and Above 2005-2007
Content Word ChoiceVoice
Sentence
Fluency
Organization Convention
Rubrics Results: Percentage of students performing at Level 3 and Above 2005-2007
Demand WritingInformational
Reading
Poetic Reading Visual Reading Listening Speaking
Difference from Provincial Mean, 2005-07
Difference from Provincial Mean, 2005-07
J:\PUBLIC07\PATPAM\CRTS\ELA03_W.RPT
279
24/11/2007
10:27:42PMSource: Division of Evaluation and Research, Department of Education

CRT School Results
Primary English Language Arts
2006-07
#205 - Memorial Academy, WesleyvilleGrades: K-6
District 3 - Nova Central
Reading
Listening
Multiple Choice
School
vs
Province
School
vs
District
Mark
School
District
Province
Number of Students :
Rubrics
Process Writing
Content
Organization
Sentence Fluency
Voice
Word Choice
Conventions
Poetic Reading
Informational Reading
Visual Reading
Listening
Speaking
School
District
Province
School
District
Province
School
District
Province
School
District
Province
School
District
Province
School
District
Province
School
District
Province
School
District
Province
School
District
Province
School
District
Province
School
District
Province
School
District
Province
88.2
92.2
50.0
17
100.0
50.0
50.0
100.0
100.0
58.8
64.7
35.3
70.6
100.0
88.3
81.9
83.0
81.9
91.5
91.5
65.8
74.0
43.6
63.6
85.1
81.4
77.7
77.0
73.9
86.1
85.7
65.7
74.4
42.5
64.0
85.7
91.4
89.8
92.1
89.7
Demand Writing
School
District
Province
76.5
78.7
74.5
p
p
p
p
p
p
p
p
p
p
p
p
p
q q
q q
q q
q q
q
q q
q q
q q
J:\PUBLIC07\PATPAM\CRTS\ELA03_W.RPT
280
24/11/2007
10:27:42PMSource: Division of Evaluation and Research, Department of Education

CRT School Results
Primary English Language Arts
2006-07
#205 - Memorial Academy, WesleyvilleGrades: K-6
District 3 - Nova Central
3 Year CRT (Subtest) Mark Trend 2005-2007
OrganizationContent Voice
Sentence
Fluency
Word Choice Convention
Multiple Choice
ListeningReading
Rubrics Results: Percentage of students performing at Level 3 and Above 2005-2007
Demand WritingInformational
Reading
Poetic Reading Visual Reading Listening Speaking
20052006
2007
Process Writing (10 % Sample)
Rubrics Results: Percentage of students performing at Level 3 and Above 2005-2007
J:\PUBLIC07\PATPAM\CRTS\ELA03_W.RPT
281
24/11/2007
10:27:42PMSource: Division of Evaluation and Research, Department of Education

CRT School Results
Primary English Language Arts
2006-07
#205 - Memorial Academy, WesleyvilleGrades: K-6
District 3 - Nova Central
Difference from Provincial Mean, 2005-07
Multiple Choice
ListeningReading
2005 2006 2007
Process Writing (10 % Sample)
Rubrics Results: Percentage of students performing at Level 3 and Above 2005-2007
Content Word ChoiceVoice
Sentence
Fluency
Organization Convention
Rubrics Results: Percentage of students performing at Level 3 and Above 2005-2007
Demand WritingInformational
Reading
Poetic Reading Visual Reading Listening Speaking
Difference from Provincial Mean, 2005-07
Difference from Provincial Mean, 2005-07
J:\PUBLIC07\PATPAM\CRTS\ELA03_W.RPT
282
24/11/2007
10:27:42PMSource: Division of Evaluation and Research, Department of Education

CRT School Results
Primary English Language Arts
2006-07
#206 - Riverwood Academy, Wing's PointGrades: K-12
District 3 - Nova Central
Reading
Listening
Multiple Choice
School
vs
Province
School
vs
District
Mark
School
District
Province
Number of Students :
Rubrics
Process Writing
Content
Organization
Sentence Fluency
Voice
Word Choice
Conventions
Poetic Reading
Informational Reading
Visual Reading
Listening
Speaking
School
District
Province
School
District
Province
School
District
Province
School
District
Province
School
District
Province
School
District
Province
School
District
Province
School
District
Province
School
District
Province
School
District
Province
School
District
Province
School
District
Province
81.1
78.6
100.0
30
100.0
50.0
50.0
100.0
100.0
80.0
61.9
28.6
64.3
100.0
88.3
81.9
83.0
81.9
91.5
91.5
65.8
74.0
43.6
63.6
85.1
81.4
77.7
77.0
73.9
86.1
85.7
65.7
74.4
42.5
64.0
85.7
91.4
89.8
92.1
89.7
Demand Writing
School
District
Province
76.0
78.7
74.5
p
p
p
p
p
p
p
p
p
p
p
p
p
p
p
q q
q q
q q
q
q q
q q
J:\PUBLIC07\PATPAM\CRTS\ELA03_W.RPT
283
24/11/2007
10:27:42PMSource: Division of Evaluation and Research, Department of Education

CRT School Results
Primary English Language Arts
2006-07
#206 - Riverwood Academy, Wing's PointGrades: K-12
District 3 - Nova Central
3 Year CRT (Subtest) Mark Trend 2005-2007
OrganizationContent Voice
Sentence
Fluency
Word Choice Convention
Multiple Choice
ListeningReading
Rubrics Results: Percentage of students performing at Level 3 and Above 2005-2007
Demand WritingInformational
Reading
Poetic Reading Visual Reading Listening Speaking
20052006
2007
Process Writing (10 % Sample)
Rubrics Results: Percentage of students performing at Level 3 and Above 2005-2007
J:\PUBLIC07\PATPAM\CRTS\ELA03_W.RPT
284
24/11/2007
10:27:42PMSource: Division of Evaluation and Research, Department of Education

CRT School Results
Primary English Language Arts
2006-07
#206 - Riverwood Academy, Wing's PointGrades: K-12
District 3 - Nova Central
Difference from Provincial Mean, 2005-07
Multiple Choice
ListeningReading
2005 2006 2007
Process Writing (10 % Sample)
Rubrics Results: Percentage of students performing at Level 3 and Above 2005-2007
Content Word ChoiceVoice
Sentence
Fluency
Organization Convention
Rubrics Results: Percentage of students performing at Level 3 and Above 2005-2007
Demand WritingInformational
Reading
Poetic Reading Visual Reading Listening Speaking
Difference from Provincial Mean, 2005-07
Difference from Provincial Mean, 2005-07
J:\PUBLIC07\PATPAM\CRTS\ELA03_W.RPT
285
24/11/2007
10:27:42PMSource: Division of Evaluation and Research, Department of Education

CRT School Results
Primary English Language Arts
2006-07
#398 - Avoca Collegiate, BadgerGrades: K-9
District 3 - Nova Central
Reading
Listening
Multiple Choice
School
vs
Province
School
vs
District
Mark
School
District
Province
Number of Students :
Rubrics
Process Writing
Content
Organization
Sentence Fluency
Voice
Word Choice
Conventions
Poetic Reading
Informational Reading
Visual Reading
Listening
Speaking
School
District
Province
School
District
Province
School
District
Province
School
District
Province
School
District
Province
School
District
Province
School
District
Province
School
District
Province
School
District
Province
School
District
Province
School
District
Province
School
District
Province
86.1
100.0
100.0
6
100.0
0.0
100.0
100.0
0.0
50.0
83.3
16.7
66.7
100.0
88.3
81.9
83.0
81.9
91.5
91.5
65.8
74.0
43.6
63.6
85.1
81.4
77.7
77.0
73.9
86.1
85.7
65.7
74.4
42.5
64.0
85.7
91.4
89.8
92.1
89.7
Demand Writing
School
District
Province
66.7
78.7
74.5
p
p
p
p
p
p
p
p
p
p
p
p
p
p
p
p
q q
q q
q q
q q
q q
J:\PUBLIC07\PATPAM\CRTS\ELA03_W.RPT
286
24/11/2007
10:27:42PMSource: Division of Evaluation and Research, Department of Education
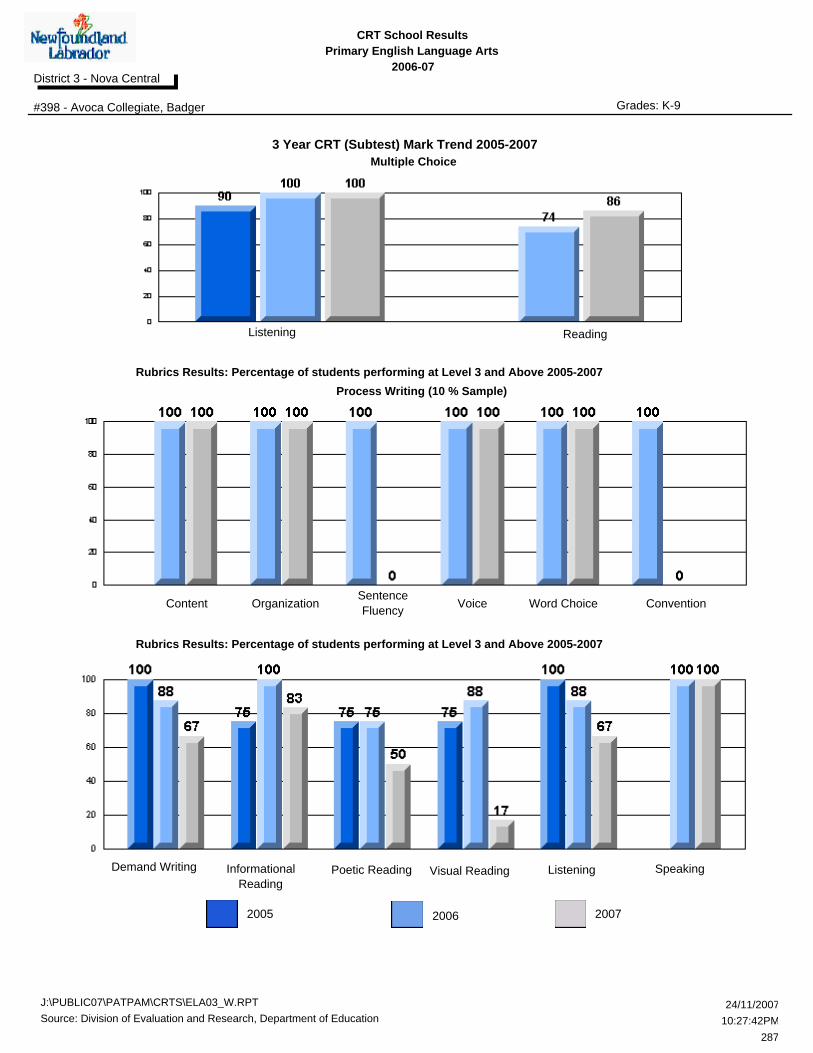
CRT School Results
Primary English Language Arts
2006-07
#398 - Avoca Collegiate, BadgerGrades: K-9
District 3 - Nova Central
3 Year CRT (Subtest) Mark Trend 2005-2007
OrganizationContent Voice
Sentence
Fluency
Word Choice Convention
Multiple Choice
ListeningReading
Rubrics Results: Percentage of students performing at Level 3 and Above 2005-2007
Demand WritingInformational
Reading
Poetic Reading Visual Reading Listening Speaking
20052006
2007
Process Writing (10 % Sample)
Rubrics Results: Percentage of students performing at Level 3 and Above 2005-2007
J:\PUBLIC07\PATPAM\CRTS\ELA03_W.RPT
287
24/11/2007
10:27:42PMSource: Division of Evaluation and Research, Department of Education

CRT School Results
Primary English Language Arts
2006-07
#398 - Avoca Collegiate, BadgerGrades: K-9
District 3 - Nova Central
Difference from Provincial Mean, 2005-07
Multiple Choice
ListeningReading
2005 2006 2007
Process Writing (10 % Sample)
Rubrics Results: Percentage of students performing at Level 3 and Above 2005-2007
Content Word ChoiceVoice
Sentence
Fluency
Organization Convention
Rubrics Results: Percentage of students performing at Level 3 and Above 2005-2007
Demand WritingInformational
Reading
Poetic Reading Visual Reading Listening Speaking
Difference from Provincial Mean, 2005-07
Difference from Provincial Mean, 2005-07
J:\PUBLIC07\PATPAM\CRTS\ELA03_W.RPT
288
24/11/2007
10:27:42PMSource: Division of Evaluation and Research, Department of Education

CRT School Results
Primary English Language Arts
2006-07
#399 - Baie Verte Academy, Baie VerteGrades: K-6
District 3 - Nova Central
Reading
Listening
Multiple Choice
School
vs
Province
School
vs
District
Mark
School
District
Province
Number of Students :
Rubrics
Process Writing
Content
Organization
Sentence Fluency
Voice
Word Choice
Conventions
Poetic Reading
Informational Reading
Visual Reading
Listening
Speaking
School
District
Province
School
District
Province
School
District
Province
School
District
Province
School
District
Province
School
District
Province
School
District
Province
School
District
Province
School
District
Province
School
District
Province
School
District
Province
School
District
Province
97.1
100.0
100.0
20
100.0
100.0
100.0
100.0
100.0
85.0
100.0
85.0
95.0
100.0
88.3
81.9
83.0
81.9
91.5
91.5
65.8
74.0
43.6
63.6
85.1
81.4
77.7
77.0
73.9
86.1
85.7
65.7
74.4
42.5
64.0
85.7
91.4
89.8
92.1
89.7
Demand Writing
School
District
Province
100.0
78.7
74.5
p
p
p
p
p
p
p
p
p
p
p
p
p
p
p
p
p
p
p
p
p
p
p
p
p
p
p
p
J:\PUBLIC07\PATPAM\CRTS\ELA03_W.RPT
289
24/11/2007
10:27:42PMSource: Division of Evaluation and Research, Department of Education

CRT School Results
Primary English Language Arts
2006-07
#399 - Baie Verte Academy, Baie VerteGrades: K-6
District 3 - Nova Central
3 Year CRT (Subtest) Mark Trend 2005-2007
OrganizationContent Voice
Sentence
Fluency
Word Choice Convention
Multiple Choice
ListeningReading
Rubrics Results: Percentage of students performing at Level 3 and Above 2005-2007
Demand WritingInformational
Reading
Poetic Reading Visual Reading Listening Speaking
20052006
2007
Process Writing (10 % Sample)
Rubrics Results: Percentage of students performing at Level 3 and Above 2005-2007
J:\PUBLIC07\PATPAM\CRTS\ELA03_W.RPT
290
24/11/2007
10:27:42PMSource: Division of Evaluation and Research, Department of Education

CRT School Results
Primary English Language Arts
2006-07
#399 - Baie Verte Academy, Baie VerteGrades: K-6
District 3 - Nova Central
Difference from Provincial Mean, 2005-07
Multiple Choice
ListeningReading
2005 2006 2007
Process Writing (10 % Sample)
Rubrics Results: Percentage of students performing at Level 3 and Above 2005-2007
Content Word ChoiceVoice
Sentence
Fluency
Organization Convention
Rubrics Results: Percentage of students performing at Level 3 and Above 2005-2007
Demand WritingInformational
Reading
Poetic Reading Visual Reading Listening Speaking
Difference from Provincial Mean, 2005-07
Difference from Provincial Mean, 2005-07
J:\PUBLIC07\PATPAM\CRTS\ELA03_W.RPT
291
24/11/2007
10:27:42PMSource: Division of Evaluation and Research, Department of Education

CRT School Results
Primary English Language Arts
2006-07
#400 - Helen Tulk Elementary, Bishop's FallsGrades: K-6
District 3 - Nova Central
Reading
Listening
Multiple Choice
School
vs
Province
School
vs
District
Mark
School
District
Province
Number of Students :
Rubrics
Process Writing
Content
Organization
Sentence Fluency
Voice
Word Choice
Conventions
Poetic Reading
Informational Reading
Visual Reading
Listening
Speaking
School
District
Province
School
District
Province
School
District
Province
School
District
Province
School
District
Province
School
District
Province
School
District
Province
School
District
Province
School
District
Province
School
District
Province
School
District
Province
School
District
Province
84.2
91.7
50.0
36
75.0
75.0
50.0
50.0
75.0
74.2
73.3
56.7
57.1
75.0
88.3
81.9
83.0
81.9
91.5
91.5
65.8
74.0
43.6
63.6
85.1
81.4
77.7
77.0
73.9
86.1
85.7
65.7
74.4
42.5
64.0
85.7
91.4
89.8
92.1
89.7
Demand Writing
School
District
Province
83.3
78.7
74.5
p
p
p
p
p
p
p
q q
q
q q
q q
q q
q q
q q
q q
q q
q q
q q
J:\PUBLIC07\PATPAM\CRTS\ELA03_W.RPT
292
24/11/2007
10:27:42PMSource: Division of Evaluation and Research, Department of Education

CRT School Results
Primary English Language Arts
2006-07
#400 - Helen Tulk Elementary, Bishop's FallsGrades: K-6
District 3 - Nova Central
3 Year CRT (Subtest) Mark Trend 2005-2007
OrganizationContent Voice
Sentence
Fluency
Word Choice Convention
Multiple Choice
ListeningReading
Rubrics Results: Percentage of students performing at Level 3 and Above 2005-2007
Demand WritingInformational
Reading
Poetic Reading Visual Reading Listening Speaking
20052006
2007
Process Writing (10 % Sample)
Rubrics Results: Percentage of students performing at Level 3 and Above 2005-2007
J:\PUBLIC07\PATPAM\CRTS\ELA03_W.RPT
293
24/11/2007
10:27:42PMSource: Division of Evaluation and Research, Department of Education

CRT School Results
Primary English Language Arts
2006-07
#400 - Helen Tulk Elementary, Bishop's FallsGrades: K-6
District 3 - Nova Central
Difference from Provincial Mean, 2005-07
Multiple Choice
ListeningReading
2005 2006 2007
Process Writing (10 % Sample)
Rubrics Results: Percentage of students performing at Level 3 and Above 2005-2007
Content Word ChoiceVoice
Sentence
Fluency
Organization Convention
Rubrics Results: Percentage of students performing at Level 3 and Above 2005-2007
Demand WritingInformational
Reading
Poetic Reading Visual Reading Listening Speaking
Difference from Provincial Mean, 2005-07
Difference from Provincial Mean, 2005-07
J:\PUBLIC07\PATPAM\CRTS\ELA03_W.RPT
294
24/11/2007
10:27:42PMSource: Division of Evaluation and Research, Department of Education
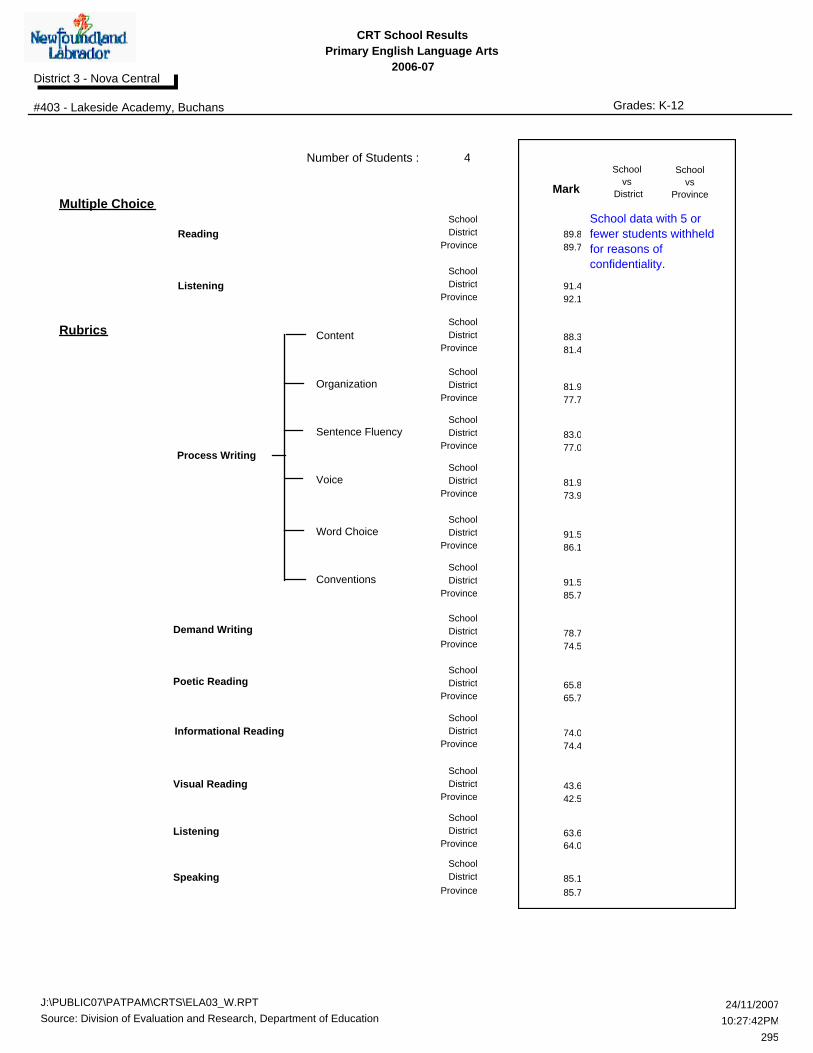
CRT School Results
Primary English Language Arts
2006-07
#403 - Lakeside Academy, BuchansGrades: K-12
District 3 - Nova Central
Reading
Listening
Multiple Choice
School
vs
Province
School
vs
District
Mark
School
District
Province
Number of Students :
Rubrics
Process Writing
Content
Organization
Sentence Fluency
Voice
Word Choice
Conventions
Poetic Reading
Informational Reading
Visual Reading
Listening
Speaking
School
District
Province
School
District
Province
School
District
Province
School
District
Province
School
District
Province
School
District
Province
School
District
Province
School
District
Province
School
District
Province
School
District
Province
School
District
Province
School
District
Province
4
88.3
81.9
83.0
81.9
91.5
91.5
65.8
74.0
43.6
63.6
85.1
81.4
77.7
77.0
73.9
86.1
85.7
65.7
74.4
42.5
64.0
85.7
91.4
89.8
92.1
89.7
Demand Writing
School
District
Province
78.7
74.5
p
p
p
p
p
p
p
p
p
q q
q q
q q
q q
q q
q q
q q
q
q q
School data with 5 or
fewer students withheld
for reasons of
confidentiality.
J:\PUBLIC07\PATPAM\CRTS\ELA03_W.RPT
295
24/11/2007
10:27:42PMSource: Division of Evaluation and Research, Department of Education

CRT School Results
Primary English Language Arts
2006-07
#403 - Lakeside Academy, BuchansGrades: K-12
District 3 - Nova Central
3 Year CRT (Subtest) Mark Trend 2005-2007
OrganizationContent Voice
Sentence
Fluency
Word Choice Convention
Multiple Choice
ListeningReading
Rubrics Results: Percentage of students performing at Level 3 and Above 2005-2007
Demand WritingInformational
Reading
Poetic Reading Visual Reading Listening Speaking
20052006
2007
Process Writing (10 % Sample)
Rubrics Results: Percentage of students performing at Level 3 and Above 2005-2007
School data with 5 or fewer
students withheld for reasons
of confidentiality.
School data with 5 or fewer
students withheld for reasons
of confidentiality.
School data with 5 or fewer
students withheld for reasons
of confidentiality.
J:\PUBLIC07\PATPAM\CRTS\ELA03_W.RPT
296
24/11/2007
10:27:42PMSource: Division of Evaluation and Research, Department of Education

CRT School Results
Primary English Language Arts
2006-07
#403 - Lakeside Academy, BuchansGrades: K-12
District 3 - Nova Central
Difference from Provincial Mean, 2005-07
Multiple Choice
ListeningReading
2005 2006 2007
Process Writing (10 % Sample)
Rubrics Results: Percentage of students performing at Level 3 and Above 2005-2007
Content Word ChoiceVoice
Sentence
Fluency
Organization Convention
Rubrics Results: Percentage of students performing at Level 3 and Above 2005-2007
Demand WritingInformational
Reading
Poetic Reading Visual Reading Listening Speaking
Difference from Provincial Mean, 2005-07
Difference from Provincial Mean, 2005-07
School data with 5 or fewer
students withheld for reasons
of confidentiality.
School data with 5 or fewer
students withheld for reasons
of confidentiality.
School data with 5 or fewer
students withheld for reasons
of confidentiality.
J:\PUBLIC07\PATPAM\CRTS\ELA03_W.RPT
297
24/11/2007
10:27:42PMSource: Division of Evaluation and Research, Department of Education

CRT School Results
Primary English Language Arts
2006-07
#404 - M.W. Jeans Academy, BurlingtonGrades: K-6
District 3 - Nova Central
Reading
Listening
Multiple Choice
School
vs
Province
School
vs
District
Mark
School
District
Province
Number of Students :
Rubrics
Process Writing
Content
Organization
Sentence Fluency
Voice
Word Choice
Conventions
Poetic Reading
Informational Reading
Visual Reading
Listening
Speaking
School
District
Province
School
District
Province
School
District
Province
School
District
Province
School
District
Province
School
District
Province
School
District
Province
School
District
Province
School
District
Province
School
District
Province
School
District
Province
School
District
Province
4
88.3
81.9
83.0
81.9
91.5
91.5
65.8
74.0
43.6
63.6
85.1
81.4
77.7
77.0
73.9
86.1
85.7
65.7
74.4
42.5
64.0
85.7
91.4
89.8
92.1
89.7
Demand Writing
School
District
Province
78.7
74.5
p
p
p
p
p
p
p
p
p
p
p
p
p
p
p
p
p
p
p
p
p
q q
q
q q
School data with 5 or
fewer students withheld
for reasons of
confidentiality.
J:\PUBLIC07\PATPAM\CRTS\ELA03_W.RPT
298
24/11/2007
10:27:42PMSource: Division of Evaluation and Research, Department of Education

CRT School Results
Primary English Language Arts
2006-07
#404 - M.W. Jeans Academy, BurlingtonGrades: K-6
District 3 - Nova Central
3 Year CRT (Subtest) Mark Trend 2005-2007
OrganizationContent Voice
Sentence
Fluency
Word Choice Convention
Multiple Choice
ListeningReading
Rubrics Results: Percentage of students performing at Level 3 and Above 2005-2007
Demand WritingInformational
Reading
Poetic Reading Visual Reading Listening Speaking
20052006
2007
Process Writing (10 % Sample)
Rubrics Results: Percentage of students performing at Level 3 and Above 2005-2007
School data with 5 or fewer
students withheld for reasons
of confidentiality.
School data with 5 or fewer
students withheld for reasons
of confidentiality.
School data with 5 or fewer
students withheld for reasons
of confidentiality.
J:\PUBLIC07\PATPAM\CRTS\ELA03_W.RPT
299
24/11/2007
10:27:42PMSource: Division of Evaluation and Research, Department of Education

CRT School Results
Primary English Language Arts
2006-07
#404 - M.W. Jeans Academy, BurlingtonGrades: K-6
District 3 - Nova Central
Difference from Provincial Mean, 2005-07
Multiple Choice
ListeningReading
2005 2006 2007
Process Writing (10 % Sample)
Rubrics Results: Percentage of students performing at Level 3 and Above 2005-2007
Content Word ChoiceVoice
Sentence
Fluency
Organization Convention
Rubrics Results: Percentage of students performing at Level 3 and Above 2005-2007
Demand WritingInformational
Reading
Poetic Reading Visual Reading Listening Speaking
Difference from Provincial Mean, 2005-07
Difference from Provincial Mean, 2005-07
School data with 5 or fewer
students withheld for reasons
of confidentiality.
School data with 5 or fewer
students withheld for reasons
of confidentiality.
School data with 5 or fewer
students withheld for reasons
of confidentiality.
J:\PUBLIC07\PATPAM\CRTS\ELA03_W.RPT
300
24/11/2007
10:27:42PMSource: Division of Evaluation and Research, Department of Education

CRT School Results
Primary English Language Arts
2006-07
#405 - Cottrell's Cove Academy, Cottrell's CoveGrades: K-11
District 3 - Nova Central
Reading
Listening
Multiple Choice
School
vs
Province
School
vs
District
Mark
School
District
Province
Number of Students :
Rubrics
Process Writing
Content
Organization
Sentence Fluency
Voice
Word Choice
Conventions
Poetic Reading
Informational Reading
Visual Reading
Listening
Speaking
School
District
Province
School
District
Province
School
District
Province
School
District
Province
School
District
Province
School
District
Province
School
District
Province
School
District
Province
School
District
Province
School
District
Province
School
District
Province
School
District
Province
1
88.3
81.9
83.0
81.9
91.5
91.5
65.8
74.0
43.6
63.6
85.1
81.4
77.7
77.0
73.9
86.1
85.7
65.7
74.4
42.5
64.0
85.7
91.4
89.8
92.1
89.7
Demand Writing
School
District
Province
78.7
74.5
p
p
p
p
p
p
p
p
p
p
p
p
p
p
q q
q q
q q
q q
q q
q q
q q
School data with 5 or
fewer students withheld
for reasons of
confidentiality.
J:\PUBLIC07\PATPAM\CRTS\ELA03_W.RPT
301
24/11/2007
10:27:42PMSource: Division of Evaluation and Research, Department of Education

CRT School Results
Primary English Language Arts
2006-07
#405 - Cottrell's Cove Academy, Cottrell's CoveGrades: K-11
District 3 - Nova Central
3 Year CRT (Subtest) Mark Trend 2005-2007
OrganizationContent Voice
Sentence
Fluency
Word Choice Convention
Multiple Choice
ListeningReading
Rubrics Results: Percentage of students performing at Level 3 and Above 2005-2007
Demand WritingInformational
Reading
Poetic Reading Visual Reading Listening Speaking
20052006
2007
Process Writing (10 % Sample)
Rubrics Results: Percentage of students performing at Level 3 and Above 2005-2007
School data with 5 or fewer
students withheld for reasons
of confidentiality.
School data with 5 or fewer
students withheld for reasons
of confidentiality.
School data with 5 or fewer
students withheld for reasons
of confidentiality.
J:\PUBLIC07\PATPAM\CRTS\ELA03_W.RPT
302
24/11/2007
10:27:42PMSource: Division of Evaluation and Research, Department of Education

CRT School Results
Primary English Language Arts
2006-07
#405 - Cottrell's Cove Academy, Cottrell's CoveGrades: K-11
District 3 - Nova Central
Difference from Provincial Mean, 2005-07
Multiple Choice
ListeningReading
2005 2006 2007
Process Writing (10 % Sample)
Rubrics Results: Percentage of students performing at Level 3 and Above 2005-2007
Content Word ChoiceVoice
Sentence
Fluency
Organization Convention
Rubrics Results: Percentage of students performing at Level 3 and Above 2005-2007
Demand WritingInformational
Reading
Poetic Reading Visual Reading Listening Speaking
Difference from Provincial Mean, 2005-07
Difference from Provincial Mean, 2005-07
School data with 5 or fewer
students withheld for reasons
of confidentiality.
School data with 5 or fewer
students withheld for reasons
of confidentiality.
School data with 5 or fewer
students withheld for reasons
of confidentiality.
J:\PUBLIC07\PATPAM\CRTS\ELA03_W.RPT
303
24/11/2007
10:27:42PMSource: Division of Evaluation and Research, Department of Education
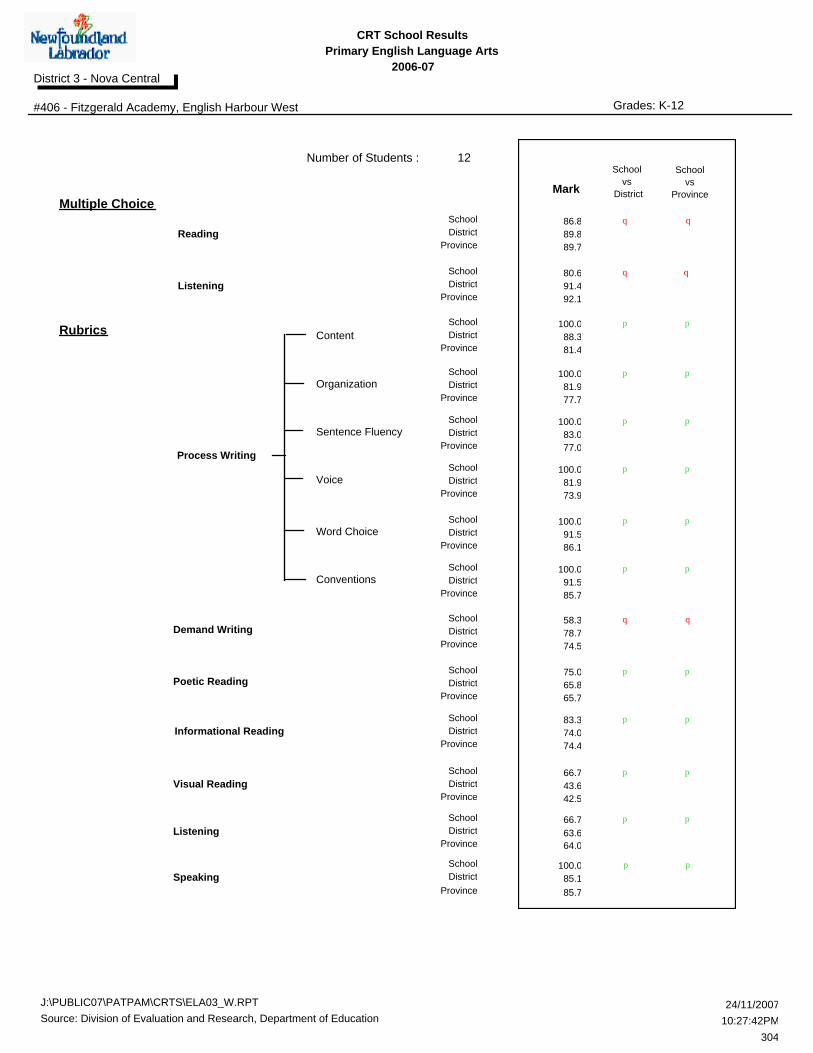
CRT School Results
Primary English Language Arts
2006-07
#406 - Fitzgerald Academy, English Harbour WestGrades: K-12
District 3 - Nova Central
Reading
Listening
Multiple Choice
School
vs
Province
School
vs
District
Mark
School
District
Province
Number of Students :
Rubrics
Process Writing
Content
Organization
Sentence Fluency
Voice
Word Choice
Conventions
Poetic Reading
Informational Reading
Visual Reading
Listening
Speaking
School
District
Province
School
District
Province
School
District
Province
School
District
Province
School
District
Province
School
District
Province
School
District
Province
School
District
Province
School
District
Province
School
District
Province
School
District
Province
School
District
Province
86.8
80.6
100.0
12
100.0
100.0
100.0
100.0
100.0
75.0
83.3
66.7
66.7
100.0
88.3
81.9
83.0
81.9
91.5
91.5
65.8
74.0
43.6
63.6
85.1
81.4
77.7
77.0
73.9
86.1
85.7
65.7
74.4
42.5
64.0
85.7
91.4
89.8
92.1
89.7
Demand Writing
School
District
Province
58.3
78.7
74.5
p
p
p
p
p
p
p
p
p
p
p
p
p
p
p
p
p
p
p
p
p
p
q q
J:\PUBLIC07\PATPAM\CRTS\ELA03_W.RPT
304
24/11/2007
10:27:42PMSource: Division of Evaluation and Research, Department of Education

CRT School Results
Primary English Language Arts
2006-07
#406 - Fitzgerald Academy, English Harbour WestGrades: K-12
District 3 - Nova Central
3 Year CRT (Subtest) Mark Trend 2005-2007
OrganizationContent Voice
Sentence
Fluency
Word Choice Convention
Multiple Choice
ListeningReading
Rubrics Results: Percentage of students performing at Level 3 and Above 2005-2007
Demand WritingInformational
Reading
Poetic Reading Visual Reading Listening Speaking
20052006
2007
Process Writing (10 % Sample)
Rubrics Results: Percentage of students performing at Level 3 and Above 2005-2007
J:\PUBLIC07\PATPAM\CRTS\ELA03_W.RPT
305
24/11/2007
10:27:42PMSource: Division of Evaluation and Research, Department of Education
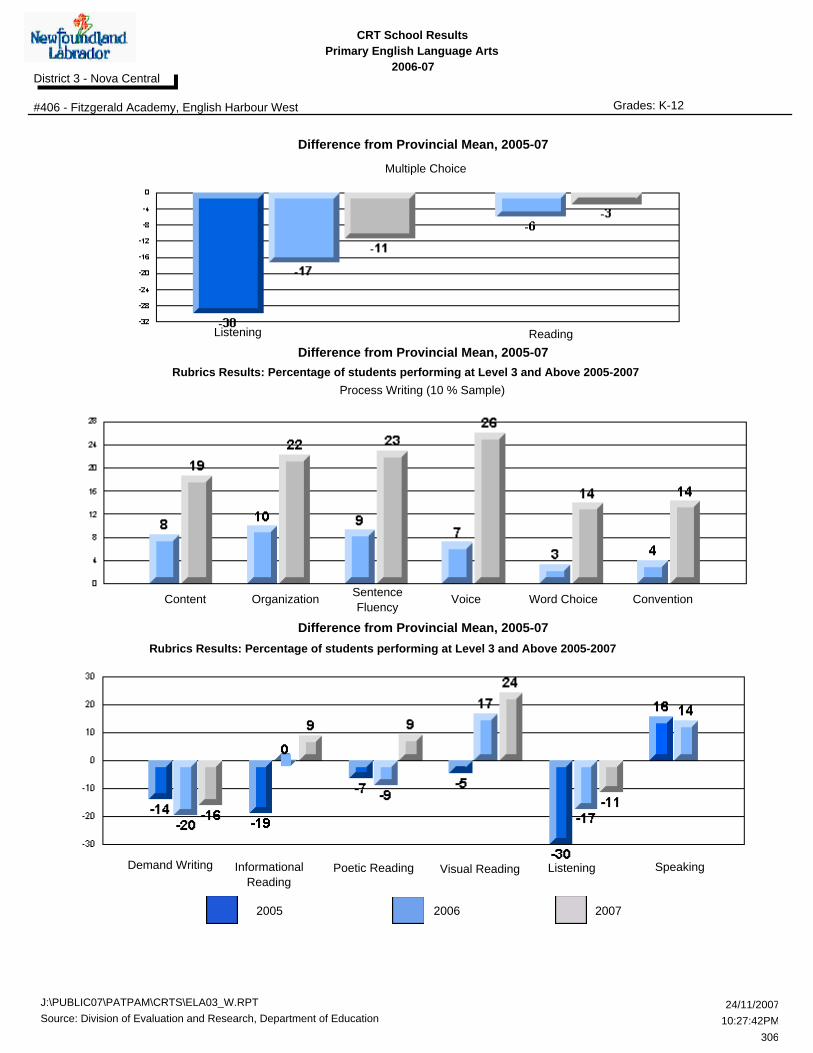
CRT School Results
Primary English Language Arts
2006-07
#406 - Fitzgerald Academy, English Harbour WestGrades: K-12
District 3 - Nova Central
Difference from Provincial Mean, 2005-07
Multiple Choice
ListeningReading
2005 2006 2007
Process Writing (10 % Sample)
Rubrics Results: Percentage of students performing at Level 3 and Above 2005-2007
Content Word ChoiceVoice
Sentence
Fluency
Organization Convention
Rubrics Results: Percentage of students performing at Level 3 and Above 2005-2007
Demand WritingInformational
Reading
Poetic Reading Visual Reading Listening Speaking
Difference from Provincial Mean, 2005-07
Difference from Provincial Mean, 2005-07
J:\PUBLIC07\PATPAM\CRTS\ELA03_W.RPT
306
24/11/2007
10:27:42PMSource: Division of Evaluation and Research, Department of Education

CRT School Results
Primary English Language Arts
2006-07
#407 - Bay d'Espoir Academy, MilltownGrades: K-12
District 3 - Nova Central
Reading
Listening
Multiple Choice
School
vs
Province
School
vs
District
Mark
School
District
Province
Number of Students :
Rubrics
Process Writing
Content
Organization
Sentence Fluency
Voice
Word Choice
Conventions
Poetic Reading
Informational Reading
Visual Reading
Listening
Speaking
School
District
Province
School
District
Province
School
District
Province
School
District
Province
School
District
Province
School
District
Province
School
District
Province
School
District
Province
School
District
Province
School
District
Province
School
District
Province
School
District
Province
87.8
100.0
100.0
13
100.0
100.0
100.0
100.0
100.0
76.9
92.3
38.5
100.0
100.0
88.3
81.9
83.0
81.9
91.5
91.5
65.8
74.0
43.6
63.6
85.1
81.4
77.7
77.0
73.9
86.1
85.7
65.7
74.4
42.5
64.0
85.7
91.4
89.8
92.1
89.7
Demand Writing
School
District
Province
76.9
78.7
74.5
p
p
p
p
p
p
p
p
p
p
p
p
p
p
p
p
p
p
p
p
p
p
p
q q
q
q q
J:\PUBLIC07\PATPAM\CRTS\ELA03_W.RPT
307
24/11/2007
10:27:42PMSource: Division of Evaluation and Research, Department of Education
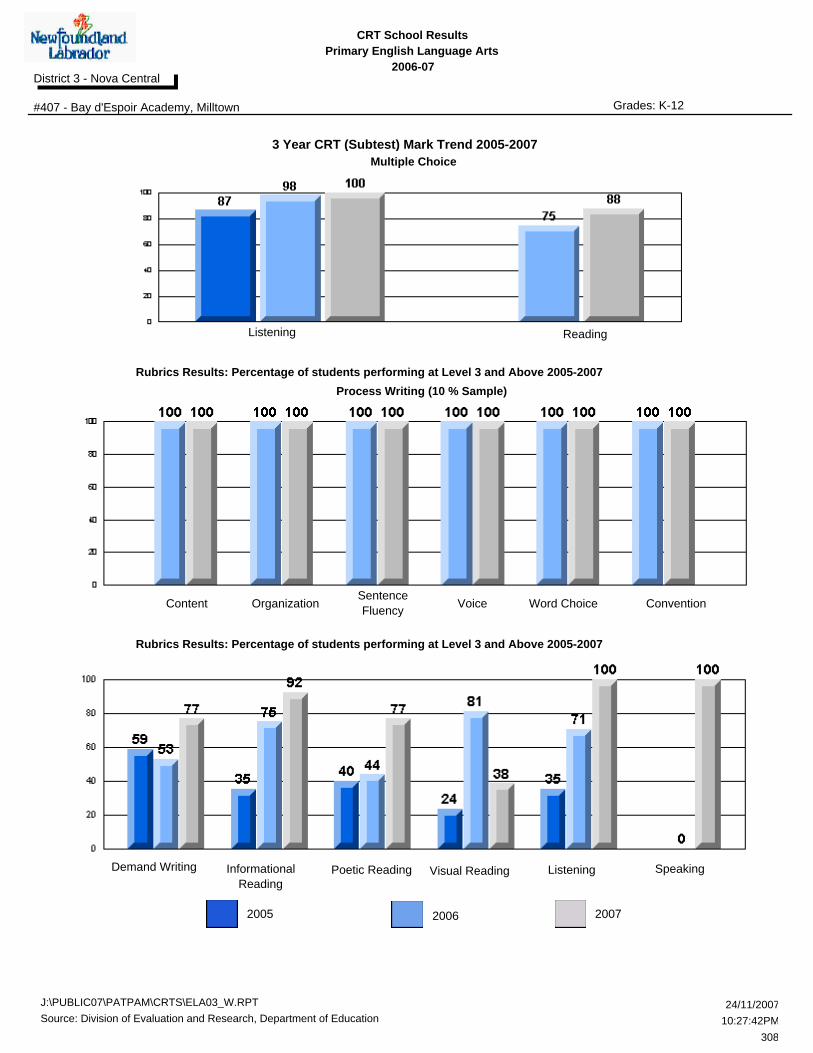
CRT School Results
Primary English Language Arts
2006-07
#407 - Bay d'Espoir Academy, MilltownGrades: K-12
District 3 - Nova Central
3 Year CRT (Subtest) Mark Trend 2005-2007
OrganizationContent Voice
Sentence
Fluency
Word Choice Convention
Multiple Choice
ListeningReading
Rubrics Results: Percentage of students performing at Level 3 and Above 2005-2007
Demand WritingInformational
Reading
Poetic Reading Visual Reading Listening Speaking
20052006
2007
Process Writing (10 % Sample)
Rubrics Results: Percentage of students performing at Level 3 and Above 2005-2007
J:\PUBLIC07\PATPAM\CRTS\ELA03_W.RPT
308
24/11/2007
10:27:42PMSource: Division of Evaluation and Research, Department of Education

CRT School Results
Primary English Language Arts
2006-07
#407 - Bay d'Espoir Academy, MilltownGrades: K-12
District 3 - Nova Central
Difference from Provincial Mean, 2005-07
Multiple Choice
ListeningReading
2005 2006 2007
Process Writing (10 % Sample)
Rubrics Results: Percentage of students performing at Level 3 and Above 2005-2007
Content Word ChoiceVoice
Sentence
Fluency
Organization Convention
Rubrics Results: Percentage of students performing at Level 3 and Above 2005-2007
Demand WritingInformational
Reading
Poetic Reading Visual Reading Listening Speaking
Difference from Provincial Mean, 2005-07
Difference from Provincial Mean, 2005-07
J:\PUBLIC07\PATPAM\CRTS\ELA03_W.RPT
309
24/11/2007
10:27:42PMSource: Division of Evaluation and Research, Department of Education

CRT School Results
Primary English Language Arts
2006-07
#408 - Deckwood Primary, WoodstockGrades: K-3
District 3 - Nova Central
Reading
Listening
Multiple Choice
School
vs
Province
School
vs
District
Mark
School
District
Province
Number of Students :
Rubrics
Process Writing
Content
Organization
Sentence Fluency
Voice
Word Choice
Conventions
Poetic Reading
Informational Reading
Visual Reading
Listening
Speaking
School
District
Province
School
District
Province
School
District
Province
School
District
Province
School
District
Province
School
District
Province
School
District
Province
School
District
Province
School
District
Province
School
District
Province
School
District
Province
School
District
Province
4
88.3
81.9
83.0
81.9
91.5
91.5
65.8
74.0
43.6
63.6
85.1
81.4
77.7
77.0
73.9
86.1
85.7
65.7
74.4
42.5
64.0
85.7
91.4
89.8
92.1
89.7
Demand Writing
School
District
Province
78.7
74.5
p
p
p
p
p
p
p
p
p
p
p
p
q q
q
q q
q q
q
q q
q q
q q
q q
School data with 5 or
fewer students withheld
for reasons of
confidentiality.
J:\PUBLIC07\PATPAM\CRTS\ELA03_W.RPT
310
24/11/2007
10:27:42PMSource: Division of Evaluation and Research, Department of Education

CRT School Results
Primary English Language Arts
2006-07
#408 - Deckwood Primary, WoodstockGrades: K-3
District 3 - Nova Central
3 Year CRT (Subtest) Mark Trend 2005-2007
OrganizationContent Voice
Sentence
Fluency
Word Choice Convention
Multiple Choice
ListeningReading
Rubrics Results: Percentage of students performing at Level 3 and Above 2005-2007
Demand WritingInformational
Reading
Poetic Reading Visual Reading Listening Speaking
20052006
2007
Process Writing (10 % Sample)
Rubrics Results: Percentage of students performing at Level 3 and Above 2005-2007
School data with 5 or fewer
students withheld for reasons
of confidentiality.
School data with 5 or fewer
students withheld for reasons
of confidentiality.
School data with 5 or fewer
students withheld for reasons
of confidentiality.
J:\PUBLIC07\PATPAM\CRTS\ELA03_W.RPT
311
24/11/2007
10:27:42PMSource: Division of Evaluation and Research, Department of Education

CRT School Results
Primary English Language Arts
2006-07
#408 - Deckwood Primary, WoodstockGrades: K-3
District 3 - Nova Central
Difference from Provincial Mean, 2005-07
Multiple Choice
ListeningReading
2005 2006 2007
Process Writing (10 % Sample)
Rubrics Results: Percentage of students performing at Level 3 and Above 2005-2007
Content Word ChoiceVoice
Sentence
Fluency
Organization Convention
Rubrics Results: Percentage of students performing at Level 3 and Above 2005-2007
Demand WritingInformational
Reading
Poetic Reading Visual Reading Listening Speaking
Difference from Provincial Mean, 2005-07
Difference from Provincial Mean, 2005-07
School data with 5 or fewer
students withheld for reasons
of confidentiality.
School data with 5 or fewer
students withheld for reasons
of confidentiality.
School data with 5 or fewer
students withheld for reasons
of confidentiality.
J:\PUBLIC07\PATPAM\CRTS\ELA03_W.RPT
312
24/11/2007
10:27:42PMSource: Division of Evaluation and Research, Department of Education

CRT School Results
Primary English Language Arts
2006-07
#409 - Indian River Academy, SpringdaleGrades: K-6
District 3 - Nova Central
Reading
Listening
Multiple Choice
School
vs
Province
School
vs
District
Mark
School
District
Province
Number of Students :
Rubrics
Process Writing
Content
Organization
Sentence Fluency
Voice
Word Choice
Conventions
Poetic Reading
Informational Reading
Visual Reading
Listening
Speaking
School
District
Province
School
District
Province
School
District
Province
School
District
Province
School
District
Province
School
District
Province
School
District
Province
School
District
Province
School
District
Province
School
District
Province
School
District
Province
School
District
Province
92.0
91.4
100.0
31
66.7
100.0
100.0
100.0
100.0
73.1
76.9
50.0
51.6
100.0
88.3
81.9
83.0
81.9
91.5
91.5
65.8
74.0
43.6
63.6
85.1
81.4
77.7
77.0
73.9
86.1
85.7
65.7
74.4
42.5
64.0
85.7
91.4
89.8
92.1
89.7
Demand Writing
School
District
Province
75.0
78.7
74.5
p
p
p
p
p
p
p
p
p
p
p
p
p
p
p
p
p
p
p
p
p
p
q
q q
q
q q
J:\PUBLIC07\PATPAM\CRTS\ELA03_W.RPT
313
24/11/2007
10:27:42PMSource: Division of Evaluation and Research, Department of Education

CRT School Results
Primary English Language Arts
2006-07
#409 - Indian River Academy, SpringdaleGrades: K-6
District 3 - Nova Central
3 Year CRT (Subtest) Mark Trend 2005-2007
OrganizationContent Voice
Sentence
Fluency
Word Choice Convention
Multiple Choice
ListeningReading
Rubrics Results: Percentage of students performing at Level 3 and Above 2005-2007
Demand WritingInformational
Reading
Poetic Reading Visual Reading Listening Speaking
20052006
2007
Process Writing (10 % Sample)
Rubrics Results: Percentage of students performing at Level 3 and Above 2005-2007
J:\PUBLIC07\PATPAM\CRTS\ELA03_W.RPT
314
24/11/2007
10:27:42PMSource: Division of Evaluation and Research, Department of Education

CRT School Results
Primary English Language Arts
2006-07
#409 - Indian River Academy, SpringdaleGrades: K-6
District 3 - Nova Central
Difference from Provincial Mean, 2005-07
Multiple Choice
ListeningReading
2005 2006 2007
Process Writing (10 % Sample)
Rubrics Results: Percentage of students performing at Level 3 and Above 2005-2007
Content Word ChoiceVoice
Sentence
Fluency
Organization Convention
Rubrics Results: Percentage of students performing at Level 3 and Above 2005-2007
Demand WritingInformational
Reading
Poetic Reading Visual Reading Listening Speaking
Difference from Provincial Mean, 2005-07
Difference from Provincial Mean, 2005-07
J:\PUBLIC07\PATPAM\CRTS\ELA03_W.RPT
315
24/11/2007
10:27:42PMSource: Division of Evaluation and Research, Department of Education

CRT School Results
Primary English Language Arts
2006-07
#413 - Holy Cross School Complex, EastportGrades: K-12
District 3 - Nova Central
Reading
Listening
Multiple Choice
School
vs
Province
School
vs
District
Mark
School
District
Province
Number of Students :
Rubrics
Process Writing
Content
Organization
Sentence Fluency
Voice
Word Choice
Conventions
Poetic Reading
Informational Reading
Visual Reading
Listening
Speaking
School
District
Province
School
District
Province
School
District
Province
School
District
Province
School
District
Province
School
District
Province
School
District
Province
School
District
Province
School
District
Province
School
District
Province
School
District
Province
School
District
Province
95.4
97.0
100.0
11
100.0
100.0
100.0
100.0
100.0
44.4
77.8
55.6
63.6
100.0
88.3
81.9
83.0
81.9
91.5
91.5
65.8
74.0
43.6
63.6
85.1
81.4
77.7
77.0
73.9
86.1
85.7
65.7
74.4
42.5
64.0
85.7
91.4
89.8
92.1
89.7
Demand Writing
School
District
Province
77.8
78.7
74.5
p
p
p
p
p
p
p
p
p
p
p
p
p
p
p
p
p
p
p
p
p
p
p
p
q
q q
q
J:\PUBLIC07\PATPAM\CRTS\ELA03_W.RPT
316
24/11/2007
10:27:42PMSource: Division of Evaluation and Research, Department of Education

CRT School Results
Primary English Language Arts
2006-07
#413 - Holy Cross School Complex, EastportGrades: K-12
District 3 - Nova Central
3 Year CRT (Subtest) Mark Trend 2005-2007
OrganizationContent Voice
Sentence
Fluency
Word Choice Convention
Multiple Choice
ListeningReading
Rubrics Results: Percentage of students performing at Level 3 and Above 2005-2007
Demand WritingInformational
Reading
Poetic Reading Visual Reading Listening Speaking
20052006
2007
Process Writing (10 % Sample)
Rubrics Results: Percentage of students performing at Level 3 and Above 2005-2007
J:\PUBLIC07\PATPAM\CRTS\ELA03_W.RPT
317
24/11/2007
10:27:42PMSource: Division of Evaluation and Research, Department of Education

CRT School Results
Primary English Language Arts
2006-07
#413 - Holy Cross School Complex, EastportGrades: K-12
District 3 - Nova Central
Difference from Provincial Mean, 2005-07
Multiple Choice
ListeningReading
2005 2006 2007
Process Writing (10 % Sample)
Rubrics Results: Percentage of students performing at Level 3 and Above 2005-2007
Content Word ChoiceVoice
Sentence
Fluency
Organization Convention
Rubrics Results: Percentage of students performing at Level 3 and Above 2005-2007
Demand WritingInformational
Reading
Poetic Reading Visual Reading Listening Speaking
Difference from Provincial Mean, 2005-07
Difference from Provincial Mean, 2005-07
J:\PUBLIC07\PATPAM\CRTS\ELA03_W.RPT
318
24/11/2007
10:27:42PMSource: Division of Evaluation and Research, Department of Education

CRT School Results
Primary English Language Arts
2006-07
#414 - Fogo Island Central Academy, Fogo IslandGrades: K-12
District 3 - Nova Central
Reading
Listening
Multiple Choice
School
vs
Province
School
vs
District
Mark
School
District
Province
Number of Students :
Rubrics
Process Writing
Content
Organization
Sentence Fluency
Voice
Word Choice
Conventions
Poetic Reading
Informational Reading
Visual Reading
Listening
Speaking
School
District
Province
School
District
Province
School
District
Province
School
District
Province
School
District
Province
School
District
Province
School
District
Province
School
District
Province
School
District
Province
School
District
Province
School
District
Province
School
District
Province
92.2
95.6
100.0
18
100.0
100.0
100.0
100.0
100.0
75.0
80.0
86.7
82.3
100.0
88.3
81.9
83.0
81.9
91.5
91.5
65.8
74.0
43.6
63.6
85.1
81.4
77.7
77.0
73.9
86.1
85.7
65.7
74.4
42.5
64.0
85.7
91.4
89.8
92.1
89.7
Demand Writing
School
District
Province
66.7
78.7
74.5
p
p
p
p
p
p
p
p
p
p
p
p
p
p
p
p
p
p
p
p
p
p
p
p
p
p
J:\PUBLIC07\PATPAM\CRTS\ELA03_W.RPT
319
24/11/2007
10:27:42PMSource: Division of Evaluation and Research, Department of Education
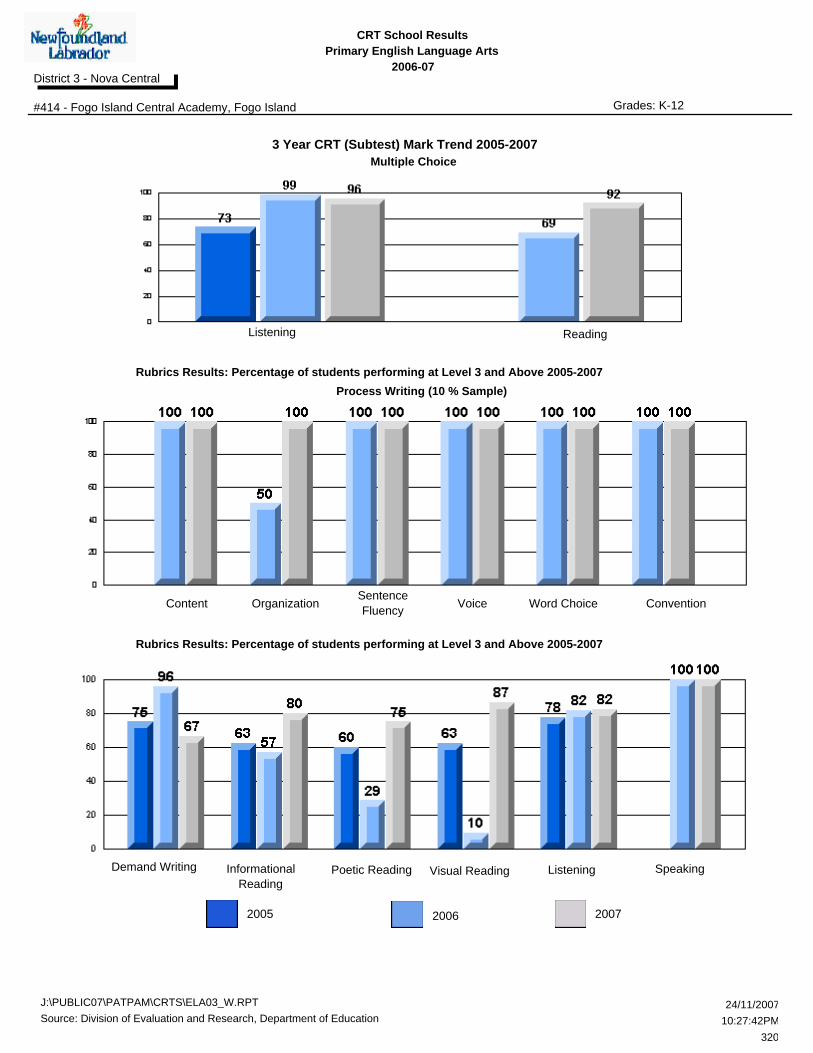
CRT School Results
Primary English Language Arts
2006-07
#414 - Fogo Island Central Academy, Fogo IslandGrades: K-12
District 3 - Nova Central
3 Year CRT (Subtest) Mark Trend 2005-2007
OrganizationContent Voice
Sentence
Fluency
Word Choice Convention
Multiple Choice
ListeningReading
Rubrics Results: Percentage of students performing at Level 3 and Above 2005-2007
Demand WritingInformational
Reading
Poetic Reading Visual Reading Listening Speaking
20052006
2007
Process Writing (10 % Sample)
Rubrics Results: Percentage of students performing at Level 3 and Above 2005-2007
J:\PUBLIC07\PATPAM\CRTS\ELA03_W.RPT
320
24/11/2007
10:27:42PMSource: Division of Evaluation and Research, Department of Education
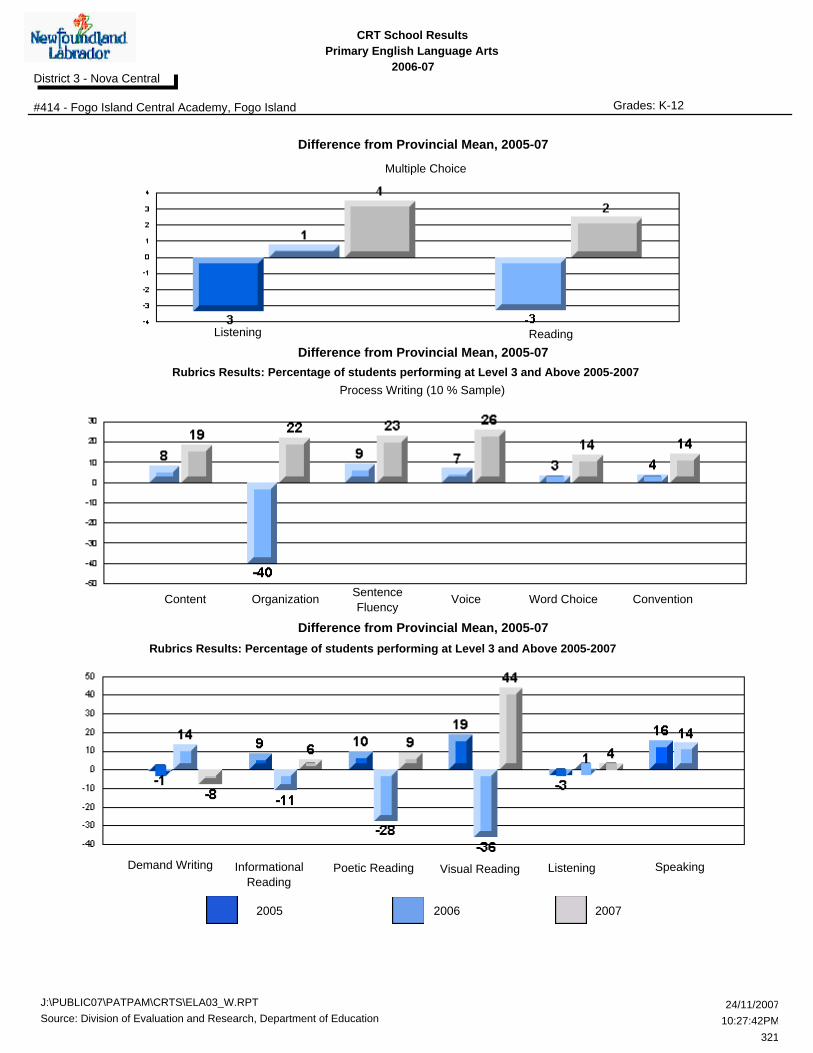
CRT School Results
Primary English Language Arts
2006-07
#414 - Fogo Island Central Academy, Fogo IslandGrades: K-12
District 3 - Nova Central
Difference from Provincial Mean, 2005-07
Multiple Choice
ListeningReading
2005 2006 2007
Process Writing (10 % Sample)
Rubrics Results: Percentage of students performing at Level 3 and Above 2005-2007
Content Word ChoiceVoice
Sentence
Fluency
Organization Convention
Rubrics Results: Percentage of students performing at Level 3 and Above 2005-2007
Demand WritingInformational
Reading
Poetic Reading Visual Reading Listening Speaking
Difference from Provincial Mean, 2005-07
Difference from Provincial Mean, 2005-07
J:\PUBLIC07\PATPAM\CRTS\ELA03_W.RPT
321
24/11/2007
10:27:42PMSource: Division of Evaluation and Research, Department of Education
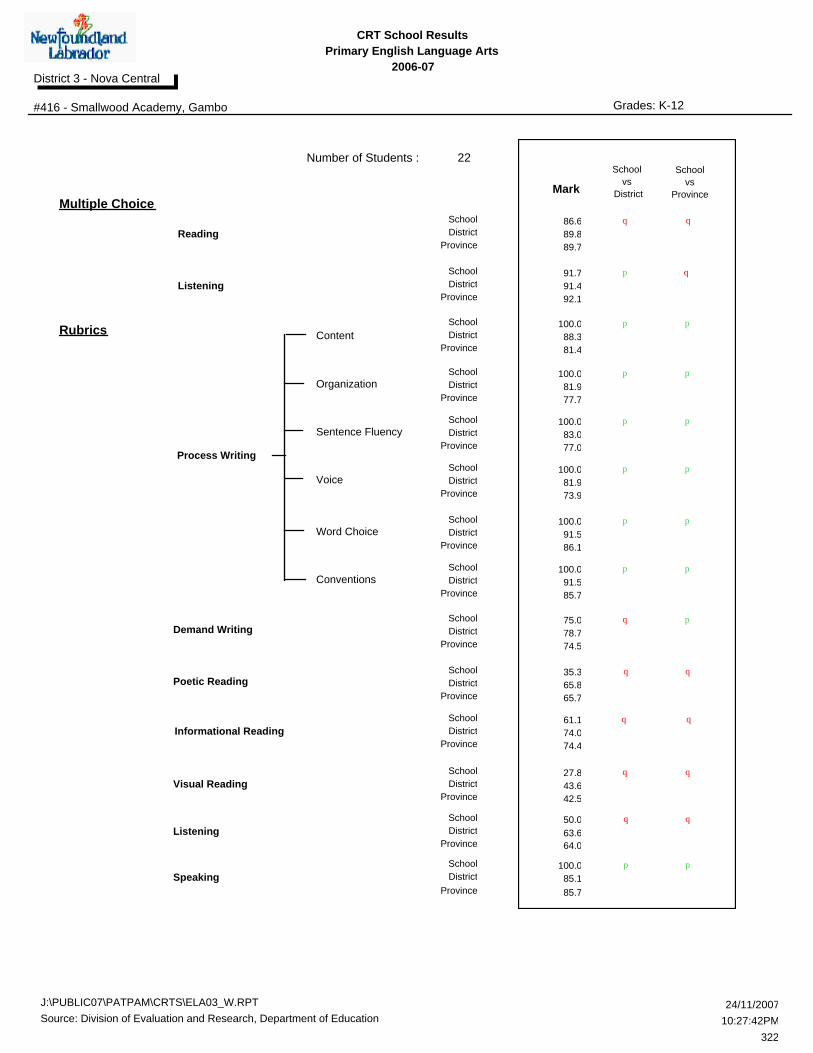
CRT School Results
Primary English Language Arts
2006-07
#416 - Smallwood Academy, GamboGrades: K-12
District 3 - Nova Central
Reading
Listening
Multiple Choice
School
vs
Province
School
vs
District
Mark
School
District
Province
Number of Students :
Rubrics
Process Writing
Content
Organization
Sentence Fluency
Voice
Word Choice
Conventions
Poetic Reading
Informational Reading
Visual Reading
Listening
Speaking
School
District
Province
School
District
Province
School
District
Province
School
District
Province
School
District
Province
School
District
Province
School
District
Province
School
District
Province
School
District
Province
School
District
Province
School
District
Province
School
District
Province
86.6
91.7
100.0
22
100.0
100.0
100.0
100.0
100.0
35.3
61.1
27.8
50.0
100.0
88.3
81.9
83.0
81.9
91.5
91.5
65.8
74.0
43.6
63.6
85.1
81.4
77.7
77.0
73.9
86.1
85.7
65.7
74.4
42.5
64.0
85.7
91.4
89.8
92.1
89.7
Demand Writing
School
District
Province
75.0
78.7
74.5
p
p
p
p
p
p
p
p
p
p
p
p
p
p
p
p
q q
q
q
q q
q q
q q
q q
J:\PUBLIC07\PATPAM\CRTS\ELA03_W.RPT
322
24/11/2007
10:27:42PMSource: Division of Evaluation and Research, Department of Education
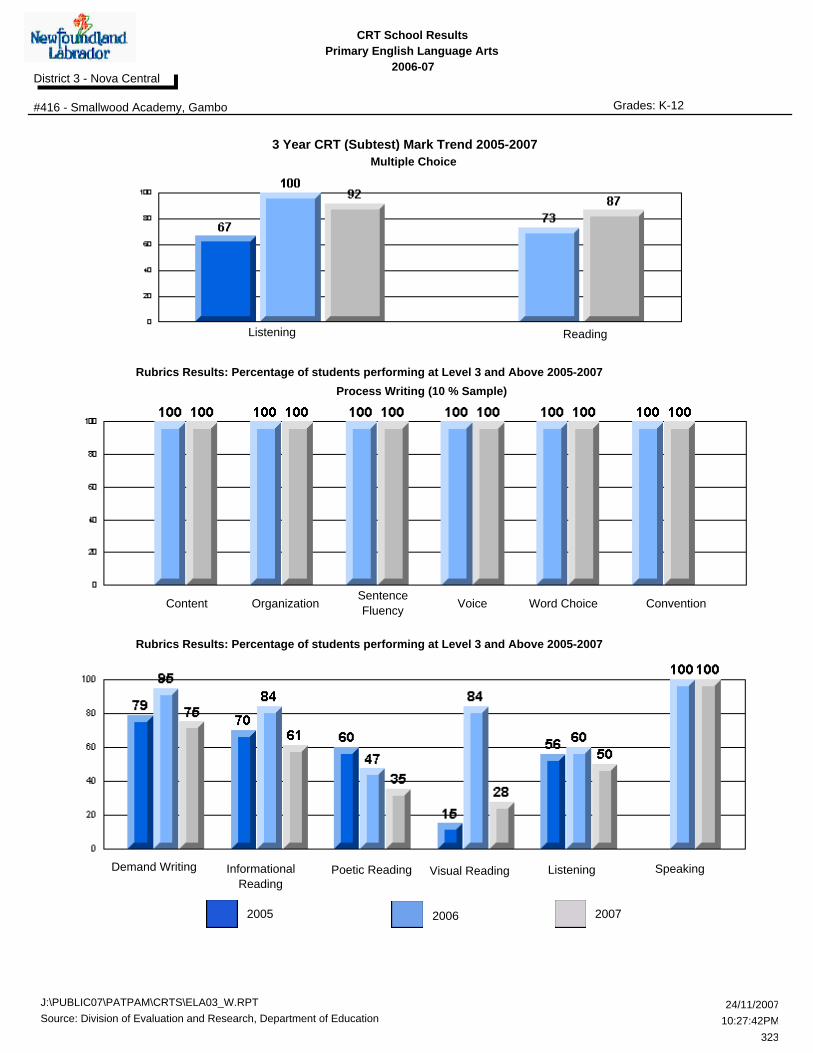
CRT School Results
Primary English Language Arts
2006-07
#416 - Smallwood Academy, GamboGrades: K-12
District 3 - Nova Central
3 Year CRT (Subtest) Mark Trend 2005-2007
OrganizationContent Voice
Sentence
Fluency
Word Choice Convention
Multiple Choice
ListeningReading
Rubrics Results: Percentage of students performing at Level 3 and Above 2005-2007
Demand WritingInformational
Reading
Poetic Reading Visual Reading Listening Speaking
20052006
2007
Process Writing (10 % Sample)
Rubrics Results: Percentage of students performing at Level 3 and Above 2005-2007
J:\PUBLIC07\PATPAM\CRTS\ELA03_W.RPT
323
24/11/2007
10:27:42PMSource: Division of Evaluation and Research, Department of Education

CRT School Results
Primary English Language Arts
2006-07
#416 - Smallwood Academy, GamboGrades: K-12
District 3 - Nova Central
Difference from Provincial Mean, 2005-07
Multiple Choice
ListeningReading
2005 2006 2007
Process Writing (10 % Sample)
Rubrics Results: Percentage of students performing at Level 3 and Above 2005-2007
Content Word ChoiceVoice
Sentence
Fluency
Organization Convention
Rubrics Results: Percentage of students performing at Level 3 and Above 2005-2007
Demand WritingInformational
Reading
Poetic Reading Visual Reading Listening Speaking
Difference from Provincial Mean, 2005-07
Difference from Provincial Mean, 2005-07
J:\PUBLIC07\PATPAM\CRTS\ELA03_W.RPT
324
24/11/2007
10:27:42PMSource: Division of Evaluation and Research, Department of Education

CRT School Results
Primary English Language Arts
2006-07
#417 - Gander Academy, GanderGrades: K-6
District 3 - Nova Central
Reading
Listening
Multiple Choice
School
vs
Province
School
vs
District
Mark
School
District
Province
Number of Students :
Rubrics
Process Writing
Content
Organization
Sentence Fluency
Voice
Word Choice
Conventions
Poetic Reading
Informational Reading
Visual Reading
Listening
Speaking
School
District
Province
School
District
Province
School
District
Province
School
District
Province
School
District
Province
School
District
Province
School
District
Province
School
District
Province
School
District
Province
School
District
Province
School
District
Province
School
District
Province
91.5
93.7
100.0
116
100.0
100.0
100.0
85.7
100.0
76.9
80.8
56.4
70.5
100.0
88.3
81.9
83.0
81.9
91.5
91.5
65.8
74.0
43.6
63.6
85.1
81.4
77.7
77.0
73.9
86.1
85.7
65.7
74.4
42.5
64.0
85.7
91.4
89.8
92.1
89.7
Demand Writing
School
District
Province
85.9
78.7
74.5
p
p
p
p
p
p
p
p
p
p
p
p
p
p
p
p
p
p
p
p
p
p
p
p
p
p
q q
J:\PUBLIC07\PATPAM\CRTS\ELA03_W.RPT
325
24/11/2007
10:27:42PMSource: Division of Evaluation and Research, Department of Education

CRT School Results
Primary English Language Arts
2006-07
#417 - Gander Academy, GanderGrades: K-6
District 3 - Nova Central
3 Year CRT (Subtest) Mark Trend 2005-2007
OrganizationContent Voice
Sentence
Fluency
Word Choice Convention
Multiple Choice
ListeningReading
Rubrics Results: Percentage of students performing at Level 3 and Above 2005-2007
Demand WritingInformational
Reading
Poetic Reading Visual Reading Listening Speaking
20052006
2007
Process Writing (10 % Sample)
Rubrics Results: Percentage of students performing at Level 3 and Above 2005-2007
J:\PUBLIC07\PATPAM\CRTS\ELA03_W.RPT
326
24/11/2007
10:27:42PMSource: Division of Evaluation and Research, Department of Education

CRT School Results
Primary English Language Arts
2006-07
#417 - Gander Academy, GanderGrades: K-6
District 3 - Nova Central
Difference from Provincial Mean, 2005-07
Multiple Choice
ListeningReading
2005 2006 2007
Process Writing (10 % Sample)
Rubrics Results: Percentage of students performing at Level 3 and Above 2005-2007
Content Word ChoiceVoice
Sentence
Fluency
Organization Convention
Rubrics Results: Percentage of students performing at Level 3 and Above 2005-2007
Demand WritingInformational
Reading
Poetic Reading Visual Reading Listening Speaking
Difference from Provincial Mean, 2005-07
Difference from Provincial Mean, 2005-07
J:\PUBLIC07\PATPAM\CRTS\ELA03_W.RPT
327
24/11/2007
10:27:42PMSource: Division of Evaluation and Research, Department of Education

CRT School Results
Primary English Language Arts
2006-07
#421 - Lakewood Academy, GlenwoodGrades: K-12
District 3 - Nova Central
Reading
Listening
Multiple Choice
School
vs
Province
School
vs
District
Mark
School
District
Province
Number of Students :
Rubrics
Process Writing
Content
Organization
Sentence Fluency
Voice
Word Choice
Conventions
Poetic Reading
Informational Reading
Visual Reading
Listening
Speaking
School
District
Province
School
District
Province
School
District
Province
School
District
Province
School
District
Province
School
District
Province
School
District
Province
School
District
Province
School
District
Province
School
District
Province
School
District
Province
School
District
Province
91.1
100.0
100.0
15
100.0
100.0
100.0
100.0
100.0
93.3
66.7
53.3
91.7
100.0
88.3
81.9
83.0
81.9
91.5
91.5
65.8
74.0
43.6
63.6
85.1
81.4
77.7
77.0
73.9
86.1
85.7
65.7
74.4
42.5
64.0
85.7
91.4
89.8
92.1
89.7
Demand Writing
School
District
Province
86.7
78.7
74.5
p
p
p
p
p
p
p
p
p
p
p
p
p
p
p
p
p
p
p
p
p
p
p
p
p
p
q q
J:\PUBLIC07\PATPAM\CRTS\ELA03_W.RPT
328
24/11/2007
10:27:42PMSource: Division of Evaluation and Research, Department of Education
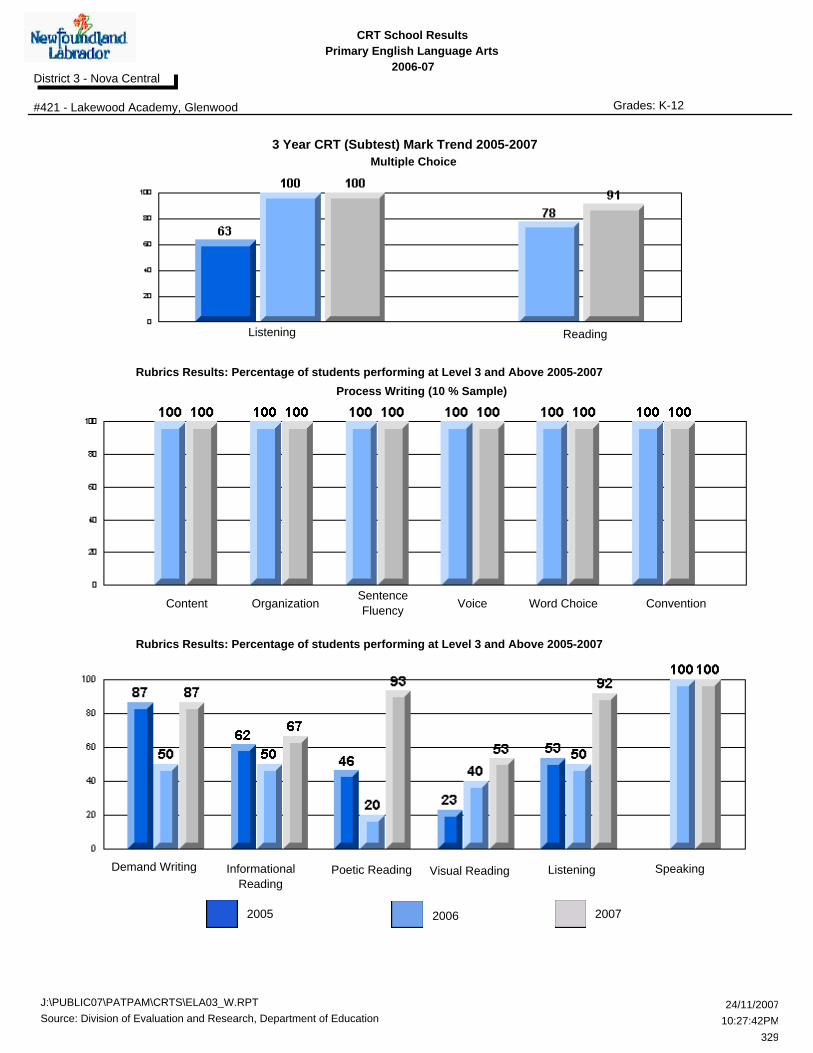
CRT School Results
Primary English Language Arts
2006-07
#421 - Lakewood Academy, GlenwoodGrades: K-12
District 3 - Nova Central
3 Year CRT (Subtest) Mark Trend 2005-2007
OrganizationContent Voice
Sentence
Fluency
Word Choice Convention
Multiple Choice
ListeningReading
Rubrics Results: Percentage of students performing at Level 3 and Above 2005-2007
Demand WritingInformational
Reading
Poetic Reading Visual Reading Listening Speaking
20052006
2007
Process Writing (10 % Sample)
Rubrics Results: Percentage of students performing at Level 3 and Above 2005-2007
J:\PUBLIC07\PATPAM\CRTS\ELA03_W.RPT
329
24/11/2007
10:27:42PMSource: Division of Evaluation and Research, Department of Education
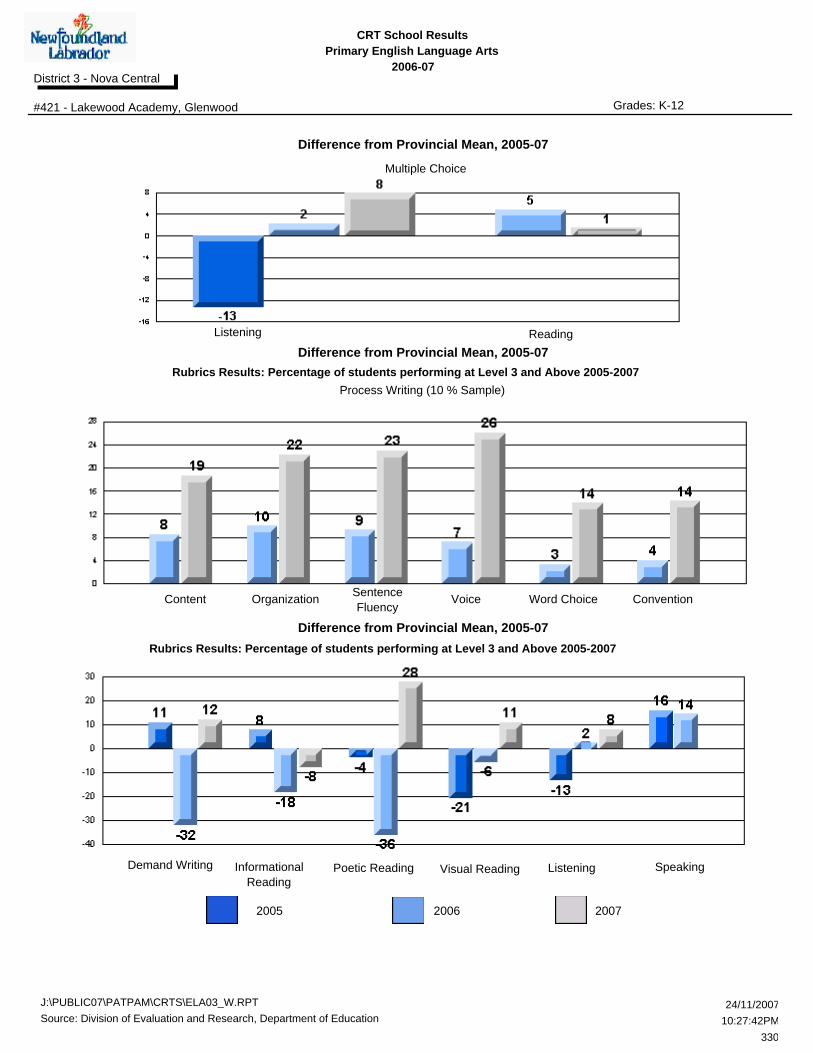
CRT School Results
Primary English Language Arts
2006-07
#421 - Lakewood Academy, GlenwoodGrades: K-12
District 3 - Nova Central
Difference from Provincial Mean, 2005-07
Multiple Choice
ListeningReading
2005 2006 2007
Process Writing (10 % Sample)
Rubrics Results: Percentage of students performing at Level 3 and Above 2005-2007
Content Word ChoiceVoice
Sentence
Fluency
Organization Convention
Rubrics Results: Percentage of students performing at Level 3 and Above 2005-2007
Demand WritingInformational
Reading
Poetic Reading Visual Reading Listening Speaking
Difference from Provincial Mean, 2005-07
Difference from Provincial Mean, 2005-07
J:\PUBLIC07\PATPAM\CRTS\ELA03_W.RPT
330
24/11/2007
10:27:42PMSource: Division of Evaluation and Research, Department of Education

CRT School Results
Primary English Language Arts
2006-07
#422 - Glovertown Academy, GlovertownGrades: K-12
District 3 - Nova Central
Reading
Listening
Multiple Choice
School
vs
Province
School
vs
District
Mark
School
District
Province
Number of Students :
Rubrics
Process Writing
Content
Organization
Sentence Fluency
Voice
Word Choice
Conventions
Poetic Reading
Informational Reading
Visual Reading
Listening
Speaking
School
District
Province
School
District
Province
School
District
Province
School
District
Province
School
District
Province
School
District
Province
School
District
Province
School
District
Province
School
District
Province
School
District
Province
School
District
Province
School
District
Province
92.1
94.7
100.0
26
100.0
100.0
100.0
100.0
100.0
72.7
90.9
66.7
62.5
100.0
88.3
81.9
83.0
81.9
91.5
91.5
65.8
74.0
43.6
63.6
85.1
81.4
77.7
77.0
73.9
86.1
85.7
65.7
74.4
42.5
64.0
85.7
91.4
89.8
92.1
89.7
Demand Writing
School
District
Province
90.5
78.7
74.5
p
p
p
p
p
p
p
p
p
p
p
p
p
p
p
p
p
p
p
p
p
p
p
p
p
p
q q
J:\PUBLIC07\PATPAM\CRTS\ELA03_W.RPT
331
24/11/2007
10:27:42PMSource: Division of Evaluation and Research, Department of Education

CRT School Results
Primary English Language Arts
2006-07
#422 - Glovertown Academy, GlovertownGrades: K-12
District 3 - Nova Central
3 Year CRT (Subtest) Mark Trend 2005-2007
OrganizationContent Voice
Sentence
Fluency
Word Choice Convention
Multiple Choice
ListeningReading
Rubrics Results: Percentage of students performing at Level 3 and Above 2005-2007
Demand WritingInformational
Reading
Poetic Reading Visual Reading Listening Speaking
20052006
2007
Process Writing (10 % Sample)
Rubrics Results: Percentage of students performing at Level 3 and Above 2005-2007
J:\PUBLIC07\PATPAM\CRTS\ELA03_W.RPT
332
24/11/2007
10:27:42PMSource: Division of Evaluation and Research, Department of Education

CRT School Results
Primary English Language Arts
2006-07
#422 - Glovertown Academy, GlovertownGrades: K-12
District 3 - Nova Central
Difference from Provincial Mean, 2005-07
Multiple Choice
ListeningReading
2005 2006 2007
Process Writing (10 % Sample)
Rubrics Results: Percentage of students performing at Level 3 and Above 2005-2007
Content Word ChoiceVoice
Sentence
Fluency
Organization Convention
Rubrics Results: Percentage of students performing at Level 3 and Above 2005-2007
Demand WritingInformational
Reading
Poetic Reading Visual Reading Listening Speaking
Difference from Provincial Mean, 2005-07
Difference from Provincial Mean, 2005-07
J:\PUBLIC07\PATPAM\CRTS\ELA03_W.RPT
333
24/11/2007
10:27:42PMSource: Division of Evaluation and Research, Department of Education

CRT School Results
Primary English Language Arts
2006-07
#426 - Hillview Academy, Norris ArmGrades: K-9
District 3 - Nova Central
Reading
Listening
Multiple Choice
School
vs
Province
School
vs
District
Mark
School
District
Province
Number of Students :
Rubrics
Process Writing
Content
Organization
Sentence Fluency
Voice
Word Choice
Conventions
Poetic Reading
Informational Reading
Visual Reading
Listening
Speaking
School
District
Province
School
District
Province
School
District
Province
School
District
Province
School
District
Province
School
District
Province
School
District
Province
School
District
Province
School
District
Province
School
District
Province
School
District
Province
School
District
Province
86.3
90.9
100.0
12
100.0
100.0
100.0
100.0
100.0
90.9
54.5
63.6
72.7
100.0
88.3
81.9
83.0
81.9
91.5
91.5
65.8
74.0
43.6
63.6
85.1
81.4
77.7
77.0
73.9
86.1
85.7
65.7
74.4
42.5
64.0
85.7
91.4
89.8
92.1
89.7
Demand Writing
School
District
Province
100.0
78.7
74.5
p
p
p
p
p
p
p
p
p
p
p
p
p
p
p
p
p
p
p
p
p
p
q q
q q
J:\PUBLIC07\PATPAM\CRTS\ELA03_W.RPT
334
24/11/2007
10:27:42PMSource: Division of Evaluation and Research, Department of Education

CRT School Results
Primary English Language Arts
2006-07
#426 - Hillview Academy, Norris ArmGrades: K-9
District 3 - Nova Central
3 Year CRT (Subtest) Mark Trend 2005-2007
OrganizationContent Voice
Sentence
Fluency
Word Choice Convention
Multiple Choice
ListeningReading
Rubrics Results: Percentage of students performing at Level 3 and Above 2005-2007
Demand WritingInformational
Reading
Poetic Reading Visual Reading Listening Speaking
20052006
2007
Process Writing (10 % Sample)
Rubrics Results: Percentage of students performing at Level 3 and Above 2005-2007
J:\PUBLIC07\PATPAM\CRTS\ELA03_W.RPT
335
24/11/2007
10:27:42PMSource: Division of Evaluation and Research, Department of Education
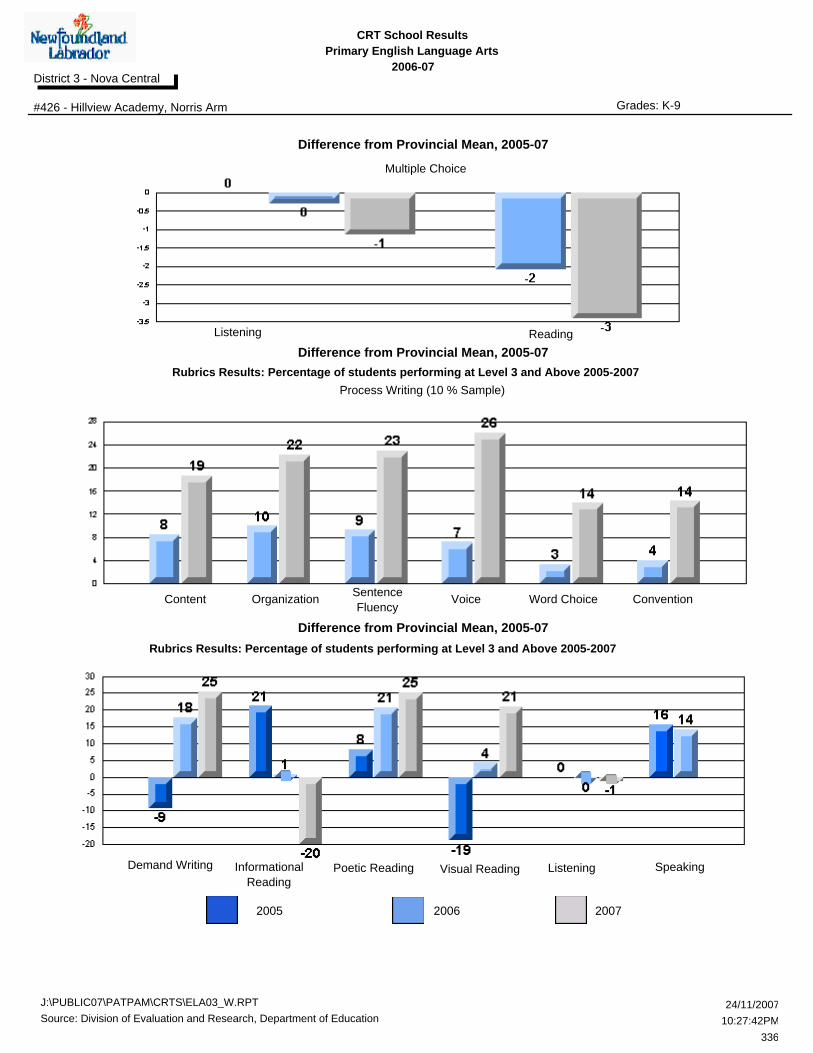
CRT School Results
Primary English Language Arts
2006-07
#426 - Hillview Academy, Norris ArmGrades: K-9
District 3 - Nova Central
Difference from Provincial Mean, 2005-07
Multiple Choice
ListeningReading
2005 2006 2007
Process Writing (10 % Sample)
Rubrics Results: Percentage of students performing at Level 3 and Above 2005-2007
Content Word ChoiceVoice
Sentence
Fluency
Organization Convention
Rubrics Results: Percentage of students performing at Level 3 and Above 2005-2007
Demand WritingInformational
Reading
Poetic Reading Visual Reading Listening Speaking
Difference from Provincial Mean, 2005-07
Difference from Provincial Mean, 2005-07
J:\PUBLIC07\PATPAM\CRTS\ELA03_W.RPT
336
24/11/2007
10:27:42PMSource: Division of Evaluation and Research, Department of Education

CRT School Results
Primary English Language Arts
2006-07
#478 - New World Island Academy, SummerfordGrades: K-12
District 3 - Nova Central
Reading
Listening
Multiple Choice
School
vs
Province
School
vs
District
Mark
School
District
Province
Number of Students :
Rubrics
Process Writing
Content
Organization
Sentence Fluency
Voice
Word Choice
Conventions
Poetic Reading
Informational Reading
Visual Reading
Listening
Speaking
School
District
Province
School
District
Province
School
District
Province
School
District
Province
School
District
Province
School
District
Province
School
District
Province
School
District
Province
School
District
Province
School
District
Province
School
District
Province
School
District
Province
86.4
88.9
100.0
34
75.0
75.0
75.0
100.0
100.0
37.5
50.0
6.3
60.6
25.0
88.3
81.9
83.0
81.9
91.5
91.5
65.8
74.0
43.6
63.6
85.1
81.4
77.7
77.0
73.9
86.1
85.7
65.7
74.4
42.5
64.0
85.7
91.4
89.8
92.1
89.7
Demand Writing
School
District
Province
70.6
78.7
74.5
p
p
p
p
p
p
p
q q
q q
q q
q
q q
q q
q q
q q
q q
J:\PUBLIC07\PATPAM\CRTS\ELA03_W.RPT
337
24/11/2007
10:27:42PMSource: Division of Evaluation and Research, Department of Education

CRT School Results
Primary English Language Arts
2006-07
#478 - New World Island Academy, SummerfordGrades: K-12
District 3 - Nova Central
3 Year CRT (Subtest) Mark Trend 2005-2007
OrganizationContent Voice
Sentence
Fluency
Word Choice Convention
Multiple Choice
ListeningReading
Rubrics Results: Percentage of students performing at Level 3 and Above 2005-2007
Demand WritingInformational
Reading
Poetic Reading Visual Reading Listening Speaking
20052006
2007
Process Writing (10 % Sample)
Rubrics Results: Percentage of students performing at Level 3 and Above 2005-2007
J:\PUBLIC07\PATPAM\CRTS\ELA03_W.RPT
338
24/11/2007
10:27:42PMSource: Division of Evaluation and Research, Department of Education
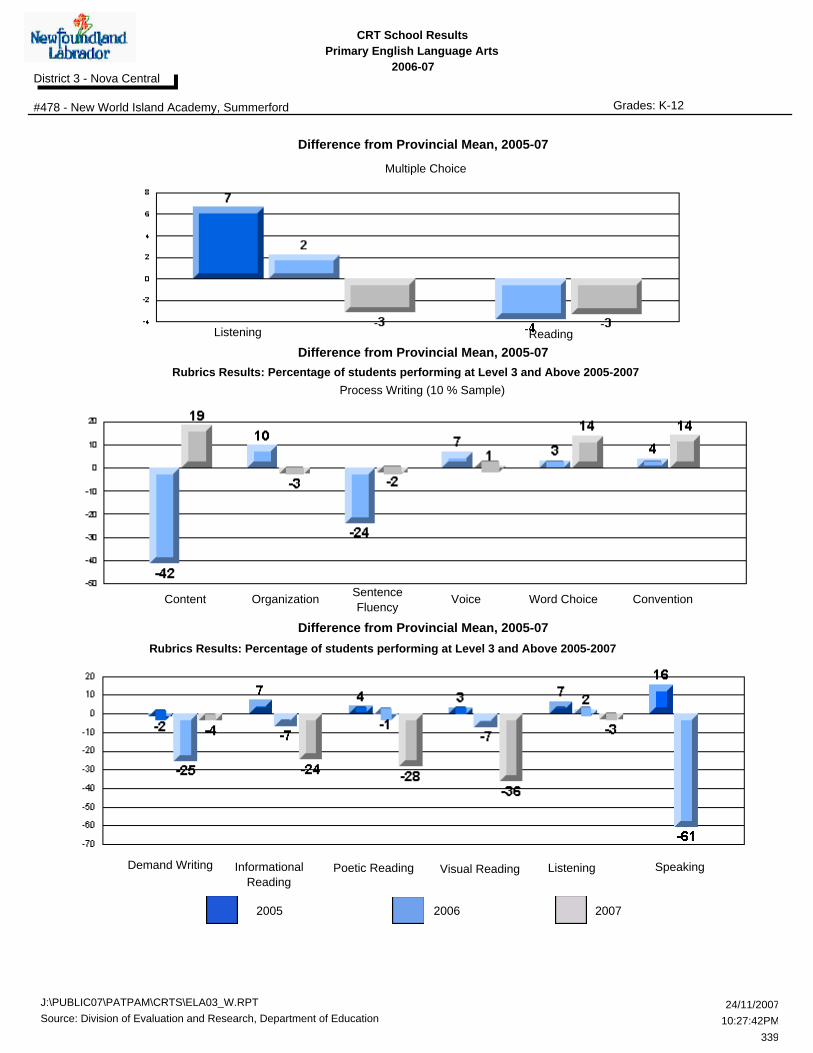
CRT School Results
Primary English Language Arts
2006-07
#478 - New World Island Academy, SummerfordGrades: K-12
District 3 - Nova Central
Difference from Provincial Mean, 2005-07
Multiple Choice
ListeningReading
2005 2006 2007
Process Writing (10 % Sample)
Rubrics Results: Percentage of students performing at Level 3 and Above 2005-2007
Content Word ChoiceVoice
Sentence
Fluency
Organization Convention
Rubrics Results: Percentage of students performing at Level 3 and Above 2005-2007
Demand WritingInformational
Reading
Poetic Reading Visual Reading Listening Speaking
Difference from Provincial Mean, 2005-07
Difference from Provincial Mean, 2005-07
J:\PUBLIC07\PATPAM\CRTS\ELA03_W.RPT
339
24/11/2007
10:27:42PMSource: Division of Evaluation and Research, Department of Education