PRIMARY ALUMINUM DEMAND: THE POWER OF · PDF filePRIMARY ALUMINUM DEMAND: THE POWER OF...
30
Emirates Global Aluminium 0 PRIMARY ALUMINUM DEMAND: THE POWER OF DEMOGRAPHICS…AMERICAS AND ASIA TO LEAD ADEL ABUBAKAR MANAGING DIRECTOR, DUBAL AMERICA INC. PLATTS ALUMINUM SYMPOSIUM 2015
Transcript of PRIMARY ALUMINUM DEMAND: THE POWER OF · PDF filePRIMARY ALUMINUM DEMAND: THE POWER OF...

Emirates Global Aluminium 0
PRIMARY ALUMINUM DEMAND: THE POWER OF DEMOGRAPHICS…AMERICAS AND ASIA TO LEAD ADEL ABUBAKAR MANAGING DIRECTOR, DUBAL AMERICA INC.
PLATTS ALUMINUM SYMPOSIUM 2015

Emirates Global Aluminium 1
Brief overview of DUBAL America Inc & Emirates Global Aluminium

Emirates Global Aluminium 2
DUBAL America Inc.
• DUBAL America is a wholly owned subsidiary of EGA. • Responsible for the marketing and distribution of DUBAL and EMAL
products in North America since 1999. • Offices based in St. Louis, MO providing end-to-end services to customers
on a real-time basis. • Swift decision-making and seamless operations providing superior service
to customers. • Importing products such as billet, foundry, purity grades and rolling slab.

Emirates Global Aluminium 3
Core primary aluminium smelters
• Dubai Aluminium (“DUBAL”) ‒ Commissioned end-1979 ‒ Sequential expansions, advancing technologies ‒ Smelter: 1,573 reduction cells in seven potlines (>1 M tpa) ‒ Casting operations (>1 M tpa) ‒ 2,350 MW power station ‒ 30 million gallon/day desalination plant ‒ Port facilities
• Emirates Aluminium (“EMAL”)
‒ Commissioned end-2010 (phase I) and mid-2014 (phase II) ‒ Smelter: 1,200 reduction cells in three potlines (>1,32 M tpa) ‒ Casting operations (~1.6 M tpa) ‒ 3,100 MW power station ‒ 3.75 million gallon/day desalination plant ‒ Port facilities
Emirates Global Aluminium 4
EGA is niche-focused on value-added products Product type cast by DUBAL and EMAL from 2014 (i.e. EMAL Phase II fully
commissioned)
Total 2,500,000 tpa
240,000
780,000
1,100,000
380,000
Unalloyed
Foundry
Billet
Slab
PRODUCTION BY PRODUCT TYPE IN 2014 (tonnes)
Emirates Global Aluminium 5
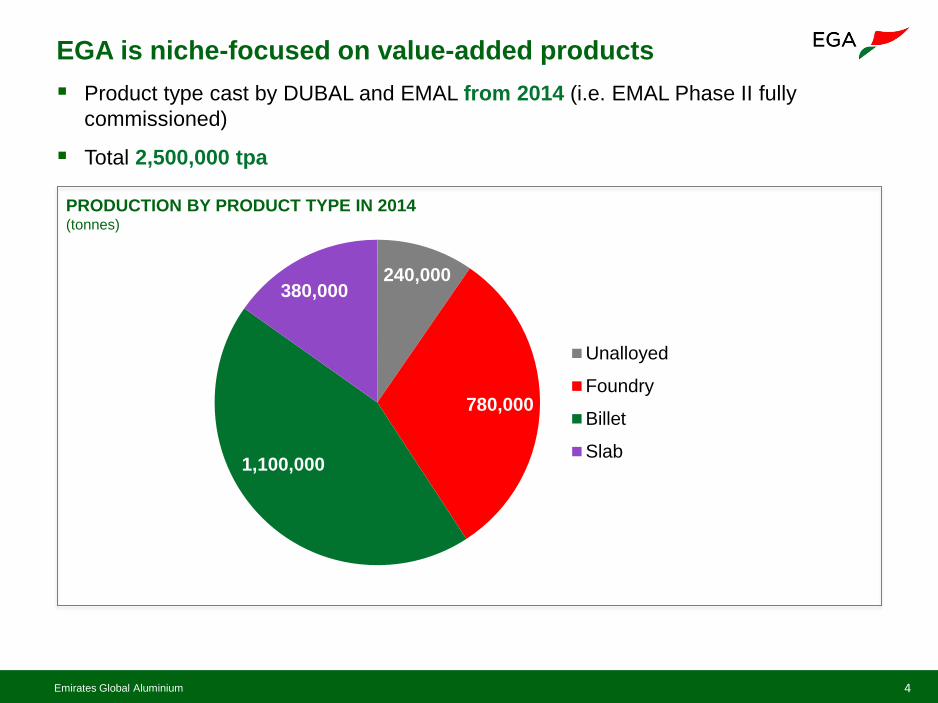
Direct sales to end-users Focused on sustaining long-term relationships with customers
Overseas offices Agents Direct markets
EGA distribution network
DUBAL America Inc.
DUBAL Europe AG
DUBAL Korea Co.
DUBAL EU Imports
US Network of hubs
Delivered JIT Plants
Europe Network of hubs
Delivered JIT Plants
Asia CIF based transport
Middle East Delivered JIT Plants
North Africa CIF based transport

Emirates Global Aluminium 6
PRIMARY ALUMINUM DEMAND: THE POWER OF DEMOGRAPHICS…AMERICAS AND ASIA TO LEAD
Emirates Global Aluminium 7
-2
0
2
4
1951 1961 1971 1981 1991 2001 2011 2021 2031
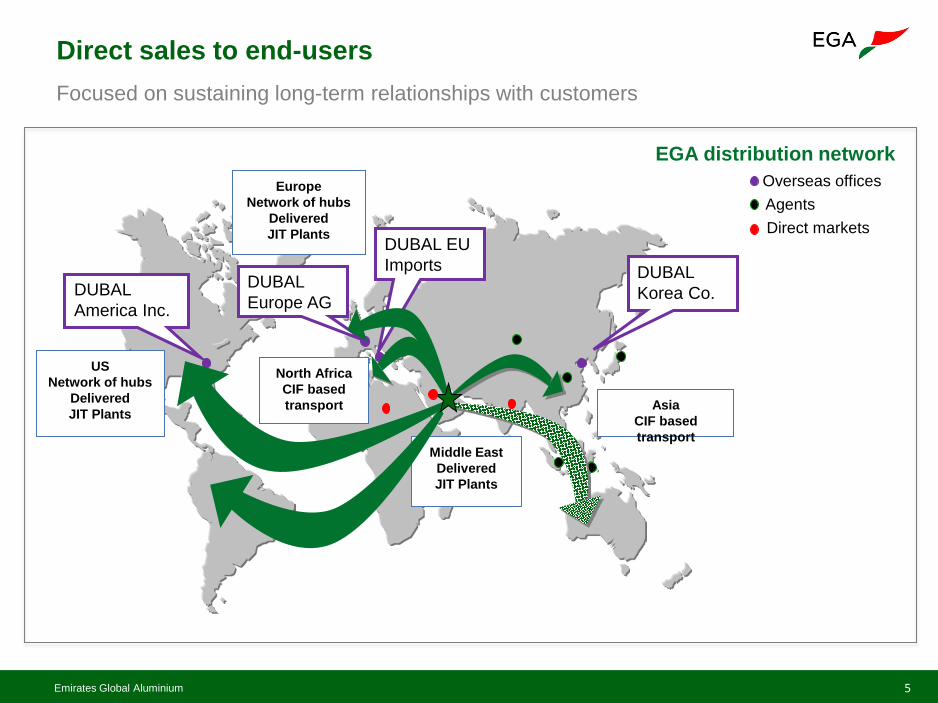
WORKING AGE POPULATION GROWTH (WAP*): US, WEST EUROPE & CHINA (annual percentage change)
Source: HARBOR Aluminum * Working age population
A positive demographic pattern is ahead for the US… not for Europe and China
WEST EUROPE
US CHINA

Emirates Global Aluminium 8
With demographics + income growth combined… the US is again the bright spot
0
2
4
6
8
10
12
14
1
3
5
7
9
11
1970 1980 1990 2000 2010 2020 2030 20402
3
4
5
6
7
8
2
3
4
5
6
7
1970 1980 1990 2000 2010 2020 2030 2040
US WAPI* VS PRIMARY ALUMINUM DEMAND (million dollars vs million tonne)
WEST EUROPE WAPI* VS PRIMARY ALUMINUM DEMAND (million dollars vs million tonne)
Source: HARBOR Aluminum * Working age population multiplied by GDP per capita
FORECAST 2014-2040
FORECAST 2014-2040
PRIMARY ALUMINUM DEMAND (RIGHT SCALE)
Source: HARBOR Aluminum * Working age population multiplied by GDP per capita
PRIMARY ALUMINUM DEMAND (RIGHT SCALE) WAPI
(LEFT SCALE)
WAPI (LEFT SCALE)
Emirates Global Aluminium 9
0
15
30
45
60
75
90
0
1
2
3
4
5
6
7
1970 1980 1990 2000 2010 2020 2030 20400
9
18
27
36
45
0
2
4
6
8
1970 1980 1990 2000 2010 2020 2030 2040
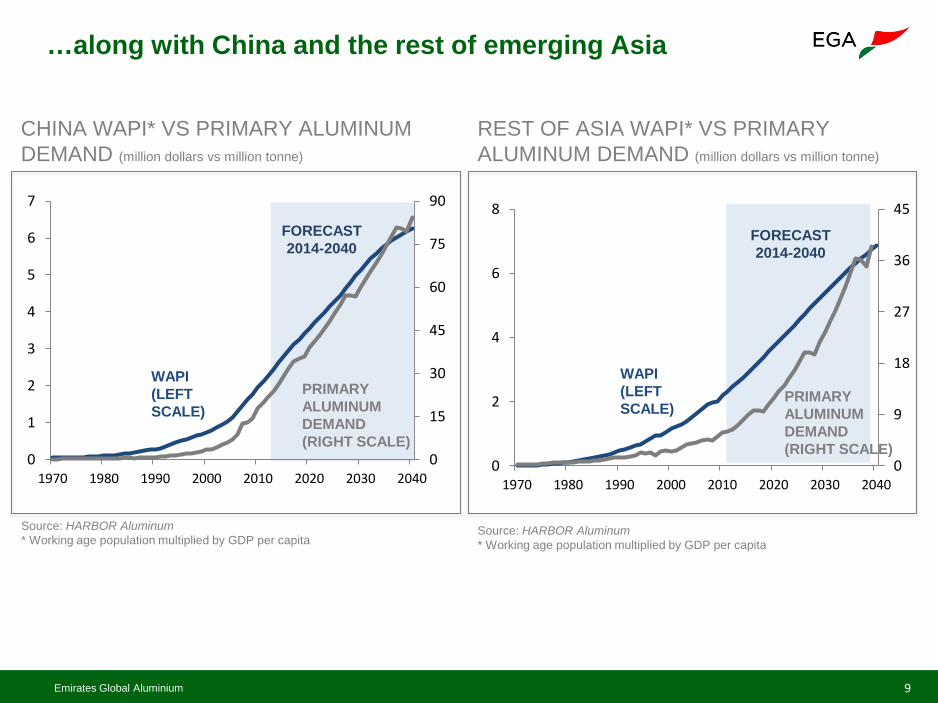
CHINA WAPI* VS PRIMARY ALUMINUM DEMAND (million dollars vs million tonne)
REST OF ASIA WAPI* VS PRIMARY ALUMINUM DEMAND (million dollars vs million tonne)
Source: HARBOR Aluminum * Working age population multiplied by GDP per capita
Source: HARBOR Aluminum * Working age population multiplied by GDP per capita
…along with China and the rest of emerging Asia
FORECAST 2014-2040
FORECAST 2014-2040
PRIMARY ALUMINUM DEMAND (RIGHT SCALE)
WAPI (LEFT SCALE)
PRIMARY ALUMINUM DEMAND (RIGHT SCALE)
WAPI (LEFT SCALE)

Emirates Global Aluminium 10
PRIMARY ALUMINUM DEMAND, SUPPLY AND BALANCE TRENDS: PRIMARY DEFICIT TO WIDEN THE MOST IN THE AMERICAS

Emirates Global Aluminium 11
2.0 3%
PRIMARY ALUMINUM CONSUMPTION BY REGION 2017 (million tonne & percentage of global consumption)
7.4 11%
CHINA
35.7 52%
6.1 9%
LATIN AMERICA
2.5 4%
2.7 4%
REST OF ASIA
9.4 14%
MIDDLE EAST
1.7 3%
AFRICA
0.8 1%
OCEANIA
NORTH AMERICA
WESTERN EUROPE
EASTERN EUROPE
JAPAN
0.4 1%
2014-2017: +7.4%
2014-2017: +8.3%
2014-2017: 1.3%
2014-2017: +6.0%
2014-2017: +16%
2014-2017: +9.0%
2014-2017: +0.6%
2014-2017: +0.2%
Source: HARBOR Aluminum
2014-2017: +11%
The Americas and Asia to lead primary demand growth in the world excluding China…
GLOBAL 68.7 MT
2014-2017: +7.6%
CAGR
2014-2017: 5.3%
CAGR during this period
Share of global consumption in 2017
Million mton of annual demand in 2017

Emirates Global Aluminium 12
…in line with expected industrial production dynamics…
INDUSTRIAL PRODUCTION* VS PRIMARY ALUMINUM DEMAND EXPECTED** GROWTH IN 2015 (y/y growth percentage)
7.8
3.7
1.6 1.6
3.3
0.6
8.2
5.9
1.0 0.2
6.3
2.0
0
3
6
9
China USA Eurozone Japan India Brazil
INDUSTRIAL PRODUCTION
PRIMARY ALUMINUM DEMAND
* Consensus forecast reported by Bloomberg **HARBOR’s aluminum demand forecast Source: HARBOR Aluminum and Bloomberg

Emirates Global Aluminium 13
PRIMARY ALUMINUM PRODUCTION BY REGION 2017 (million tonnw & percentage of global production)
5.3 8%
CHINA
35.3 53%
3.8 6%
LATIN AMERICA
1.5 2%
4.4 7%
6.5 10%
MIDDLE
EAST
5.5 8%
AFRICA
OCEANIA
NORTH AMERICA
WESTERN
EUROPE
EASTERN EUROPE
Source: HARBOR Aluminum
1.8 3%
2.0 3%
2014-2017 +1.7%
2014-2017 -5.9%
2014-2017 -0.7%
2014-2017 +2.2%
2014-2017 +0.3%
2014-2017 +6.8%
2014-2017 +9.1%
2014-2017 -1.8%
CAGR
REST OF ASIA
2014-2017 +23.4%
…but practially all the new commited output expansions will take place in Asia…
Share of global production in 2017
Million mton of annual production in 2017
CAGR during this period
Emirates Global Aluminium 14
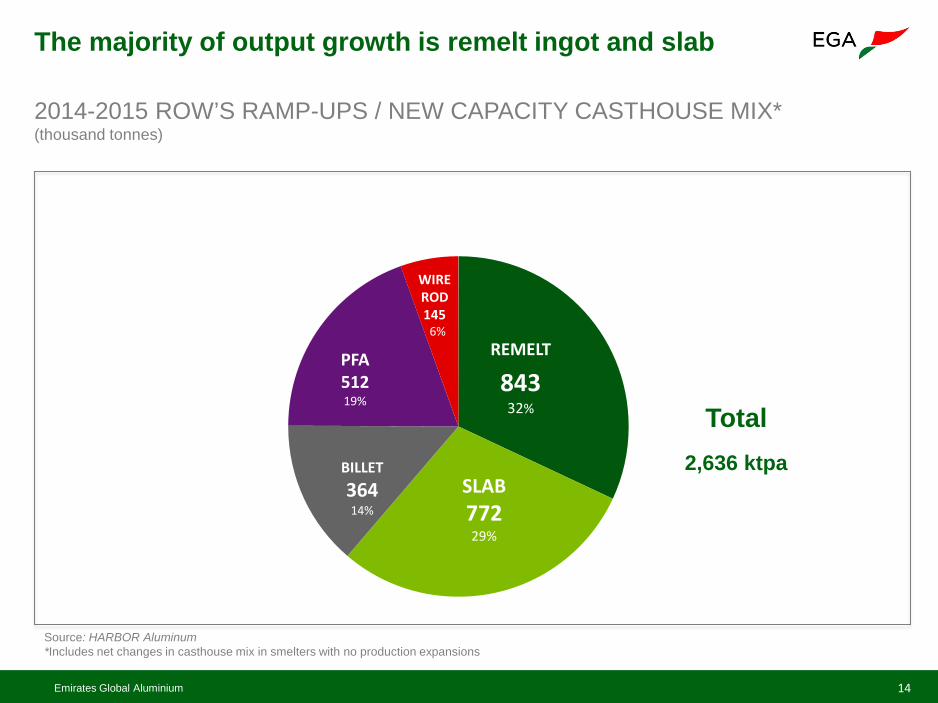
Source: HARBOR Aluminum *Includes net changes in casthouse mix in smelters with no production expansions
The majority of output growth is remelt ingot and slab
2014-2015 ROW’S RAMP-UPS / NEW CAPACITY CASTHOUSE MIX* (thousand tonnes)
843 32%
BILLET 364 14%
PFA 512 19%
SLAB 772 29%
REMELT
Total 2,636 ktpa
WIRE ROD 145 6%

Emirates Global Aluminium 15
HARBOR expects a production shortfall in ROW in the next three years… PRIMARY ALUMINUM MARKET BALANCE (thousand tonne)
-1,383 -1,603
-690
-2,408
10
552 600
-492
-3,000
-2,000
-1,000
0
1,000
2014e 2015f 2016f 2017f
ROW CHINA
Source: HARBOR Aluminum
Emirates Global Aluminium 16
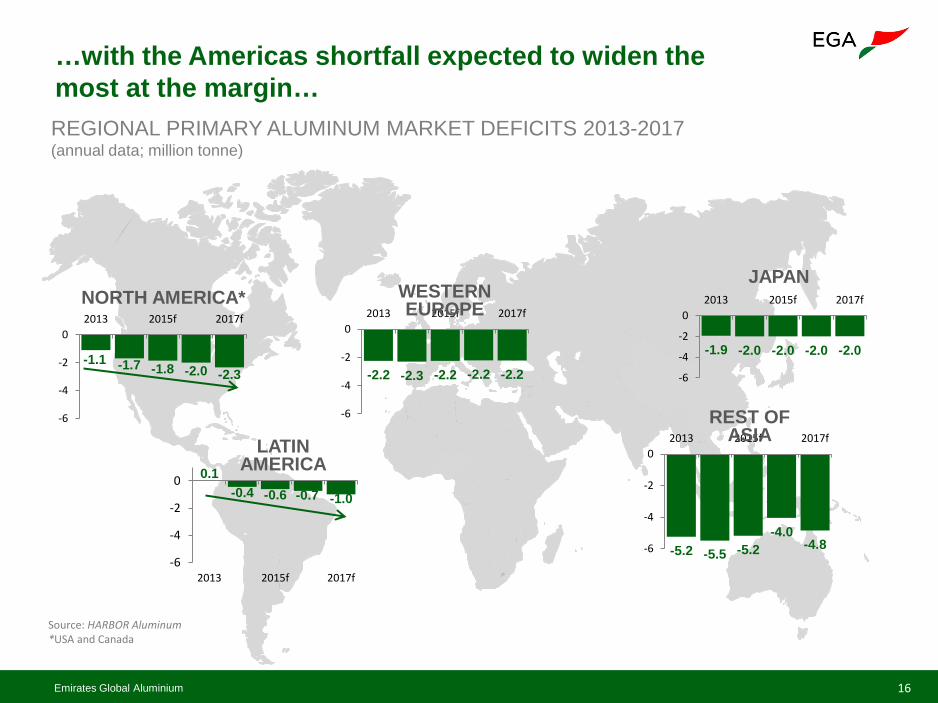
0.1 -0.4 -0.6 -0.7 -1.0
-6
-4
-2
0
2013 2015f 2017f
-5.2 -5.5 -5.2 -4.0
-4.8 -6
-4
-2
02013 2015f 2017f
-1.9 -2.0 -2.0 -2.0 -2.0
-6
-4
-2
02013 2015f 2017f
-2.2 -2.3 -2.2 -2.2 -2.2
-6
-4
-2
02013 2015f 2017f
-1.1 -1.7 -1.8 -2.0 -2.3
-6
-4
-2
02013 2015f 2017f
REGIONAL PRIMARY ALUMINUM MARKET DEFICITS 2013-2017 (annual data; million tonne)
LATIN AMERICA
WESTERN EUROPE
Source: HARBOR Aluminum *USA and Canada
REST OF ASIA
JAPAN NORTH AMERICA*
2013-2017 CHANGE
…with the Americas shortfall expected to widen the most at the margin…

Emirates Global Aluminium 17
1.7 1.7 1.6 1.6 1.6
0
1
2
3
4
5
2013 2015f 2017f
2.2 1.7 1.7 1.8 1.6
0
1
2
3
4
5
2013 2015f 2017f
REGIONAL PRIMARY ALUMINUM MARKET SURPLUSES 2013-2017 (annual data; million tonne)
EASTERN EUROPE
Source: HARBOR Aluminum
…as it is the farthest away region from where regional surpluses are
3.3 4.0 3.9 3.8 3.8
0
1
2
3
4
5
2013 2015f 2017f
MIDDLE EAST
1.2 1.2 1.1 1.0 1.0
0
1
2
3
4
5
2013 2015f 2017f
AFRICA OCEANIA

Emirates Global Aluminium 18
2.26 2.27 2.24 2.06 2.23 2.08 2.21 2.33 2.24
-2.39 -2.87 -2.9 -3.05 -3.33 []0 -4.08 -4.32 -4.57-0.25
-0.38 -0.38-0.44
-0.46-0.49
-0.52-0.56 []0
-6
-3
0
3
2009 2010 2011 2012 2013 2014f 2015f 2016f 2017f
PRIMARY ALUMINUM BALANCE NORTH AMERICA BY COUNTRY (million tonne)
Source: HARBOR Aluminum
If we include Mexico, North America deficit expected at almost 3 million mton by 2017
CANADA
USA
MEXICO
-0.38 -0.98 -1.04 -1.43 -1.56 -2.21 -2.39 -2.55 -2.93 NORTH AMERICA
Emirates Global Aluminium 19
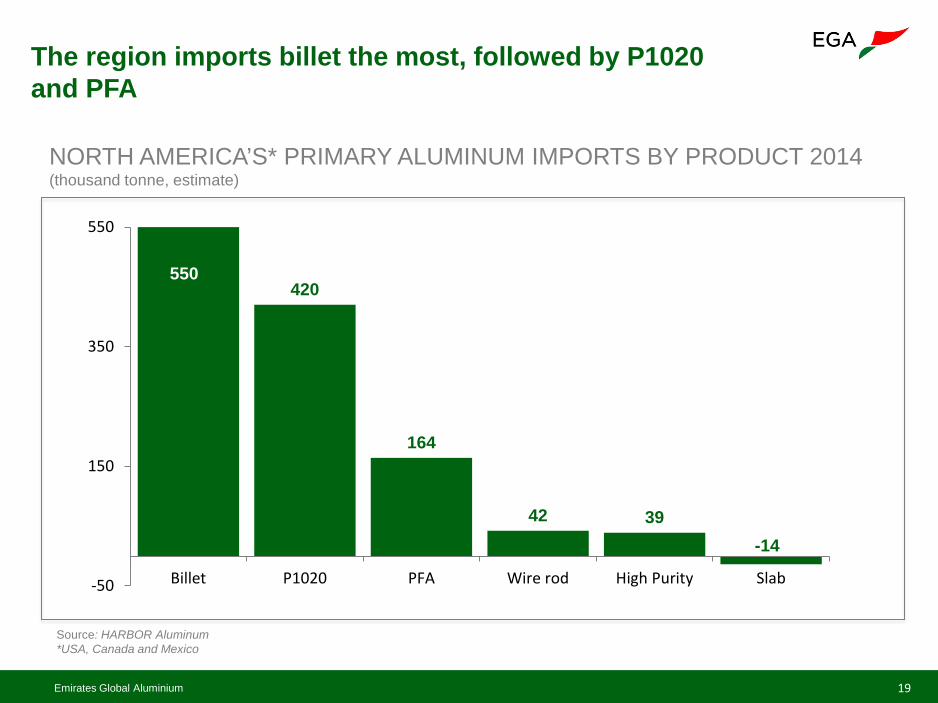
The region imports billet the most, followed by P1020 and PFA
Source: HARBOR Aluminum *USA, Canada and Mexico
NORTH AMERICA’S* PRIMARY ALUMINUM IMPORTS BY PRODUCT 2014 (thousand tonne, estimate)
420
164
42 39 -14
-50
150
350
550
Billet P1020 PFA Wire rod High Purity Slab
550

Emirates Global Aluminium 20
SUBSTITUTION TRENDS: GLOBAL ECONOMY MORE ALUMINUM INTENSIVE THAN EVER TRANSPORTATION THE HOT SPOT

Emirates Global Aluminium 21
The global economy is increasingly aluminum intensive… GLOBAL ECONOMY ALUMINUM INTENSITY (thousand tonne of aluminum consumption per billion dollar of global working age population income)
1.5
2.5
3.5
4.5
1970 1980 1990 2000 2010 2020 2030 2040
1974 3.3
2013 2.9
2009 2.1
2027f 3.5
2040f 3.9

Emirates Global Aluminium 22
24%
10% 15%
24%
13%
9% 4%
…with transportation sector leading at the margin…
GLOBAL SEMIS CONSUMPTION 2012-2017 BY END USE SECTOR (million mton and share of total consumption in 2011)
7.2% Transport
Construction
Packaging
Electrical
Engineering
6.7%
8.1%
5.5%
6.6%
Durables 6.6%
Other 6.6%
7.6 million tonne
2.9 million tonne
5.5 million tonne
6.7 million tonne
2.9 million tonne
2.6 million tonne 1.2 million tonne
Source: HARBOR Aluminum
CAGR ‘12-’17
Global annual demand for aluminum (primary+scrap) from transportation sector will be 7.6 million tonnes higher in 2017 vs 2012.

Emirates Global Aluminium 23
…mainly as more aluminum is being used in vehicles (especially in North America)
ALUMINUM CONTENT PER VEHICLE (kg per vehicle; global average)
0
50
100
150
200
250
30020
0520
0620
0720
0820
0920
1020
1120
1220
1320
1420
1520
1620
1720
1820
1920
2020
2120
2220
2320
2420
25
Globally, aluminum content per vehicle could double in 2012-2025 to 250 kg/vehicle, increasing by an average rate of 9 kg/year
107 123
255
Source: HARBOR Aluminum, Ducker Report and Aluminum Association

Emirates Global Aluminium 24
The aluminum content in vehicles in NA to grow around 1.8 million tonne in 2015-2020
TOTAL ALUMINUM CONTENT IN ESTIMATED TOTAL VEHICLE PRODUCTION BY REGION (million tonne)
3.2
5.0
11.4
14.8
0
4
8
12
16
2015f 2020f
Source: HARBOR Aluminum and Ducker Report

Emirates Global Aluminium 25
POTENTIAL OUTPUT RESTARTS AND CHINA´S SEMI PRODUCT EXPORTS: COULD MORE THAN HALVE THE EXPECTED PRIMARY SHORTAGE IN ROW IN 2015
Emirates Global Aluminium 26
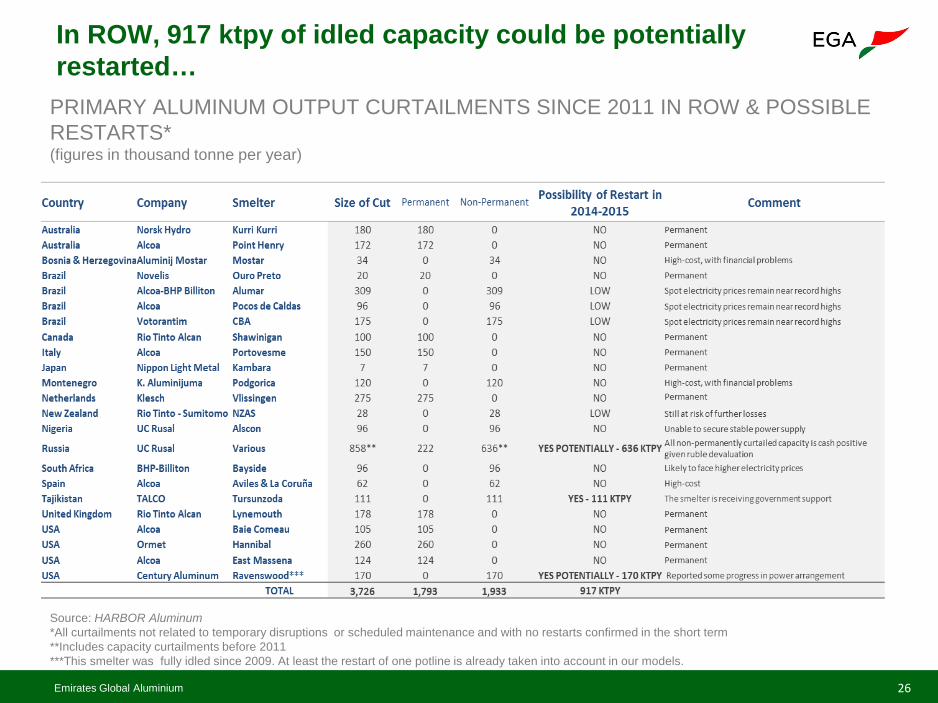
In ROW, 917 ktpy of idled capacity could be potentially restarted…
PRIMARY ALUMINUM OUTPUT CURTAILMENTS SINCE 2011 IN ROW & POSSIBLE RESTARTS* (figures in thousand tonne per year)
Source: HARBOR Aluminum *All curtailments not related to temporary disruptions or scheduled maintenance and with no restarts confirmed in the short term **Includes capacity curtailments before 2011 ***This smelter was fully idled since 2009. At least the restart of one potline is already taken into account in our models.

Emirates Global Aluminium 27
Moreover, Chinese exports could displace 50% of the ROW expected demand growth
CHINESE SEMIS EXPORT GROWTH* AS PERCENTAGE OF EXPECTED REGIONAL PRIMARY DEMAND GROWTH IN 2014 (%)
67
48 48
0
20
40
60
80
Asia exc. China North America Europe
Source: HARBOR Aluminum *In H2 2014

Emirates Global Aluminium 28
China + potential restarts could more than halve ROW´s primary deficit for 2015
EXPECTED ROW PRIMARY ALUMINUM BALANCE IN 2015 VS POTENTIAL CAPACITY RESTARTS AND EFFECT OF CHINESE SEMI EXPORTS (figures in million tonne per year)
1.6
0
0.6
1.2
1.8
Expected 2015 ROW primary aluminum deficit
1.1
0.5
0.6
POTENTIAL RESTARTS (SIBERIAN SMELTERS + RAVENSWOOD)
POTENTIAL DISPLACED ROW DEMAND BY CHINESE SEMI EXPORTS
Source: HARBOR Aluminum

Emirates Global Aluminium 29
THANK YOU Any questions?