Pricing probe in the US dampens sentiment… - ICICI...
28
ICICI Securities Ltd. | Retail Equity Research December 19, 2016 Pricing probe in the US dampens sentiment… The collusion probe regarding pricing of some generic drugs initiated by the US justice department in the US has taken a decisive turn. Based on the findings as many as 20 states have filed a lawsuit against six generic drug makers on pricing of two generic drugs Glyburide (anti-diabetic) and Doxycycline (anti-infective). In one such probe, US based Heritage Pharma has been framed as ring leader and others such as Teva, Mayne Pharma, Citron and Aurobindo as participants in the case of Glyburide. In case of Doxycycline the parties involved are Heritage, Mayne and Mylan. On the regulatory front, Sun Pharma’s Halol facility received nine Form 483 observations post the USFDA re-inspection (November 17, 2016 - December 1, 2016). This was on the heels of Sun’s Mohali plant (erstwhile Ranbaxy) which also received Form 483 observations from the USFDA. In another such case, Divi’s Vizag unit received five observations from USFDA. However, as per management, the observations are routine and would not impact the company’s operational performance. In an important development, the Delhi High Court has set aside government’s decision to ban 344 fixed dose combination (FDC) medicines. The government had imposed ban on these medicines in a 10 th March, 2016 notification covering ~6,000 medicine brands, including several popular ones like Corex, Phensedyl, Saridon and Vicks Action 500 Extra. FDC related market were down by ~10% to | 2513 core (AIOCD MAT Nov 2016). On the key launches front, Glenmark has launched gZetia in the US under exclusivity through its marketing partner Par Pharma. Zetia had US sales of US$ 2.3 billion (IMS MAT Oct 2016). Finally on the domestic front, The Indian pharmaceutical market (IPM) grew 15.3% YoY to | 9388 crore for the month of November. The growth was driven by volumes increase - 9.6%, new product launches - 3.5% and price hikes - 2.2%. On a MAT basis, IPM growth stood at 10.8% YoY. Focus shifts to US pricing probe, likely to weigh in the near term After battling with cGMP related issues and pricing pressure due to client consolidation in the US, Indian generic players are now bracing for new challenge- the pricing probe in the US. Even though the incidences are sporadic and do not warrants altering with numbers at this juncture, investors remain wary about the outcome and pricing power in the future. This is likely to emerge as a new overhang for the sector. On the bright side the USFDA approvals momentum remains at elevated level and even though there are fresh instances of Form 483 issuances, most of them seem manageable. On the demonetization front, we do not expect any material long term impact, though short term channel disruption is likely to impact the domestic growth especially in acute segment. Overall in the long run we expect earnings momentum to continue on the back of incremental product launches largely on speciality, biosimilar and innovation front in the US and likely positive outcome from the USFDA re-inspections besides normalising of Indian formulations growth. We expect healthcare universe revenues, EBITDA and PAT to grow at a CAGR of 16%, 13% and 16%, respectively, in FY16-19E. The growth will be steered by US and Indian formulations (~14% CAGR over FY16-19E). Health Check Sector View Positive Index Performance as on December 16, 2016 Return (%) 1M 3M YTD 1Y CNX 500 0.8 -7.3 3.6 6.0 Nifty 0.6 -7.8 2.2 4.7 NSE Pharma -1.2 -9.7 -11.2 -8.9 Return (%) Stocks Performance Mcap Company 1M 3M YTD 1Y 16-Dec Sun Pharma.Inds. -7.1 -18.2 -22.0 -19.0 153549 Lupin 4.0 -4.7 -19.7 -17.3 66579 Dr Reddy's Labs -3.9 -2.2 -0.7 3.8 51151 Cipla 2.6 -5.4 -13.0 -12.0 45465 Aurobindo Pharma -2.2 -12.2 -19.4 -15.0 41331 Cadila Health. 1.6 -2.4 15.6 -3.2 38759 Divi's Lab. -2.5 -14.1 0.0 0.6 30662 Glenmark Pharma. 3.6 1.4 1.3 2.3 26343 Glaxosmit Pharma -0.3 -4.9 -18.5 -17.5 22890 Torrent Pharma. -1.1 -19.3 -9.7 -9.4 21919 Biocon 11.9 4.6 88.4 103.1 19520 Apollo Hospitals 0.2 -7.8 -18.3 -17.1 16673 Ajanta Pharma -0.6 -9.4 34.4 40.4 15757 Alembic Pharma 3.8 -3.5 -10.2 -7.4 11782 Syngene Int. 8.8 22.1 39.7 50.8 11640 Natco Pharma -6.7 -7.3 3.1 9.3 10398 Jubilant Life -1.5 3.4 50.5 48.4 9863 Strides Arcolab 4.0 4.4 -16.2 -17.3 9657 Pfizer 2.3 -8.2 -21.8 -22.4 8436 Wockhardt -6.1 -22.9 -55.1 -57.8 7588 Ipca Labs. 0.2 -8.0 -26.6 -26.7 6867 Unichem Labs. 2.6 0.2 0.4 -0.2 2440 Indoco Remedies -6.4 -18.1 -19.3 -17.7 2433 Return (%) Market cap in | crore Price movement 4000 6000 8000 10000 12000 5000 6000 7000 8000 9000 10000 11000 12000 13000 14000 15000 Dec-15 Mar-16 Jun-16 Sep-16 Dec-16 CNX Pharma Nifty (RHS) Research Analyst Siddhant Khandekar [email protected] Mitesh Shah [email protected]
Transcript of Pricing probe in the US dampens sentiment… - ICICI...

ICICI Securities Ltd. | Retail Equity Research
December 19, 2016
Pricing probe in the US dampens sentiment… The collusion probe regarding pricing of some generic drugs initiated by the US justice department in the US has taken a decisive turn. Based on the findings as many as 20 states have filed a lawsuit against six generic drug makers on pricing of two generic drugs Glyburide (anti-diabetic) and Doxycycline (anti-infective). In one such probe, US based Heritage Pharma has been framed as ring leader and others such as Teva, Mayne Pharma, Citron and Aurobindo as participants in the case of Glyburide. In case of Doxycycline the parties involved are Heritage, Mayne and Mylan. On the regulatory front, Sun Pharma’s Halol facility received nine Form 483 observations post the USFDA re-inspection (November 17, 2016 - December 1, 2016). This was on the heels of Sun’s Mohali plant (erstwhile Ranbaxy) which also received Form 483 observations from the USFDA. In another such case, Divi’s Vizag unit received five observations from USFDA. However, as per management, the observations are routine and would not impact the company’s operational performance. In an important development, the Delhi High Court has set aside government’s decision to ban 344 fixed dose combination (FDC) medicines. The government had imposed ban on these medicines in a 10th March, 2016 notification covering ~6,000 medicine brands, including several popular ones like Corex, Phensedyl, Saridon and Vicks Action 500 Extra. FDC related market were down by ~10% to | 2513 core (AIOCD MAT Nov 2016). On the key launches front, Glenmark has launched gZetia in the US under exclusivity through its marketing partner Par Pharma. Zetia had US sales of US$ 2.3 billion (IMS MAT Oct 2016). Finally on the domestic front, The Indian pharmaceutical market (IPM) grew 15.3% YoY to | 9388 crore for the month of November. The growth was driven by volumes increase - 9.6%, new product launches - 3.5% and price hikes - 2.2%. On a MAT basis, IPM growth stood at 10.8% YoY. Focus shifts to US pricing probe, likely to weigh in the near term After battling with cGMP related issues and pricing pressure due to client consolidation in the US, Indian generic players are now bracing for new challenge- the pricing probe in the US. Even though the incidences are sporadic and do not warrants altering with numbers at this juncture, investors remain wary about the outcome and pricing power in the future. This is likely to emerge as a new overhang for the sector. On the bright side the USFDA approvals momentum remains at elevated level and even though there are fresh instances of Form 483 issuances, most of them seem manageable. On the demonetization front, we do not expect any material long term impact, though short term channel disruption is likely to impact the domestic growth especially in acute segment. Overall in the long run we expect earnings momentum to continue on the back of incremental product launches largely on speciality, biosimilar and innovation front in the US and likely positive outcome from the USFDA re-inspections besides normalising of Indian formulations growth. We expect healthcare universe revenues, EBITDA and PAT to grow at a CAGR of 16%, 13% and 16%, respectively, in FY16-19E. The growth will be steered by US and Indian formulations (~14% CAGR over FY16-19E).
Health CheckSector View
Positive
Index Performance as on December 16, 2016
Return (%) 1M 3M YTD 1Y
CNX 500 0.8 -7.3 3.6 6.0
Nifty 0.6 -7.8 2.2 4.7
NSE Pharma -1.2 -9.7 -11.2 -8.9
Return (%)
Stocks Performance Mcap
Company 1M 3M YTD 1Y 16-Dec
Sun Pharma.Inds. -7.1 -18.2 -22.0 -19.0 153549
Lupin 4.0 -4.7 -19.7 -17.3 66579
Dr Reddy's Labs -3.9 -2.2 -0.7 3.8 51151
Cipla 2.6 -5.4 -13.0 -12.0 45465
Aurobindo Pharma -2.2 -12.2 -19.4 -15.0 41331
Cadila Health. 1.6 -2.4 15.6 -3.2 38759
Divi's Lab. -2.5 -14.1 0.0 0.6 30662
Glenmark Pharma. 3.6 1.4 1.3 2.3 26343
Glaxosmit Pharma -0.3 -4.9 -18.5 -17.5 22890
Torrent Pharma. -1.1 -19.3 -9.7 -9.4 21919
Biocon 11.9 4.6 88.4 103.1 19520
Apollo Hospitals 0.2 -7.8 -18.3 -17.1 16673
Ajanta Pharma -0.6 -9.4 34.4 40.4 15757
Alembic Pharma 3.8 -3.5 -10.2 -7.4 11782
Syngene Int. 8.8 22.1 39.7 50.8 11640
Natco Pharma -6.7 -7.3 3.1 9.3 10398
Jubilant Life -1.5 3.4 50.5 48.4 9863
Strides Arcolab 4.0 4.4 -16.2 -17.3 9657
Pfizer 2.3 -8.2 -21.8 -22.4 8436
Wockhardt -6.1 -22.9 -55.1 -57.8 7588
Ipca Labs. 0.2 -8.0 -26.6 -26.7 6867
Unichem Labs. 2.6 0.2 0.4 -0.2 2440
Indoco Remedies -6.4 -18.1 -19.3 -17.7 2433
Return (%)
Market cap in | crore
Price movement
4000
6000
8000
10000
12000
50006000700080009000
100001100012000130001400015000
Dec-15 Mar-16 Jun-16 Sep-16 Dec-16
CNX Pharma Nifty (RHS)
Research Analyst
Siddhant Khandekar [email protected] Mitesh Shah [email protected]

ICICI Securities Ltd. | Retail Equity Research
Page 2
Regulatory approvals
Exhibit 1: Summary of USFDA approvals for Nov, 2016 [5
Company Drug Name Therapeutic Area Innovator company Generic Version of Market SizeAlembic Pharma Irbesartan; Hydrochlorothiazide CVS Sanofi Aventis Avalide NAJubilant Life Darifenacin ER Anti-Infective Allergan Enablex NAAjanta Pharma Lansoprazole Anti-ulcer Takeda Pharms Prevacid NAAurobindo Pharma Risedronate Sodium Osteoporosis Warner Chilcott Actonel US$113 millionAurobindo Pharma Eszopiclone tablets Insomnia Sepracor Lunesta NATorrent Pharma Fluoxetine Hydrochloride CNS APIL Sarafem NAAurobindo Pharma Nylia 7/7/7 (Ethinyl estradiol and norethindrone) OC Janssen Pharma Ortho-Novum 7/7/7-28 NAAurobindo Pharma Cyonanz (Ethinyl estradiol and norethindrone) OC Janssen Pharma Modicon 28 NAAurobindo Pharma Nylia 1/35 (Ethinyl estradiol and norethindrone) OC NA Ortho-Novum 1/35-28 NAGlenmark Pharma Nystatin and Triamcinolone acetonide Dermatology Delcor Assest Mycolog-II US$121 millionTorrent Pharma Olmesartan Medoxomil; Amlodipine; Hydrochlorothiazide CVS Daiichi Sankyo Tribenzor NADr Reddy's Lab Nystatin; Triamcinolone Acetonide Derma G And W Labs Mykacet US$ 37.5 millionLupin Estradiol and Norethindrone Acetate OC JANSSEN PHARMS ORTHO CYCLEN-28 NAAurobindo Pharma Ipratropium Bromide Respiratory Boehringer Ingelheim Atrovent NAAjanta Pharma Amlodipine; Olmesartan Medoxomil Bloodpressure Daiichi Sankyo Azor US$ 174 millionCipla Montelukast Sodium Anti-asthama Merck Singulair NATorrent Pharma Rosuvastatin Calcium Avascular necrosis IPR Crestor NAJubilant Life Rosuvastatin Calcium Avascular necrosis IPR Crestor NAJubilant Life Rosuvastatin Calcium Avascular necrosis IPR Crestor NA
Company Drug Name Therapeutic Area Innovator company Generic Version of Market SizeTorrent Pharma Olmesartan Medoxomil CVS Daiichi Sankyo Benicar NAAurobindo Pharma Hydrochlorothiazide; Olmesartan Medoxomil CVS Daiichi Sankyo Benicar HCT NAJubilant Life Olmesartan Medoxomil CVS Daiichi Sankyo Benicar NAAurobindo Pharma Guaifenesin;Dextromethorphan Hydrobromide Anti-Infective Reckitt Benckiser Mucinex DM NA
Final Approvals
Tentative Approvals
CNS: Central Nervous System; CVS: Cardiovascular,GI: Gastro Intestinal, NA: Not available; Source: USFDA, ICICIdirect.com Research
M&As, Demergers, Tie-ups and JVs Sun Pharma to acquire Biosintez in Russia Sun Pharma entered into an agreement to acquire 85.1% of JSC Biosintez, a Russian pharmaceutical company engaged in manufacture and marketing of pharmaceutical products in Russia and CIS region. Equity consideration for shares acquired is RUB 1,526 million (~| 163 crore). Sun Pharma would also assume a debt of ~US$ 36 million (~| 245 crore) as part of this transaction. JSC Biosintez’s 2015 annual revenue was RUB 3208 million (~| 343 crore). This deal expected to complete by end of 2016. Cipla EU divests stake in Chase Pharmaceuticals to Allergan Cipla announced that Chase Pharma (in which Cipla EU has 16.7% stake) has been acquired by Allergan, plc. Allergan has agreed to pay US$125 million upfront plus potential regulatory and commercial milestones of up to US$875 million to the shareholders of Chase. Cipla acquired a minority stake in Chase in May 2014 via a syndicated venture investment. Aurobindo’s French unit to buy products from Teva Aurobindo Pharma’s French subsidiary Arrow Generiques announced the signing of an agreement to acquire select commercial products in France from Teva. Arrow Generiques will acquire the right, title and interest in products Calcium and Calcium Vitamin D3, including the use of the OROCAL trademark. The transaction is subject to the approval of the European Commission IFC invests | 450 crore for 29% stake in Apollo Health International Finance Corp. (IFC) has invested | 450 crore for a 29% stake in Apollo Health and Lifestyle Ltd (AHLL), a unit of Apollo Hospitals Enterprise Ltd. IFC values AHLL at | 1550 crore. AHLL intends to use this money for expansion of various sub-units.

ICICI Securities Ltd. | Retail Equity Research
Page 3
Lupin partners Eli Lilly to market diabetes drug Eglucent Lupin and Eli Lilly (Indian subsidiary) have expanded their partnership in the diabetology therapy in India with the launch of Eglucent, a new brand of Lilly’s rapid-acting insulin analog Lispro. Lupin will market and sell Eglucent through its own specialty field force while Lilly will be responsible for manufacturing and import. Lilly will continue to sell Lispro under the brand name Humalog through its existing channels. Stride Shasun acquires Perrigo API India Stride Shasun acquires Perrigo API India private Limited (Perrigo API) for | 100 crore. The transaction is expected to close by end of 2016. Perrigo API has UAFDA approved API facility at Ambernath, Maharastra. Perrigo API’s FY16 revenues was | 73.8 crore and gross block was | 287.4 crore. Sun Pharma, Moebius Medical tie-up to develop pain product Sun Pharma and Israel-based Moebius Medical have entered into an exclusive worldwide licensing deal to develop novel liposomal non-opiod pain product MM-II for the treatment of pain in osteoarthritis. Sun Pharma to fund further development of MM-II including completion of Phase II and Phase III clinical programs and any required preclinical work necessary for regulatory approval. Moebius Medical will receive upfront, milestone and royalty payment from Sun Pharma. Cipla to set up manufacturing facility for pharmaceuticals in Iran Cipla, through its Netherlands-based subsidiary entered into an agreement with Ahran Tejarat Company to form a joint venture in Iran. As per the agreement, Cipla will hold 75% stake in the JV, while the Iranian partner will own the remaining. Cipla will invest ~Euro 16.9 million (~| 120 crore) in the JV. JV will set up a manufacturing facility for pharmaceutical products in Iran. Price cuts / New Launches / Recalls/Approvals Dr Reddy’s Labs recalls isotretinoin capsules from US Dr Reddy’s Labs has recalled 3,858 prescription packs (115,680 capsules) of Zenatane (isotretinoin capsules USP) 20 mg, 30 capsules due to an out of specification results has been determined for an individual related substance during stability testing. As per the report, all the recalls are fall under a class III recall category. Cadila recalls 20500 bottles of anti- depressant drug in the US Cadila is recalling 20500 bottles of anti- depressant Bupropion Hydrochloride extended release tablets for failed dissolution specifications. This recalls is considered under class III recall category. Glenmark launched gZedia under exclusivity in the US Glanmark Pharma has launched generic version of cholesterol lowering drug Zetia (ezetimibe) under 180 days exclusivity through its partner par Pharma. As per IMS, Zetia has annual sales of US$ 2.3 million in the US. Law suits / Court rulings / Settlements / Regulatory Issues
Sun pharma’s Halol unit receives nine USFDA observations Sun Pharma’s Halol facility receives nine form 483 observations post USFDA re-inspected the plant from November 17, 2016 through December 1, 2016. As per management, none of these observations were repeat observations. The company is preparing its responses to the observations, which will be submitted to USFDA within 15 business days of receipt of the Form-483.

ICICI Securities Ltd. | Retail Equity Research
Page 4
Divi’s Visakhapatnam unit receives five USFDA observations Divis Lab’s Unit-II at Visakhapatnam has received form 483 with five observations post USFDA inspected this plant between November 29, 2016 to December 06, 2016. The company will respond to the USFDA within the time permitted. As per management, the observations are routine and would not impact the company’s operational performance. Sun’s Mohali plant receives seven form 483 observations from USFDA The USFDA inspected Sun Pharma’s Mohali plant between 7 November and 16 November and issued the seven Form 483 observations, citing four deviations from norms in the laboratory system, two in the quality system and one in the production system. This plant is already under USFDA import alert since Sept 2013. Vietnam bans 39 Indian Drug cos for violation of quality standard Aurobindo, cadila are among 39 Indian drug companies that have been blacklisted by Vietnam for quality standard violations. Vietnamese drug regulator has also banned companies in Bangladesh and South Korea. As per Aurobindo, Vietnam annual sales was ~US$ 1 million. However, as per Aurobindo Pharma’s management, the company is not been blacklisted and continues to export to Vietnam. Vietnam regulatory authority has introduced additional step of analysis on importing medicines in vietnam before release of batches. Aurobindo’s annual Vietnam sales is ~US$1 million. 27 medicines sold by top firms fail quality tests in seven states Indian drug regulators of seven states have alleged that 27 medicines sold by 18 major drug companies in India including Abbott India, GSK India, Sun Pharma, Cipla and Glenmark Pharma are of substandard quality, citing grounds such as false labelling, wrong quantity of ingredients, discolouration, moisture formation, failing dissolution test and failing disintegration test. Some of the key brands which were alleged to be substandard are, antipsychotic drug Stemetil and antibiotic drug Pentids from Abbott India, anti-bacterial medicine Althrocin by Alembic Pharma, migraine medication Vasograin by Cadila Pharma, popular cough syrup Ascoril by Glenmark Pharma, worm infection drug Zentel by GSK India, arthritis medication Hydroxychloroquine (HCQS) by Ipca Labs, anti-inflammatory medication Myoril by Sanofi Synthelabo, and Torrent Pharma’s hypertension drug Dilzem. Delhi High Court quashes government ban on over 300 medicines The Delhi High Court has set aside government’s decision to ban 344 fixed dose combination (FDC) medicines. The government had imposed ban on these medicines in a March 10 notification affected around 6,000 medicine brands, including several popular ones like Corex, Phensedyl, Saridon and Vicks Action 500 Extra. The court however had stayed the ban in March. Allergan settles Delzicol patent litigation with Cadila Cadila Healthcare has settled a litigation with US based Allergan regarding latter’s Ulcerative Colitis drug Delzicol. As per the settlement, Cadila will be able to market the generic version (subject to USFDA approval) on 1st March 2020 or earlier under certain circumstances. US antitrust subpoenas companies over generic drug pricing Sun and Taro Pharma including few more foreign Pharma companies received subpoenas from US Department of Justice (DOJ) in connection with a federal antitrust investigation into generic drug pricing. The US DOJ already accused two former generic pharmaceutical executives colluding with other generic manufacturers to fix prices.

ICICI Securities Ltd. | Retail Equity Research
Page 5
U.S. states sue Aurobindo and others for fixing drug prices 20 states filed a lawsuit against Mylan, Teva Pharma, Aurobindo Pharma and three other generic drug makers, saying they conspired over steak dinners and "girls nights out" on pricing of two common generic drugs. According to the complaint, Heritage, Teva, Aurobindo and Citron conspired to raise prices on glyburide; Heritage, Mylan and Mayne conspired to allocate and divide the market for doxycycline. Others
Taro Announces New $250 Million Share Repurchase Authorization Sun Pharma’s subsidiary Taro Pharma announced that its Board of Directors has approved a new US$250 million share repurchase authorization of its ordinary shares. This authorization follows the successful completion of the previous $250 million share repurchase program in August 2016. Fire broke out at Syngene’s campus Fire broke out at Syngene’s one of research facility at BIocon Park in Bangalore on 12th December 2016. There was no injury or loss of life due to this incident. As per the management, this research facility, including office and lab spaces, makes up ~10% of Syngene’s total infrastructure at Biocon Park. The company further added that all its other facilities within the same campus were unaffected due to this incident and continues to operate normally. Flash fire incident occurred at Aurobindo Pharma’s Vizag unit Flash fire incident occurred on 12th December 2016, in Aurobindo’s API Unit at Srikakulam near Vizag, Andhra Pradesh in which two people died and one critically injured. As per management, there is no material impact on the operational of the company due to this incident. The US Congress passes 21st Century Cures Act The US congress has passed the 21st Century Cures Act, which could ignite innovation and bring drugs and medical devices more quickly to market. The legislation, dubbed 21st Century Cures, provides nearly US$5 billion for the National Institutes of Health to accelerate research into major diseases, including US$1.8 billion project on cancer, and US$500 million for the FDA to make its approval process more efficient.

ICICI Securities Ltd. | Retail Equity Research
Page 6
Exhibit 2: Patent litigations (12 months) [5
Month Innovator ANDA Filer Brand Name API Used for Dec-15 UCB Inc. InvaGen Pharma Zyrtec-D Cetirizine RespiratoryDec-15 Unimed Pharma Dr. Reddy's Labs Androgel Testosterone Low TestosteroneDec-15 Helsinn Healthcare Dr. Reddy's Labs Aloxi Palanosetron NauseaDec-15 Sanofi-Aventis Glenmark Pharma Multaq Dronedarone Atrial FibrillationDec-15 Otsuka Pharma Ajanta Pharma Abilify Aripiprazole SchizophreniaDec-15 Merz Pharma Taro Pharma Naftin Naftifine Hydrochloride Fungal InfectionJan-16 Dow Pharma Taro Pharma Onexton Cindamycin Phosphate and Benzoyl Peroxide AcneJan-16 Cubist Pharma Dr. Reddy's Labs Cubicin Daptomycin AntibioticFeb-16 Bayer Pharma InvaGen Pharma Xarelto Rivaroxaban Blood ThinnerFeb-16 Bristol Myers Squibb Cipla Reyataz Atazanavir HIVFeb-16 Janssen Products LP Lupin Prezista Darunavir HIVMar-16 Shire Canada Lupin Daliresp Roflumilast RespiratoryMar-16 Daiichi Sankyo Torrent Pharma Benicar Olmesartan Anti-depressantApr-16 Daiichi Sankyo Alembic Pharma Benicar Olmesartan Anti-depressantMay-16 Daiichi Sankyo Aurobindo Pharma Benicar Olmesartan Anti-depressantJun-16 Apicore Aurobindo Pharma Lymphazurin isosulfan blue lymphatic imaging agentJun-16 UCB, Inc. Aurobindo Pharma Vimpat lacosamide partial-onset seizuresJun-16 Gilead Aurobindo Pharma Emtriva emtricitabine HIVJun-16 Janssen Biotech Glenmark Pharma Zytiga abiraterone OncologyJun-16 Sanofi-Aventis Cadila Healthcare Mozobil plerixafor non-Hodgkin's lymphomaJul-16 Sanofi-Aventis Cadila Healthcare Mozobil plerixafor non-Hodgkin's lymphomaJul-16 Roche Cadila Aloxi palonosetron hydrochloride prevention of acute nausea Jul-16 AstraZeneca AB Aurobindo Nexium 24HR esomeprazole magnesium treatment of acid refluxJul-16 Hyperion Therapeutics Lupin Ravicti Glycerol Phenylbutyrate urea cycle disordersJul-16 Gilead Sciences, Inc. Aurobindo Truvada emtricitabine / tenofovir disoproxil fumarate HIVAug-16 Lupin InvaGen Pharma Antara fenofibrate hypercholesterolemiaAug-16 Gilead Sciences Inc Hetero Complera Emtricitabine; Rilpivirine Hydrochloride; TenofoHIVAug-16 Shire LLC Alkem Lab Fosrenol lanthanum carbonate end stage renal diseaseAug-16 AbbVie Inc. Amgen Inc. Humira adalimumab immunosuppressantAug-16 Galderma Laboratories, LP SEEGPharm Metrogel metronidazole rosacea Aug-16 Reckitt Benckiser Inc. Sun Pharma Mucinex guaifenesin / pseudoephedrine hydrochloride bronchial congestionAug-16 Takeda Pharma Dexcel Pharma Prevacid lansoprazole stomach ulcersAug-16 Dexcel Aurobindo Prilosec Omeprazole HeartburnAug-16 Shionogi Inc Hi-Tech Pharmacal Ulesfia benzyl alcohol anti-parasiteAug-16 Nestle Skin Health Perrigo Co. Mirvaso brimonidine DermatologySep-16 Pfizer Aurobindo Toviaz fesoterodine fumarate overactive bladderSep-16 Arena Pharma Lupin Belviq lorcaserin weight lossSep-16 Brigham and Women's Hospital InSun Pharma Sensipar cinacalcet hydrochloride hyper parathyroidismSep-16 Brigham and Women's Hospital InStrides Inc. Sensipar cinacalcet hydrochloride hyper parathyroidismSep-16 Brigham and Women's Hospital InCipla Sensipar cinacalcet hydrochloride hyper parathyroidismSep-16 Eli Lilly and Co., ICOS Corp. Cipla Cialis tadalafil erectile dysfunctionSep-16 Brigham and Women's Hospital InAurobindo Sensipar cinacalcet hydrochloride hyper parathyroidismSep-16 Eli Lilly and Co., ICOS Corp. Alembic Pharma Cialis tadalafil erectile dysfunctionOct-16 Amgen Inc. Ajanta Pharma Sensipar cinacalcet calcium reducerOct-16 Amgen Inc. Dr Reddy's Lab Sensipar cinacalcet calcium reducerOct-16 UCB, Inc. Cadila Healthcare Vimpat lacosamide partial-onset seizuresOct-16 Astellas Pharma Lupin Myrbetriq mirabegron overactive bladderOct-16 Astellas Pharma Cadila Healthcare Myrbetriq mirabegron overactive bladderOct-16 Astellas Pharma Aurobindo Pharma Myrbetriq mirabegron overactive bladderOct-16 AstraZeneca AB Glenmark Pharma Nexium 24HR esomeprazole magnesium treatment of acid refluxOct-16 Celgene Corp. Dr Reddy's Lab Revlimid lenalidomide multiple myelomaOct-16 Otsuka Pharma Zydus Pharma Abilify Aripiprazole SchizophreniaOct-16 Onyx Therapeutics Cipla Kyprolis carfilzomib multiple myelomaOct-16 Eli Lilly Cipla Axiron Hypogonadism TestosteroneOct-16 Galderma Lab Sun Pharma Oracea doxycycline infectionsOct-16 Eli Lilly Cipla Axiron Hypogonadism TestosteroneOct-16 Indoco Remedies Zydus Pharma Abilify Aripiprazole SchizophreniaOct-16 Eli Lilly Cipla Axiron Hypogonadism TestosteroneNov-16 Onyx Therapeutics Dr Reddy's Lab Kyprolis carfilzomib multiple myelomaNov-16 Onyx Therapeutics Cadila Kyprolis carfilzomib multiple myelomaNov-16 Indoco Remedies Zydus Pharma Abilify Aripiprazole SchizophreniaNov-16 UCB Inc Cadila Neupro rotigotine ParkinsonNov-16 Amarin Pharma Dr Reddy's Lab Vascepa icosapent ethy hypertri- glyceridemiaNov-16 Medicis Pharma Dr Reddy's Lab Solodyn minocycline infections
Source: Bloomberg, ICICIdirect.com Research
ICICI Securities Ltd. | Retail Equity Research
Page 7
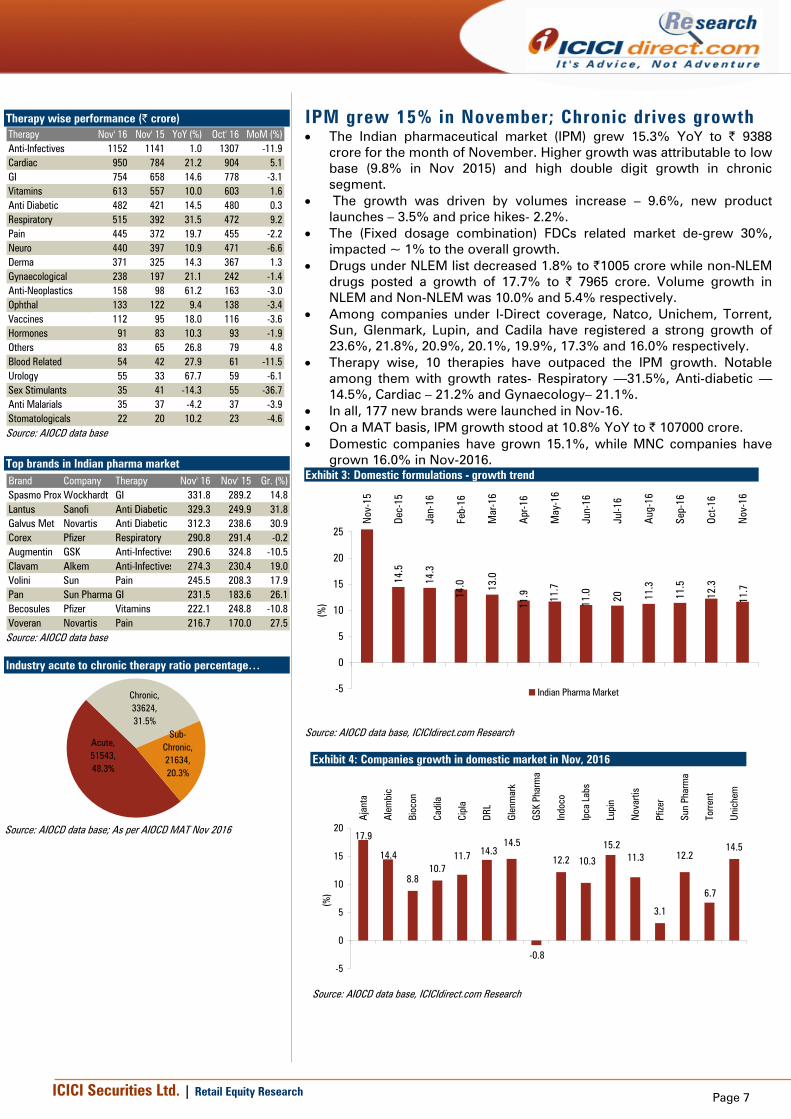
IPM grew 15% in November; Chronic drives growth • The Indian pharmaceutical market (IPM) grew 15.3% YoY to | 9388
crore for the month of November. Higher growth was attributable to low base (9.8% in Nov 2015) and high double digit growth in chronic segment.
• The growth was driven by volumes increase – 9.6%, new product launches – 3.5% and price hikes- 2.2%.
• The (Fixed dosage combination) FDCs related market de-grew 30%, impacted ~ 1% to the overall growth.
• Drugs under NLEM list decreased 1.8% to |1005 crore while non-NLEM drugs posted a growth of 17.7% to | 7965 crore. Volume growth in NLEM and Non-NLEM was 10.0% and 5.4% respectively.
• Among companies under I-Direct coverage, Natco, Unichem, Torrent, Sun, Glenmark, Lupin, and Cadila have registered a strong growth of 23.6%, 21.8%, 20.9%, 20.1%, 19.9%, 17.3% and 16.0% respectively.
• Therapy wise, 10 therapies have outpaced the IPM growth. Notable among them with growth rates- Respiratory —31.5%, Anti-diabetic —14.5%, Cardiac – 21.2% and Gynaecology– 21.1%.
• In all, 177 new brands were launched in Nov-16. • On a MAT basis, IPM growth stood at 10.8% YoY to | 107000 crore. • Domestic companies have grown 15.1%, while MNC companies have
grown 16.0% in Nov-2016. Exhibit 3: Domestic formulations - growth trend [
14.5
14.3
13.0
11.5
14.0
11.9 11
.7
11.0 20 11
.3
12.3
11.7
-5
0
5
10
15
20
25
Nov
-15
Dec-
15
Jan-
16
Feb-
16
Mar
-16
Apr
-16
May
-16
Jun-
16
Jul-1
6
Aug
-16
Sep-
16
Oct-1
6
Nov
-16
(%)
Indian Pharma Market
Source: AIOCD data base, ICICIdirect.com Research
Exhibit 4: Companies growth in domestic market in Nov, 2016
8.810.7
12.2
3.1
14.517.9
14.4 11.7 14.314.5
-0.8
10.3
15.211.3 12.2
6.7
-5
0
5
10
15
20
Aja
nta
Ale
mbi
c
Bioc
on
Cadi
la
Cipl
a
DRL
Glen
mar
k
GSK
Phar
ma
Indo
co
Ipca
Lab
s
Lupi
n
Nov
artis
Pfize
r
Sun
Phar
ma
Torre
nt
Unic
hem
(%)
Source: AIOCD data base, ICICIdirect.com Research
Therapy wise performance (| crore) Therapy Nov' 16 Nov' 15 YoY (%) Oct' 16 MoM (%)Anti-Infectives 1152 1141 1.0 1307 -11.9Cardiac 950 784 21.2 904 5.1GI 754 658 14.6 778 -3.1Vitamins 613 557 10.0 603 1.6Anti Diabetic 482 421 14.5 480 0.3Respiratory 515 392 31.5 472 9.2Pain 445 372 19.7 455 -2.2Neuro 440 397 10.9 471 -6.6Derma 371 325 14.3 367 1.3Gynaecological 238 197 21.1 242 -1.4Anti-Neoplastics 158 98 61.2 163 -3.0Ophthal 133 122 9.4 138 -3.4Vaccines 112 95 18.0 116 -3.6Hormones 91 83 10.3 93 -1.9Others 83 65 26.8 79 4.8Blood Related 54 42 27.9 61 -11.5Urology 55 33 67.7 59 -6.1Sex Stimulants 35 41 -14.3 55 -36.7Anti Malarials 35 37 -4.2 37 -3.9Stomatologicals 22 20 10.2 23 -4.6 Source: AIOCD data base
Top brands in Indian pharma market Brand Company Therapy Nov' 16 Nov' 15 Gr. (%)Spasmo Prox Wockhardt GI 331.8 289.2 14.8Lantus Sanofi Anti Diabetic 329.3 249.9 31.8Galvus Met Novartis Anti Diabetic 312.3 238.6 30.9Corex Pfizer Respiratory 290.8 291.4 -0.2Augmentin GSK Anti-Infectives 290.6 324.8 -10.5Clavam Alkem Anti-Infectives 274.3 230.4 19.0Volini Sun Pain 245.5 208.3 17.9Pan Sun Pharma GI 231.5 183.6 26.1Becosules Pfizer Vitamins 222.1 248.8 -10.8Voveran Novartis Pain 216.7 170.0 27.5
Source: AIOCD data base Industry acute to chronic therapy ratio percentage…
Acute, 51543, 48.3%
Chronic, 33624, 31.5%
Sub-Chronic, 21634, 20.3%
Source: AIOCD data base; As per AIOCD MAT Nov 2016

ICICI Securities Ltd. | Retail Equity Research
Page 8
Impact of Demonetization AIOCD has done a Daily Data Survey for 350 plus leading stockists across the country, representing 2.1% of the IPM sales to understand the impact of Demonetization on Secondary Sales. Following are the key observations of the Survey • Total sales remain sluggish compared to same period of Oct 2016. • Acute therapy has been largely impacted • Chronic therapy has been the biggest beneficiary – which clearly shows
some chronic patients have used old notes to pre-pone their medicine supply for 2-3 months
• Week 1 and 2 of demonetization has shown significantly higher sales than corresponding period in Oct as well as much higher than the Diwali week trough of 14.1 Cr.
Exhibit 5: Demonetization impact
[
47.451.5 51.9
46
56
48.5 47.9
22.6 25.2 26.722.7
27.121.7 21.6
15.2 15.9 15.6 14.118.1 17.5 16.8
9.6 10.4 9.7 9.2 10.8 9.4 9.5
0
10
20
30
40
50
60
11th Oct 18th Oct 25th Oct 1st Nov 8th Nov 15th Nov 22nd Nov
| cr
ore
Sales Acute Chronic Sub-Chronic
Source: AIOCD data base, ICICIdirect.com Research

ICICI Securities Ltd. | Retail Equity Research
Page 9
Sun Pharmaceuticals
507090
110130150
Dec-15 Feb-16 Apr-16 Jun-16 Aug-16 Oct-16 Dec-16
CNX Pharma Sun Pharma
Source: NSE, ICICIdirect.com Research Exhibit 6: Company growth vis-à-vis Indian pharma market growth
31.4
14.5
14.3
14.0
13.0
11.9
11.7
11.0
10.9
11.3
11.5
12.3
11.7
14.4
14.1
14.8
14.5
13.2
12.2
10.4
9.6
10.4
10.8 12.024
.8
12.2
0
5
10
15
20
25
30
35
Nov
-15
Dec-
15
Jan-
16
Feb-
16
Mar
-16
Apr-1
6
May
-16
Jun-
16
Jul-1
6
Aug-
16
Sep-
16
Oct-1
6
Nov
-16
(%)
Indian Pharma Market Sun Pharma
Source: AIOCD data base, ICICIdirect.com Research
Exhibit 7: Market share in Indian formulations market
8.6 8.6 8.6 8.6 8.6 8.6 8.6 8.6 8.6 8.78.6 8.6 8.7
6.06.57.07.58.08.59.09.5
10.0
Nov
-15
Dec-
15
Jan-
16
Feb-
16
Mar
-16
Apr-1
6
May
-16
Jun-
16
Jul-1
6
Aug
-16
Sep-
16
Oct-1
6
Nov
-16
(%)
Sun Pharma
Source: AIOCD data base, ICICIdirect.com Research
Exhibit 8: Top 10 brands performance (| crore) Brand Therapy Nov' 16 Nov' 15 Var. (%) Oct' 16 Var. (%)
Volini Pain 21.6 21.3 1.4 22.8 -5.1
Rosuvas Cardiac 18.5 12.9 43.7 17.1 8.0
Istamet Anti Diabetic 19.0 12.2 56.0 17.1 10.7
Gemer Anti Diabetic 18.6 12.7 46.3 17.0 8.9
Levipil Neuro 15.6 12.3 26.6 14.5 7.4
Susten Gynaecological 12.4 11.3 9.7 12.1 2.6
Revital H Vitamins 13.9 9.2 51.3 12.4 11.9
Pantocid Gastro Intestinal 12.9 11.1 15.7 9.7 32.4
Pantocid Dsr Gastro Intestinal 11.3 9.4 19.5 11.0 1.9
Storvas Cardiac 9.3 9.4 -1.1 8.5 9.5
Source: AIOCD data base, ICICIdirect.com Research
Exhibit 9: Contribution of therapies to domestic sales (MAT Nov’16)
z
Cardiac29%
Neuro 27%
Gastro Intestinal
19%
Anti-Infectives17%
Derma8%
Source: AIOCD data base, ICICIdirect.com Research
Exhibit 10: Therapy wise performance (| crore)
Therapy Nov' 16 Nov' 15 YoY (%) Oct' 16 MoM (%)
Cardiac 163.4 124.1 31.7 151.4 7.9
Neuro 145.7 121.1 20.3 145.0 0.4
Gastro Intestinal 94.9 80.5 18.0 92.3 2.8
Anti-Infectives 82.6 86.0 -3.9 88.4 -6.5
Derma 45.2 32.0 41.1 76.5 -40.9
Anti Diabetic 82.2 62.3 31.8 61.7 33.2
Vitamins 33.9 26.3 28.9 42.4 -20.1
Pain 59.3 53.5 10.8 33.3 77.8
Gynaecological 29.3 27.6 5.9 35.2 -16.8
Respiratory 36.5 29.0 25.6 27.7 31.8
Source: AIOCD data base, ICICIdirect.com Research
Acute : Chronic contribution (| cr; MAT Nov’16)
Acute, 3737, 40.3%
Chronic, 4270, 46.0%
Sub-Chronic,
1273, 13.7%
Source: AIOCD data base
Brands contribution to domestic sales (MAT Nov’16)
18%
9%
7%
10%
56%
Top 10 11 to 20 21 to 30 31 to 50 Others
ICICI Securities Ltd. | Retail Equity Research
Page 10
Cipla
Stock Performance
6080
100120140
Dec-15 Feb-16 Apr-16 Jun-16 Aug-16 Oct-16 Dec-16
CNX Pharma Cipla
Source: NSE, ICICIdirect.com Research
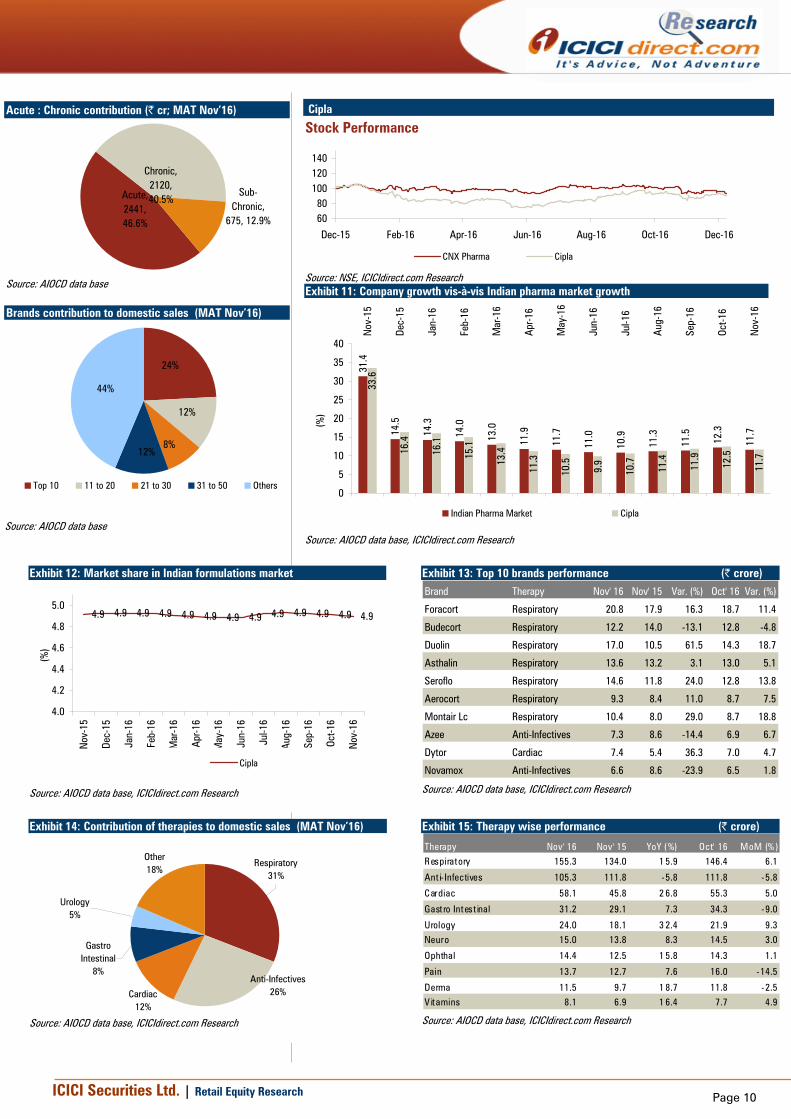
Exhibit 11: Company growth vis-à-vis Indian pharma market growth
31.4
14.5
14.3
14.0
13.0
11.9
11.7
11.0
10.9
11.3
11.5
12.3
11.7
33.6
16.4
16.1
15.1
13.4
11.3
10.5
9.9
10.7
11.4
11.9
12.5
11.7
0
5
10
15
20
25
30
35
40
Nov
-15
Dec-
15
Jan-
16
Feb-
16
Mar
-16
Apr-1
6
May
-16
Jun-
16
Jul-1
6
Aug-
16
Sep-
16
Oct-1
6
Nov
-16
(%)
Indian Pharma Market Cipla
Source: AIOCD data base, ICICIdirect.com Research
Exhibit 12: Market share in Indian formulations market
4.9 4.9 4.9 4.9 4.9 4.9 4.9 4.9 4.9 4.9 4.9 4.9 4.9
4.0
4.2
4.4
4.6
4.8
5.0
Nov
-15
Dec-
15
Jan-
16
Feb-
16
Mar
-16
Apr-1
6
May
-16
Jun-
16
Jul-1
6
Aug-
16
Sep-
16
Oct-1
6
Nov
-16
(%)
Cipla
Source: AIOCD data base, ICICIdirect.com Research
Exhibit 13: Top 10 brands performance (| crore) Brand Therapy Nov' 16 Nov' 15 Var. (%) Oct' 16 Var. (%)
Foracort Respiratory 20.8 17.9 16.3 18.7 11.4
Budecort Respiratory 12.2 14.0 -13.1 12.8 -4.8
Duolin Respiratory 17.0 10.5 61.5 14.3 18.7
Asthalin Respiratory 13.6 13.2 3.1 13.0 5.1
Seroflo Respiratory 14.6 11.8 24.0 12.8 13.8
Aerocort Respiratory 9.3 8.4 11.0 8.7 7.5
Montair Lc Respiratory 10.4 8.0 29.0 8.7 18.8
Azee Anti-Infectives 7.3 8.6 -14.4 6.9 6.7
Dytor Cardiac 7.4 5.4 36.3 7.0 4.7
Novamox Anti-Infectives 6.6 8.6 -23.9 6.5 1.8
Source: AIOCD data base, ICICIdirect.com Research
Exhibit 14: Contribution of therapies to domestic sales (MAT Nov’16)
Respiratory31%
Anti-Infectives26%Cardiac
12%
Gastro Intestinal
8%
Urology5%
Other18%
Source: AIOCD data base, ICICIdirect.com Research
Exhibit 15: Therapy wise performance (| crore)
Therapy Nov' 16 Nov' 15 YoY (%) Oct' 16 MoM (% )
Respiratory 155.3 134.0 1 5.9 146.4 6.1
Ant i- Infectives 105.3 111.8 -5.8 111.8 -5.8
Cardiac 58.1 45.8 2 6.8 55.3 5.0
Gastro Intest inal 31.2 29.1 7.3 34.3 -9.0
Urology 24.0 18.1 3 2.4 21.9 9.3
Neuro 15.0 13.8 8.3 14.5 3.0
Ophthal 14.4 12.5 1 5.8 14.3 1.1
Pain 13.7 12.7 7.6 16.0 -14.5
Derma 11.5 9.7 1 8.7 11.8 -2.5
V itamins 8.1 6.9 1 6.4 7.7 4.9
Source: AIOCD data base, ICICIdirect.com Research
Acute : Chronic contribution (| cr; MAT Nov’16)
Acute, 2441, 46.6%
Chronic, 2120, 40.5%
Sub-Chronic,
675, 12.9%
Source: AIOCD data base
Brands contribution to domestic sales (MAT Nov’16)
24%
12%
8%12%
44%
Top 10 11 to 20 21 to 30 31 to 50 Others
Source: AIOCD data base

ICICI Securities Ltd. | Retail Equity Research
Page 11
Dr. Reddy’s Labs
Stock Performance) Stock Performance
6080
100120140
Dec-15 Feb-16 Apr-16 Jun-16 Aug-16 Oct-16 Dec-16
CNX Pharma Dr. Reddys
Source: NSE, ICICIdirect.com Research Exhibit 16: Company growth vis-à-vis Indian pharma market growth
31.4
14.5
14.3
14.0
13.0
11.9
11.7
11.0
10.9
11.3
11.5
12.3
11.7
33.7
19.4 20.7 22.0
20.5
18.2
17.2
14.3
15.3
14.1
14.3
15.7
16.4
0
5
10
15
20
25
30
35
40
Nov
-15
Dec-
15
Jan-
16
Feb-
16
Mar
-16
Apr-1
6
May
-16
Jun-
16
Jul-1
6
Aug-
16
Sep-
16
Oct-1
6
Nov
-16
(%)
Indian Pharma Market Dr. Reddys Lab
Source: AIOCD data base, ICICIdirect.com Research
Exhibit 17: Market share in Indian formulations market
2.3 2.3 2.4 2.4 2.4 2.4 2.4 2.4 2.3 2.3 2.4 2.42.3
0.6
1.1
1.6
2.1
2.6
Nov
-15
Dec-
15
Jan-
16
Feb-
16
Mar
-16
Apr-1
6
May
-16
Jun-
16
Jul-1
6
Aug-
16
Sep-
16
Oct-1
6
Nov
-16
(%)
Dr. Reddys Lab
Source: AIOCD data base, ICICIdirect.com Research
Exhibit 18: Top 10 brands performance (| crore) Brand Therapy Nov' 16 Nov' 15 Var. (%) Oct' 16 Var. (%)
Omez Gastro Intestinal 8.9 11.4 -22.5 9.0 -1.5
Omez D Gastro Intestinal 9.3 9.1 2.2 9.5 -2.1
Econorm Gastro Intestinal 4.3 4.7 -8.1 3.4 27.2
Nise Pain 5.1 5.8 -11.9 5.2 -1.9
Stamlo Cardiac 5.4 5.7 -5.3 4.6 17.0
Grafeel Anti-Neoplastics 1.9 8.3 -76.9 4.1 -52.9
Razo D Gastro Intestinal 5.1 4.3 17.7 4.7 9.2
Atarax Respiratory 5.5 3.9 38.5 6.2 -11.2
Razo Gastro Intestinal 5.1 3.6 39.5 4.7 7.9
Reditux Anti-Neoplastics 5.1 3.9 30.6 6.7 -22.9
Source: AIOCD data base, ICICIdirect.com Research
Exhibit 19: Contribution of therapies to domestic sales (MAT Nov’16)
Gastro Intestinal
21%
Cardiac14%
Anti-Neoplastics
13%Respiratory9%
Anti-Infectives8%
Other35%
Source: AIOCD data base, ICICIdirect.com Research
Exhibit 20: Therapy wise performance (| crore)
Therapy Nov' 16 Nov' 15 YoY (%) Oct' 16 MoM (%)
Gastro Intestinal 42.5 41.9 1.4 41.6 2.0
Cardiac 29.9 28.6 4.4 27.2 10.1
Anti-Neoplastics 30.6 25.0 22.5 36.3 -15.7
Respiratory 21.3 19.2 10.8 21.1 1.0
Anti-Infectives 15.9 17.8 -10.7 18.2 -12.9
Pain 13.7 13.7 0.2 14.1 -2.4
Anti Diabetic 14.6 13.3 9.5 13.0 12.4
Derma 13.2 13.9 -4.7 11.2 17.9
Urology 8.3 8.1 2.8 7.7 7.3
Neuro 7.4 7.1 4.6 7.1 4.1
Source: AIOCD data base, ICICIdirect.com Research
Acute : Chronic contribution (| cr; MAT Nov’16)
Acute, 1268, 50.8%
Chronic, 711, 28.5%
Sub-Chronic,
518, 20.7%
Source: AIOCD data base
Brands contribution to domestic sales (MAT Nov’16)
28%
16%
10%
13%
33%
Top 10 11 to 20 21 to 30 31 to 50 Others
Source: AIOCD data base
ICICI Securities Ltd. | Retail Equity Research
Page 12
Lupin
Stock Performance
6080
100120140
Dec-15 Feb-16 Apr-16 Jun-16 Aug-16 Oct-16 Dec-16
CNX Pharma Lupin
Source: NSE, ICICIdirect.com Research
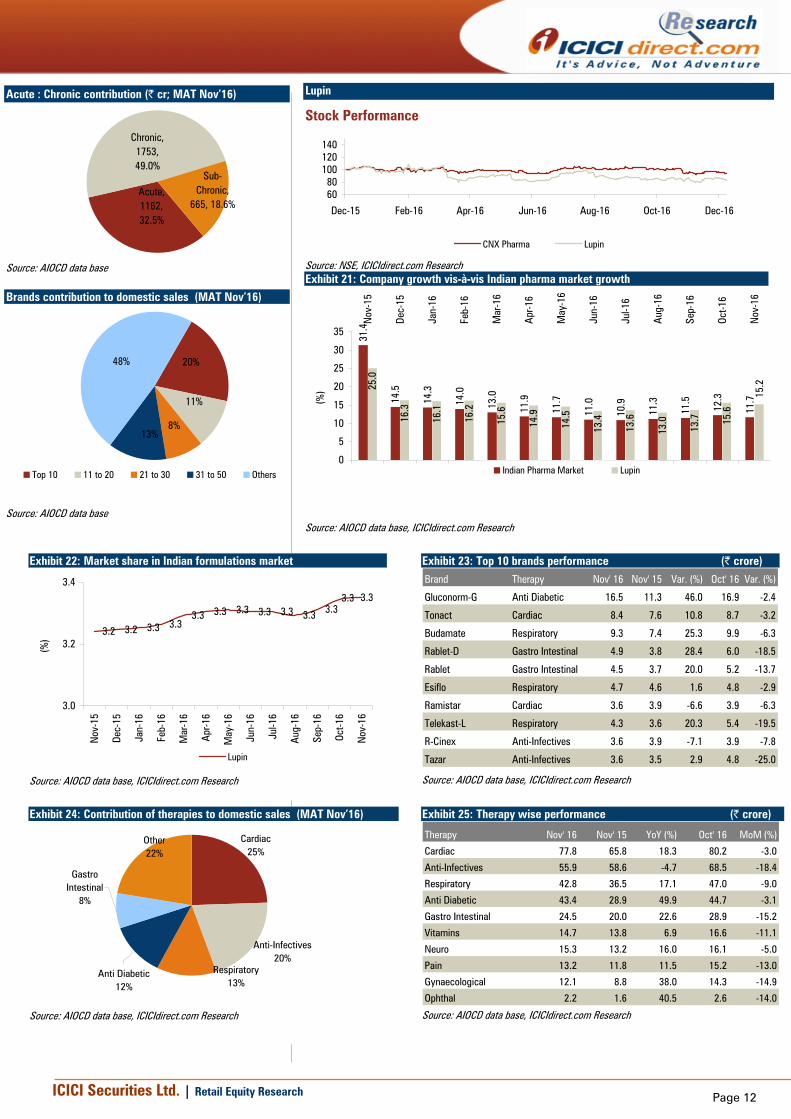
Exhibit 21: Company growth vis-à-vis Indian pharma market growth
31.4
14.5
14.3
14.0
13.0
11.9
11.7
11.0
10.9
11.3
11.5
12.3
11.7
25.0
16.3
16.1
16.2
15.6
14.9
14.5
13.4
13.6
13.0
13.7 15
.6
15.2
0
5
10
15
20
25
30
35
Nov
-15
Dec-
15
Jan-
16
Feb-
16
Mar
-16
Apr
-16
May
-16
Jun-
16
Jul-1
6
Aug
-16
Sep-
16
Oct-1
6
Nov
-16
(%)
Indian Pharma Market Lupin
Source: AIOCD data base, ICICIdirect.com Research
Exhibit 22: Market share in Indian formulations market
3.2 3.2 3.3 3.33.3 3.3 3.3 3.3 3.3 3.3 3.3
3.33.3
3.0
3.2
3.4
Nov
-15
Dec-
15
Jan-
16
Feb-
16
Mar
-16
Apr-1
6
May
-16
Jun-
16
Jul-1
6
Aug-
16
Sep-
16
Oct-1
6
Nov
-16
(%)
Lupin
Source: AIOCD data base, ICICIdirect.com Research
Exhibit 23: Top 10 brands performance (| crore) Brand Therapy Nov' 16 Nov' 15 Var. (%) Oct' 16 Var. (%)
Gluconorm-G Anti Diabetic 16.5 11.3 46.0 16.9 -2.4
Tonact Cardiac 8.4 7.6 10.8 8.7 -3.2
Budamate Respiratory 9.3 7.4 25.3 9.9 -6.3
Rablet-D Gastro Intestinal 4.9 3.8 28.4 6.0 -18.5
Rablet Gastro Intestinal 4.5 3.7 20.0 5.2 -13.7
Esiflo Respiratory 4.7 4.6 1.6 4.8 -2.9
Ramistar Cardiac 3.6 3.9 -6.6 3.9 -6.3
Telekast-L Respiratory 4.3 3.6 20.3 5.4 -19.5
R-Cinex Anti-Infectives 3.6 3.9 -7.1 3.9 -7.8
Tazar Anti-Infectives 3.6 3.5 2.9 4.8 -25.0
Source: AIOCD data base, ICICIdirect.com Research
Exhibit 24: Contribution of therapies to domestic sales (MAT Nov’16)
Cardiac25%
Anti-Infectives20%
Respiratory13%
Anti Diabetic12%
Gastro Intestinal
8%
Other22%
Source: AIOCD data base, ICICIdirect.com Research
Exhibit 25: Therapy wise performance (| crore)
Therapy Nov' 16 Nov' 15 YoY (%) Oct' 16 MoM (%)
Cardiac 77.8 65.8 18.3 80.2 -3.0
Anti-Infectives 55.9 58.6 -4.7 68.5 -18.4
Respiratory 42.8 36.5 17.1 47.0 -9.0
Anti Diabetic 43.4 28.9 49.9 44.7 -3.1
Gastro Intestinal 24.5 20.0 22.6 28.9 -15.2
Vitamins 14.7 13.8 6.9 16.6 -11.1
Neuro 15.3 13.2 16.0 16.1 -5.0
Pain 13.2 11.8 11.5 15.2 -13.0
Gynaecological 12.1 8.8 38.0 14.3 -14.9
Ophthal 2.2 1.6 40.5 2.6 -14.0
Source: AIOCD data base, ICICIdirect.com Research
Acute : Chronic contribution (| cr; MAT Nov’16)
Acute, 1162, 32.5%
Chronic, 1753, 49.0%
Sub-Chronic,
665, 18.6%
Source: AIOCD data base
Brands contribution to domestic sales (MAT Nov’16)
20%
11%
8%13%
48%
Top 10 11 to 20 21 to 30 31 to 50 Others
Source: AIOCD data base
ICICI Securities Ltd. | Retail Equity Research
Page 13
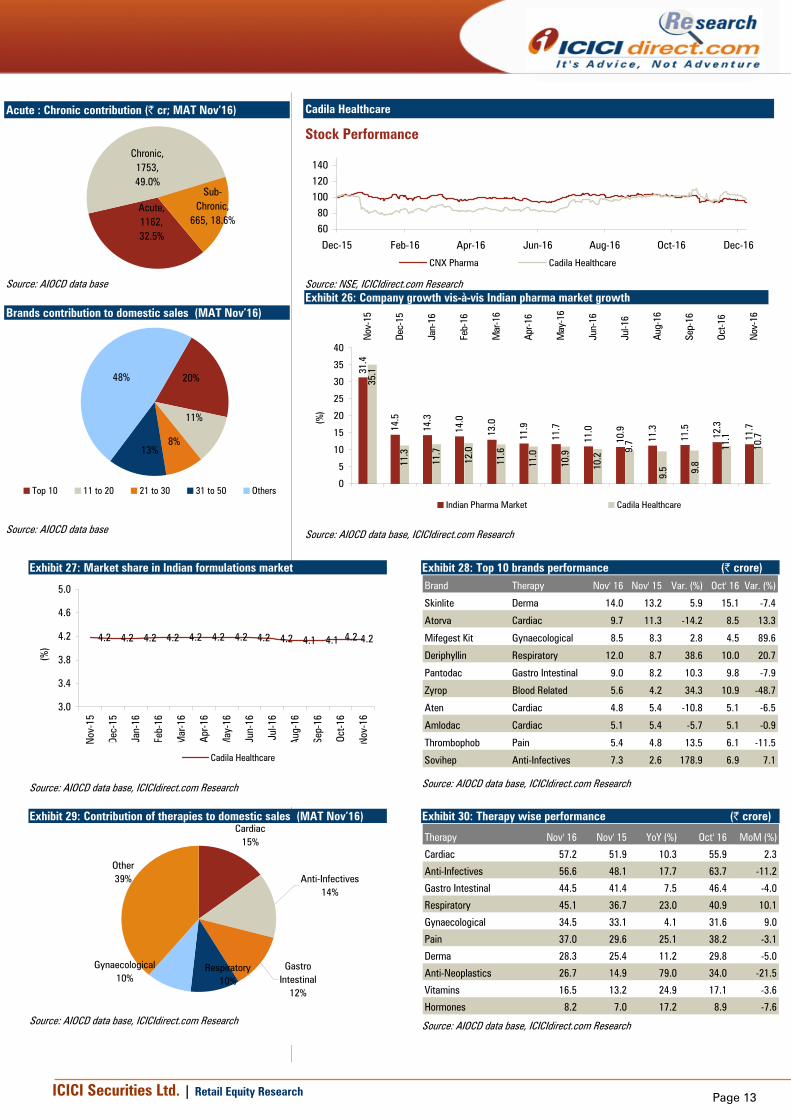
Cadila Healthcare
Stock Performance
6080
100120140
Dec-15 Feb-16 Apr-16 Jun-16 Aug-16 Oct-16 Dec-16
CNX Pharma Cadila Healthcare
Source: NSE, ICICIdirect.com Research Exhibit 26: Company growth vis-à-vis Indian pharma market growth
31.4
14.5
14.3
14.0
13.0
11.9
11.7
11.0
10.9
11.3
11.5
12.3
11.7
35.1
11.3
11.7
12.0
11.6
11.0
10.9
10.2
9.7
9.5 9.
8
11.1
10.7
0
5
10
15
20
25
30
35
40
Nov
-15
Dec-
15
Jan-
16
Feb-
16
Mar
-16
Apr-1
6
May
-16
Jun-
16
Jul-1
6
Aug-
16
Sep-
16
Oct-1
6
Nov
-16
(%)
Indian Pharma Market Cadila Healthcare
Source: AIOCD data base, ICICIdirect.com Research
Exhibit 27: Market share in Indian formulations market
4.2 4.2 4.2 4.2 4.2 4.2 4.2 4.2 4.2 4.1 4.1 4.24.2
3.0
3.4
3.8
4.2
4.6
5.0
Nov
-15
Dec-
15
Jan-
16
Feb-
16
Mar
-16
Apr-1
6
May
-16
Jun-
16
Jul-1
6
Aug-
16
Sep-
16
Oct-1
6
Nov
-16
(%)
Cadila Healthcare
Source: AIOCD data base, ICICIdirect.com Research
Exhibit 28: Top 10 brands performance (| crore) Brand Therapy Nov' 16 Nov' 15 Var. (%) Oct' 16 Var. (%)
Skinlite Derma 14.0 13.2 5.9 15.1 -7.4
Atorva Cardiac 9.7 11.3 -14.2 8.5 13.3
Mifegest Kit Gynaecological 8.5 8.3 2.8 4.5 89.6
Deriphyllin Respiratory 12.0 8.7 38.6 10.0 20.7
Pantodac Gastro Intestinal 9.0 8.2 10.3 9.8 -7.9
Zyrop Blood Related 5.6 4.2 34.3 10.9 -48.7
Aten Cardiac 4.8 5.4 -10.8 5.1 -6.5
Amlodac Cardiac 5.1 5.4 -5.7 5.1 -0.9
Thrombophob Pain 5.4 4.8 13.5 6.1 -11.5
Sovihep Anti-Infectives 7.3 2.6 178.9 6.9 7.1
Source: AIOCD data base, ICICIdirect.com Research
Exhibit 29: Contribution of therapies to domestic sales (MAT Nov’16)
Other39%
Gynaecological10%
Respiratory10%
Gastro Intestinal
12%
Anti-Infectives14%
Cardiac15%
Source: AIOCD data base, ICICIdirect.com Research
Exhibit 30: Therapy wise performance (| crore)
Therapy Nov' 16 Nov' 15 YoY (%) Oct' 16 MoM (%)
Cardiac 57.2 51.9 10.3 55.9 2.3
Anti-Infectives 56.6 48.1 17.7 63.7 -11.2
Gastro Intestinal 44.5 41.4 7.5 46.4 -4.0
Respiratory 45.1 36.7 23.0 40.9 10.1
Gynaecological 34.5 33.1 4.1 31.6 9.0
Pain 37.0 29.6 25.1 38.2 -3.1
Derma 28.3 25.4 11.2 29.8 -5.0
Anti-Neoplastics 26.7 14.9 79.0 34.0 -21.5
Vitamins 16.5 13.2 24.9 17.1 -3.6
Hormones 8.2 7.0 17.2 8.9 -7.6
Source: AIOCD data base, ICICIdirect.com Research
Acute : Chronic contribution (| cr; MAT Nov’16)
Acute, 1162, 32.5%
Chronic, 1753, 49.0%
Sub-Chronic,
665, 18.6%
Source: AIOCD data base
Brands contribution to domestic sales (MAT Nov’16)
20%
11%
8%13%
48%
Top 10 11 to 20 21 to 30 31 to 50 Others
Source: AIOCD data base

ICICI Securities Ltd. | Retail Equity Research
Page 14
GlaxoSmithKline
Stock Performance
6080
100120140
Dec-15 Feb-16 Apr-16 Jun-16 Aug-16 Oct-16 Dec-16
CNX Pharma GSK Pharma
Source: NSE, ICICIdirect.com Research
Exhibit 31: Company growth vis-à-vis Indian pharma market growth
31.4
14.5
14.3
14.0
13.0
11.9
11.7
11.0
10.9
11.3
11.5
12.3
11.7
26.8
5.0
5.4
5.2
3.8
2.1
2.3
1.9
0.92.
2 1.4 1.9
-0.8
-5
0
5
10
15
20
25
30
35
Nov
-15
Dec-
15
Jan-
16
Feb-
16
Mar
-16
Apr-1
6
May
-16
Jun-
16
Jul-1
6
Aug-
16
Sep-
16
Oct-1
6
Nov
-16
(%)
Indian Pharma Market GSK Pharma
Source: AIOCD data base, ICICIdirect.com Research
Exhibit 32: Market share in Indian formulations market
3.5 3.5 3.5 3.4 3.4 3.4 3.3 3.3 3.3 3.2 3.2 3.1 3.1
0.6
1.1
1.6
2.1
2.6
3.1
3.6
Nov
-15
Dec-
15
Jan-
16
Feb-
16
Mar
-16
Apr-1
6
May
-16
Jun-
16
Jul-1
6
Aug-
16
Sep-
16
Oct-1
6
Nov
-16
(%)
GSK Pharma
Source: AIOCD data base, ICICIdirect.com Research
Exhibit 33: Top 10 brands performance (| crore) Brand Therapy Nov' 16 Nov' 15 Var. (%) Oct' 16 Var. (%)
Augmentin Anti-Infectives 25.4 25.4 0.1 25.5 -0.3
Synflorix Vaccines 23.6 15.2 54.7 18.2 29.2
Calpol Pain 16.7 15.6 7.2 21.4 -22.1
Zinetac Gastro Intestinal 15.4 13.4 15.0 14.1 9.3
Betnovate C Derma 14.4 15.1 -4.9 12.5 14.8
Eltroxin Hormones 12.9 10.5 23.7 11.9 8.5
Betnovate N Derma 12.6 14.1 -10.7 10.2 23.7
Ceftum Anti-Infectives 11.0 9.7 13.1 12.0 -8.0
Rotarix Vaccines 9.5 12.1 -21.0 7.4 29.6
Betnesol Hormones 9.1 13.5 -32.6 9.8 -7.6
Source: AIOCD data base, ICICIdirect.com Research
Exhibit 34: Contribution of therapies to domestic sales (MAT Nov’16) Anti-Infectives
22%
Vaccines18%
Derma17%
Pain 10%
Respiratory8%
Other25%
Source: AIOCD data base, ICICIdirect.com Research
Exhibit 35: Therapy wise performance (| crore)
Therapy Nov' 16 Nov' 15 YoY (%) Oct' 16 MoM (%)
Anti-Infectives 61.0 61.0 0.0 64.9 -5.9
Vaccines 50.1 46.9 6.9 47.1 6.4
Derma 47.3 57.0 -17.0 42.5 11.3
Pain 26.2 25.1 4.4 31.5 -16.7
Respiratory 24.0 23.5 2.0 21.9 9.6
Hormones 22.7 24.8 -8.3 22.4 1.5
Vitamins 22.0 19.2 14.3 22.3 -1.3
Gastro Intestinal 17.0 15.1 12.2 15.5 9.8
Cardiac 4.5 5.0 -10.0 4.4 4.0
Gynaecological 2.0 2.7 -24.0 2.1 -2.6
Source: AIOCD data base, ICICIdirect.com Research
Acute : Chronic contribution (| cr; MAT Nov’16)
Acute, 2193, 66.3%
Chronic, 416, 12.6%
Sub-Chronic,
698, 21.1%
Source: AIOCD data base
Brands contribution to domestic sales (MAT Nov’16)
50%
17%
9%
11%
13%
Top 10 11 to 20 21 to 30 31 to 50 Others
Source: AIOCD data base
ICICI Securities Ltd. | Retail Equity Research
Page 15
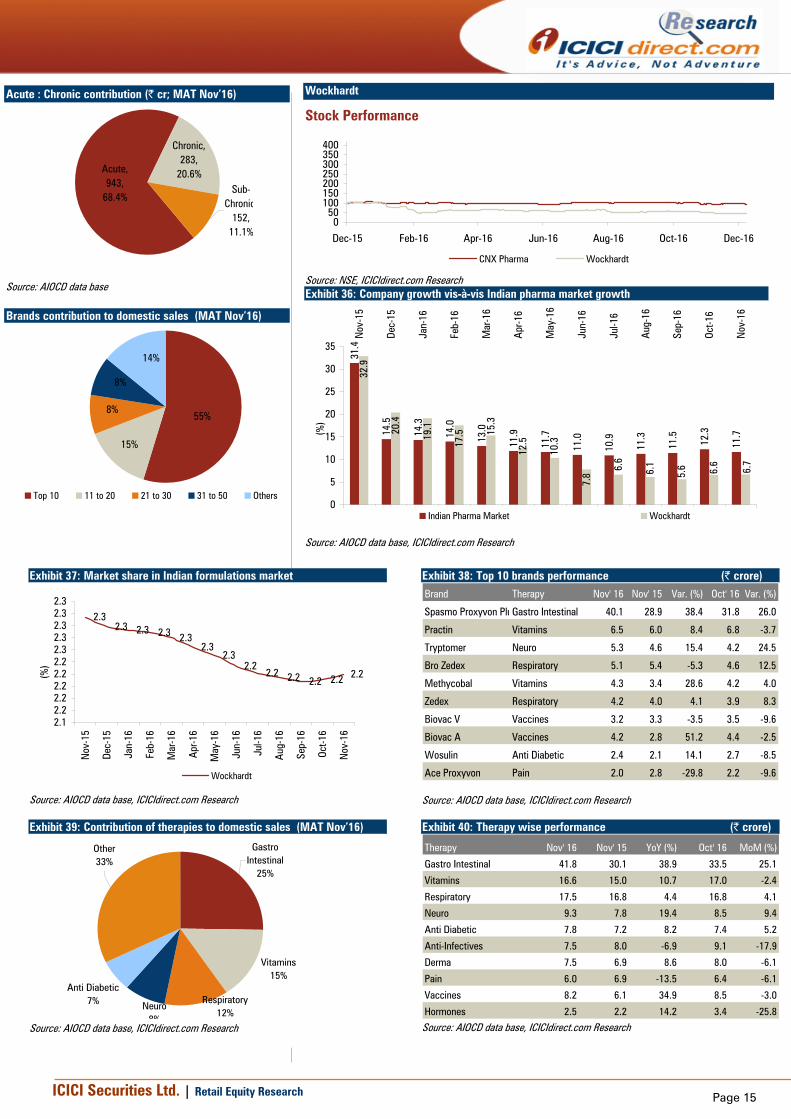
Wockhardt
Stock Performance
050
100150200250300350400
Dec-15 Feb-16 Apr-16 Jun-16 Aug-16 Oct-16 Dec-16
CNX Pharma Wockhardt
Source: NSE, ICICIdirect.com Research Exhibit 36: Company growth vis-à-vis Indian pharma market growth
31.4
14.5
14.3
14.0
13.0
11.9
11.7
11.0
10.9
11.3
11.5
12.3
11.7
32.9
20.4
19.1
17.5
7.8
15.3
12.5
10.3
6.6
6.1
5.6 6.6
6.7
0
5
10
15
20
25
30
35N
ov-1
5
Dec-
15
Jan-
16
Feb-
16
Mar
-16
Apr
-16
May
-16
Jun-
16
Jul-1
6
Aug
-16
Sep-
16
Oct-1
6
Nov
-16
(%)
Indian Pharma Market Wockhardt
Source: AIOCD data base, ICICIdirect.com Research
Exhibit 37: Market share in Indian formulations market
2.32.3 2.3 2.3 2.3
2.32.3
2.22.2 2.2 2.2 2.2 2.2
2.12.22.22.22.22.22.32.32.32.32.3
Nov
-15
Dec-
15
Jan-
16
Feb-
16
Mar
-16
Apr-1
6
May
-16
Jun-
16
Jul-1
6
Aug-
16
Sep-
16
Oct-1
6
Nov
-16
(%)
Wockhardt
Source: AIOCD data base, ICICIdirect.com Research
Exhibit 38: Top 10 brands performance (| crore) Brand Therapy Nov' 16 Nov' 15 Var. (%) Oct' 16 Var. (%)
Spasmo Proxyvon PluGastro Intestinal 40.1 28.9 38.4 31.8 26.0
Practin Vitamins 6.5 6.0 8.4 6.8 -3.7
Tryptomer Neuro 5.3 4.6 15.4 4.2 24.5
Bro Zedex Respiratory 5.1 5.4 -5.3 4.6 12.5
Methycobal Vitamins 4.3 3.4 28.6 4.2 4.0
Zedex Respiratory 4.2 4.0 4.1 3.9 8.3
Biovac V Vaccines 3.2 3.3 -3.5 3.5 -9.6
Biovac A Vaccines 4.2 2.8 51.2 4.4 -2.5
Wosulin Anti Diabetic 2.4 2.1 14.1 2.7 -8.5
Ace Proxyvon Pain 2.0 2.8 -29.8 2.2 -9.6
Source: AIOCD data base, ICICIdirect.com Research
Exhibit 39: Contribution of therapies to domestic sales (MAT Nov’16)
Other33%
Anti Diabetic7% Neuro
8%
Respiratory12%
Vitamins 15%
Gastro Intestinal
25%
Source: AIOCD data base, ICICIdirect.com Research
Exhibit 40: Therapy wise performance (| crore)
Therapy Nov' 16 Nov' 15 YoY (%) Oct' 16 MoM (%)
Gastro Intestinal 41.8 30.1 38.9 33.5 25.1
Vitamins 16.6 15.0 10.7 17.0 -2.4
Respiratory 17.5 16.8 4.4 16.8 4.1
Neuro 9.3 7.8 19.4 8.5 9.4
Anti Diabetic 7.8 7.2 8.2 7.4 5.2
Anti-Infectives 7.5 8.0 -6.9 9.1 -17.9
Derma 7.5 6.9 8.6 8.0 -6.1
Pain 6.0 6.9 -13.5 6.4 -6.1
Vaccines 8.2 6.1 34.9 8.5 -3.0
Hormones 2.5 2.2 14.2 3.4 -25.8
Source: AIOCD data base, ICICIdirect.com Research
Acute : Chronic contribution (| cr; MAT Nov’16)
Sub-Chronic
152, 11.1%
Chronic, 283,
20.6%Acute, 943,
68.4%
Source: AIOCD data base
Brands contribution to domestic sales (MAT Nov’16)
55%
15%
8%
8%
14%
Top 10 11 to 20 21 to 30 31 to 50 Others

ICICI Securities Ltd. | Retail Equity Research
Page 16
Glenmark Pharmaceuticals
Stock Performance
6080
100120140160180200
Dec-15 Feb-16 Apr-16 Jun-16 Aug-16 Oct-16 Dec-16
CNX Pharma Glenmark
Source: NSE, ICICIdirect.com Research
Exhibit 41: Company growth vis-à-vis Indian pharma market growth
14.5
14.3
14.0
13.0
11.9
11.7
11.0
10.9
11.3 12.3
26.8
25.4
24.9
24.5
23.4
21.5
19.8
17.7
15.9
15.5
15.4
16.2
14.511
.5
11.7
-4
4
12
20
28
Nov
-15
Dec-
15
Jan-
16
Feb-
16
Mar
-16
Apr-1
6
May
-16
Jun-
16
Jul-1
6
Aug-
16
Sep-
16
Oct-1
6
Nov
-16
(%)
Indian Pharma Market Glenmark Pharma
Source: AIOCD data base, ICICIdirect.com Research
Exhibit 42: Market share in Indian formulations market
2.32.3
2.42.4
2.42.4 2.4 2.4 2.4
2.4 2.4 2.42.4
2.32.32.32.32.32.42.42.42.42.42.4
Nov
-15
Dec-
15
Jan-
16
Feb-
16
Mar
-16
Apr-1
6
May
-16
Jun-
16
Jul-1
6
Aug-
16
Sep-
16
Oct-1
6
Nov
-16
(%)
Glenmark Pharma
Source: AIOCD data base, ICICIdirect.com Research
Exhibit 43: Top 10 brands performance (| crore) Brand Therapy Nov' 16 Nov' 15 Var. (%) Oct' 16 Var. (%)
Telma Cardiac 15.1 13.9 8.9 13.1 15.8
Telma H Cardiac 15.5 10.9 42.5 12.8 21.0
Ascoril Plus Respiratory 11.4 10.1 13.0 11.1 3.4
Candid Derma 7.1 6.3 12.3 9.2 -22.7
Candid-B Derma 8.0 7.3 10.0 9.7 -17.6
Telma Am Cardiac 7.8 6.0 28.3 6.8 14.1
Ascoril Ls Respiratory 5.4 5.3 1.2 5.5 -3.1
Onabet Derma 4.1 3.0 34.7 4.7 -13.0
Zitamet Plus Anti Diabetic 4.0 0.8 392.0 3.7 8.2
Zita Plus Anti Diabetic 3.0 2.7 8.6 2.8 4.0
Source: AIOCD data base, ICICIdirect.com Research
Exhibit 44: Contribution of therapies to domestic sales (MAT Nov’16) Derma29%
Cardiac22%
Respiratory16%
Anti-Infectives13%
Anti Diabetic7%
Other13%
Source: AIOCD data base, ICICIdirect.com Research
Exhibit 45: Therapy wise performance (| crore)
Therapy Nov' 16 Nov' 15 YoY (%) Oct' 16 MoM (%)
Derma 63.5 53.8 18.0 67.1 -5.5
Cardiac 53.7 41.9 28.3 46.4 15.9
Respiratory 41.4 36.6 13.0 39.1 5.7
Anti-Infectives 30.6 26.6 14.9 34.8 -12.0
Anti Diabetic 14.7 17.7 -16.8 13.9 5.4
Gastro Intestinal 8.6 4.3 97.3 8.6 -0.6
Vitamins 5.1 4.7 8.7 5.0 1.8
Gynaecological 6.8 4.1 65.3 6.6 3.0
Pain 4.0 4.0 2.0 4.2 -4.1
Ophthal 2.9 3.1 -8.4 3.3 -12.4
Source: AIOCD data base, ICICIdirect.com Research
Acute : Chronic contribution (| cr; MAT Nov’16)
Acute, 1044, 40.9%
Chronic, 912, 35.7%
Sub-Chronic,
596, 23.4%
Source: AIOCD data base
Brands contribution to domestic sales (MAT Nov’16)
36%
12%9%
13%
30%
Top 10 11 to 20 21 to 30 31 to 50 Others
Source: AIOCD data base
ICICI Securities Ltd. | Retail Equity Research
Page 17
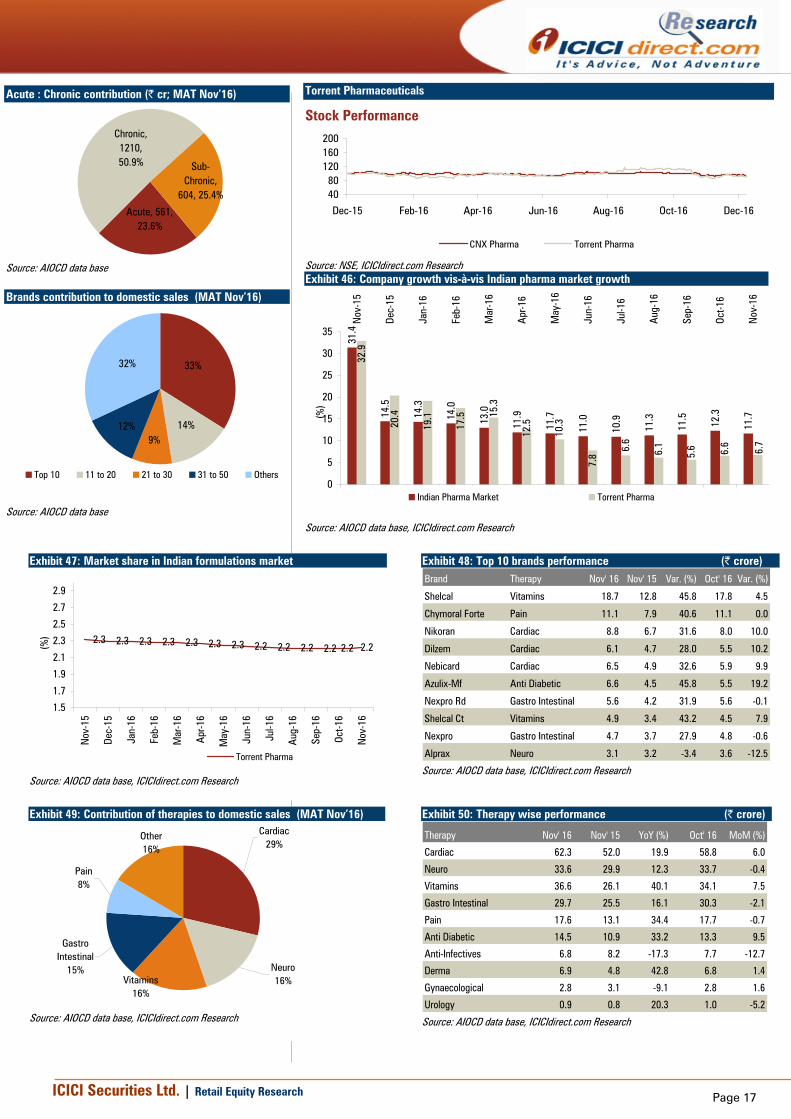
Torrent Pharmaceuticals
Stock Performance
4080
120160200
Dec-15 Feb-16 Apr-16 Jun-16 Aug-16 Oct-16 Dec-16
CNX Pharma Torrent Pharma
Source: NSE, ICICIdirect.com Research Exhibit 46: Company growth vis-à-vis Indian pharma market growth
31.4
14.5
14.3
14.0
13.0
11.9
11.7
11.0
10.9
11.3
11.5
12.3
11.7
32.9
17.5
7.8
20.4
19.1 15
.3
12.5
10.3
6.6
6.1
5.6 6.6
6.7
0
5
10
15
20
25
30
35
Nov
-15
Dec-
15
Jan-
16
Feb-
16
Mar
-16
Apr
-16
May
-16
Jun-
16
Jul-1
6
Aug
-16
Sep-
16
Oct-1
6
Nov
-16
(%)
Indian Pharma Market Torrent Pharma
Source: AIOCD data base, ICICIdirect.com Research
Exhibit 47: Market share in Indian formulations market
2.3 2.3 2.3 2.3 2.3 2.3 2.3 2.2 2.2 2.2 2.2 2.22.2
1.5
1.7
1.9
2.1
2.3
2.5
2.7
2.9
Nov
-15
Dec-
15
Jan-
16
Feb-
16
Mar
-16
Apr-1
6
May
-16
Jun-
16
Jul-1
6
Aug-
16
Sep-
16
Oct-1
6
Nov
-16
(%)
Torrent Pharma
Source: AIOCD data base, ICICIdirect.com Research
Exhibit 48: Top 10 brands performance (| crore) Brand Therapy Nov' 16 Nov' 15 Var. (%) Oct' 16 Var. (%)
Shelcal Vitamins 18.7 12.8 45.8 17.8 4.5
Chymoral Forte Pain 11.1 7.9 40.6 11.1 0.0
Nikoran Cardiac 8.8 6.7 31.6 8.0 10.0
Dilzem Cardiac 6.1 4.7 28.0 5.5 10.2
Nebicard Cardiac 6.5 4.9 32.6 5.9 9.9
Azulix-Mf Anti Diabetic 6.6 4.5 45.8 5.5 19.2
Nexpro Rd Gastro Intestinal 5.6 4.2 31.9 5.6 -0.1
Shelcal Ct Vitamins 4.9 3.4 43.2 4.5 7.9
Nexpro Gastro Intestinal 4.7 3.7 27.9 4.8 -0.6
Alprax Neuro 3.1 3.2 -3.4 3.6 -12.5
Source: AIOCD data base, ICICIdirect.com Research
Exhibit 49: Contribution of therapies to domestic sales (MAT Nov’16) Cardiac
29%
Neuro 16%Vitamins
16%
Gastro Intestinal
15%
Pain 8%
Other16%
Source: AIOCD data base, ICICIdirect.com Research
Exhibit 50: Therapy wise performance (| crore)
Therapy Nov' 16 Nov' 15 YoY (%) Oct' 16 MoM (%)
Cardiac 62.3 52.0 19.9 58.8 6.0
Neuro 33.6 29.9 12.3 33.7 -0.4
Vitamins 36.6 26.1 40.1 34.1 7.5
Gastro Intestinal 29.7 25.5 16.1 30.3 -2.1
Pain 17.6 13.1 34.4 17.7 -0.7
Anti Diabetic 14.5 10.9 33.2 13.3 9.5
Anti-Infectives 6.8 8.2 -17.3 7.7 -12.7
Derma 6.9 4.8 42.8 6.8 1.4
Gynaecological 2.8 3.1 -9.1 2.8 1.6
Urology 0.9 0.8 20.3 1.0 -5.2
Source: AIOCD data base, ICICIdirect.com Research
Acute : Chronic contribution (| cr; MAT Nov’16)
Acute, 561, 23.6%
Chronic, 1210, 50.9% Sub-
Chronic, 604, 25.4%
Source: AIOCD data base
Brands contribution to domestic sales (MAT Nov’16)
33%
14%9%
12%
32%
Top 10 11 to 20 21 to 30 31 to 50 Others
Source: AIOCD data base

ICICI Securities Ltd. | Retail Equity Research
Page 18
Ipca Laboratories
Stock Performance
5075
100125150
Dec-15 Feb-16 Apr-16 Jun-16 Aug-16 Oct-16 Dec-16
CNX Pharma Ipca
Source: NSE, ICICIdirect.com Research Exhibit 51: Company growth vis-à-vis Indian pharma market growth
31.4
14.5
14.3
14.0
13.0
11.9
11.7
11.0
10.9
11.3
11.5
12.3
11.7
28.7
9.1
7.9
6.6
5.9
5.0 5.9 6.7 8.
4 11.1
11.6
10.3
10.7
0
5
10
15
20
25
30
35
Nov
-15
Dec-
15
Jan-
16
Feb-
16
Mar
-16
Apr-1
6
May
-16
Jun-
16
Jul-1
6
Aug-
16
Sep-
16
Oct-1
6
Nov
-16
(%)
Indian Pharma Market Ipca Lab
Source: AIOCD data base, ICICIdirect.com Research
Exhibit 52: Market share in Indian formulations market
1.3 1.3 1.3 1.3 1.3 1.3 1.3 1.3 1.3 1.3 1.3 1.3 1.3
0.0
0.5
1.0
1.5
2.0
Nov
-15
Dec-
15
Jan-
16
Feb-
16
Mar
-16
Apr-1
6
May
-16
Jun-
16
Jul-1
6
Aug-
16
Sep-
16
Oct-1
6
Nov
-16
(%)
Ipca Lab
Source: AIOCD data base, ICICIdirect.com Research
Exhibit 53: Top 10 brands performance (| crore) Brand Therapy Nov' 16 Nov' 15 Var. (%) Oct' 16 Var. (%)
Zerodol Sp Pain 8.3 7.3 14.6 8.7 -4.6
Zerodol P Pain 5.4 4.9 8.8 6.6 -18.8
Hcqs Anti Malarials 5.8 4.8 20.5 5.6 4.4
Larinate Anti Malarials 4.6 5.2 -10.5 7.7 -39.6
Rapither-Ab Anti Malarials 3.1 3.3 -5.2 6.0 -48.8
Lariago Anti Malarials 2.4 2.9 -16.9 4.1 -40.9
Glycinorm M Anti Diabetic 3.4 2.9 18.1 3.3 4.3
Folitrax Anti-Neoplastics 2.6 2.4 5.6 2.7 -4.7
Lumerax Anti Malarials 2.3 2.5 -7.5 4.3 -46.5
Zerodol Pain 2.2 2.3 -5.7 2.5 -12.3
Source: AIOCD data base, ICICIdirect.com Research
Exhibit 54: Contribution of therapies to domestic sales (MAT Nov’16) Other24%
Anti-Infectives6%
Gastro Intestinal
8% Cardiac17%
Anti Malarials20%
Pain 25%
Source: AIOCD data base, ICICIdirect.com Research
Exhibit 55: Therapy wise performance (| crore)
Therapy Nov' 16 Nov' 15 YoY (%) Oct' 16 MoM (%)
Pain 27.6 25.3 9.0 31.5 -12.3
Anti Malarials 20.2 21.7 -6.9 31.2 -35.3
Cardiac 18.8 17.5 7.5 18.3 2.7
Gastro Intestinal 7.6 7.4 2.7 8.6 -11.0
Anti-Infectives 7.1 5.9 20.1 8.4 -15.3
Anti Diabetic 6.0 5.3 13.0 5.9 2.2
Anti-Neoplastics 4.6 3.7 25.0 4.7 -2.0
Respiratory 5.2 4.9 5.8 5.3 -1.9
Neuro 5.0 3.2 57.1 4.9 3.7
Derma 4.4 3.0 45.5 4.3 1.9
Source: AIOCD data base, ICICIdirect.com Research
Acute : Chronic contribution (| cr; MAT Nov’16)
Acute, 893, 66.3%
Chronic, 366, 27.2%
Sub-Chronic, 89,
6.6%
Source: AIOCD data base
Brands contribution to domestic sales (MAT Nov’16)
37%
16%11%
13%
23%
Top 10 11 to 20 21 to 30 31 to 50 Others
Source: AIOCD data base

ICICI Securities Ltd. | Retail Equity Research
Page 19
Biocon
Stock Performance
60100140180220
Dec-15 Feb-16 Apr-16 Jun-16 Aug-16 Oct-16 Dec-16CNX Pharma Biocon
Source: NSE, ICICIdirect.com Research
Exhibit 56: Company growth vis-à-vis Indian pharma market growth
31.4
14.5
14.3
14.0
13.0
11.9
11.7
11.0
10.9
11.3
11.5
12.3
11.7
24.9
6.4
5.4
5.1
5.4
5.1 5.5
5.4
8.8
7.6
7.3
5.4
5.0
0
5
10
15
20
25
30
35
Nov
-15
Dec-
15
Jan-
16
Feb-
16
Mar
-16
Apr-1
6
May
-16
Jun-
16
Jul-1
6
Aug-
16
Sep-
16
Oct-1
6
Nov
-16
(%)
Indian Pharma Market Biocon
Source: AIOCD data base, ICICIdirect.com Research
Exhibit 57: Market share in Indian formulations market
0.3 0.3 0.3 0.3 0.3 0.3 0.3 0.3 0.3 0.3 0.3 0.30.3
0.0
0.2
0.4
0.6
0.8
1.0
Nov
-15
Dec-
15
Jan-
16
Feb-
16
Mar
-16
Apr-1
6
May
-16
Jun-
16
Jul-1
6
Aug-
16
Sep-
16
Oct-1
6
Nov
-16
(%)
Biocon
Source: AIOCD data base, ICICIdirect.com Research
Exhibit 58: Top 10 brands performance (| crore) Brand Therapy Nov' 16 Nov' 15 Var. (%) Oct' 16 Var. (%)
Insugen Anti Diabetic 7.8 7.1 10.4 7.2 8.4
Basalog Anti Diabetic 5.6 4.9 15.5 5.1 10.2
Erypro Blood Related 4.7 1.2 304.3 3.9 20.6
Canmab Anti-Neoplastics 2.5 0.8 230.1 1.3 85.6
Abraxane Anti-Neoplastics 0.3 0.3 -1.0 1.0 -67.1
Insugen R Anti Diabetic 1.5 1.4 3.4 1.7 -15.1
Blisto Mf Anti Diabetic 1.4 1.5 -11.2 1.1 21.9
Biomab Egfr Anti-Neoplastics 0.6 0.5 14.0 0.3 97.1
Psorid Anti-Neoplastics 0.7 0.8 -11.9 0.9 -20.9
Insugen N Anti Diabetic 0.6 0.7 -13.0 0.6 4.0
Source: AIOCD data base, ICICIdirect.com Research
Exhibit 59: Contribution of therapies to domestic sales (MAT Nov’16)
Other 4%
Derma3%Cardiac
5%Blood Related
9%
Anti-Neoplastics
22%
Anti Diabetic57%
Source: AIOCD data base, ICICIdirect.com Research
Exhibit 60: Therapy wise performance (| crore)
Therapy Nov' 16 Nov' 15 YoY (%) Oct' 16 MoM (%)
Anti Diabetic 18.0 16.8 6.9 16.8 7.2
Anti-Neoplastics 5.9 4.1 42.7 5.4 9.0
Blood Related 4.9 1.2 309.9 4.1 18.7
Cardiac 1.4 1.4 0.1 1.4 2.2
Derma 0.8 0.9 -9.7 0.8 3.7
Anti-Infectives 1.0 0.7 47.8 0.7 43.4
Others 0.2 0.2 -13.4 0.2 -5.7
Gastro Intestinal 0.2 0.3 -4.7 0.1 94.9
Vitamins 0.1 0.1 -10.9 0.1 29.9
Pain 0.1 0.1 12.6 0.1 12.1
Source: AIOCD data base, ICICIdirect.com Research
Acute : Chronic contribution (| cr; MAT Nov’16)
Acute, 74, 20.8%
Chronic, 252, 70.9%
Sub-Chronic, 30,
8.3%
Source: AIOCD data base
Brands contribution to domestic sales (MAT Nov’16)
79%10%
5%
5%
1%
Top 10 11 to 20 21 to 30 31 to 50 Others
Source: AIOCD data base

ICICI Securities Ltd. | Retail Equity Research
Page 20
Pfizer
Stock Performance
4080
120160200
Dec-15 Feb-16 Apr-16 Jun-16 Aug-16 Oct-16 Dec-16
CNX Pharma Pfizer
Source: NSE, ICICIdirect.com Research Exhibit 61: Company growth vis-à-vis Indian pharma market growth
31.4
14.5
14.3
14.0
13.0
11.9
11.7
11.0
10.9
11.3
11.5
12.3
11.7
26.7
14.3
11.9
10.7
9.6
8.5
8.3
6.8
5.8
4.9
4.4
4.4
3.1
0
5
10
15
20
25
30
35
Nov
-15
Dec-
15
Jan-
16
Feb-
16
Mar
-16
Apr-1
6
May
-16
Jun-
16
Jul-1
6
Aug-
16
Sep-
16
Oct-1
6
Nov
-16
(%)
Indian Pharma Market Pfizer
Source: AIOCD data base, ICICIdirect.com Research
Exhibit 62: Market share in Indian formulations market
3.0 2.9 2.9 2.9 2.9 2.9 2.9 2.9 2.8 2.8 2.8 2.8 2.8
2.0
2.4
2.8
3.2
3.6
4.0
Nov
-15
Dec-
15
Jan-
16
Feb-
16
Mar
-16
Apr-1
6
May
-16
Jun-
16
Jul-1
6
Aug
-16
Sep-
16
Oct-1
6
Nov
-16
(%)
Pfizer
Source: AIOCD data base, ICICIdirect.com Research
Exhibit 63: Top 10 brands performance (| crore) Brand Therapy Nov' 16 Nov' 15 Var. (%) Oct' 16 Var. (%)
Corex Respiratory 17.4 29.6 -41.3 21.8 -20.2
Becosules Vitamins 17.5 16.8 4.2 19.5 -10.4
Dolonex Pain 12.3 11.3 9.3 12.7 -3.0
Minipress Xl Cardiac 12.5 10.1 23.9 11.9 5.1
Gelusil Mps Gastro Intestinal 10.7 10.8 -0.7 11.5 -6.7
Magnex Anti-Infectives 12.1 11.3 7.0 13.0 -7.0
Mucaine Gastro Intestinal 9.1 8.3 8.8 9.4 -4.0
Wysolone Hormones 12.0 9.1 31.8 11.7 2.8
Folvite Blood Related 6.1 5.7 6.4 6.0 1.6
Corex Dx Respiratory 7.5 6.1 24.1 8.0 -6.1
Source: AIOCD data base, ICICIdirect.com Research
Exhibit 64: Contribution of therapies to domestic sales (MAT Nov’16)
Other43%
Hormones9%
Vitamins 10%
Gastro Intestinal
10%
Respiratory13%
Anti-Infectives15%
Source: AIOCD data base, ICICIdirect.com Research
Exhibit 65: Therapy wise performance (| crore)
Therapy Nov' 16 Nov' 15 YoY (%) Oct' 16 MoM (%)
Anti-Infectives 34.8 39.1 -11.0 37.5 -7.2
Respiratory 27.2 37.7 -27.8 32.1 -15.4
Gastro Intestinal 24.3 23.3 4.1 25.8 -5.7
Vitamins 22.4 21.7 3.0 24.7 -9.2
Hormones 26.4 21.8 21.3 27.5 -3.9
Gynaecological 20.0 17.7 13.0 21.2 -5.8
Neuro 17.2 16.1 6.7 15.5 10.5
Cardiac 18.0 14.8 21.9 17.3 4.0
Pain 16.0 15.6 2.7 17.4 -8.3
Vaccines 17.8 6.2 187.3 13.8 29.1
Source: AIOCD data base, ICICIdirect.com Research
Acute : Chronic contribution (| cr; MAT Nov’16)
Acute, 1915, 64.9%
Chronic, 466, 15.8%
Sub-Chronic,
569, 19.3%
Source: AIOCD data base
Brands contribution to domestic sales (MAT Nov’16)
48%
20%
11%
10%
11%
Top 10 11 to 20 21 to 30 31 to 50 Others
Source: AIOCD data base

ICICI Securities Ltd. | Retail Equity Research
Page 21
Novartis
Stock Performance
40
90
140
190
Dec-15 Feb-16 Apr-16 Jun-16 Aug-16 Oct-16 Dec-16
CNX Pharma Novartis India
Source: NSE, ICICIdirect.com Research
Exhibit 66: Company growth vis-à-vis Indian pharma market growth
31.4
14.5
14.3
14.0
13.0
11.9
11.7
11.0
10.9
11.3
11.5
12.3
11.7
25.1
13.5
14.0 15
.4 16.5 17.7
18.4
17.6
15.3
13.8
13.1
12.5
11.3
0
5
10
15
20
25
30
35
Nov
-15
Dec-
15
Jan-
16
Feb-
16
Mar
-16
Apr-1
6
May
-16
Jun-
16
Jul-1
6
Aug-
16
Sep-
16
Oct-1
6
Nov
-16
(%)
Indian Pharma Market Novartis India
Source: AIOCD data base, ICICIdirect.com Research
Exhibit 67: Market share in Indian formulations market
1.0 1.0 1.0 1.0 1.0 1.0 1.0 1.0 1.0 1.0 1.0 1.01.0
0.0
0.2
0.4
0.6
0.8
1.0
1.2
Nov
-15
Dec-
15
Jan-
16
Feb-
16
Mar
-16
Apr-1
6
May
-16
Jun-
16
Jul-1
6
Aug
-16
Sep-
16
Oct-1
6
Nov
-16
(%)
Novartis India
Source: AIOCD data base, ICICIdirect.com Research
Exhibit 68: Top 10 brands performance (| crore) Brand Therapy Nov' 16 Nov' 15 Var. (%) Oct' 16 Var. (%)
Galvus Met Anti Diabetic 32.3 23.9 35.1 26.8 20.7
Voveran Pain 19.7 15.8 24.7 20.1 -2.1
Galvus Anti Diabetic 11.4 9.9 15.4 9.3 22.4
Tegrital Neuro 4.9 4.5 7.9 4.6 5.3
Voveran Pain 3.6 3.1 16.6 3.5 0.8
Regestrone Gynaecological 2.4 2.8 -16.7 2.8 -13.7
Methergin Gynaecological 2.5 2.3 7.8 2.6 -3.9
Syntocinon Gynaecological 2.4 2.0 24.3 2.5 -3.5
Calcium Sandoz Vitamins 1.7 1.7 2.1 2.3 -27.0
Macalvit Vitamins 1.8 2.0 -8.2 1.8 2.4
Source: AIOCD data base, ICICIdirect.com Research
Exhibit 69: Contribution of therapies to domestic sales (MAT Nov’16)
Anti Diabetic41%
Pain 26%
Vitamins 10%
Gynaecological8%
Neuro 5%
Other10%
Source: AIOCD data base, ICICIdirect.com Research
Exhibit 70: Therapy wise performance (| crore)
Therapy Nov' 16 Nov' 15 YoY (%) Oct' 16 MoM (%)
Anti Diabetic 44.2 34.3 28.8 36.6 20.9
Pain 24.5 20.3 20.7 25.0 -1.7
Vitamins 8.0 8.9 -10.9 9.3 -14.1
Gynaecological 7.3 7.3 -0.3 7.9 -7.2
Neuro 4.9 5.3 -7.9 4.6 5.3
Anti-Infectives 2.4 4.3 -44.8 2.8 -15.6
Respiratory 2.2 2.0 7.1 1.8 19.3
Cardiac 0.7 1.1 -33.8 0.6 19.8
Anti-Neoplastics 1.0 0.3 264.5 1.0 3.0
Ophthal 0.6 0.8 -19.5 0.7 -14.5
Source: AIOCD data base, ICICIdirect.com Research
Acute : Chronic contribution (| cr; MAT Nov’16)
Acute, 403, 37.7%
Chronic, 513, 48.0%
Sub-Chronic,
152, 14.3%
Source: AIOCD data base
Brands contribution to domestic sales (MAT Nov’16)
82%
10%4%3%1%
Top 10 11 to 20 21 to 30 31 to 50 Others
Source: AIOCD data base

ICICI Securities Ltd. | Retail Equity Research
Page 22
Unichem Laboratories
Stock Performance
70100130160
Dec-15 Feb-16 Apr-16 Jun-16 Aug-16 Oct-16 Dec-16
CNX Pharma Unichem Labs
Source: NSE, ICICIdirect.com Research
Exhibit 71: Company growth vis-à-vis Indian pharma market growth
31.4
14.5
14.3
14.0
13.0
11.9
11.7
11.0
10.9
11.3
11.5
12.3
11.7
32.9
19.1
17.5
7.8
20.4
15.3
12.5
10.3
6.6
6.1
5.6 6.6
6.7
0
5
10
15
20
25
30
35
Nov
-15
Dec-
15
Jan-
16
Feb-
16
Mar
-16
Apr
-16
May
-16
Jun-
16
Jul-1
6
Aug
-16
Sep-
16
Oct-1
6
Nov
-16
(%)
Indian Pharma Market Unichem Lab
Source: AIOCD data base, ICICIdirect.com Research
Exhibit 72: Market share in Indian formulations market
2.312.30 2.29 2.29 2.28
2.262.25
2.232.22 2.21 2.21 2.212.22
2.12.22.22.22.22.22.32.32.32.32.3
Nov
-15
Dec-
15
Jan-
16
Feb-
16
Mar
-16
Apr-1
6
May
-16
Jun-
16
Jul-1
6
Aug-
16
Sep-
16
Oct-1
6
Nov
-16
(%)
Unichem Lab
Source: AIOCD data base, ICICIdirect.com Research
Exhibit 73: Top 10 brands performance (| crore)
Brand Therapy Nov' 16 Nov' 15 Var. (%) Oct' 16 Var. (%)
Losar H Cardiac 9.0 6.1 47.8 9.2 -2.8
Ampoxin Anti-Infectives 6.4 6.2 2.6 6.9 -7.4
Losar Cardiac 6.3 5.1 24.4 5.9 6.8
Unienzyme Gastro Intestinal 4.7 4.5 3.2 5.2 -10.6
Vizylac Gastro Intestinal 2.5 2.1 19.8 3.2 -20.4
Trika Neuro 1.9 2.1 -7.4 1.9 -0.1
Serta Neuro 2.0 1.6 19.5 1.7 11.9
Unistar (Unichem) Cardiac 1.9 1.5 26.2 1.6 13.7
Arkamin Cardiac 1.7 1.0 69.8 1.6 1.0
Telsar Cardiac 1.5 1.4 4.3 1.4 6.9
Source: AIOCD data base, ICICIdirect.com Research
Exhibit 74: Contribution of therapies to domestic sales (MAT Nov’16)
Other12%
Anti Diabetic4%
Gastro Intestinal
12%
Neuro 14%
Anti-Infectives16%
Cardiac42%
Source: AIOCD data base, ICICIdirect.com Research
Exhibit 75: Therapy wise performance (| crore)
Therapy Nov' 16 Nov' 15 YoY (%) Oct' 16 MoM (%)
Cardiac 36.7 28.4 28.9 35.3 4.0
Anti-Infectives 13.2 12.8 3.3 15.3 -13.5
Neuro 11.8 9.0 30.6 10.8 9.0
Gastro Intestinal 8.6 8.1 6.8 9.9 -13.4
Anti Diabetic 4.7 2.4 92.1 4.2 10.5
Pain 3.2 2.7 15.1 3.6 -11.5
Respiratory 1.9 1.9 3.9 2.2 -10.5
Derma 1.8 1.4 23.0 1.9 -6.7
Vitamins 1.8 1.6 11.7 1.9 -4.3
Gynaecological 0.3 0.4 -30.7 0.3 7.8
Source: AIOCD data base, ICICIdirect.com Research
Acute : Chronic contribution (| cr; MAT Nov’16)
Acute, 339,
35.2%
Chronic, 565,
58.8%
Sub-Chronic, 58, 6.0%
Source: AIOCD data base
Brands contribution to domestic sales (MAT Nov’16)
33%
14%9%
12%
32%
Top 10 11 to 20 21 to 30 31 to 50 Others
Source: AIOCD data base

ICICI Securities Ltd. | Retail Equity Research
Page 23
Indoco Remedies
Stock Performance
6080
100120140
Nov-15 Jan-16 Mar-16 May-16 Jul-16 Sep-16 Nov-16
CNX Pharma Indoco
Source: NSE, ICICIdirect.com Research
Exhibit 76: Company growth vis-à-vis Indian pharma market growth
31.4
14.5
14.3
14.0
13.0
11.9
11.7
11.0
10.9
11.3
11.5
12.3
11.7
5.6
4.1
12.2
12.9
12.4
10.06.
9
4.84.0
3.86.
6
6.8
26.9
0
5
10
15
20
25
30
35
Nov
-15
Dec-
15
Jan-
16
Feb-
16
Mar
-16
Apr
-16
May
-16
Jun-
16
Jul-1
6
Aug
-16
Sep-
16
Oct-1
6
Nov
-16
(%)
Indian Pharma Market Indoco Remedies
Source: AIOCD data base, ICICIdirect.com Research
Exhibit 77: Market share in Indian formulations market
0.7 0.7 0.7 0.7 0.7 0.7 0.7 0.7 0.7 0.7 0.7 0.7 0.7
0.50.60.60.70.70.80.80.90.91.01.01.11.1
Nov
-15
Dec-
15
Jan-
16
Feb-
16
Mar
-16
Apr-1
6
May
-16
Jun-
16
Jul-1
6
Aug-
16
Sep-
16
Oct-1
6
Nov
-16
(%)
Indoco Remedies
Source: AIOCD data base, ICICIdirect.com Research
Exhibit 78: Top 10 brands performance (| crore) Brand Therapy Oct' 16 Oct' 15 Var. (%) Sep' 16 Var. (%)
Febrex Plus Respiratory 8.1 7.2 13.6 9.1 -11.0
Oxipod Anti-Infectives 4.5 4.5 0.5 5.5 -17.7
Sensodent-K Stomatologicals 3.4 2.8 24.3 3.4 -0.2
Cyclopam Gastro Intestinal 3.2 3.4 -6.5 3.7 -12.8
Atm Anti-Infectives 3.1 3.3 -4.4 3.5 -11.1
Cital Urology 2.8 2.9 -3.5 3.0 -7.3
Karvol Plus Respiratory 2.5 2.3 6.6 2.4 1.1
Cloben G Derma 2.2 2.0 11.6 2.1 2.7
Sensoform Stomatologicals 1.9 1.5 26.9 1.8 3.5
Sensodent-Kf Stomatologicals 1.9 2.2 -14.5 1.6 15.0
Source: AIOCD data base, ICICIdirect.com Research
Exhibit 79: Contribution of therapies to domestic sales (MAT Nov’16) Respiratory
19%
Anti-Infectives18%
Stomatologicals
16%
Gastro Intestinal
14%
Vitamins 7%
Other26%
Source: AIOCD data base, ICICIdirect.com Research
Exhibit 80: Therapy wise performance (| crore)
Therapy Oct' 16 Oct' 15 YoY (%) Sep' 16 MoM (%)
Respiratory 17.4 13.5 29.0 14.5 20.2
Anti-Infectives 16.7 13.7 21.7 13.8 20.3
Stomatologicals 10.5 9.4 11.5 11.7 -10.3
Gastro Intestinal 10.5 7.5 40.6 12.2 -13.8
Vitamins 5.5 4.4 25.1 5.3 3.0
Urology 3.3 3.2 3.4 3.2 6.1
Ophthal 3.5 2.8 25.4 3.1 12.6
Pain 3.0 2.6 14.3 3.0 -0.2
Derma 3.1 2.7 15.4 2.9 4.5
Anti Diabetic 2.2 1.9 11.9 2.2 -0.8
Source: AIOCD data base, ICICIdirect.com Research
Acute : Chronic contribution (| cr; MAT Nov’16)
Sub-Chronic
86, 11.5
Chronic, 41, 5.5%Acute,
622, 83.0%
Source: AIOCD data base
Brands contribution to domestic sales (MAT Nov’16)
48%
15%
9%
10%
18%
Top 10 11 to 20 21 to 30 31 to 50 Others
Source: AIOCD data base

ICICI Securities Ltd. | Retail Equity Research
Page 24
Ajanta Pharmaceuticals
Stock Performance
4090
140190240290
Dec-15 Feb-16 Apr-16 Jun-16 Aug-16 Oct-16 Dec-16
CNX Pharma Ajanta
Source: NSE, ICICIdirect.com Research
Exhibit 81: Company growth vis-à-vis Indian pharma market growth
31.4
14.5
14.3
14.0
13.0
11.9
11.7
11.0
10.9
11.3
11.5
12.3
11.7
48.8
21.4
21.5
20.8
20.1
20.8
21.2
21.5
20.7
19.7
18.0
19.1
17.9
0
10
20
30
40
50
60
Nov
-15
Dec-
15
Jan-
16
Feb-
16
Mar
-16
Apr
-16
May
-16
Jun-
16
Jul-1
6
Aug-
16
Sep-
16
Oct-1
6
Nov
-16
(%)
Indian Pharma Market Ajanta Pharma
Source: AIOCD data base, ICICIdirect.com Research
Exhibit 82: Market share in Indian formulations market
0.60.6
0.6 0.6 0.60.6
0.60.6 0.6 0.6 0.6 0.6
0.6
0.6
0.6
0.6
0.6
0.6
0.6
0.6
Nov
-15
Dec-
15
Jan-
16
Feb-
16
Mar
-16
Apr
-16
May
-16
Jun-
16
Jul-1
6
Aug
-16
Sep-
16
Oct-1
6
Nov
-16
(%)
Ajanta Pharma
Source: AIOCD data base, ICICIdirect.com Research
Exhibit 83: Top 10 brands performance (| crore) Brand Therapy Nov' 16 Nov' 15 Var. (%) Oct' 16 Var. (%)
Met Xl Cardiac 6.7 6.5 3.4 6.8 -0.3
Melacare Derma 3.8 4.2 -8.9 4.0 -5.4
Atorfit Cv Cardiac 4.1 4.0 2.0 3.9 2.9
Feburic Pain 1.8 1.4 29.2 1.8 1.4
Rosufit Cv Cardiac 2.0 1.6 23.7 1.9 8.5
Met Xl Am Cardiac 1.6 1.3 22.1 1.4 9.0
Soft Drops Ophthal 1.6 1.4 10.7 1.5 3.7
Rosutor Gold Cardiac 1.5 0.9 62.3 1.3 9.5
Cinod Cardiac 1.3 1.0 26.8 1.2 4.4
Olopat Ophthal 0.8 0.9 -10.6 0.8 -2.9
Source: AIOCD data base, ICICIdirect.com Research
Exhibit 84: Contribution of therapies to domestic sales (MAT Nov’16)
Cardiac37%
Ophthal 23%
Derma19%
Vitamins 5%
Pain 5%
Others11%
Source: AIOCD data base, ICICIdirect.com Research
Exhibit 85: Therapy wise performance (| crore)
Therapy Nov' 16 Nov' 15 YoY (%) Oct' 16 MoM (%)
Cardiac 22.2 19.4 14.5 21.3 4.3
Ophthal 13.1 11.5 13.5 13.3 -2.1
Derma 11.0 10.6 3.8 10.4 5.7
Vitamins 2.6 3.1 -13.9 2.7 -1.6
Pain 2.7 2.5 10.4 2.7 0.3
Gastro Intestinal 1.3 1.4 -8.2 1.4 -9.0
Neuro 1.4 1.1 27.6 1.4 2.8
Anti-Infectives 1.5 1.0 47.0 1.5 -1.4
Anti Diabetic 1.2 0.6 98.4 1.1 10.8
Respiratory 0.5 0.4 14.7 0.4 11.4
Source: AIOCD data base, ICICIdirect.com Research
Acute : Chronic contribution (| cr; MAT Nov’16)
Acute, 253, 38.2%
Chronic, 335, 50.5%
Sub-Chronic, 75,
11.3%
Source: AIOCD data base
Brands contribution to domestic sales (MAT Nov’16)
43%
12%9%
12%
24%
Top 10 11 to 20 21 to 30 31 to 50 Others
Source: AIOCD data base

ICICI Securities Ltd. | Retail Equity Research
Page 25
Alembic Pharmaceuticals
Stock Performance
406080
100120140160180200
Dec-15 Feb-16 Apr-16 Jun-16 Aug-16 Oct-16 Dec-16
CNX Pharma Alembic Pharma
Source: NSE, ICICIdirect.com Research
Exhibit 86: Company growth vis-à-vis Indian pharma market growth
31.4
14.5
14.3
14.0
13.0
11.9
11.7
11.0
10.9
11.3
11.5
12.3
11.7
29.6
17.7 19.1
18.6
17.7
16.4
16.1
15.6
15.7
15.7
16.2
16.8
14.4
0
5
10
15
20
25
30
35N
ov-1
5
Dec-
15
Jan-
16
Feb-
16
Mar
-16
Apr-1
6
May
-16
Jun-
16
Jul-1
6
Aug-
16
Sep-
16
Oct-1
6
Nov
-16
(%)
Indian Pharma Market Alembic
Source: AIOCD data base, ICICIdirect.com Research
Exhibit 87: Market share in Indian formulations market
1.4
1.4
1.4 1.4 1.4 1.4 1.4 1.41.4
1.4 1.4 1.4
1.4
1.3
1.3
1.4
1.4
1.4
1.4
1.4
1.4
Nov
-15
Dec-
15
Jan-
16
Feb-
16
Mar
-16
Apr-1
6
May
-16
Jun-
16
Jul-1
6
Aug-
16
Sep-
16
Oct-1
6
Nov
-16
(%)
Alembic
Source: AIOCD data base, ICICIdirect.com Research
Exhibit 88: Top 10 brands performance (| crore)
Brand Therapy Nov' 16 Nov' 15 Var. (%) Oct' 16 Var. (%)
Azithral Anti-Infectives 12.2 13.2 -7.4 12.6 -3.6
Althrocin Anti-Infectives 7.2 6.4 12.7 8.4 -13.6
Gestofit Gynaecological 4.8 3.8 24.0 4.9 -3.7
Roxid Anti-Infectives 4.8 5.0 -3.3 4.6 4.0
Wikoryl Respiratory 5.1 4.1 26.1 5.3 -2.8
Ulgel Gastro Intestinal 2.4 3.2 -23.9 2.9 -14.4
Rekool D Gastro Intestinal 2.9 3.0 -3.1 2.8 1.4
Richar Gynaecological 2.4 1.8 31.5 2.6 -7.9
Glisen Mf Anti Diabetic 2.1 2.2 -1.9 2.3 -9.2
Rekool Gastro Intestinal 2.0 2.0 -3.2 2.0 -1.1
Source: AIOCD data base, ICICIdirect.com Research
Exhibit 89: Contribution of therapies to domestic sales (MAT Nov’16) Anti-Infectives
23%
Cardiac14%
Gastro Intestinal
13%Respiratory
13%
Gynaecological11%
Other26%
Source: AIOCD data base, ICICIdirect.com Research
Exhibit 90: Therapy wise performance (| crore)
Therapy Nov' 16 Nov' 15 YoY (%) Oct' 16 MoM (%)Anti-Infectives 28.3 30.0 -5.6 30.5 -7.2Cardiac 17.2 15.4 11.2 18.0 -4.9Gastro Intestinal 15.4 16.4 -6.1 17.3 -10.7Respiratory 18.6 19.2 -3.1 18.8 -1.4Gynaecological 14.2 11.4 23.8 15.1 -6.2Vitamins 10.0 7.9 25.9 10.5 -4.5Anti Diabetic 8.7 7.1 22.6 9.0 -3.8Pain 3.9 4.4 -10.8 4.5 -12.8Urology 3.1 2.3 34.4 2.8 8.7Derma 1.9 2.6 -25.4 2.2 -14.8
Source: AIOCD data base, ICICIdirect.com Research
Acute : Chronic contribution (| cr; MAT Nov’16)
Acute, 858,
58.2%
Chronic 231.46, 18.8%
Sub-Chronic 214.35, 17.4%
Source: AIOCD data base
Brands contribution to domestic sales (MAT Nov’16)
43%
12%9%
12%
24%
Top 10 11 to 20 21 to 30 31 to 50 Others

ICICI Securities Ltd. | Retail Equity Research
Page 26
Exhibit 91: One year forward P/E of CNX Pharma vs. Sensex
0
5
10
15
20
25
30
35
40
45
Dec-
06
Jun-
07
Dec-
07
Jun-
08
Dec-
08
Jun-
09
Dec-
09
Jun-
10
Dec-
10
Jun-
11
Dec-
11
Jun-
12
Dec-
12
Jun-
13
Dec-
13
Jun-
14
Dec-
14
Jun-
15
Dec-
15
Jun-
16
Dec-
16
x
CNX Pharma Sensex
40% Premium
[
Source: Company, ICICIdirect.com Research
ICICIdirect.com coverage universe (Healthcare) Company I-Direct CMP TP Rating M Cap
Code (|) (|) (| Cr) FY16 FY17E FY18E FY19E FY16 FY17E FY18E FY19E FY16 FY17E FY18E FY19E FY16 FY17E FY18E FY19E
Ajanta Pharma AJAPHA 1813 2,220 Buy 15952.7 45.4 58.7 67.9 79.2 39.9 30.9 26.7 22.9 42.9 39.5 36.1 33.4 34.2 32.7 29.0 26.6
Apollo Hospitals APOHOS 1219 1,440 Buy 16953.2 22.2 23.1 33.0 47.1 54.9 52.7 37.0 25.9 8.2 8.4 10.7 13.7 8.9 8.7 11.2 14.0
Aurobindo Pharma AURPHA 691 1,100 Buy 40438.1 33.9 41.5 48.0 54.8 20.4 16.7 14.4 12.6 23.3 24.5 25.4 25.1 28.1 26.0 23.5 21.5
Alembic Pharma ALEMPHA 623 700 Hold 11742.6 38.2 20.3 24.3 31.9 16.3 30.7 25.7 19.5 51.5 23.7 23.1 25.9 44.9 20.4 20.8 22.9
Biocon BIOCON 978 1,030 Hold 19554.0 23.0 31.0 34.0 45.2 42.5 31.6 28.8 21.7 9.1 12.4 13.6 17.0 11.3 13.8 13.6 15.8
Cadila Healthcare CADHEA 376 450 Buy 38497.8 15.0 13.8 18.2 22.7 25.1 27.2 20.6 16.6 26.7 19.6 24.1 27.2 28.6 22.1 23.9 24.4Cipla CIPLA 566 575 Hold 45521.5 18.5 19.0 25.2 31.9 30.6 29.8 22.5 17.7 12.0 11.3 14.1 16.4 12.5 11.6 13.5 14.9
Divi's Lab DIVLAB 1153 1,415 Buy 30601.9 41.8 43.6 51.9 59.3 27.6 26.4 22.2 19.4 30.7 28.0 28.4 27.1 25.9 22.6 22.3 21.2
Dr Reddy's Labs DRREDD 2974 3,300 Hold 53075.7 142.1 61.1 133.0 164.9 20.9 48.7 22.4 18.0 17.3 5.6 13.3 16.0 20.7 8.3 15.7 16.7
Glenmark Pharma GLEPHA 858 1,200 Buy 26224.7 32.2 44.0 54.4 62.4 26.7 19.5 15.8 13.8 16.2 19.0 21.9 22.6 21.2 22.7 22.2 20.4
Indoco Remedies INDREM 263 365 Buy 2419.9 9.4 11.0 15.4 20.2 28.0 23.8 17.1 13.0 12.9 12.0 16.5 20.0 14.8 15.3 18.2 20.1
Ipca Laboratories IPCLAB 546 605 Buy 6892.4 10.0 15.3 25.7 33.7 54.5 35.8 21.2 16.2 5.7 10.0 12.7 14.9 5.5 7.9 12.0 13.9
Jubilant Life VAMORG 632 795 Buy 10063.8 26.0 43.2 53.8 66.3 24.3 14.6 11.7 9.5 12.0 15.7 17.4 19.0 14.2 19.4 19.7 19.8
Lupin LUPIN 1469 1,890 Buy 66291.6 50.4 62.9 67.1 85.7 29.1 23.3 21.9 17.1 18.6 19.6 20.6 24.3 20.7 21.3 19.1 20.3
Natco Pharma NATPHA 594 750 Buy 10358.2 8.5 14.9 13.4 15.5 69.9 39.9 44.4 38.4 16.0 22.2 17.5 17.9 11.9 17.7 14.0 14.2
Sun Pharma SUNPHA 647 850 Buy 155742.1 23.4 30.1 31.9 38.7 27.6 21.5 20.3 16.7 18.6 19.6 18.2 18.8 18.0 19.4 17.6 18.1
Syngene Int. SYNINT 588 570 Hold 11751.0 11.1 15.9 17.8 21.8 51.9 36.1 32.2 26.3 13.2 18.1 18.6 21.5 21.0 23.7 21.5 21.3
Torrent Pharma TORPHA 1306 1,700 Buy 22099.3 107.8 57.4 68.4 84.9 12.1 22.8 19.1 15.4 46.7 22.6 25.6 28.1 53.8 23.6 23.2 23.7
Unichem Lab UNILAB 268 305 Hold 2435.4 12.3 15.0 18.9 25.4 21.8 17.9 14.2 10.6 13.8 15.4 17.1 19.8 11.7 12.7 14.1 16.3
RoE (%)EPS (|) PE(x) RoCE (%)

ICICI Securities Ltd. | Retail Equity Research
Page 27
RATING RATIONALE ICICIdirect.com endeavours to provide objective opinions and recommendations. ICICIdirect.com assigns ratings to its stocks according to their notional target price vs. current market price and then categorises them as Strong Buy, Buy, Add, Reduce and Sell. The performance horizon is two years unless specified and the notional target price is defined as the analysts' valuation for a stock. Sector view: Over weight compared to index Equal weight compared to index Under weight compared to index Index here refers to BSE 500
Pankaj Pandey Head – Research [email protected]
ICICIdirect.com Research Desk, ICICI Securities Limited, 1st Floor, Akruti Trade Centre, Road No. 7, MIDC, Andheri (East) Mumbai – 400 093

ICICI Securities Ltd. | Retail Equity Research
Page 28
ANALYST CERTIFICATION We /I, Siddhant Khandekar CA-INTER Mitesh Shah MS (Finance) Research Analysts, authors and the names subscribed to this report, hereby certify that all of the views expressed in this research report accurately reflect our views about the subject issuer(s) or securities. We also certify that no part of our compensation was, is, or will be directly or indirectly related to the specific recommendation(s) or view(s) in this report.
Terms & conditions and other disclosures: ICICI Securities Limited is a Sebi registered Research Analyst having registration no. INH000000990. ICICI Securities Limited (ICICI Securities) is a full-service, integrated investment banking and is, inter alia, engaged in the business of stock brokering and distribution of financial products. ICICI Securities is a wholly-owned subsidiary of ICICI Bank which is India’s largest private sector bank and has its various subsidiaries engaged in businesses of housing finance, asset management, life insurance, general insurance, venture capital fund management, etc. (“associates”), the details in respect of which are available on www.icicibank.com. ICICI Securities is one of the leading merchant bankers/ underwriters of securities and participate in virtually all securities trading markets in India. We and our associates might have investment banking and other business relationship with a significant percentage of companies covered by our Investment Research Department. ICICI Securities generally prohibits its analysts, persons reporting to analysts and their relatives from maintaining a financial interest in the securities or derivatives of any companies that the analysts cover. The information and opinions in this report have been prepared by ICICI Securities and are subject to change without any notice. The report and information contained herein is strictly confidential and meant solely for the selected recipient and may not be altered in any way, transmitted to, copied or distributed, in part or in whole, to any other person or to the media or reproduced in any form, without prior written consent of ICICI Securities. While we would endeavour to update the information herein on a reasonable basis, ICICI Securitiesis is under no obligation to update or keep the information current. Also, there may be regulatory, compliance or other reasons that may prevent ICICI Securities from doing so. Non-rated securities indicate that rating on a particular security has been suspended temporarily and such suspension is in compliance with applicable regulations and/or ICICI Securities policies, in circumstances where ICICI Securities might be acting in an advisory capacity to this company, or in certain other circumstances. This report is based on information obtained from public sources and sources believed to be reliable, but no independent verification has been made nor is its accuracy or completeness guaranteed. This report and information herein is solely for informational purpose and shall not be used or considered as an offer document or solicitation of offer to buy or sell or subscribe for securities or other financial instruments. Though disseminated to all the customers simultaneously, not all customers may receive this report at the same time. ICICI Securities will not treat recipients as customers by virtue of their receiving this report. Nothing in this report constitutes investment, legal, accounting and tax advice or a representation that any investment or strategy is suitable or appropriate to your specific circumstances. The securities discussed and opinions expressed in this report may not be suitable for all investors, who must make their own investment decisions, based on their own investment objectives, financial positions and needs of specific recipient. This may not be taken in substitution for the exercise of independent judgment by any recipient. The recipient should independently evaluate the investment risks. The value and return on investment may vary because of changes in interest rates, foreign exchange rates or any other reason. ICICI Securities accepts no liabilities whatsoever for any loss or damage of any kind arising out of the use of this report. Past performance is not necessarily a guide to future performance. Investors are advised to see Risk Disclosure Document to understand the risks associated before investing in the securities markets. Actual results may differ materially from those set forth in projections. Forward-looking statements are not predictions and may be subject to change without notice. ICICI Securities or its associates might have managed or co-managed public offering of securities for the subject company or might have been mandated by the subject company for any other assignment in the past twelve months. ICICI Securities or its associates might have received any compensation from the companies mentioned in the report during the period preceding twelve months from the date of this report for services in respect of managing or co-managing public offerings, corporate finance, investment banking or merchant banking, brokerage services or other advisory service in a merger or specific transaction. ICICI Securities or its associates might have received any compensation for products or services other than investment banking or merchant banking or brokerage services from the companies mentioned in the report in the past twelve months. ICICI Securities encourages independence in research report preparation and strives to minimize conflict in preparation of research report. ICICI Securities or its analysts did not receive any compensation or other benefits from the companies mentioned in the report or third party in connection with preparation of the research report. Accordingly, neither ICICI Securities nor Research Analysts have any material conflict of interest at the time of publication of this report. It is confirmed that Siddhant Khandekar CA-INTER Mitesh Shah MS (Finance), Research Analysts of this report have not received any compensation from the companies mentioned in the report in the preceding twelve months. Compensation of our Research Analysts is not based on any specific merchant banking, investment banking or brokerage service transactions. ICICI Securities or its subsidiaries collectively or Research Analysts do not own 1% or more of the equity securities of the Company mentioned in the report as of the last day of the month preceding the publication of the research report. Since associates of ICICI Securities are engaged in various financial service businesses, they might have financial interests or beneficial ownership in various companies including the subject company/companies mentioned in this report. It is confirmed that Siddhant Khandekar CA-INTER Mitesh Shah MS (Finance), Research Analysts do not serve as an officer, director or employee of the companies mentioned in the report. ICICI Securities may have issued other reports that are inconsistent with and reach different conclusion from the information presented in this report. Neither the Research Analysts nor ICICI Securities have been engaged in market making activity for the companies mentioned in the report. We submit that no material disciplinary action has been taken on ICICI Securities by any Regulatory Authority impacting Equity Research Analysis activities. This report is not directed or intended for distribution to, or use by, any person or entity who is a citizen or resident of or located in any locality, state, country or other jurisdiction, where such distribution, publication, availability or use would be contrary to law, regulation or which would subject ICICI Securities and affiliates to any registration or licensing requirement within such jurisdiction. The securities described herein may or may not be eligible for sale in all jurisdictions or to certain category of investors. Persons in whose possession this document may come are required to inform themselves of and to observe such restriction.