
Bradenton Real Estate, Bradenton Real Estate Agents, Real Estate Marketing Plan

IESE Business School-University of Navarra - 1
PRICING OF SPECIFIC REAL ESTATE MARKET RISKS FOR 66 COUNTRIES WORLDWIDE
Karsten Lieser
IESE Business School – University of Navarra Av. Pearson, 21 – 08034 Barcelona, Spain. Phone: (+34) 93 253 42 00 Fax: (+34) 93 253 43 43 Camino del Cerro del Águila, 3 (Ctra. de Castilla, km 5,180) – 28023 Madrid, Spain. Phone: (+34) 91 357 08 09 Fax: (+34) 91 357 29 13 Copyright © 2011 IESE Business School.
Working Paper
WP-940
November, 2011

PRICING OF SPECIFIC REAL ESTATE MARKET RISKS FOR
66 COUNTRIES WORLDWIDE
Karsten Lieser1
Abstract
I address the construction of hurdle rates for 66 countries that adequately compensate investors for the specific real estate market risks involved when investing, operating and exiting a foreign market. To estimate the market-based framework, I run random-effect panel regressions over a six-year period (2004-2009) using IPD direct property market returns and a recently developed, integral composite index that takes into account all real estate market and investment-specific conditions. The regression results provide direct evidence that an increased perception of risk and instability in the countries’ socio-economic conditions and institutional frameworks implies higher investor return expectations. Finally, the results provide international investors with an absolute hurdle rate that prices the risks and opportunities of national real estate markets and guides investors in the decision between a core, value-added, or opportunistic investment strategy.
Classification JEL: C33, C23, G11, G23, G24, O16, O18, P25, P52
Keywords: Hurdle Rate, Country Risk, Real Estate Investments, International Asset Allocation.
1 Research Affiliate, International Centre of Financial Research, IESE Business School, ([email protected])
IESE Business School-University of Navarra

PRICING OF SPECIFIC REAL ESTATE MARKET RISKS FOR 66 COUNTRIES WORLDWIDE
1 Introduction Institutional investors have one key objective: perform transactions with satisfactory risk-adjusted ratios. Lee (2006) argues that when the investment decision is taken in overseas markets, an additional dimension of uncertainty overlays the analysis. Many authors argue that country risk dominates any asset investment decision and therefore should be the first level of analysis in any international diversification strategy.
Lee (2006) and Edelstein, Quian and Tsang (2010) find direct evidence for numerous socio-economic and institutional differences among countries, which affect the investment decisions of globally acting investors and hence, have a significant and consistent impact on real estate market performance. Prior research stresses that political stability, restrictions and regulations affecting foreign investors, legal framework, legal regulation, sound financial and economic structure, and the economy’s strength and stability have a significant influence on investors’ market perception. Clearly, these institutional characteristics vary substantially among countries and gradually over time. The literature claims that these differences are important for the analysis of long-term perspectives in institutional investors’ asset allocation processes and require validation since, to some extent, these factors limit market access or encumber the investment process (Geurts and Jaffe, 1996; D’Arcy and Keogh, 1998; Lee, 2001 and 2005; Lim, McGreal and Webb, 2006; Chin, Dent and Roberts, 2006; Falkenbach, 2009).
When developing international asset allocation strategies, investors require a quantitative measure that compensates the investor for the risks involved at three distinct times: when investing, operating, and exiting a foreign market. The common investment praxis uses the preferred return or hurdle rate as the minimum rate of return. The theory argues that investors are likely to ask for higher hurdles for the higher risks associated with investments in environments that have opaque legal systems, socio-economic instability, high market entry and exit barriers, or lack of investment and financing opportunities. Since common country risk indicators have been mistakenly applied in real estate market risk performance analyses, the aim of this research study is to calculate hurdle rates and risk premiums for 66 countries based on a market pricing approach, using a new, integral composite measure developed by Lieser and Groh (2010). The composite index determines countries’ real estate investment conditions via the six key factors:
IESE Business School-University of Navarra

Economic Activity: Economic size, GDP per capita, GDP growth, unemployment rate, inflation, and technological advancement create deal opportunities in general.
Real Estate Investment Opportunities: The structure of the real estate market, agglomeration poles, degree and pace of urbanization, demographic attributes, development of general infrastructure, and level of sophistication in the service economy spur real estate investments.
Depth and Sophistication of Capital Markets: An established liquid capital market, stable banking and financial services system, exit routes via IPO, and equity capital flows play an active role in flourishing real estate markets.
Investor Protection and Legal Framework: Protection of property rights, corporate governance rules, regulation, ease in seeking legal recourse, and disclosure requirements keep the financial market transparent.
Administrative Burdens and Regulatory Limitations: Burdens of doing real estate business, cumbersome procedures, high taxation, regulatory limitations, and exchange controls affect foreign investors when investing, operating and exiting real estate markets.
Socio-cultural and Political Environment: Social and political stability and perceived crime and corruption are important factors that indicate institutional problems in a country’s public sector and influence the overall investment climate.
To estimate the hurdle rates, I run random-effect panel regressions with actual IPD property returns during 2004-2009 for 18 countries worldwide. By applying panel regressions that take into account the heterogeneity of cross-country characteristics using an increased country sample and longer times series, I obtain more accurate estimators than shown by prior research. The regression results provide direct evidence that an increased perception of risk and instability in countries’ socio-economic conditions and institutional frameworks implies higher investor return expectations. I use these findings to calculate hurdle rates for 66 countries worldwide and derive country risk premiums for international real estate investment decisions. Finally, the results provide international investors with an absolute hurdle rate that prices the risks and opportunities of national real estate markets and guides investors in the decision between a core, value-added, or opportunistic investment strategy.
2 Literature Review Despite the many benefits of international real estate investments, there are also costs and risks. Although several studies have explored the risks of developed, emerging and challenged real estate markets, the contributions that investigate how these risks affect property returns are scant in real estate literature.
Erb, Harvey and Viskanta (1996) study the effects of country risk rating and its different components from the Institutional Investors Country Credit Rating (IICCR) and the International Country Risk Guide (ICGR) on 47 countries (21 developed and 26 emerging countries), using MSCI stock data from September 1979 to March 1995. The results suggest that the country risk significantly affects stock market returns. In particular, the authors find that economic and financial risk can predict the cross-section of expected returns, which is even more influential in the developed markets. Furthermore, the authors point out that, among emerging countries, a
2 - IESE Business School-University of Navarra

change in political indicators has a marginal explanatory power, but is not significant in developed markets.
Liang and McIntosh (2000) study the effects of the Institutional Investors Country Credit Rating (IICCR) on property stock market data of 53 countries for a period from 1980 to 2000 using a pooled regression model. They find a positive relation between country risk and returns and show that investors’ return expectations are progressively higher as the perceived country risk rises.
Lee (2006) studies the effects of country risk, as measured by Euromonitor (ECR), on the direct real estate returns (IPD) of 15 countries over the period 1998-2004, using a pooled regression analysis approach. He finds direct evidence that the overall country risk and economic risk show a significant and positive relation with international real estate returns. The author did not find significance with respect to political risk. The author finally suggests that country risk ratings have a significant and consistent impact on real estate performance and may help investors in their international real estate decision-making.
Edelstein, Quian and Tsang (2010) study firm-level observations from the FTSE NAREIT / EPRA Index for 2004-2006. The authors construct a set of multifactor multivariate statistical regression models to identify and pin-point country-specific institutional features, such as i) legal system quality; ii) corporate governance quality; and iii) accounting standards quality, that determine differences for excess real estate security returns (i.e., required risk premiums). The authors find that legal and governance quality are statistically significant determinants and that excess risk-adjusted rates of return decline as the quality of the legal system and corporate governance improves. The authors did not find significance with respect to accounting quality.
Overall, all of the studies rely on the common country risk indicators that are primarily composed for general stock market investments. Prior research studies do not attempt to address any additional returns that investors may require for taking additional risks associated with the particularities of the real estate investment environment. In contrast to financial markets, the real estate market place intrinsically bears many particularities that may sway away the decision to enter, operate, and exit a foreign market. Many of these particularities stem from property’s legal and physical characteristics, and the operational features of market activity. For instance, we would highlight the complex set of characteristics comprising the heterogeneity, immobility, indivisibility and illiquidity of real property, the externalities and public goods associated with land and property, legal constraints and property rights, and the high transaction sizes and costs. Combinations of these characteristics lead to property market imperfections, which impose major impediments for investors focusing investment in a foreign host market, such as: (i) atomistic and decentralized market structures; (ii) information asymmetries and cost of information; (iii) a limited supply, because property is a differentiated and heterogeneous product; (iv) an inflexible market adjustment process; and (v) differing market conventions. Therefore, real estate market risk can vary significantly from one country to another, even for countries with similar country risk profiles. For instance, Lieser and Groh (2010) find that even within Europe, countries display markedly different levels of market maturity and thus, of real estate-related market risk. Consequently, prior analyses lack a country risk score that also captures significant portions of real estate-related market risk. This study takes the opportunity to apply a composite index that captures all these variables by measuring a country’s investment conditions via six key drivers: (i) economic activity; (ii) real estate investment opportunities; (iii) depth and sophistication of capital markets; (iv) investor protection and quality of legal framework; (v) administrative burdens and regulatory limitations; and (vi) socio-cultural and political environment.
IESE Business School-University of Navarra - 3

3 Methodology Rather than use country risk data as independent variables to assess the performance of direct property market returns (Lee, 2006), I apply the Global REIA Index as an independent variable to assess the performance of direct property market returns. The index is designed so that higher values for the index score mean a lower risk assessed for the country. I hypothesize a positive relation between real estate investment country risk and real estate market returns, according to the findings of Liang and McIntosh (2000), Lee (2006), and Edelstein, Quian and Tsang (2010). These authors conclude that investors’ return expectations progressively increase as the perceived country risk rises.
I apply a random-effect panel data regression in order to take into account the heterogeneity of the countries’ cross-sectional panel data and obtain the following equation:
Rit = α + β xit + ui + εit (Eq. 1)
where: Rit = Total property market returns for country i at time t
xit = National real estate market and investment risk for country i at time t
ui ~ N(0; 2 u ) = between-entity error term
εit ~ N(0; 2 3 ) = within-entity error term
Hoechle (2007) argues that both fixed-effect and random-effect models adjust for heteroskedacity and serial correlation (autocorrelation). Furthermore, the Breusch Pagan Lagrange Multiplier and Hausman tests check for consistency of the random-effect model.
As dependent variable, I use annual total property returns from 2004 to 2009 from the International Property Databank (IPD) for 18 countries: Australia, Canada, Denmark, Finland, France, Germany, Ireland, Italy, Netherlands, New Zealand, Norway, Portugal, South Africa, Spain, Sweden, Switzerland, United Kingdom, and United States. The following table provides an overview of the main statistics. It should be noted that I include data from the financial crisis in order to increase the data sample. Since I am analyzing country risk effects, the results might shed some light on new insights.
Table 1 Summary Statistics of Total Property Returns
Observations 96
Mean .0986
Standard Deviation .0973
Minimum -.3420
Maximum .3000
Variance .0095
Skewness -11.812
Kurtosis 69.028
Source: Investment Property Database (IPD). Annual total return of property markets for the period 2004-2009.
4 - IESE Business School-University of Navarra
4 Presentation and Interpretation of Results
4.1 Estimating Hurdle Rates of Return
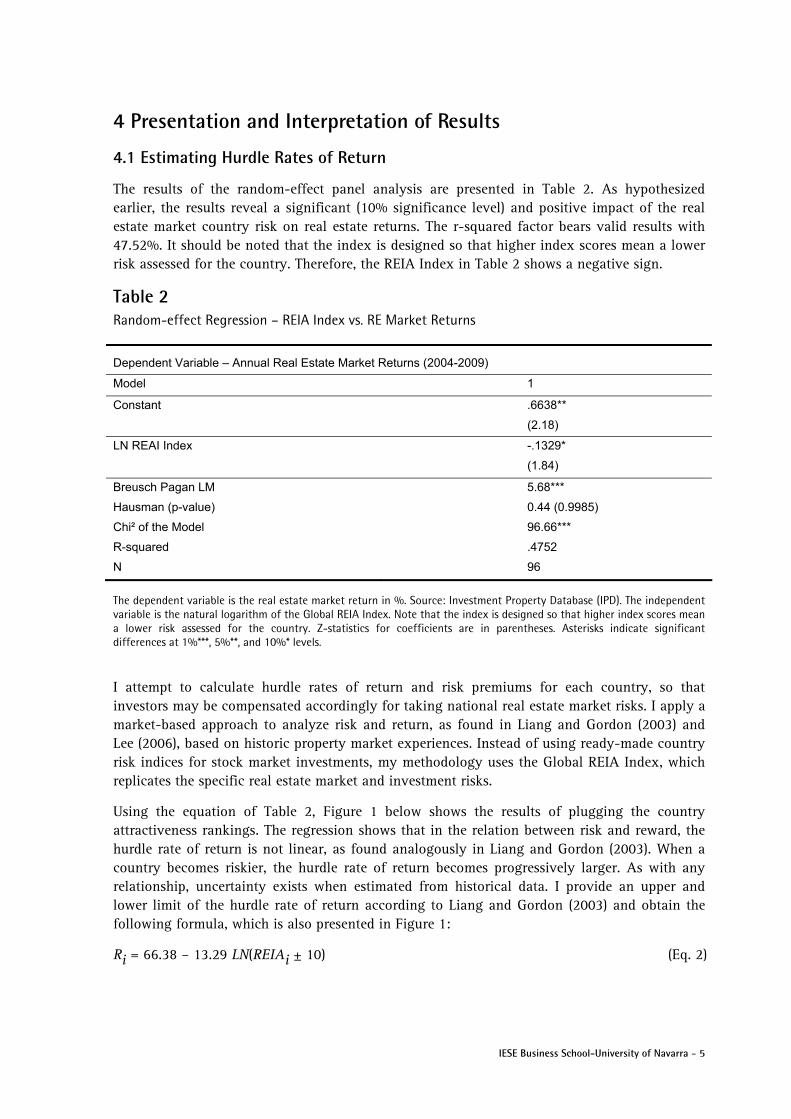
The results of the random-effect panel analysis are presented in Table 2. As hypothesized earlier, the results reveal a significant (10% significance level) and positive impact of the real estate market country risk on real estate returns. The r-squared factor bears valid results with 47.52%. It should be noted that the index is designed so that higher index scores mean a lower risk assessed for the country. Therefore, the REIA Index in Table 2 shows a negative sign.
Table 2 Random-effect Regression – REIA Index vs. RE Market Returns
Dependent Variable – Annual Real Estate Market Returns (2004-2009)
Model 1
Constant .6638**
(2.18)
LN REAI Index -.1329*
(1.84)
Breusch Pagan LM 5.68***
Hausman (p-value) 0.44 (0.9985)
Chi² of the Model 96.66***
R-squared .4752
N 96
The dependent variable is the real estate market return in %. Source: Investment Property Database (IPD). The independent variable is the natural logarithm of the Global REIA Index. Note that the index is designed so that higher index scores mean a lower risk assessed for the country. Z-statistics for coefficients are in parentheses. Asterisks indicate significant differences at 1%***, 5%**, and 10%* levels.
I attempt to calculate hurdle rates of return and risk premiums for each country, so that investors may be compensated accordingly for taking national real estate market risks. I apply a market-based approach to analyze risk and return, as found in Liang and Gordon (2003) and Lee (2006), based on historic property market experiences. Instead of using ready-made country risk indices for stock market investments, my methodology uses the Global REIA Index, which replicates the specific real estate market and investment risks.
Using the equation of Table 2, Figure 1 below shows the results of plugging the country attractiveness rankings. The regression shows that in the relation between risk and reward, the hurdle rate of return is not linear, as found analogously in Liang and Gordon (2003). When a country becomes riskier, the hurdle rate of return becomes progressively larger. As with any relationship, uncertainty exists when estimated from historical data. I provide an upper and lower limit of the hurdle rate of return according to Liang and Gordon (2003) and obtain the following formula, which is also presented in Figure 1:
Ri = 66.38 – 13.29 LN(REIAi ± 10) (Eq. 2)
IESE Business School-University of Navarra - 5

Figure 1 Hurdle Rate of Return vs. REAI Index*
0
5
10
15
20
25
30
35
40
45
50
0102030405060708090100110
Hu
rdle
Rat
eo
f Ret
urn
[%]
REIA Index
Upper Limit
Hurdle Rate of Return
Lower Limit
High RiskLow Risk
Note that the index is designed so that higher index scores mean a lower risk assessed for the country.
Table A 1 in the Appendix provides a detailed overview of the hurdle rates of return for all 66 countries included in the Global REIA Index. Furthermore, using the hurdle rates of return, I calculate the countries’ risk premiums, which are shown on the right-hand side of Table A 1. A risk premium or discount is the difference in the hurdle rate of return between a base and a particular country. The United States is used as base country because it bears the highest attractiveness for institutional investors with regard to the Global REIA Index.
4.2 The Global Risk and Return Matrix
The investor’s first dimension is the geographical asset allocation, evaluating the countries’ attractiveness and riskiness, ranging from core to emerging countries. The second dimension is the property investment strategy. A core strategy means buying and owning existing, high-quality, stabilized properties. A value-added approach includes development, redevelopment, repositioning and taking more risks in leasing and locations. An opportunistic strategy has extremely high leverage in conjunction with a depressed market, a depressed property or non-performing assets. It furthermore involves investments in real estate entities participating in arbitrary and high-growth niche markets.
Table 3 shows the estimated hurdle rate of return calculated for various combinations of regional and investment style risk. The hurdle rates of return derived in the previous section are considered for the core investment strategy. I further add a risk premium of 300 bps and 900 bps for value-added and opportunistic investment styles, respectively, following Liang and Gordon’s approach (2003). Table A 1 in the Appendix presents the detailed information at the country level.
6 - IESE Business School-University of Navarra

Table 3 Regional Hurdle Rates in [%]
Target Market Market Structure* Investment Strategy
Core Value-Added Opportunistic
North America 6 9 15
Australasia Core Markets 10 13 19
Western Europe 10 13 19
Asia 10 13 19
Middle East Emerging and Transition Markets 14 17 23
Eastern Europe 14 17 23
Latin America 15 18 24
Africa Challenged Markets
17 20 26
* Market structure according to the calculation of the Global Real Estate Investment Attractiveness Index, Lieser and Groh (2010).
The results show that the North American region bears less risk because of its vibrant economies, appealing real estate and sophisticated capital markets, and transparent institutional frameworks, and is therefore priced with lower hurdle rates of returns. Surprisingly, the Western European region is considered risky, as is the entire Asian region. In the European case, this may be due to including return data from the financial crisis, which show significant drops in return performance between 2007 and 2009. In the Asian case, this may be due to lower leverage ratios among the Asian countries, which have been less affected by the financial crisis. In contrast, emerging markets, such as some countries in the Middle East and Eastern Europe, suffer in terms of their economic performance and their institutional framework, characterized by a lack of transparency and stability issues. The lack of protection of legal and property rights also affects the risk in those countries. Furthermore, the regions are characterized by a less attractive socio-cultural and political environment for investments, and by a higher level of perceived corruption and political uncertainty. The investment risks with respect to legal protection and socio-political instabilities increase even further in Latin America and Africa. Therefore, the increased perception of risks requires higher returns to compensate the investor when investing, operating, or exiting these markets.
5 Conclusions This research paper addresses the issue of international decisions by investors looking to expand their real estate exposure to new and foreign markets. Sound investment decisions need satisfactory information about an investment’s risk-adjusted return performance. Common country risk indicators have been wrongly applied in real estate studies. However, many authors state that these indices are composed primarily for general stock market investments and do not deal with the investor’s additional risk associated with the particularities of the real estate investment environment. Since the analysis of country risk has been scant in real estate literature, this paper took the opportunity to conduct an analysis, for the first time, with IPD property returns and the Global REAI Index, which integrally assesses a country’s investment conditions via six key drivers: (i) economic activity; (ii) real estate investment opportunities; (iii) depth and sophistication of capital markets; (iv) investor protection and quality of legal
IESE Business School-University of Navarra - 7

framework; (v) administrative burdens and regulatory limitations; and (vi) socio-cultural and political environment.
Running random-effect panel regression for IPD property market returns and the Global REAI Index over six years, I obtain the theoretical equation that provides direct evidence of a positive relation between national real estate market risks and real estate market returns. Moreover, the results point out that investors’ return expectations are progressively higher as the perceived real estate market risk rises, and vice-versa. Using the findings of the panel regression, I use a market-based approach to calculate the real estate-specific hurdle-rates for 66 countries that compensate the investor for his/her risks at three distinct times: when investing, operating, and exiting a foreign real estate market. The results suggest that despite potentially high rates of economic growth, rapid urbanization and compelling demographics, the Emerging Markets require higher real estate market hurdle rates due to instability and lack of transparency in their institutional frameworks -- two key drivers that sway away investment decisions. Overall, the results indicate that national real estate market and investment risks have a significant and consistent impact on real estate return performance and therefore should help real estate investors in their global asset allocation decisions.
This analysis is considered to be a starting point and should encourage further research to investigate countries’ institutional frameworks and socio-economic structures with respect to property market performance.
8 - IESE Business School-University of Navarra

IESE Business School-University of Navarra - 9
6 References Chin W., Dent P. and C. Roberts (2006): An Explanatory Analysis of Barriers to Investment and Market Maturity in Southeast Asian Cities. In: Journal of Real Estate Portfolio Management, vol. 12, no. 1, pp. 49-57.
D’Arcy E. and G. Keogh (1998): Territorial Competition and Property Market Process: An Explanatory Analysis. In: Journal of Urban Studies, vol. 35, no. 8, pp. 1215-1230.
Edelstein R., Qian W. and D. Tsang (2010): How Do Institutional Factors Affect International Real Estate Returns? In: Journal of Real Estate Economics and Finance, online: DOI: 10.1007/s11146-010-9245-4.
Erb C. B., Harvey C. R. and T. E. Viskanta (1996): Expected Returns and Volatility in 135 Countries. In: The Journal of Portfolio Management, vol. 21, No. 3, pp. 46-58.
Falkenbach H. (2009): Market Selection for International Real Estate Investments. In: International Journal of Strategic Property Management, vol. 13, pp. 299-308.
Geurt T. G. and A. J. Jaffe (1996): Risk and Real Estate Investment: An International Perspective. In: The Journal of Real Estate Research, vol. 11, no. 2, pp. 117-130.
Hoechle D. (2007): Robust Standard Errors for Panel Regressions with Cross-Sectional Dependence. In: The Stata Journal, vol. 7, no. 3, pp. 281-312.
Lee S. (2001): The Risks of Investing in the Real Estate Markets of the Asian Region. In: Working Paper of the Department of Land Management, The University of Reading, no. 6.
Lee S. (2005): Gauging the Investment Potential of International Real Estate Markets. In: Working Paper of Real Estate and Planning, The University of Reading, no. 19.
Lee S. (2006): The Impact of Country Risk on International Real Estate Returns. In: Working Paper of Real Estate and Planning, The University of Reading, no. 10.
Liang Y. and W. McIntosh (2000): Country Risk Premiums for International Investing. Pramerica Financial Research, March.
Lieser K. and A. P. Groh (2010): The Attractiveness of 66 Countries for Real Estate Investments – A Composite Index Approach. In: ERES Conference Paper and IESE Working Paper, WP-868, Available at SSRN: http://ssrn.com/abstract=1638286.
Lim L. C., McGreal S. and J. R. Webb (2006): Perception of Real Estate Investment Opportunities in Central/South America and Africa. In: Journal of Real Estate Portfolio Management, vol. 12, no. 3, pp. 261-276.

7 Appendix
Table A1 Hurdle Rate of Return and Estimated Risk Premium
Hurdle Rate of Return [%] Estimated Risk Premium [%]
Country Region Index Hurdle Rate of Return Lower Limit Upper Limit Risk Premium Lower Limit Upper Limit
United States North America 100.00 5.19 3.92 6.59 0.00 0.00 0.00
North America North America 93.54 6.07 4.72 7.58 0.89 0.80 0.99
Japan Asia 83.68 7.55 6.05 9.24 2.37 2.13 2.66
United Kingdom Western Europe 83.55 7.57 6.07 9.27 2.39 2.15 2.68
Germany Western Europe 82.21 7.79 6.26 9.51 2.60 2.34 2.93
Canada North America 78.45 8.41 6.82 10.22 3.23 2.90 3.64
France Western Europe 74.11 9.17 7.48 11.09 3.98 3.57 4.51
Australia Australasia 73.92 9.20 7.51 11.13 4.02 3.60 4.55
Republic of Korea Asia 73.11 9.35 7.64 11.30 4.16 3.72 4.72
Hong Kong Asia 71.18 9.70 7.96 11.72 4.52 4.04 5.13
Netherlands Western Europe 69.97 9.93 8.16 11.98 4.75 4.24 5.39
Australasia Australasia 69.45 10.03 8.24 12.10 4.84 4.32 5.51
China Asia 69.40 10.04 8.25 12.11 4.85 4.33 5.52
Asia Asia 69.24 10.07 8.28 12.14 4.88 4.36 5.56
Western Europe Western Europe 68.88 10.14 8.34 12.23 4.96 4.42 5.64
Italy Western Europe 68.18 10.27 8.46 12.38 5.09 4.54 5.80
Sweden Western Europe 68.10 10.29 8.47 12.40 5.11 4.55 5.82
Singapore Asia 67.84 10.34 8.51 12.46 5.16 4.60 5.88
Spain Western Europe 66.54 10.60 8.74 12.76 5.41 4.82 6.18
Denmark Western Europe 65.07 10.90 9.00 13.11 5.71 5.08 6.53
10 - IESE Business School-University of Navarra

Belgium Western Europe 63.71 11.18 9.24 13.45 5.99 5.32 6.86
India Asia 63.26 11.27 9.32 13.56 6.09 5.40 6.97
World World 63.23 11.28 9.33 13.57 6.09 5.41 6.98
Taiwan Asia 60.55 11.85 9.82 14.25 6.67 5.90 7.66
Austria Western Europe 60.39 11.89 9.85 14.29 6.70 5.93 7.71
Norway Western Europe 60.05 11.96 9.92 14.38 6.78 6.00 7.80
Brazil Latin America 59.61 12.06 10.00 14.50 6.87 6.08 7.91
Finland Western Europe 59.05 12.19 10.11 14.65 7.00 6.19 8.07
Switzerland Western Europe 58.81 12.24 10.15 14.72 7.06 6.23 8.13
Portugal Western Europe 58.70 12.27 10.17 14.75 7.08 6.26 8.16
Malaysia Asia 58.42 12.33 10.23 14.82 7.14 6.31 8.24
Mexico Latin America 58.19 12.38 10.27 14.89 7.20 6.35 8.30
Poland Eastern Europe 57.84 12.46 10.34 14.98 7.27 6.42 8.40
Russian Federation Asia 57.39 12.56 10.43 15.11 7.38 6.51 8.52
Israel Middle East 56.95 12.67 10.52 15.23 7.48 6.60 8.65
New Zealand Australasia 56.58 12.75 10.59 15.34 7.57 6.67 8.75
Turkey Eastern Europe 56.32 12.82 10.64 15.41 7.63 6.72 8.83
Ireland Western Europe 56.09 12.87 10.69 15.48 7.68 6.77 8.89
Thailand Asia 53.73 13.44 11.17 16.18 8.26 7.25 9.59
Czech Republic Eastern Europe 52.79 13.68 11.37 16.47 8.49 7.45 9.88
Greece Western Europe 52.54 13.74 11.42 16.54 8.55 7.50 9.96
Indonesia Asia 51.61 13.98 11.62 16.84 8.79 7.70 10.25
Chile Latin America 50.98 14.14 11.76 17.04 8.95 7.84 10.46
Saudi Arabia Middle East 50.21 14.34 11.93 17.29 9.16 8.01 10.71
Middle East Middle East 49.99 14.40 11.98 17.37 9.21 8.06 10.78
Eastern Europe Eastern Europe 49.85 14.44 12.01 17.41 9.25 8.09 10.83
Romania Eastern Europe 49.55 14.52 12.07 17.51 9.33 8.16 10.93
United Arab Emirates Middle East 49.39 14.56 12.11 17.57 9.37 8.19 10.98
IESE Business School-University of Navarra - 11

12 - IESE Business School-University of Navarra
South Africa Africa 49.22 14.61 12.15 17.62 9.42 8.23 11.04
Latin America Latin America 47.78 15.00 12.48 18.12 9.82 8.56 11.54
Argentina Latin America 46.58 15.34 12.75 18.55 10.15 8.84 11.97
Hungary Eastern Europe 46.41 15.39 12.80 18.61 10.20 8.88 12.03
Ukraine Eastern Europe 44.48 15.95 13.26 19.34 10.77 9.34 12.75
Philippines Asia 43.95 16.11 13.39 19.54 10.93 9.47 12.96
Egypt Middle East 43.77 16.16 13.43 19.61 10.98 9.51 13.03
Luxembourg Western Europe 43.24 16.33 13.56 19.82 11.14 9.64 13.24
Slovakia Eastern Europe 42.08 16.69 13.86 20.30 11.50 9.94 13.71
Kuwait Middle East 41.01 17.03 14.13 20.75 11.85 10.21 14.16
Peru Latin America 40.75 17.11 14.20 20.86 11.93 10.28 14.27
Lithuania Eastern Europe 40.37 17.24 14.30 21.02 12.06 10.38 14.44
Africa Africa 39.79 17.43 14.45 21.28 12.25 10.53 14.69
Colombia Latin America 39.59 17.50 14.51 21.37 12.31 10.59 14.78
Bulgaria Eastern Europe 39.16 17.64 14.62 21.56 12.46 10.70 14.98
Slovenia Eastern Europe 38.86 17.75 14.70 21.70 12.56 10.79 15.12
Croatia Eastern Europe 38.29 17.94 14.86 21.97 12.76 10.94 15.38
Vietnam Asia 35.04 19.12 15.79 23.59 13.94 11.87 17.00
Morocco Africa 34.31 19.40 16.00 23.98 14.22 12.08 17.39
Latvia Eastern Europe 34.13 19.47 16.06 24.08 14.29 12.14 17.50
Estonia Eastern Europe 34.05 19.50 16.08 24.12 14.32 12.16 17.54
Oman Middle East 32.14 20.27 16.67 25.22 15.08 12.75 18.64
Nigeria Africa 27.60 22.29 18.18 28.27 17.11 14.26 21.68
Uruguay Latin America 23.27 24.56 19.81 32.03 19.38 15.89 25.44
Venezuela Latin America 18.61 27.53 21.81 37.77 22.34 17.90 31.18
Kenya Africa 15.16 30.26 23.53 44.59 25.07 19.61 38.01
Paraguay Latin America 8.89 37.34 27.33 n/a 32.16 23.41 n/a