Pricing of Eco-Labels for Salmon in UK Supermarkets
37
DUKE ENVIRONMENTAL AND ENERGY ECONOMICS WORKING PAPER SERIES organized by the NICHOLAS INSTITUTE FOR ENVIRONMENTAL POLICY SOLUTIONS and the DUKE UNIVERSITY ENERGY INITIATIVE Pricing of Eco-Labels for Salmon in UK Supermarkets Frank Asche* omas A. Larsen‡ Martin D. Smith§ Geir Sogn-Grundvag‡ James A. Young†† Working Paper EE 13-02 May 2013 * Department of Industrial Economics, Risk Management and Planning, University of Stavanger ‡ Norweign Institute of Food, Fisheries and Aquaculture Research § Nicholas School of the Enviroment, Duke University †† Stirling Management School, University of Stirling e Duke Environmental and Energy Economics Working Paper Series provides a forum for Duke faculty working in environmental, resource, and energy economics to disseminate their research. ese working papers have not necessarily undergone peer review at the time of posting.
Transcript of Pricing of Eco-Labels for Salmon in UK Supermarkets
DUKE ENVIRONMENTAL AND ENERGY ECONOMICS WORKING PAPER SERIESorganized by the
NICHOLAS INSTITUTE FOR ENVIRONMENTAL POLICY SOLUTIONSand the
DUKE UNIVERSITY ENERGY INITIATIVE
Pricing of Eco-Labels for Salmon in UK Supermarkets
Frank Asche*Thomas A. Larsen‡Martin D. Smith§ Geir Sogn-Grundvag‡James A. Young††
Working Paper EE 13-02May 2013
*Department of Industrial Economics, Risk Management and Planning, University of Stavanger‡ Norweign Institute of Food, Fisheries and Aquaculture Research§ Nicholas School of the Enviroment, Duke University†† Stirling Management School, University of Stirling
The Duke Environmental and Energy Economics Working Paper Series provides a forum for Duke faculty working in environmental, resource, and energy economics to disseminate their research.
These working papers have not necessarily undergone peer review at the time of posting.
Pricing of Eco-‐Labels for Salmon in UK Supermarkets
Frank Asche (a) Thomas A. Larsen (b) Martin D. Smith (c) Geir Sogn-‐Grundvåg (b) James A. Young (d) (a) Department of Industrial Economics, Risk Management and Planning, University of Stavanger, Ullandhaug, 4036 Stavanger, Norway. (b) Nofima – Norwegian Institute of Food, Fisheries and Aquaculture Research, Muninbakken 9-‐13, PBox 6122, 9192 Tromsø, Norway. (c) Nicholas School of the Environment, Duke University, Durham, NC 27701, USA. (d) Stirling Management School, University of Stirling, Scotland FK9 4LA.
E-‐mail addresses: (F Asche), geir.sogn-‐[email protected] (G Sogn-‐Grundvåg), [email protected] (T A Larsen), [email protected] (M D Smith), [email protected] (J A Young)
May 2013
Abstract Eco-‐labels are important features of many natural resource and food markets. They certify that a product has a desirable intrinsic quality, typically related to a public good such as being sustainably produced. In an increasing number of markets, consumers can choose between different labels that certify different attributes. Two issues that have received limited attention are whether pricing varies across different eco-‐labels and to what extent different retailers have adopted different pricing strategies for eco-‐labels. In this paper we investigate these issues by estimating a hedonic price model for salmon sold in Glasgow, UK for eight different retail chains, two eco-‐labels, and one label of origin. The results show substantial variation in the prices of the different eco-‐labels and that eco-‐label premiums vary across retail chains. Specifically, salmon certified with the Marine Stewardship Council label carries a high premium in low-‐end retail chains but no statistically significant premium in the high-‐end chains. Failure to account for retailer heterogeneity will over-‐ or under-‐estimate the premium. In contrast, premiums for organic certification are similar in magnitude across retailer types. The authors thank Lori S. Bennear for helpful discussions, Duncan J. Young for meticulous data collection and the Norwegian Fishery and Aquaculture Industry Research Fund and the Norwegian Ministry of Fisheries and Coastal Affairs for financial support.

1
1. Introduction
Eco-‐labels have become increasingly important product attributes in many natural
resource and food markets. Like other certification schemes, eco-‐labels attempt to solve
asymmetric information problems by signaling that the product or its production
process has some intrinsic quality that is otherwise difficult for the consumer to
observe. However, eco-‐labels are not just about solving asymmetric information
problems because they are typically affixed to impure public goods. When consumers
can choose an impure public good that jointly produces a private good and an
environmental public good, welfare can increase or decrease, depending on the
responsiveness of consumers to the environmental attribute (Kotchen 2006).
Understanding consumer demand for eco-‐labels thus is an important step in evaluating
the overall potential for markets to provide public goods.
While the availability of particular choices varies across markets, consumers of eco-‐
labeled goods often can buy products that are certified as sustainably or organically
produced or not containing specific ingredients that are perceived to be harmful to the
environment. A number of studies have used survey or experimental data to show that
many consumers are willing to pay for traits certified by eco-‐labels. Examples include
sustainably harvested fish and forestry products (Wessells et al. 1999; Johnston et al,
2001; Aguilar and Vlosky, 2007), organically grown food (Bond, Thilmany, and Keeling
Bond 2008; Lusk and Briggeman 2009), fair trade (De Pelsmacker, Driesen, and Rayp
2005;), and contains no genetically modified (GM) materials (Loureiro and Hine 2002;
Lusk et al. 2005). There is also substantial evidence that consumers prefer domestic to
2
imported products (Alfnes and Rickertsen, 2003; Lusk and Anderson, 2004). 1
In general, it is costly to provide the intrinsic value associated with an eco-‐label.
Theoretically, an eco-‐label will only be supplied if the higher willingness-‐to-‐pay
translates into a positive price premium (Gudmundsson and Wessells, 2001; Sedjo and
Swallow, 2002). Somewhat surprisingly, there are few studies showing that eco-‐labels
actually result in a price premium. Among the exceptions are Teisl, Roe and Hicks
(2002), who show that a dolphin-‐safe tuna label increases demand for the eco-‐labeled
product in a demand system and Roheim, Asche and Insignares (2012) and Sogn-‐
Grundvåg, Larsen and Young (2013), who show that the Marine Stewardship Council
(MSC) eco-‐label produces a price premium in the London area and in Glasgow, UK,
respectively. While most of the literature has focused on demand for eco-‐labels used to
signal quality, there is a growing interest in eco-‐labels used to screen products. Hallstein
and Villas-Boas (2013) show that in California the use of wallet cards (a form of third-‐
party screening that provide purchasing recommendations) significantly reduced
seafood purchases of species with a yellow label, but purchases of species with red or
green labels were unchanged.
Despite the growing literature on eco-‐labels, two issues that have received little
attention are: 1) the price premiums when consumers can choose between products
with different eco-‐labels that signal similar intrinsic qualities and 2) the potential for
retailer markup strategies to obscure the true price premium. An exception to the first
issue is Onazaka and Thilmany McFadden (2011), who investigated the willingness-‐to-‐
1 We use the term eco-‐label to refer to all of these cases, recognizing that some of these labels attempt to signal public good attributes that are non-‐environmental social objectives and/or private attributes related to perceived health benefits.
3
pay for, respectively, organic, fair trade, carbon footprint and production location using
stated preference survey data. They found different preferences for the different eco-‐
labels. Moreover, while some combinations of eco-‐labels may enhance willingness-‐to-‐
pay, others led to a discount.
In this study, we investigate whether actual retail prices vary across different eco-‐labels
for salmon, and whether the eco-‐label premium varies by retailer. To quantify price
premiums, we use a unique data set of 6,618 weekly price observations of a wide range
of salmon products sold in eight UK retail chains. In contrast to scanner data, which
typically do not include information on eco-‐labels, our data allow us to access all
attributes of each product, including two eco-‐labels (organic, MSC) and one country of
origin label (Scottish).2 We also are able to study products that are not bar-‐coded and
sold as fresh.
Our methodological approach is to estimate hedonic price models, which have been
used to quantify the value of various seafood product attributes at the landing point
(McConnell and Strand, 2000; Kristofersson and Rickertsen, 2004), the wholesale level
(Asche and Guillen, 2012) and the retail level (Roheim, Asche and Insignaris, 2011;
Sogn-‐Grundvåg, Larsen and Young, 2013). These studies typically estimate a single
parameter for each product attribute. To capture potential differences in pricing
strategies across retailers for the different eco-‐labels, we introduce a set of interaction
variables in our model.
2 Roheim, Asche and Insignaris (2011) had to augment their scanner data with store observations to determine which products carried the MSC label.
4
The paper is organized as follows. In the next section, we provide background on eco-‐
labels for seafood and describe the data set in section 3. Section 4 shows the model
specification, section 5 reports the empirical results, and we offer concluding remarks in
the final section.
2. Background
According to the Food and Agriculture Organization of the United Nations (FAO), more
than 50% of the world’s fisheries can be characterized as fully utilized and another 32%
can be characterized as overfished or recovering (FAO 2011). The prevalence of
overfishing and the globalization of the seafood trade raise concerns not only about
whether fish stocks are currently poorly managed but also whether some seafood
exporting countries have the institutional capacity to govern their resources effectively
in the future (Smith et al. 2010). Moreover, in some cases, sub-‐optimal management may
result from institutional arrangements that empower the industry that is being managed
in the regulatory process (Boyce 2010).3 As a result, decisions about what is best for the
resource are replaced by decisions about what is best for those utilizing the resource. To
allow consumers a voice, certification programs for sustainably managed resources and
eco-‐labeled products derived from those resources have been introduced in various
forms (Wessells et al, 1999).
The most successful eco-‐label in fisheries so far, certainly in terms of the number of
fisheries certified, is the MSC. Since the first capture fishery was certified as sustainable
against the MSC´s standards in 2000, the number of certified fisheries has grown to 189
3 For instance, Homans and Wilen (1997) provide a model, in a different context, where managers´ decisions are treated as endogenous.

5
as of January 2012 (MSC, 2013). While recent studies confirm that there is an economic
premium associated with the MSC-‐label (Roheim, Asche and Insignaris, 2012; Sogn-‐
Grundvåg, Larsen and Young, 2013), the label is not without its controversies. One view
is that MSC is not worth the cost of being certified because there is no premium
(Andeson et al, 2005; Washington, 2008). The most serious concern is that fisheries
management is not necessarily improved in fisheries certified by the MSC-‐label (Jaquet
et al, 2010; Gutièrrez et al, 2012). One unique feature of the MSC label is that it applies to
products from an entire fishery for a common-‐pool resource, not simply to products
from a subset of the firms in an industry. This all-‐or-‐nothing approach to solving a
commons problem and providing public goods at the same time (e.g. restricting the use
of destructive fishing gear) raises questions about whose behavior the label purports to
change and how the premium is transmitted to these agents.4 Another controversy in
the literature is whether eco-‐labels, including MSC, act as trade barriers and deny
market access (Salzman 2007). In developing countries, seafood eco-‐labeling raises
questions about distributional consequences because labeling requirements may
disadvantage small operations relative to large ones that have more capacity to manage
their supply chains (Tran et al. 2013). MSC’s perceived lack of value was underscored in
January 2012 as the leading Alaskan salmon processors and thereby the Alaska Seafood
Marketing Institute withdrew from certification after the 2012 season (Intrafish, 2012;
Alaska Seafood Marketing Institute, 2012).
4 What constitutes a “fishery” can be a matter of discussion and further complicate the MSC label.
6
Until recently, there has been no direct sustainability certification for seafood from
aquaculture.5 To provide a signal of environmental quality similar to MSC, some farmed
seafood is marketed and labeled as organic. Despite similarities, organic farmed seafood
differs from wild-‐caught MSC-‐labeled seafood in that the environmental problems are
different (the commons problem, destructive gear, and bycatch for MSC compared to
nutrient pollution, antibiotic use, and pesticides in feed for aquaculture), and consumers
may perceive private health benefits of consuming organic compared to conventional.
Although there have been a few studies concerned with the marketing and demand for
organic salmon (Aarset and Young, 2004; Aarset et al, 2004;), we are not aware of any
that mirror the detailed price and other product observations incorporated here and
thus none with comparable identification of price premiums on organically labeled
seafood. Nevertheless, one would expect a premium, as other attributes are more costly
to provide for an organic product, e.g. salmon coloring (Alfnes et al, 2006; Forsberg and
Guttormsen, 2006).
County of origin labeling tends to focus on consumer demand for private attributes such
as food safety rather than public environmental goods (Loureiro and Umberger 2007).
For seafood, generic marketing organizations like the Alaska Seafood Marketing
Institute and the Norwegian Seafood Council have invested substantially in country of
origin labeling and marketing of salmon. Kinnucan and Myrland (2002) provide
evidence that these efforts are successful in producing premiums. Thus, isolating a
5 In 2010 the Aquaculture Stewardship Council was established as MSC´s cousin eco-‐label, and certification commenced (is it perhaps more precise to say something like: According to ASC (http://www.asc-‐aqua.org), tilapia was the first ASC-‐certified species launched on the market in 2012.) in 2012. The Global Aquaculture Alliances backs a Best Aquaculture Practice that has been awarded for two years, but no studies exist with respect to its effect.

7
premium for eco-‐labeled seafood must at least control for the potentially confounding
effect of country of origin labeling.
Seven different types of salmonids are marketed; pink, chum, sockeye and chinook are
primarily wild and Atlantic, coho and trout are primarily farmed.6 There have always
been different premiums associated with the different species. The wild species pink
and chum are often known as low-‐value salmon, while chinook, sockeye and wild coho
are high value salmon. Traditionally, Atlantic salmon has also been regarded as high-‐
value salmon. Asche, Bremnes and Wessells (1999) and Asche et al (2005) quantify the
price hierarchy and show that it is stable. It is also of interest to note that farmed was a
positive attribute when the salmon farming industry was emerging (Holland and
Wessells, 1998), but it later became a negative attribute (Roheim, Sudhukaran and
Durham, 2012). Overall, this literature highlights the critical importance of controlling
for salmon species and whether it is farmed or wild-‐caught in isolating eco-‐label
premiums.
3. Data
The data for this study were collected by personal observation of a wide range of fresh,
chilled and frozen farmed and wild salmon products in eight outlets representing eight
different retail chains located in Glasgow, Scotland, UK.7 The eight retail chains are Asda,
Coop, Lidl, Marks & Spencer, Morrisons, Sainsbury’s, Tesco and Waitrose. Whilst there is
some variation in the size of the stores sampled, the sample represents primarily
6 The trout is primarily large rainbow trout and also known as salmon trout (Asche et al, 2005) or steelhead (Olsson and Criddle, 2008). Wild coho is also available but in substantially less quantities than farmed. Wild Atlantic may also be found but in even smaller volumes and seldom, if ever, in large retail stores. 7 Every product was purchased initially, and the packaging was retained. On subsequent visits, prices were recorded and packaging was spot checked for consistency with packaging from earlier time periods.

8
medium and large stores but not the smallest. Although the smallest convenience outlets
show the greatest price variability, no systematic deviations from each chain’s standard
prices were found. Collectively these retail chains accounted for 85.3% of the UK retail
fish market in 2012 (Nielsen Scantrack, 2013). Whilst data collection through personal
observation necessarily restricts the number of outlets that can be visited, we argue that
this limitation is not a major concern because chains appear to coordinate their pricing
strategies for all outlets in a region (Pesendorfer 2002). In our case, the assumption of a
chain-‐level standard pricing policy is consistent with anecdotal observations of prices at
other stores. Hence, we assume that the data set provides an unbiased picture of the
pricing of the products in these UK chains. The data collection method has the advantage
that all visible product attributes can be observed and analysed, including attributes that
are not reported in other types of data or that are generally too expensive to acquire for
all but commercial purposes. As noted above, Roheim, Asche and Insignaris (2012)
could not obtain information on eco-‐labels from their scanner data and did not have
access to the different individually named store brands.
The observations conducted in Glasgow, the fourth largest city in UK, were done during
the second half of the week when the product range and sales volumes normally are at
their highest. The continuous weekly observations started November 14th, 2012 and the
latest observation included was August 20th, 2013, a period of 41 weeks. A total of 223
salmon products were included in the study. Information regarding the physical product
included method of production as in wild catch or farmed, product form (frozen, chilled
etc), the mode of processing, brand, eco-‐label, weight, and price per kilo. Due to product
line deletions and additions during the observation period, the data set is not a balanced
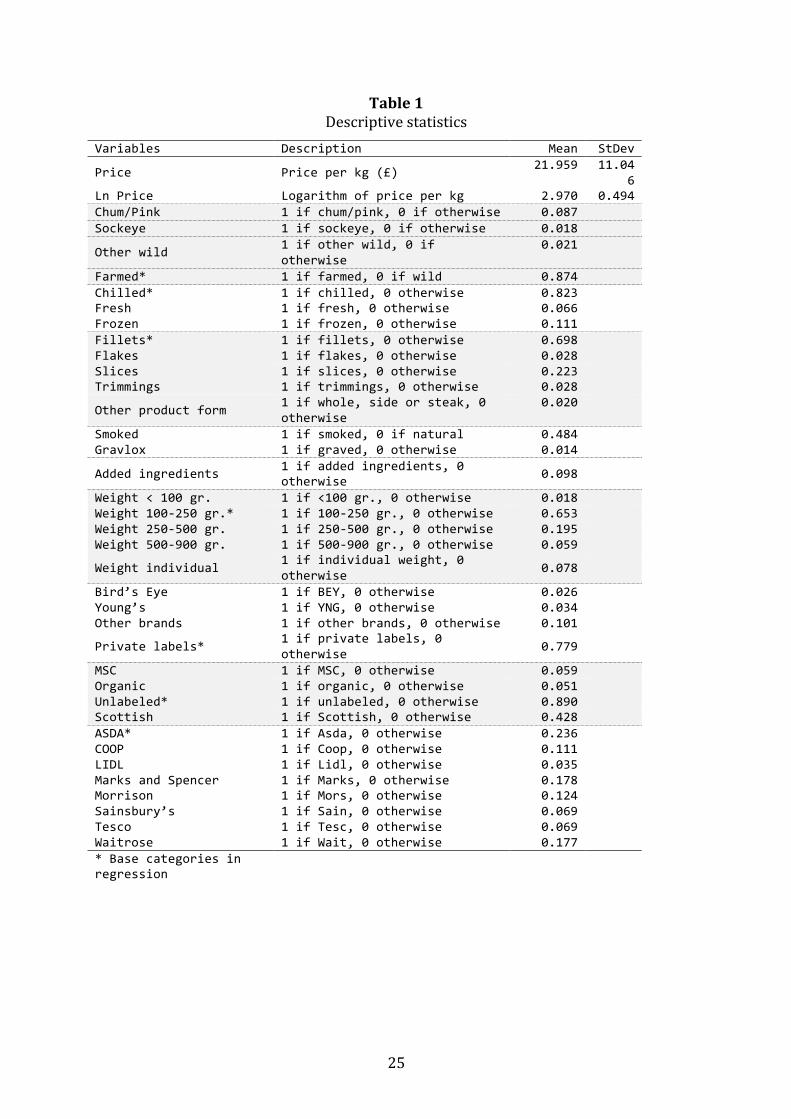
panel, resulting in a total of 6,618 observations. Descriptive statistics on variables

9
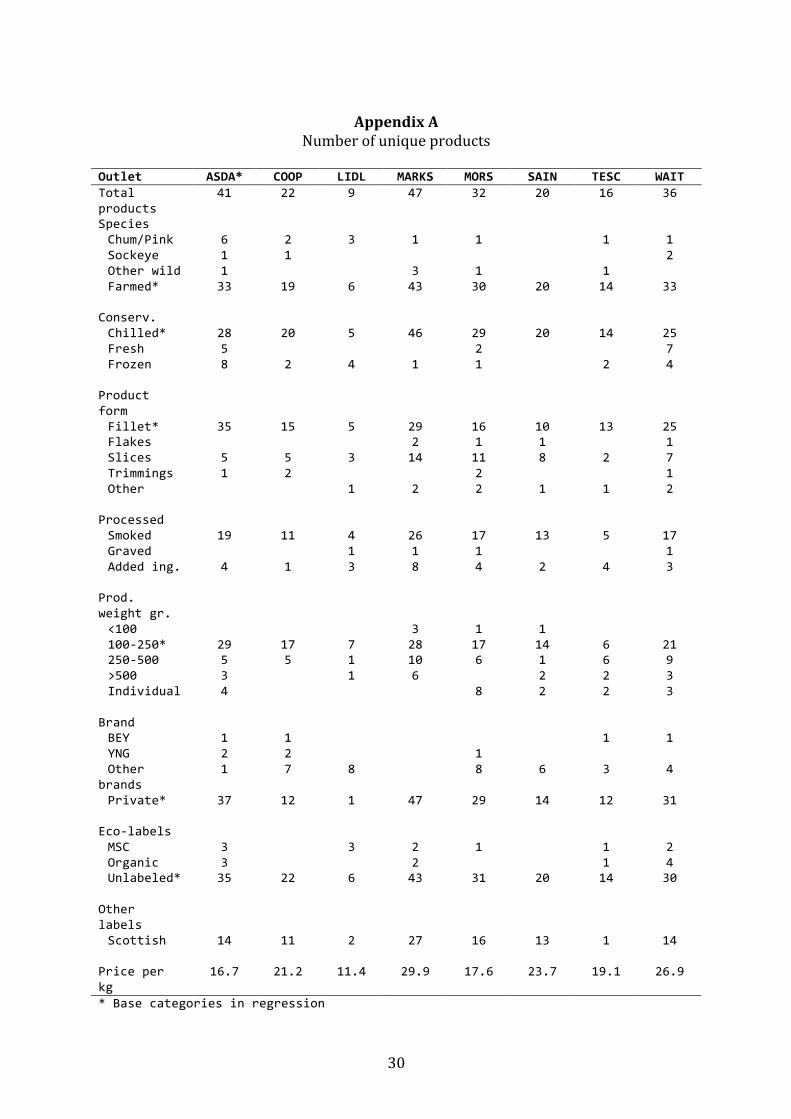
included in the study are listed in table 1. Details on products across supermarkets are
provided in appendix A. None of the eco-‐labels are carried by all retail chains. The MSC-‐
label is not carried by Coop and Sainsbury,8 only three chains carry salmon labelled as
organic (Asda, Marks & Spencer and Waitrose), and all chains but Lidl carry salmon
labelled as Scottish.
4. Model specification
Our model specification follows Rosen (1974) and uses a hedonic price model. The
regression model specifies the price of a product as a function of the product attributes:
!!" = ! !!,… , !! , (1)
where !!" is the price of product i at time t, and !!,… , !! is a vector of attributes that
determine the price of the product. This study uses a log-‐linear functional form, meaning
that parameter estimates are interpreted as percentage deviations from a base product.
The basic specification (Model 1) is:
ln!!" = ! + !!!!!! !! + !!!
!!! !! + !!!!!! !! + !!" . (2)
Dummy variable coding was used on the parameters !! , !! ,!! for respectively the
product attributes, the retailer attributes and the eco-‐label attributes listed in table 1,
which follows previous hedonic literature for seafood products (McConnell and Strand
2000; Roheim et al. 2011; Asche and Guillen 2012; Sogn-‐Grundvåg, Larsen and Young
2013). The base product has attributes that are the excluded categories in the regression
to avoid the dummy variable trap. While we do observe the own-‐ or private labels for
each of the retailers, we cannot separate them from the retailer dummy. Hence, with
8 That there are no MSC-‐labeled salmon products at Sainsbury is a surprising, as they carry MSC-‐labeled products for other species (Sogn-‐Grundvåg, Larsen and Young, 2013). However, lack of MSC-‐labeled salmon may be an indication that the retail chains also have different strategies for different products.
10
respect to brands we explicitly specify the two leading brands, Birdseye and Young´s
Bluecrest, and have two additional groups, other brands and store brands.
In addition to this basic model, we introduce a set of interaction dummies between the
eco-‐labels and the retailer dummies. In the most general form, this augments the model
to:
ln!!" = ! + !!!!!! !! + !!!
!!! !! + !!"!!!! !!"!
!!! + !!" . (3)
Here, the parameter fkl provides the interaction effect, showing how an eco-‐label is
enhanced (positive value) or discounted (negative value) relative to the base case for
any retailer. We estimate four versions of equation (3) (Models 2-‐5). Model 2 has all of
the interaction variables, while models 3-‐5 have interaction variables for respectively
one of the eco-‐labels or Scottish origin and the results will be reported in the appendix..
The econometric analysis was conducted using STATA with robust standard errors.9
A feature that has not received attention in the earlier literature on the value of
ecolabels in hedonic price models is that the standard errors are not likely to be
independent across units, but rather independent across some clusters of units and
correlated within those clusters. It is well known that the pricing strategies of
supermarkets in general limit price variation due to menu costs, and increasingly such
features are present also for seafood (Kvaløy and Tveteras, 2008; Larsen and Asche,
2011). This leads to a potential for correlation among product types, conservation
forms, or retailers. This correlation can potentially lead to substantial biases in the
estimated standard errors (Moutlon, 1990; Wooldridge, 2003). Because there is no
9 White’s test on homoscedasticity was rejected (MacKinnon and White, 1985).

11
obvious criterion to select the unit of clustering, we will estimate the models with
different clustering units to evaluate the impact.
5. Empirical Results
In all the models estimated, the base product is a farmed, chilled salmon fillet sold at
Asda (an inexpensive retail chain). The base product also is un-‐processed, has no eco-‐
label (neither MSC nor organic), carries the supermarket’s own private label, has a
package size between 100 and 250 grams, is not labelled “Scottish”, and does not come
with any sauce, dressing or other value added ingredients that might significantly
reduce the product’s fish content. There are a number of potential dimensions in which
the errors can be clustered. The clustering can simply follow the species, the product
form, or the type of processing/preservation (e.g. salted). Or, clusters can be
combinations of these with the most general being at the individual product level,
indicating a similar pricing process for each product, but with dependencies in the
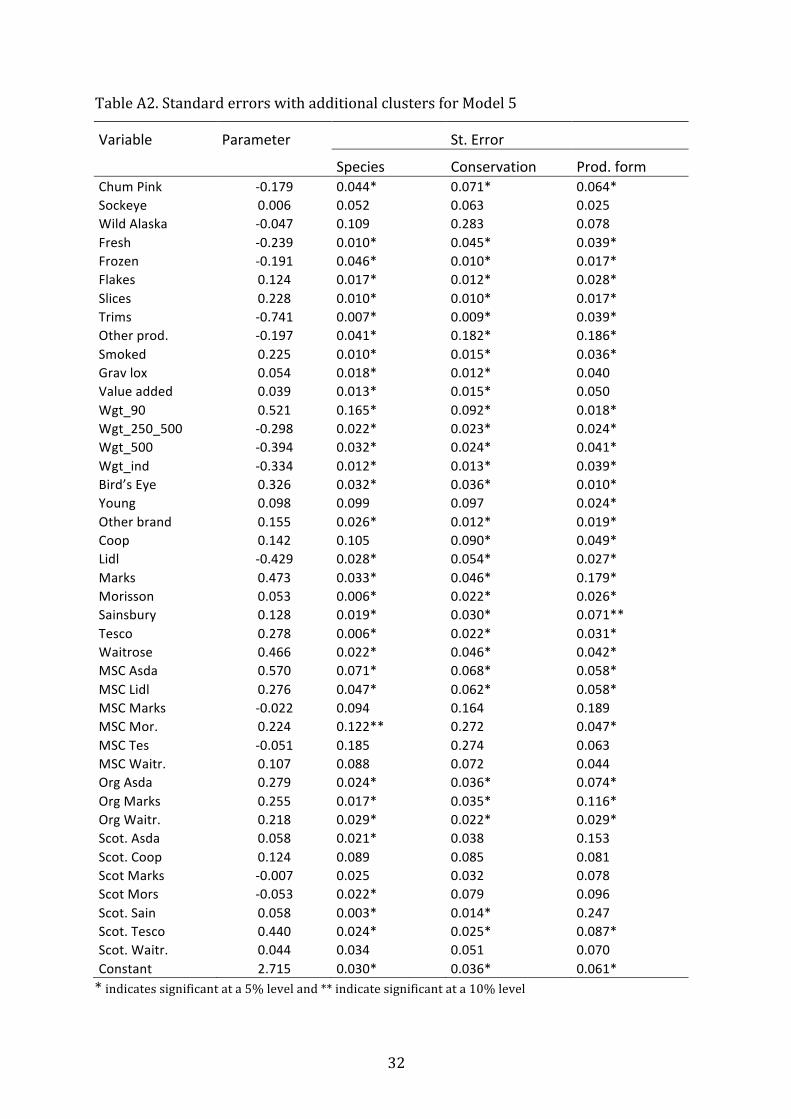
pricing for each product. Models with all these clusters have been estimated. For brevity,
we report and discuss the clusters by retailer, by product and a four dimensional cluster
containing species, product form, and type of processing/preservation in the paper.
Standard errors for clusters by other variable are reported in the appendix. The
reported cluster dimensions are the dimensions where the estimated standard errors
are most influenced (retailers with 8 clusters, products with 233 clusters and the four
dimensional one with 57 clusters).
Before the results are discussed, there is one additional specification issue to address: to
what extent there are systematic time patterns in the prices such as a trend or
seasonality. To investigate this issue, we estimated the models with a set of weekly and
12
a set of 4-‐weekly dummy variables.10 Although the models with the seasonal dummies
use additional degrees of freedom, the qualitative results are consistent with those in
Models 1-‐5. Table 2 reports F-‐tests for the null hypothesis that that these seasonal
dummies are zero without clustered errors. The null hypothesis cannot be rejected in
any of the cases.11 The F-‐tests are consistent with not including the weekly or 4-‐weekly
dummies in our preferred specifications; price deviations appear to be idiosyncratic and
not due to a systematic seasonal or trend component. This finding is not surprising
given that all products are packaged and most products are processed, exposing
systematic price changes to menu costs. Price fluctuations of individual products within
a store could reflect inventory management or loss leader pricing strategies.
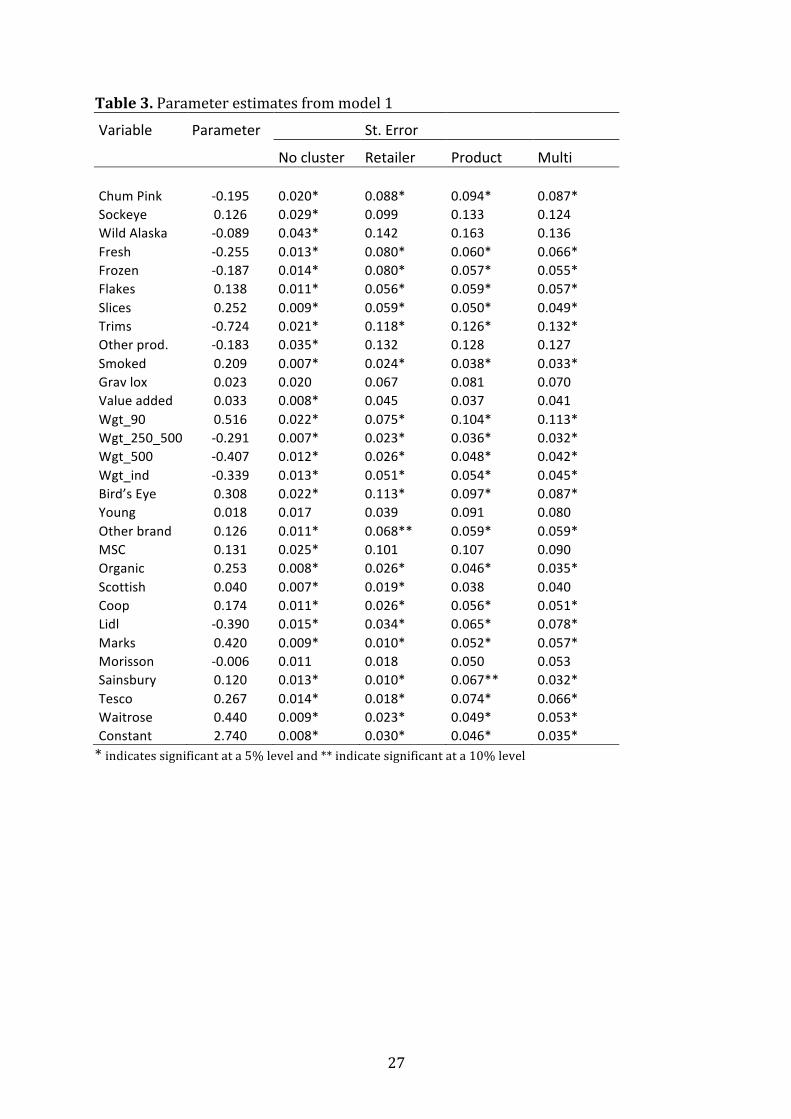
Model 1 contains baseline labeling premium estimates with no interaction dummies.
Table 3 reports the parameter estimates from this model, with the estimated
parameters in the second column, unclustered robust standard errors in the third
column and three different clusterings of the standard errors in the following columns.
The model has an R2 of 0.808, indicating good explanatory power. In the model with no
clustering of the errors, most parameters are significant at a 5% level. The exceptions
are that there is no evidence of any premiums associated with Young´s brand or for the
value-‐added product gravlax, and the retail chain Morrisons does not have a price level
that is significantly different from Asda. The clustered errors are all more conservative,
and these attributes remain statistically insignificant with clustering.
10 Although we have data for only one year, these dummies could potentially capture a within year trend as well as seasonality. 11 As the clustered standard errors are more conservative, the results are similar

13
Overall, when the errors are clustered, most attributes remain statistically significant.
Significance vanishes for some attributes, including some of the labels as we discuss
below. For other clustering alternatives that are reported in the appendix, the results
are somewhere in between what is reported with the unclustered errors and the three
cluster dimensions that are reported in Table 3. The conclusion with respect to
statistical significance is virtually identical for the three reported clusters, and for the
product attributes dimension and the multi-‐cluster dimension, the standard errors are
fairly close. This suggests that the retailer clustering captures a large part of the
correlation, but that there is also some correlations in other dimensions that the other
cluster dimensions are necessary to capture.
As expected, there is a negative premium for the wild species chum and pink, and this
result holds with all error specifications. There seems to be a positive premium
associated with sockeye, supporting the notion that there is a preference for wild
salmon. However, this result is not robust across cluster specifications. For the wild
salmon where species is not listed, there is a negative premium, though not as large as
for chum and pink, and it becomes statistically insignificant when the errors are
clustered.
The portion-‐size and product form attributes largely conform to expectations. For
portion size, smaller package sizes command a larger price premium per kilogram as
expected. Slices are a premium product, trimmings are discounted heavily, added
ingredients receive a small premium, and other product forms (not specified) are sold at
a modest discount. These attributes are always statistically significant.
14
Results from retailer dummies are consistent with our prior expectations of retailer
price hierarchies. There is a significant negative premium associated with Lidl, a
discount chain, no premium associated with Morrison, and all of the other chains
command a higher price level than Asda. As expected, the high-‐end retail chains Marks &
Spencer and Waitrose have the highest general price levels. Results across model
specifications are robust.
For all the eco-‐labels, there is a statistically significant premium in the specification with
robust standard errors. The MSC premium is 13.1%, which is very close to the 14.2%
reported for Alaska Pollock by Roheim, Asche and Insignaris and the 10% reported for
haddock by Sogn-‐Grundvåg, Larsen and Young (2013). The premium is higher for
organic at 25.3%. Scottish origin has a premium of 4%, which is smaller than the eco-‐
label premiums but may still be significant in a price competitive market. With all the
reported clusters, the MSC attribute becomes insignificant, as does the Scottish origin in
two of the cluster dimensions. This result suggests that there is substantial correlation
in these dimensions that must be accounted for when evaluating the impact of the
ecolabels. In all specifications, an F-‐test for the hypothesis that the premium is equal for
the three ecolabels can be rejected with p-‐values less than 0.001. Hence, there is
evidence that the premium varies by label.
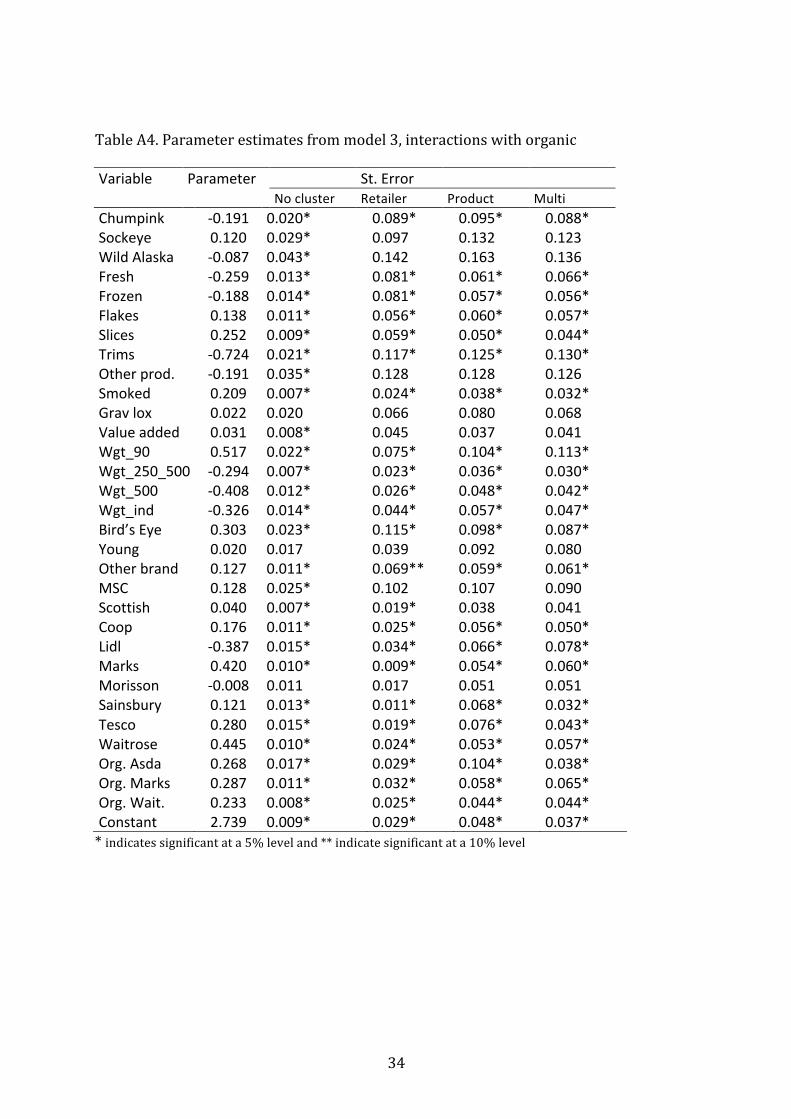
In Models 3-‐5, we introduce different combinations of interactions of the eco-‐labels and
origin labels with retailers. The base eco-‐label and origin label coefficients that are
included in Models 3-‐5 (reported in the appendix) are highly robust and quantitatively
similar to those in Model 1.

15
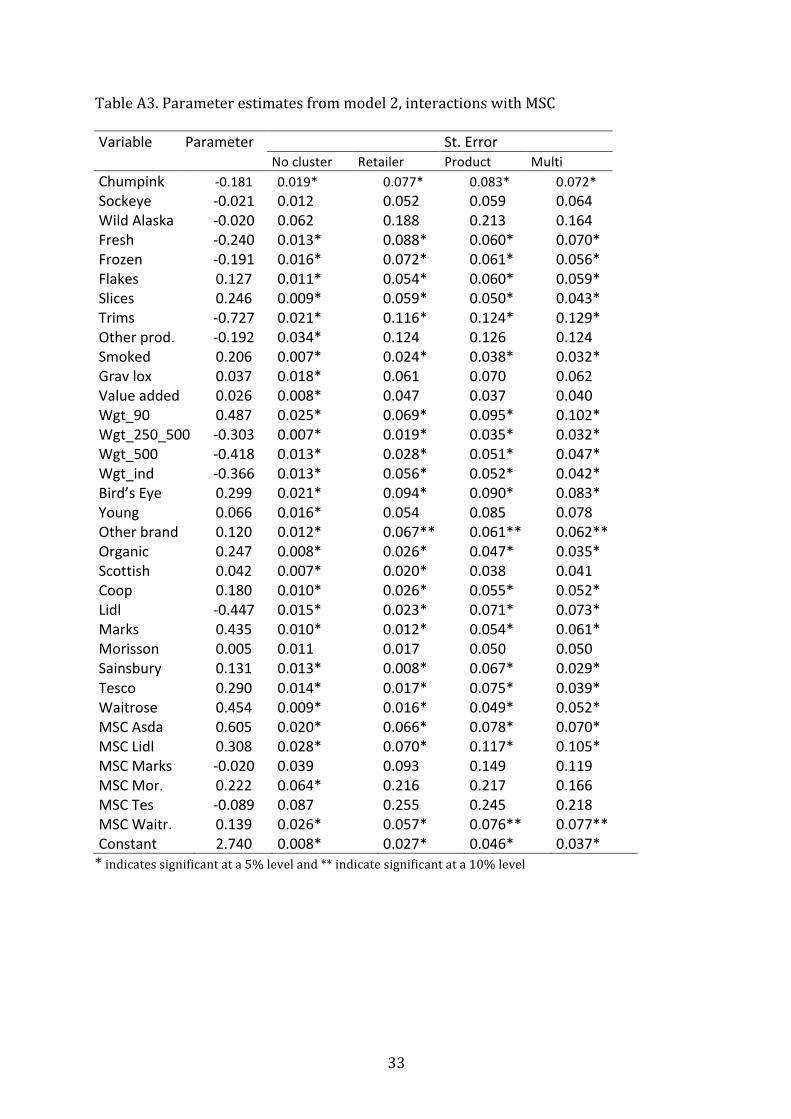
Model 2 includes interaction dummies for the tree types of labeling. The R2 in this model
increases to 0.817. When disregarding the lables, the model largely confirms the results
from Model 1 for the different attributes, and also with respect to the impact of the
clusters. The interaction terms indicate that eco-‐labels have a significant premium for
some retailers, and there is substantial variation in pricing strategies across different
retail chains for the various labels. The variation is largest for the MSC label; the
estimated premium varies from negative but statistically insignificant to 56.6% for Asda.
The variation is almost as large for Scottish salmon, although this variation is primarily
due to Tesco, which charges a 44% premium. For most retailers, there is a moderate or
no premium for Scottish origin on salmon, and for Morrison it is negative. The three
retail chains that carry organic salmon charges relatively similar premiums at around
25%. These results are statistically significant with robust standard errors and across
the different clustering approaches. For MSC, whether the standard errors are treated as
clustered or not makes a substantial difference with respect to statistical significance.
But given clustering at all, the three clustering dimensions reported here yields
relatively similar standard errors. Clustering only by retailer is not as conservative as
the other two clustering dimensions, and yield statistical significance for the labels for a
few more retailers. Again, the estimated standard errors are very similar for the two
most conservative cluster dimensions.
With robust errors, the results indicate that for two of the chains the MSC premium is
not significantly different from zero, and the premiums charged by Lidl at 27.6% and
Asda as 57.0% is very high. All organic premiums are statistically significant, as are all
but one of the premiums for Scottish origin. With the errors clustered in the product
dimension or multi-‐dimensional, only two MSC premiums remain statistically
16
significant. These are the premiums for Asda and Lidl, two of the most discount oriented
chains. When the clustering is only in the retailer dimension, there is a significant
premium associated also with Waitrose. The organic premiums are always statistically
significant. The Scottish premium disappears for all chains but Tesco for the two most
conservative standard errors, while there is a premium for Scottish also at Sainsbury’s
when the errors are clustered only by retailers.
Table 5 reports F-‐tests on the interactions of the label dummies with retailer dummies
for Model 2 with standard errors clustered by product form. With one exception, the
results are the same independently of which standard errors are used. The jointly
column reports tests for the null that all these interaction dummies are jointly zero. The
equality column reports tests for the null in which the interaction parameters are equal;
that is, the null hypothesis is that the model can be reduced to Model 1. All of these
restrictions are rejected with the exception of the null that the organic premiums are
equal. This null hypothesis is rejected if the ordinary robust errors are used. Hence, with
an exception for organic, the different retailers pursue different pricing strategies across
eco-‐labeled and country of origin seafood, where some charge a substantial premium
while others do not charge any premium at all. This result is independent of whether
one accounts for within group correlation by allowing the standard errors to be
clustered or not. However, the premiums are statistically significant for more retailers
when the standard errors are estimated less conservatively.
6. Concluding remarks
This paper provides several important insights with respect to how eco-‐labels are
valued at the retail level of the value chain. The present study is one of very few that has
17
estimated price premiums for eco-‐labels on seafood using real data. Our finding that the
MSC eco-‐label commands an average price premium of 13.1% (from Model 1)
corroborates the findings from two earlier studies that found very similar premiums for
MSC-‐labelled Alaska pollock (Roheim, Asche and Santos, 2012) and haddock (Sogn-‐
Grundvåg, Larsen and Young, 2013) in the UK retail market. Together these three
studies, which cover two different regions in the UK (Glasgow and London) and three
different species (salmon, Alaska pollock and haddock), appear to indicate that in the
UK, the MSC label has gained consumer preference and commands a willingness to pay
for the intrinsic qualities within this label. However, our results also clearly
demonstrate that the eight retailers included in the study have adopted very different
pricing strategies for eco-‐labels, and accordingly, the term “market premium” does not
seems to be appropriate. Moreover, there appears to be substantial correlation for
several attributes and particularly in the retail chain dimension. When accounted for,
this changes several of the intermediate conclusions substantially. It does not materially
change the main conclusions in the preferred and most general model, although there
are significant ecolabel premiums associated with fewer retailers.
Our results on retail pricing of eco-‐labels show a complex picture with important
implications for both research and practice. For other researchers attempting to
quantify premiums for eco-‐labeled products, our findings strongly suggest that the
market impact of eco-‐labels (and origin) can only be assessed accurately when the
pricing strategies of individual retailers are taken into account. Studies based on scanner
data that do not specify individual retail chains may overlook important insights
regarding the nature and heterogeneity of the market for eco-‐labels. In studies that rely
on data from a single retailer, the eco-‐label premium could be over-‐ or underestimated
18
depending on the pricing strategy such as whether the retailer uses the eco-‐labeled
product as a loss leader. This question of external validity helps to account for
differences in measured eco-‐label premiums in the literature. Use of a single retailer also
suggests the potential for customer selection bias in attempts to understand consumer
responses to both environmental signalling and screening (e.g. wallet cards). On the
other end of the spectrum, studies that use data from multiple retailers but that fail to
control for eco-‐label/retailer interactions suffer from omitted variable bias.
The highly segmented nature of the market for eco-‐labels also suggests that individual
retail chains use eco-‐labels as one means of differentiation, at least with respect to their
seafood offerings. This strategy may also serve a broader communications objective in
that emphasis upon the sustainability of the seafood category helps to at least infer, if
not necessarily reflect, similar emphasis in other foods and non-‐foods. In this respect
seafood may be a particularly apposite medium because it encompasses a number of
discrete and very different characteristics. Selling eco-‐labeled seafood may be a part of a
larger corporate sustainability campaign. U.S. retailer Wal-‐Mart reported that 76% of its
seafood sold was third-‐party certified and an additional 8% was pursuing certification
as of January 31, 2012, and the chain set a goal that 100% of its seafood would be
working toward sustainable certification by June 2012.12 Fast food chain McDonald’s
recently announced that 100% of the seafood sold in its 14,000 U.S. restaurants would
be MSC-‐certified.13 Some argue that large brands are pursuing these corporate
sustainability efforts to secure their supply chains for the long term (Dauvergne and
12 http://corporate.walmart.com/global-‐responsibility/environment-‐sustainability/sustainable-‐seafood (Accessed February 11, 2013) 13 http://www.huffingtonpost.com/2013/01/24/mcdonalds-‐fish-‐sustainable_n_2542502.html (Accessed Feburary 11, 2013)

19
Lister 2011). Undoubtedly, companies like Wal-‐Mart and McDonald’s have a stake in
securing large and steady flows of product that could be compromised by unsustainable
practices. However, they also have a stake in projecting positive corporate image.
Sustainable seafood may be a relatively inexpensive way to highlight green practices
because seafood accounts for a small fraction of sales but is prominent in the media.
For labels that are intended to provide producers with incentives to produce
sustainably, the different pricing strategies also raise important questions. For instance,
one may wonder to what extent any premium is passed on to fishers and other earlier
marketing channel actors when the premium varies between zero and 57%, and the
premium is largest for the discount chains. Considering the recent strategic business
decision of the Alaskan industry to drop MSC-‐certification, the premium may simply be
absent, too small, or at best distorted and ill-‐received. In the longer term the
implications of such a move may be significant not least in terms of future candidate
fisheries and retailers’ interpretations of how their sustainable products might best be
marketed.
Questions about how eco-‐label premiums are transmitted through the marketing chain
to the actors who ultimately affect sustainability (fishermen, fish farmers, and fishery
managers) highlight a key limitation of the hedonic approach to price premiums, namely
lack of quantity data. Because we do not observe quantities sold, we do not know
whether high-‐ or low-‐premium pricing strategies move more eco-‐labeled product.
Suppose that the high-‐end retailers sell most of the MSC-‐labeled salmon and that low-‐
end retailers sell little. Because high-‐end retailers have the lowest premiums, then the
average premium passed through to the harvest sector will be low. The opposite would
20
be true if the low-‐end retailers sell most of the MSC-‐labeled salmon. The Alaskan salmon
industry’s decision would seem most consistent with the former. It could even be the
case that retail pricing strategies deliberately discourage the purchase of eco-‐labeled
products; simply including these products in stores and not necessarily selling them
would then be part of projecting a positive corporate image.
The role of eco-‐labels in private provision of public goods is still not well understood.
Our analysis provides one important piece of this puzzle by illustrating the importance
of retailer pricing strategies. The amount of premium, if any, that is transmitted back to
agents that affect environmental outcomes and whether eco-‐labels cause behaviors to
change are still open questions. Moreover, whether consumer expenditures on eco-‐
labeled products crowd out direct contributions to public goods—a mechanism through
which increased demand for a green product can theoretically lower environmental
quality (Kotchen 2005)— and whether private provision can overcome free riding to be
a viable alternative to public provision are all unknowns. Exploring these other links in
the chain are important questions for future research.

21
References Aarset, B. and Young, J.A. (2004) Aquatic foods: options for organic growth? Aquatic
Resources, Culture and Development 1(1):1-9. Aarset, B., Beckmann, S., Bigne,J., Beveridge, M.C., Bjørndal, T., Bunting, M.J., McDonagh, P., Mariojouls, C., Muir, J.F., Prothero, A., Reisch, L.A., Smith, A., Tveteras, R. and
Young, J.A. (2004) The European Consumers' Understanding and Perceptions of the 'Organic' Food Regime: The Case of Aquaculture. British Food Journal. 106(2):93- 105.
Aguilar, F. X. and R.P. Vlosky (2007). “Consumer Willingness to Pay Price Premiums for Environmentally Certified Wood Products in the U.S,” Forest Policy and Economics 9: 1100–12.
Alaska Seafood marketing Institute (2012) Alaska Salmon Processors Clarify MSC Salmon Position, 19.05.12, www.pressroom.alaskaseafood.org/alaska-salmon-processors- clarify-msc-position/ Alfnes, F., Guttormsen, A. G., Steine, G. & Kolstad, K. (2006) Consumers’ willingness to pay
for the color of salmon: a choice experiment with real economic incentives. American Journal of Agricultural Economics, 88, 1050-1061.
Alfnes, F. And K. Rickertsen (2003) European Consumers’ Willingness to Pay for US Beef in Experimental Auction Markets, American Journal of Agricultural Economics, 85, 396-405.
Anderson, R.C., D.N. Laband, E.N. Hansen, and C.D. Knowles (2005). “Price Premiums in the Mist.” Forest Products Journal 55 (6): 19-22.
Asche, F., H. Bremnes and C. R. Wessells (1999) Product Aggregation, Market Integration and Relationships Between Prices: An Application to World Salmon Markets. American Journal of Agricultural Economics, 81, 568-581
Asche, F., Guttormsen, A. G., Sebulonsen, T. and Sissener, E. H. (2005) Competition between farmed and wild salmon: The Japanese salmon market. Agricultural Economics, 33, 333-340.
Asche, F. and J. Guillen (2012) The Importance of Fishing Method, Gear and Origin: The Spanish Hake Market, Marine Policy, 36, 365-369. Bond, C. A., D. Thilmany, and J. Keeling Bond (2008) What to Choose? The Value of Label Claims to Fresh Produce Consumers. Journal of Agricultural and Resource Economics 33(3): 402–427. Boyce, John R. "Putting foxes in charge of the hen-‐house: the political economy of
harvest quota regulations." Environmental and Resource Economics 46.4 (2010): 475-‐493.
Dauvergne, P., & Lister, J. (2011). Big brand sustainability: Governance prospects and environmental limits. Global Environmental Change.
Davidson, R. and J.G. MacKinnon. (2004). Econometric Theory and Methods. Oxford University Press, New York.
De Pelsmacker, P., L. Driesen, and G. Rayp. 2005. Do Consumers Care about Ethics? Willingness to Pay for Fair-Trade Cof- fee. Journal of Consumer Affairs 39(2): 363– 385.
Food and Agricultural Organization of the United Nations (FAO). (2011). The State of World Fisheries and Aquaculture 2010. Fisheries and Aquaculture Department, Rome.
Forsberg, O. I. and Guttormsen, A. G. (2006) Modeling optimal dietary pigmentation strategies in farmed Atlantic salmon: Application of mixed-integer non-linear mathematical programming techniques. Aquaculture, 261, 118-124.

22
Gutièrrez, N., S. R. Valencia, T. A. Branch, D. J. Agnew, J. K. Baum, P. L. Bianchi, J. Cornejo-Donoso, C. Costello, O. Defo, T. E. Essington, R. Hillborn, D. D. Hoggarth, A. E. Larsen, C. Ninnes, K. Sainsbury, R. L. Selden, S.Sistla, A. D. M. Smith, A. Stern-Pirlot, S. J. Tech, J. T. Thorson and N. E. Williams (2012) Eco-Label Convey Reliable Information on Fish Stock Health to Seafood Consumers, PloseOne 7(8): e43765. Doi:10.1371/journal.pone.0043765.
Gudmundsson, E. and C. Roheim Wessells. 2001. “Ecolabeling Seafood for Sustainable Production: Implications for Fisheries Management,” Marine Resource Economics, 15:97-113.
Hallstein, E. and S. B. Villas-Boas, 2013. “Are Consumers Color Blind? An Empirical Investigation of a Traffic Light Advisory for Sustainable Seafood.” Journal of Environmental Economics and Management, forthcoming. Holland, D. & Wessells, C. R. (1998) Predicting Consumer Preferences for Fresh Salmon:
The Influence of Safety Inspection and Production Method Attributes. Agricultural and Resource Economics Review, 27, 1-14.
Homans, F. and J. E. Wilen (1997) A Model of Regulated Open Access Resource Use. Journal of Environmental Economics and Management, 32, 217-243.
Intrafish (2013) Five companies agree to continue using MSC eco-label for Alaska Salmon, 22.10.12.
Intrafish (2012) Alaska Salmon Processors Quit MSC, 18.01.12. Jacquet, J., D. Pauly, D. Ainley, S. Holt, P. Dayton and J. Jackson (2010) Seafood Stewardship in Crisis, Nature, 467, 28-29. Johnston, R.J., C. Roheim Wessells, H. Donath, and F. Asche. (2001) "Measuring Consumer
Preferences for Ecolabeled Seafood: An International Comparison," Journal of Agricultural and Resource Economics, 26:20-39.
Kinnucan, H. W. and Myrland, Ø. (2002) The Relative Impact of the Norway-EU Salmon Agreement: A Mid-term Assessment. Journal of Agricultural Economics, 53, 195-220.
Kotchen, M. J. (2005). Impure public goods and the comparative statics of environmentally friendly consumption. Journal of environmental economics and management, 49(2), 281-‐300.
Kotchen, M.J. (2006) Green markets and private provision of public goods, Journal of Political Economy, 114, 816-‐834.
Kristofersson, D. and K. Rickertsen (2004) Efficient Estimation of Hedonic Inverse Input Demand Systems, American Journal of Agricultural Economics, 86, 1127-1137. Loureiro, M.L., and W.J. Umberger (2007) A choice experiment model for beef: What US
consumer responses tell us about relative preferences for food safety, country-of-origin labeling and traceability. Food Policy 32.4: 496-514.
Lusk, J. L., and J. D. Anderson. 2004. Effects of Country-of-Origin Labeling on Meat Producers and Consumers. Journal of Agricultural and Resource Economics 29(2): 185–205. Lusk, J. L., and B. C. Briggeman. 2009. Food Values. American Journal of Agricultural Economics 91(1): 184–196. Lusk, J. L., M. Jamal, L. Kurlander, M. Roucan, and L. Taulman. 2005. A Meta-analysis of Genetically Modified Food Valuation Studies. Journal of Agricultural and Resource Economics 30(1): 28–44. Marine Stewardship Council (MSC). 2013. Annual Report 2008/09.
http://www.msc.org/documents/msc-brochures/annual-report-archive/MSC-annual-report-2008-09.pdf/view. (last accessed March 25, 2010).
23
MacKinnon, J.G. and H. White. (1985). “Some heteroskedasticity consistent covariance matrix estimators with improved finite sample properties,” Journal of Econometrics, 29: 305-25.
McConnell, K. and I. Strand. (2000). “Hedonic Prices for Fish: Tuna Prices in Hawaii,” American Journal of Agricultural Economics. 82:133-44.
Moulton, B. R. (1990). An illustration of a pitfall in estimating the effects of aggregate variables on micro units. The Review of Economics and Statistics, 334-338.
Nielsen Scantrack, (2013) ‘Retail Market Data’, (accessed March, 2013), [available at: http://www.seafish.org/media/publications/temp_secure/default.asp?FolderSpec=%2Fmedia%2Fpublications%2Ftemp%5Fsecure%2FRetail+Market+Data%2F2013+Neilsen+Retail+Data%2F01%2E+Nielsen+Retail+Reports+to+5th+Jan+2013&sort=2].
Olson, T. K. and K. Criddle (2008) Industrial Evolution: A Case Study of Chilean Salmon Aquaculture, Aquaculture Economics and Management, 12, 89-106.
Onozaka, Y. and D. Thilmany McFadden (2011) Does Local Labeling Complement or Compete with other Sustainable Labels? A Conjoint Analysis of Direct and Joint Values for Fresh Produce Claims. American Journal of Agricultural Economics, 93, 693-706.
Pesendorfer, M. (2002). Retail sales: A study of pricing behavior in supermarkets. The Journal of Business, 75(1), 33-66.
Roheim, C.A., F. Asche, and J. Insignares. 2011. The Elusive Price Premium for Ecolabelled Products: Evidence from Seafood in the UK Market. Journal of Agricultural Economics 62(3):655-668. Roheim, C. A., Sudhakaran, P. O. and Durham, C. A. (2012) Certification of Shrimp and Salmon for Best Aquaculture Practices: Assessing consumer preferences in Rhode Island. Aquaculture Economics and Management, 16, 266-286. Rosen, S. (1974). “Hedonic Prices and Implicit Markets: Product Differentiation in Pure
Competition,” Journal of Political Economy, 82(1): 34-55. Salzman, J. (2008). Informing the green consumer: The debate over the use and abuse of
environmental labels. Journal of Industrial Ecology, 1(2), 11-21. Sedjo, R. and S. Swallow. (2002) “Voluntary Eco-Labeling and the Price Premium,” Land
Economics, 78:272-84. Smith, M. D., C. A. Roheim, L. B. Crowder, B. S. Halpern, M. Turnipseed, J. L. Anderson, F. Asche, L. Bourillón, A. G. Guttormsen, A. Kahn, L. A Liguori, A. McNevin, M.
O’Connor, D. Squires, P. Tyedemers, C. Brownstein, K. Carden, D. H. Klinger, R. Sagarin, K. A. Selkoe (2010) Sustainability and Global Seafood, Science, 327, 784-‐ 786.
Sogn-Grundvåg, G., Larsen, T.A. and Young, J.A. (2013) The value of line-caught and other attributes: An exploration of price premiums for chilled fish in UK supermarkets, Marine Policy, 38 (March), 41-44. Teisl, M.F., B. Roe and R.L. Hicks. (2002). “Can Eco-labels Tune a Market? Evidence from
Dolphin-Safe Labeling,” Journal of Environmental. Economics and Management 43: 339-59.
Tran, N., C. Bailey, N. Wilson, and M. Phillips (2013), Governance of Global Value Chains in Response to Food Safety and Certification Standards: The Case of Shrimp from Vietnam. . Forthcoming, World Development
Washington, S. (2008). Ecolabels and Marine Capture Fisheries: Current Practice and Emerging Issues, GLOBEFISH Research Programme, Vol. 91, Rome, FAO. p. 52.
Wessells, C.R., R. Johnston, and H. Donath. (1999) "Assessing Consumer Preferences for Ecolabeled Seafood: The Influence of Species, Certifier, and Household Attributes," American Journal of Agricultural Economics, 81:1084-1089.

24
White, H. (1980). “A heteroskedasticity-consistent covariance estimator and a direct test for heteroskedasticity,” Econometrica, 48:817-38.
Wooldridge, Jeffery M. "Cluster Sample Methods in Applied Econometrics" The American Economic Review, 93(2), 133-138.
25
Table 1 Descriptive statistics
Variables Description Mean StDev
Price Price per kg (£) 21.959 11.046
Ln Price Logarithm of price per kg 2.970 0.494 Chum/Pink 1 if chum/pink, 0 if otherwise 0.087 Sockeye 1 if sockeye, 0 if otherwise 0.018
Other wild 1 if other wild, 0 if otherwise
0.021
Farmed* 1 if farmed, 0 if wild 0.874 Chilled* 1 if chilled, 0 otherwise 0.823 Fresh 1 if fresh, 0 otherwise 0.066 Frozen 1 if frozen, 0 otherwise 0.111 Fillets* 1 if fillets, 0 otherwise 0.698 Flakes 1 if flakes, 0 otherwise 0.028 Slices 1 if slices, 0 otherwise 0.223 Trimmings 1 if trimmings, 0 otherwise 0.028
Other product form 1 if whole, side or steak, 0 otherwise
0.020
Smoked 1 if smoked, 0 if natural 0.484 Gravlox 1 if graved, 0 otherwise 0.014
Added ingredients 1 if added ingredients, 0 otherwise 0.098
Weight < 100 gr. 1 if <100 gr., 0 otherwise 0.018 Weight 100-‐250 gr.* 1 if 100-‐250 gr., 0 otherwise 0.653 Weight 250-‐500 gr. 1 if 250-‐500 gr., 0 otherwise 0.195 Weight 500-‐900 gr. 1 if 500-‐900 gr., 0 otherwise 0.059
Weight individual 1 if individual weight, 0 otherwise 0.078
Bird’s Eye 1 if BEY, 0 otherwise 0.026 Young’s 1 if YNG, 0 otherwise 0.034 Other brands 1 if other brands, 0 otherwise 0.101
Private labels* 1 if private labels, 0 otherwise 0.779
MSC 1 if MSC, 0 otherwise 0.059 Organic 1 if organic, 0 otherwise 0.051 Unlabeled* 1 if unlabeled, 0 otherwise 0.890 Scottish 1 if Scottish, 0 otherwise 0.428 ASDA* 1 if Asda, 0 otherwise 0.236 COOP 1 if Coop, 0 otherwise 0.111 LIDL 1 if Lidl, 0 otherwise 0.035 Marks and Spencer 1 if Marks, 0 otherwise 0.178 Morrison 1 if Mors, 0 otherwise 0.124 Sainsbury’s 1 if Sain, 0 otherwise 0.069 Tesco 1 if Tesc, 0 otherwise 0.069 Waitrose 1 if Wait, 0 otherwise 0.177 * Base categories in regression

26
Table 2 Sesonality tests
Model Weekly 4-‐weekly
F-‐value
Prob > F
F-‐value
Prob > F
1 0.54 0.993 1.43 0.167 2 0.57 0.986 1.52 0.136 3 0.54 0.993 1.42 0.171 4 0.54 0.993 1.38 0.191 5 0.57 0.986 1.48 0.148
27
Table 3. Parameter estimates from model 1 Variable Parameter
St. Error
No cluster Retailer Product Multi
Chum Pink -‐0.195 0.020* 0.088* 0.094* 0.087* Sockeye 0.126 0.029* 0.099 0.133 0.124 Wild Alaska -‐0.089 0.043* 0.142 0.163 0.136 Fresh -‐0.255 0.013* 0.080* 0.060* 0.066* Frozen -‐0.187 0.014* 0.080* 0.057* 0.055* Flakes 0.138 0.011* 0.056* 0.059* 0.057* Slices 0.252 0.009* 0.059* 0.050* 0.049* Trims -‐0.724 0.021* 0.118* 0.126* 0.132* Other prod. -‐0.183 0.035* 0.132 0.128 0.127 Smoked 0.209 0.007* 0.024* 0.038* 0.033* Grav lox 0.023 0.020 0.067 0.081 0.070 Value added 0.033 0.008* 0.045 0.037 0.041 Wgt_90 0.516 0.022* 0.075* 0.104* 0.113* Wgt_250_500 -‐0.291 0.007* 0.023* 0.036* 0.032* Wgt_500 -‐0.407 0.012* 0.026* 0.048* 0.042* Wgt_ind -‐0.339 0.013* 0.051* 0.054* 0.045* Bird’s Eye 0.308 0.022* 0.113* 0.097* 0.087* Young 0.018 0.017 0.039 0.091 0.080 Other brand 0.126 0.011* 0.068** 0.059* 0.059* MSC 0.131 0.025* 0.101 0.107 0.090 Organic 0.253 0.008* 0.026* 0.046* 0.035* Scottish 0.040 0.007* 0.019* 0.038 0.040 Coop 0.174 0.011* 0.026* 0.056* 0.051* Lidl -‐0.390 0.015* 0.034* 0.065* 0.078* Marks 0.420 0.009* 0.010* 0.052* 0.057* Morisson -‐0.006 0.011 0.018 0.050 0.053 Sainsbury 0.120 0.013* 0.010* 0.067** 0.032* Tesco 0.267 0.014* 0.018* 0.074* 0.066* Waitrose 0.440 0.009* 0.023* 0.049* 0.053* Constant 2.740 0.008* 0.030* 0.046* 0.035* * indicates significant at a 5% level and ** indicate significant at a 10% level

28
Table 4. Parameter estimates from model 5 Variable Parameter
St. Error
No cluster Retailer Product Multi Chum Pink -‐0.179 0.020* 0.075* 0.083* 0.075* Sockeye 0.006 0.013 0.038 0.061 0.061 Wild Alaska -‐0.047 0.061 0.196 0.205 0.166 Fresh -‐0.239 0.013* 0.090* 0.059* 0.067* Frozen -‐0.191 0.016* 0.071* 0.059* 0.055* Flakes 0.124 0.012* 0.058** 0.065** 0.066** Slices 0.228 0.010* 0.067* 0.051* 0.050* Trims -‐0.741 0.021* 0.122* 0.125* 0.131* Other prod. -‐0.197 0.034* 0.125 0.123 0.122 Smoked 0.225 0.007* 0.030* 0.040* 0.031* Grav lox 0.054 0.019* 0.063 0.076 0.061 Value added 0.039 0.008* 0.050 0.037 0.044 Wgt_90 0.521 0.025* 0.064* 0.092* 0.104* Wgt_250_500 -‐0.298 0.007* 0.020* 0.035* 0.032* Wgt_500 -‐0.394 0.013* 0.029* 0.054* 0.048* Wgt_ind -‐0.334 0.014* 0.052* 0.056* 0.044* Bird’s Eye 0.326 0.023* 0.091* 0.096* 0.083* Young 0.098 0.016* 0.041* 0.079 0.068 Other brand 0.155 0.013* 0.072* 0.069* 0.068* Coop 0.142 0.015* 0.040* 0.078** 0.093 Lidl -‐0.429 0.018* 0.026* 0.088* 0.095* Marks 0.473 0.016* 0.035* 0.094* 0.119* Morisson 0.053 0.015* 0.020* 0.070 0.077 Sainsbury 0.128 0.031* 0.021* 0.148 0.144 Tesco 0.278 0.016* 0.020* 0.085* 0.088* Waitrose 0.466 0.012* 0.018* 0.065* 0.073* MSC Asda 0.570 0.022* 0.060* 0.087* 0.086* MSC Lidl 0.276 0.029* 0.074* 0.124* 0.118* MSC Marks -‐0.022 0.040 0.076 0.158 0.137 MSC Mor. 0.224 0.063* 0.226 0.214 0.180 MSC Tes -‐0.051 0.086 0.259 0.241 0.229 MSC Waitr. 0.107 0.026* 0.039* 0.080 0.081 Org Asda 0.279 0.017* 0.032* 0.105* 0.063* Org Marks 0.255 0.016* 0.051* 0.086* 0.106* Org Waitr. 0.218 0.009* 0.025* 0.046* 0.038* Scot. Asda 0.058 0.014* 0.019* 0.084 0.117 Scot. Coop 0.124 0.018* 0.045 0.091 0.087 Scot Marks -‐0.007 0.015 0.034 0.083 0.075 Scot Mors -‐0.053 0.018* 0.030 0.078 0.078 Scot. Sain 0.058 0.032** 0.021* 0.150 0.226 Scot. Tesco 0.440 0.019* 0.063* 0.100* 0.102* Scot. Waitr. 0.044 0.013* 0.027 0.067 0.053 Constant 2.715 0.011* 0.027* 0.061* 0.065* * indicates significant at a 5% level and ** indicate significant at a 10% level

29
Table 5. F-‐tests for model reduction for Model 5 H0 Jointlya Equalityb
F-‐value p-‐value F-‐value p-‐value !!∗!"# 12.97 0.000 9.73 0.000
!!∗!"#$%&' 12.04 0.000 0.19 0.827 !!∗!"#$$%&! 3.57 0.001 3.60 0.002
!!∗!"#,!"#$%&',!"#$$%&! 16.83 0.000
30
Appendix A
Number of unique products
Outlet ASDA* COOP LIDL MARKS MORS SAIN TESC WAIT Total products
41 22 9 47 32 20 16 36
Species Chum/Pink 6 2 3 1 1 1 1 Sockeye 1 1 2 Other wild 1 3 1 1 Farmed* 33 19 6 43 30 20 14 33
Conserv. Chilled* 28 20 5 46 29 20 14 25 Fresh 5 2 7 Frozen 8 2 4 1 1 2 4
Product form
Fillet* 35 15 5 29 16 10 13 25 Flakes 2 1 1 1 Slices 5 5 3 14 11 8 2 7 Trimmings 1 2 2 1 Other 1 2 2 1 1 2
Processed Smoked 19 11 4 26 17 13 5 17 Graved 1 1 1 1 Added ing. 4 1 3 8 4 2 4 3
Prod. weight gr.
<100 3 1 1 100-‐250* 29 17 7 28 17 14 6 21 250-‐500 5 5 1 10 6 1 6 9 >500 3 1 6 2 2 3 Individual 4 8 2 2 3
Brand BEY 1 1 1 1 YNG 2 2 1 Other
brands 1 7 8 8 6 3 4
Private* 37 12 1 47 29 14 12 31
Eco-‐labels MSC 3 3 2 1 1 2 Organic 3 2 1 4 Unlabeled* 35 22 6 43 31 20 14 30
Other labels
Scottish 14 11 2 27 16 13 1 14
Price per kg
16.7 21.2 11.4 29.9 17.6 23.7 19.1 26.9
* Base categories in regression

31
Appendix Table A1. Standard errors with additional clusters for Model 1
Variable Parameter
St. Error
Species Conservation
Product form
Chum Pink -‐0.195 0.059* 0.023* 0.057* Sockeye 0.126 0.058* 0.105 0.061* Wild Alaska -‐0.089 0.049** 0.191 0.150 Fresh -‐0.255 0.027* 0.047* 0.047* Frozen -‐0.187 0.070* 0.040* 0.023* Flakes 0.138 0.023* 0.014* 0.009* Slices 0.252 0.007* 0.004* 0.005* Trims -‐0.724 0.004* 0.008* 0.032* Other prod. -‐0.183 0.050* 0.196 0.196 Smoked 0.209 0.020* 0.013* 0.049* Grav lox 0.023 0.014 0.021 0.025 Value added 0.033 0.022 0.014* 0.025 Wgt_90 0.516 0.178* 0.055* 0.007* Wgt_250_500 -‐0.291 0.025* 0.017* 0.042* Wgt_500 -‐0.407 0.044* 0.022* 0.045* Wgt_ind -‐0.339 0.046* 0.008* 0.045* Bird’s Eye 0.308 0.038* 0.017* 0.030* Young 0.018 0.090 0.047 0.015 Other brand 0.126 0.002* 0.001* 0.044* MSC 0.131 0.054* 0.040* 0.031* Organic 0.253 0.024* 0.026* 0.035* Scottish 0.040 0.008* 0.040 0.071 Coop 0.174 0.048* 0.057* 0.029* Lidl -‐0.390 0.094* 0.097* 0.064* Marks 0.420 0.014* 0.030* 0.055* Morisson -‐0.006 0.019 0.016 0.037 Sainsbury 0.120 0.016* 0.022* 0.031* Tesco 0.267 0.022* 0.017* 0.028* Waitrose 0.440 0.022* 0.041* 0.030* Constant 2.740 0.035* 0.037* 0.021* * indicates significant at a 5% level and ** indicate significant at a 10% level
32
Table A2. Standard errors with additional clusters for Model 5
Variable Parameter
St. Error
Species Conservation Prod. form
Chum Pink -‐0.179 0.044* 0.071* 0.064* Sockeye 0.006 0.052 0.063 0.025 Wild Alaska -‐0.047 0.109 0.283 0.078 Fresh -‐0.239 0.010* 0.045* 0.039* Frozen -‐0.191 0.046* 0.010* 0.017* Flakes 0.124 0.017* 0.012* 0.028* Slices 0.228 0.010* 0.010* 0.017* Trims -‐0.741 0.007* 0.009* 0.039* Other prod. -‐0.197 0.041* 0.182* 0.186* Smoked 0.225 0.010* 0.015* 0.036* Grav lox 0.054 0.018* 0.012* 0.040 Value added 0.039 0.013* 0.015* 0.050 Wgt_90 0.521 0.165* 0.092* 0.018* Wgt_250_500 -‐0.298 0.022* 0.023* 0.024* Wgt_500 -‐0.394 0.032* 0.024* 0.041* Wgt_ind -‐0.334 0.012* 0.013* 0.039* Bird’s Eye 0.326 0.032* 0.036* 0.010* Young 0.098 0.099 0.097 0.024* Other brand 0.155 0.026* 0.012* 0.019* Coop 0.142 0.105 0.090* 0.049* Lidl -‐0.429 0.028* 0.054* 0.027* Marks 0.473 0.033* 0.046* 0.179* Morisson 0.053 0.006* 0.022* 0.026* Sainsbury 0.128 0.019* 0.030* 0.071** Tesco 0.278 0.006* 0.022* 0.031* Waitrose 0.466 0.022* 0.046* 0.042* MSC Asda 0.570 0.071* 0.068* 0.058* MSC Lidl 0.276 0.047* 0.062* 0.058* MSC Marks -‐0.022 0.094 0.164 0.189 MSC Mor. 0.224 0.122** 0.272 0.047* MSC Tes -‐0.051 0.185 0.274 0.063 MSC Waitr. 0.107 0.088 0.072 0.044 Org Asda 0.279 0.024* 0.036* 0.074* Org Marks 0.255 0.017* 0.035* 0.116* Org Waitr. 0.218 0.029* 0.022* 0.029* Scot. Asda 0.058 0.021* 0.038 0.153 Scot. Coop 0.124 0.089 0.085 0.081 Scot Marks -‐0.007 0.025 0.032 0.078 Scot Mors -‐0.053 0.022* 0.079 0.096 Scot. Sain 0.058 0.003* 0.014* 0.247 Scot. Tesco 0.440 0.024* 0.025* 0.087* Scot. Waitr. 0.044 0.034 0.051 0.070 Constant 2.715 0.030* 0.036* 0.061* * indicates significant at a 5% level and ** indicate significant at a 10% level
33
Table A3. Parameter estimates from model 2, interactions with MSC Variable Parameter
St. Error
No cluster Retailer Product Multi Chumpink -‐0.181 0.019* 0.077* 0.083* 0.072* Sockeye -‐0.021 0.012 0.052 0.059 0.064 Wild Alaska -‐0.020 0.062 0.188 0.213 0.164 Fresh -‐0.240 0.013* 0.088* 0.060* 0.070* Frozen -‐0.191 0.016* 0.072* 0.061* 0.056* Flakes 0.127 0.011* 0.054* 0.060* 0.059* Slices 0.246 0.009* 0.059* 0.050* 0.043* Trims -‐0.727 0.021* 0.116* 0.124* 0.129* Other prod. -‐0.192 0.034* 0.124 0.126 0.124 Smoked 0.206 0.007* 0.024* 0.038* 0.032* Grav lox 0.037 0.018* 0.061 0.070 0.062 Value added 0.026 0.008* 0.047 0.037 0.040 Wgt_90 0.487 0.025* 0.069* 0.095* 0.102* Wgt_250_500 -‐0.303 0.007* 0.019* 0.035* 0.032* Wgt_500 -‐0.418 0.013* 0.028* 0.051* 0.047* Wgt_ind -‐0.366 0.013* 0.056* 0.052* 0.042* Bird’s Eye 0.299 0.021* 0.094* 0.090* 0.083* Young 0.066 0.016* 0.054 0.085 0.078 Other brand 0.120 0.012* 0.067** 0.061** 0.062** Organic 0.247 0.008* 0.026* 0.047* 0.035* Scottish 0.042 0.007* 0.020* 0.038 0.041 Coop 0.180 0.010* 0.026* 0.055* 0.052* Lidl -‐0.447 0.015* 0.023* 0.071* 0.073* Marks 0.435 0.010* 0.012* 0.054* 0.061* Morisson 0.005 0.011 0.017 0.050 0.050 Sainsbury 0.131 0.013* 0.008* 0.067* 0.029* Tesco 0.290 0.014* 0.017* 0.075* 0.039* Waitrose 0.454 0.009* 0.016* 0.049* 0.052* MSC Asda 0.605 0.020* 0.066* 0.078* 0.070* MSC Lidl 0.308 0.028* 0.070* 0.117* 0.105* MSC Marks -‐0.020 0.039 0.093 0.149 0.119 MSC Mor. 0.222 0.064* 0.216 0.217 0.166 MSC Tes -‐0.089 0.087 0.255 0.245 0.218 MSC Waitr. 0.139 0.026* 0.057* 0.076** 0.077** Constant 2.740 0.008* 0.027* 0.046* 0.037* * indicates significant at a 5% level and ** indicate significant at a 10% level
34
Table A4. Parameter estimates from model 3, interactions with organic Variable Parameter
St. Error
No cluster Retailer Product Multi Chumpink -‐0.191 0.020* 0.089* 0.095* 0.088* Sockeye 0.120 0.029* 0.097 0.132 0.123 Wild Alaska -‐0.087 0.043* 0.142 0.163 0.136 Fresh -‐0.259 0.013* 0.081* 0.061* 0.066* Frozen -‐0.188 0.014* 0.081* 0.057* 0.056* Flakes 0.138 0.011* 0.056* 0.060* 0.057* Slices 0.252 0.009* 0.059* 0.050* 0.044* Trims -‐0.724 0.021* 0.117* 0.125* 0.130* Other prod. -‐0.191 0.035* 0.128 0.128 0.126 Smoked 0.209 0.007* 0.024* 0.038* 0.032* Grav lox 0.022 0.020 0.066 0.080 0.068 Value added 0.031 0.008* 0.045 0.037 0.041 Wgt_90 0.517 0.022* 0.075* 0.104* 0.113* Wgt_250_500 -‐0.294 0.007* 0.023* 0.036* 0.030* Wgt_500 -‐0.408 0.012* 0.026* 0.048* 0.042* Wgt_ind -‐0.326 0.014* 0.044* 0.057* 0.047* Bird’s Eye 0.303 0.023* 0.115* 0.098* 0.087* Young 0.020 0.017 0.039 0.092 0.080 Other brand 0.127 0.011* 0.069** 0.059* 0.061* MSC 0.128 0.025* 0.102 0.107 0.090 Scottish 0.040 0.007* 0.019* 0.038 0.041 Coop 0.176 0.011* 0.025* 0.056* 0.050* Lidl -‐0.387 0.015* 0.034* 0.066* 0.078* Marks 0.420 0.010* 0.009* 0.054* 0.060* Morisson -‐0.008 0.011 0.017 0.051 0.051 Sainsbury 0.121 0.013* 0.011* 0.068* 0.032* Tesco 0.280 0.015* 0.019* 0.076* 0.043* Waitrose 0.445 0.010* 0.024* 0.053* 0.057* Org. Asda 0.268 0.017* 0.029* 0.104* 0.038* Org. Marks 0.287 0.011* 0.032* 0.058* 0.065* Org. Wait. 0.233 0.008* 0.025* 0.044* 0.044* Constant 2.739 0.009* 0.029* 0.048* 0.037* * indicates significant at a 5% level and ** indicate significant at a 10% level
35
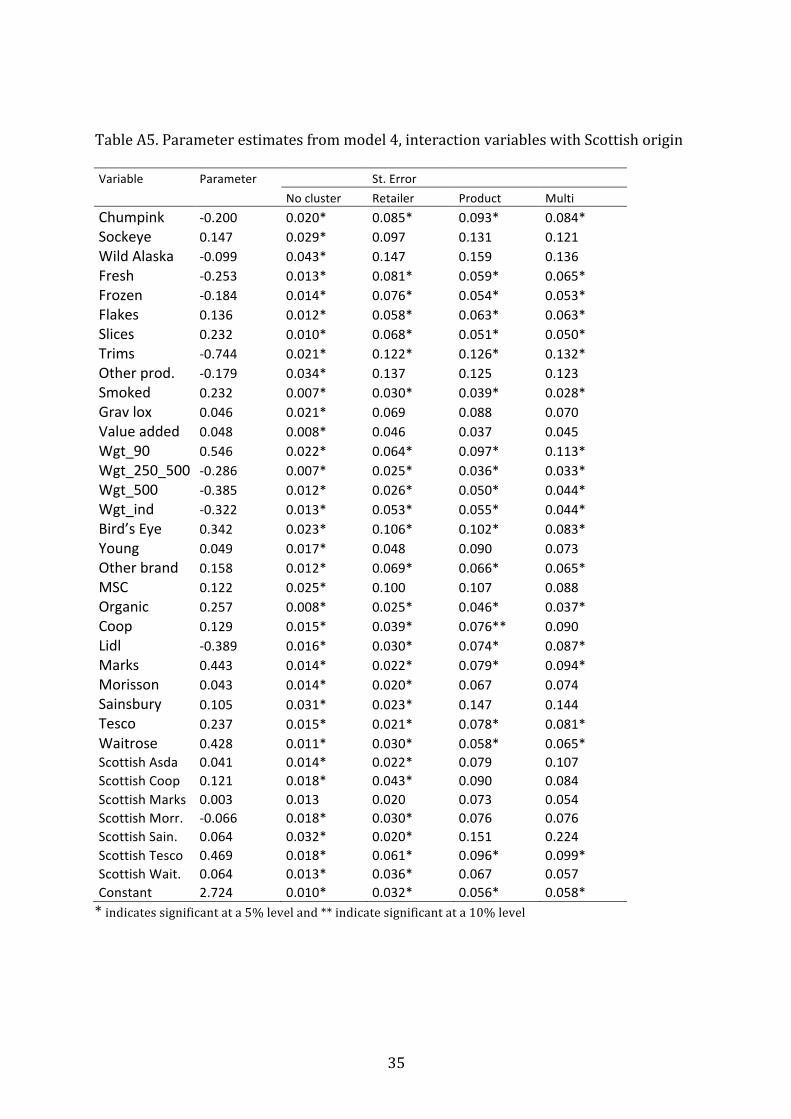
Table A5. Parameter estimates from model 4, interaction variables with Scottish origin Variable Parameter
St. Error
No cluster Retailer Product Multi Chumpink -‐0.200 0.020* 0.085* 0.093* 0.084* Sockeye 0.147 0.029* 0.097 0.131 0.121 Wild Alaska -‐0.099 0.043* 0.147 0.159 0.136 Fresh -‐0.253 0.013* 0.081* 0.059* 0.065* Frozen -‐0.184 0.014* 0.076* 0.054* 0.053* Flakes 0.136 0.012* 0.058* 0.063* 0.063* Slices 0.232 0.010* 0.068* 0.051* 0.050* Trims -‐0.744 0.021* 0.122* 0.126* 0.132* Other prod. -‐0.179 0.034* 0.137 0.125 0.123 Smoked 0.232 0.007* 0.030* 0.039* 0.028* Grav lox 0.046 0.021* 0.069 0.088 0.070 Value added 0.048 0.008* 0.046 0.037 0.045 Wgt_90 0.546 0.022* 0.064* 0.097* 0.113* Wgt_250_500 -‐0.286 0.007* 0.025* 0.036* 0.033* Wgt_500 -‐0.385 0.012* 0.026* 0.050* 0.044* Wgt_ind -‐0.322 0.013* 0.053* 0.055* 0.044* Bird’s Eye 0.342 0.023* 0.106* 0.102* 0.083* Young 0.049 0.017* 0.048 0.090 0.073 Other brand 0.158 0.012* 0.069* 0.066* 0.065* MSC 0.122 0.025* 0.100 0.107 0.088 Organic 0.257 0.008* 0.025* 0.046* 0.037* Coop 0.129 0.015* 0.039* 0.076** 0.090 Lidl -‐0.389 0.016* 0.030* 0.074* 0.087* Marks 0.443 0.014* 0.022* 0.079* 0.094* Morisson 0.043 0.014* 0.020* 0.067 0.074 Sainsbury 0.105 0.031* 0.023* 0.147 0.144 Tesco 0.237 0.015* 0.021* 0.078* 0.081* Waitrose 0.428 0.011* 0.030* 0.058* 0.065* Scottish Asda 0.041 0.014* 0.022* 0.079 0.107 Scottish Coop 0.121 0.018* 0.043* 0.090 0.084 Scottish Marks 0.003 0.013 0.020 0.073 0.054 Scottish Morr. -‐0.066 0.018* 0.030* 0.076 0.076 Scottish Sain. 0.064 0.032* 0.020* 0.151 0.224 Scottish Tesco 0.469 0.018* 0.061* 0.096* 0.099* Scottish Wait. 0.064 0.013* 0.036* 0.067 0.057 Constant 2.724 0.010* 0.032* 0.056* 0.058* * indicates significant at a 5% level and ** indicate significant at a 10% level