PRICING MILK AND DAIRY PRODUCTS
64
PRICING MILK AND DAIRY PRODUCTS Principles, Practices, and Problems Economic Research Service U.S. Department of Agriculture
Transcript of PRICING MILK AND DAIRY PRODUCTS
PRICING MILK AND DAIRY PRODUCTS
Principles, Practices, and Problems
Economic Research Service U.S. Department of Agriculture
PREFACE
This study analyzes pricing problems of the U.S. dairy industry in terms of the existing situation, factors shaping the current situation, and emerging problems. Information and data were obtained from a wide variety of sources. Data on retail milk prices in tables 5 and 7-22 were collected by the Northeast Regional Dairy Marketing Committee (NEM-40) and summarized by the Economic Research Service, U.S. Department of Agriculture.
The views on policy issues are those of the author and not necessarily those of the Department.
Washington, D.C. 20250 june 1971
TABLE OF CONTENTS
Page
HIGHLIGHTS iü INTRODUCTION 1 DEVELOPMENT OF FARMER-PROCESSOR BARGAINING IN
THE FLUID-MILK INDUSTRY 1 NATURE OF THE PRICING PROCESS 3 PRICING IN THE DAIRY INDUSTRY 5
Raw Milk—Fluid Grade 5 Organization of the Market 5
Raw Milk—Manufacturing Grade 8 Product Pricing 8
Organization of the Bottled-Milk Market 8 Structure of Fluid-Milk Processing 9 Integration by Supermarkets 13 Private Labels 1^
Supermarket Pricing Policies and Practices 17 Pricing Packaged Fluid-Milk Products 21
Store Price Structures 22 Home-Delivery Price Structures 30 Wholesale Pricing 36
Pricing Other Dairy Products 36 Wholesale Pricing 37
ORDER PRICING 37 Pricing Class I Milk 37
Objectives of Class I Pricing—Level 37 Classified Pricing in Space, Form, and Time 39 Setting Price Levels in Practice 40 Intermarket Price Differentials 41 Related Issues 42
Classification 42 Marketing Area 42 Pooling 43 Standby Pool 43
Pricing Class II Milk 45 RELATIVE VALUE OF BUTTERFAT AND NONFAT SOLIDS 46
Supply and Demand 46 Prices and Sales of Dry Milk to Different Users 48 Pricing Manufactured Dairy Products 48 Pricing Fluid-Milk Products 50
RESALE PRICE REGULATION 52 POLICY ISSUES 54 APPENDIX A 57 LITERATURE CITED 58
ii
HIGHLIGHTS
Developments in the complex market organization and competitive process of the U.S. dairy industry—evolving slowly since the 1930's—are now accel- erating sharply, signaling a vastly different pricing system of milk and dairy products in the 1980's.
Most raw fluid-grade milk has been priced under Federal or State orders using a classified price system. The development of increased bargaining strength by producer-cooperatives in recent years has introduced another element into the pricing process—cooperatives in many markets are obtaining over-order premiums or service payments. Thus, today the price-making process for raw fluid-grade milk combines elements of administrative and negotiated pricing. Prices of raw manufacturing-grade milk rest on a floor provided by Government price-support programs, but they frequently rise above the floor because of competition between milk plants for supplies.
In retail stores, there is no one single price of milk; prices vary by type and size of container, composition, type of store, and a variety of other factors. Some differences are attributable to physical variations in the products, but most are due to differences in the merchandising policies of retailers. These price structures tend to be reasonably stable for extended periods of time until a change is made by a retailer—often one who wants to introduce a private-label differential or a new container. Readjustments in price structure may be made smoothly or result in a price war. Resale price control by a State milk control board or commission tends to limit diversity in price structure—compared with unregulated markets— but dispersion of prices is still large.
The most important development in the dairy industry is the continued growth of large regional dairy cooperatives and the dominant position of supermarket groups in setting the pace of competition and prices in the packaged-milk market. Supermarket groups, accounting for about one-third of milk sold, are large-volume contract buyers who can easily switch contracts between suppliers. Thus, big fluid-milk handlers appear to be losing their market power position as they confront large and powerful groups on both the buying and selling end.
Several emerging policy issues will need to be resolved in the next decade. The broadest question is the appropriate role of public authority in pricing milk and dairy products as the market structure changes and the distribution of market power shifts among participants. As distinctions between manufacturing-grade and fluid-grade milk disappear, new pricing institutions will be required to deal with the emerging structure.
The relative values of milk components warrant continuous review. As milk is used more as a source of a wide variety of raw materials for fabricating food products, the components to be priced will increase in number, and the pricing problem will become even more complex.
iii
PRICING MILK AND DAIRY PRODUCTS- PRINCIPLES, PRACTICES, AND PROBLEMS
by
Alden C. Manchester Chief, Animal Products Branch Marketing Economics Division Economic Research Service
INTRODUCTION
An understanding of milk and daiiy product pricing—how prices are made and the competitive environment in which they are formed—is essential in considering policy issues. This report discusses the nature of the pricing process in the U.S. dairy industry, and analyzes developments which have resulted in its modification. It examines policy issues in pricing dairy products in light of these changes, and identifies emerging problems.
DEVELOPMENT OF FARMER-PROCESSOR BARGAINING IN THE FLUID-MILK INDUSTRY
Dairy farmers through cooperatives have been bargaining with fluid-milk processors since before World War I. Earliest efforts, prior to World War I and extending through the 1920's, established the classified pricing system in most milk markets, in which milk for fluid use was priced at one level and that for manufactured products at a lower level. This system reflects greater costs of handling and marketing perishable milk in fluid form. It enables the stabilizing of returns to producers in the face of considerable seasonality of production, and provides for price discrimination, reflecting differences in demand elasticities in the markets for various products.
In the 1920's, classified pricing systems were established in nearly all major markets by bargaining between dairy-farmer cooperatives and processors. During the 1930's, these systems broke down in most markets, since depression conditions led to a drastic decrease in demand. Prices at all levels dropped sharply, and farmers were in great economic distress. Under the Agricultural Adjustment Act of 1933 and later legislation, the Federal Government stabi- lized prices of milk in fluid-milk markets through licenses which later were replaced by marketing orders. Many States set up State milk-control systems to perform similar functions. There was some fluctuation in the prevalence of State milk control and a continued expansion of Federal milk-marketing orders as they were requested by producers through cooperatives in more and more fluid-milk markets (table 1).

Table 1.—Extent of Federal and State regulation of producer prices of fluid-grade milk, 1945-69
Year Federal
orders 1/
Markets under Federal
regulation IJ
States regulating producer prices
of milk 3/
Percentage of total fluid-grade milk sold to plants and dealers under—
Federal : State orders ; regulation ^/
1945 4/. 1946 4/. 1947 4/. 1948.... 1949....
1950.... 1951 1952 1953 1954....
1955 1956.... 1957 1958 1959....
1960 1961 1962.... 1963 1964....
1965.... 1966.... 1967.... 1968 1969..,.
—Number Number- 28 28 30 30 31 31 30 31 33 34
39 40 46 47 49 52 50 53 53 57
63 67 68 72 71 75 74 81 79 86
80 89 83 93 85 96 83 96 82 96
76 96 74 97 74 100 76 101 68 104
-Number Percent- 16 16 16 16 16
16 16 16 16 16
16 16 16 16 16
16 18 18 19 18
19 19 19 18 18
\j Federal orders and agreements effective during any part of the year. IJ This series counts markets, not orders. It ignores mergers. _3/ Excludes any joint or concurrent regulation with Federal orders. kj Total fluid-grade milk sold to plants and dealers estimated.
34.6 35.6 36.6 33.8 39.2
41.4 43.3 47.1 48.8 48.7
50.0 51.3 53.6 56.2 60.3
64.6 67.5 70.3 70.5 70.8
70. 69, 70. 74. 78.
-Percent- 23.5 23.4 24.2 22.3 24.5
24.2 24.1 24.1 23.8 23.3
24.1 24.0 23.7 22.4 21.7
21. 21. 21. 21, 22.
22.4 22.5 21.9 20.1 19.1
In the late 1940's, cooperatives in a small number of markets began to bargain for premiums over order prices, which became fairly common in the 1950's, In some markets, these were short lived; in others, they persisted for many years. A cooperative's success in negotiating such over-order premiums depended in part on its control of supply. If one cooperative or a tightly-knit group of cooperatives controlled all or nearly all of the supply, these premiums were easier to negotiate.
Since 1946, isolation of individual fluid-milk markets has broken down. Technological developments in transportation and processing methods, which provided longer shelf life of fluid products, have made it possible to move milk over much greater distances—both in bulk and packaged form. Fluid- milk markets 30-40 miles apart were once separate and distinct markets with very little competition between them. Recently, these same markets have merged into one, and cooperatives and processors in cities several hundred miles apart are increasingly in competition. Bulk milk now moves as far as 2,000 miles, and packaged milk 200-250 miles. Under such circumstances, bargaining in individual markets has become increasingly difficult.
In the early fifties, the focus of bargaining was between dealers and cooperatives in the local market. With increased mobility of milk, it often developed into cooperative versus cooperative—cooperatives located in what had formerly been separate markets. Under such circumstances, dealers began to change tactics. In some cases, their objective was to create dissension among cooperatives rather than to directly challenge the local cooperative.
In the I960's, emphasis shifted to joint efforts of cooperatives through federation and then to merger of cooperatives into large regional units. Several large federations of cooperatives were formed early in the sixties, and today there are eight, representing 126,000 producers controlling about 52 billion pounds of milk—about 44 percent of the national milk supply. In the late I960's, cooperatives began to merge at a rapid rate. Since 1967, six large producer-organizations have been formed as a result of mergers or consolidations of existing cooperatives. These organizations have about 73,000 producer-members and an annual volume of about 26 billion pounds of milk—about 22 percent of the national milk supply. Their members are pri- marily fluid-milk producers, although some are manufactured-milk producers. The federations are made up largely of merged associations.
The foregoing changes represent a major structural shift in the dairy industry, and have added many new dimensions to the pricing problems of the industry.
NATURE OF THE PRICING PROCESS
The heart of any marketing system is the price-making process. True in each agricultural-related industry, this premise is especially valid in those handling perishable products such as meat, milk, eggs, poultry, and fresh fruits and vegetables. Static concepts of price theory provide a basis for understanding the price-making process, but full recognition of
the essentially dynamic character of this process is necessary for complete understanding of its operation. Emphasis must be placed on the process rather than on the state of being. Equilibrium price is a convenient concept which assists in understanding some of the forces at work, but one must go beyond this abstraction to understand the dynamic process which, in the extreme case, can make one price "right" at a given moment in time, and "wrong" the next.
First, we must recognize that a mixture of supply-and-demand pricing, quoted-price system, and negotiated-price system is used in dairy industries (2, pp. 108-110). 1/ Under supply-and-demand pricing, the seller offers his available supply of goods for sale at whatever price the market will bring. In contrast, under the quoted-price system, the seller names the price at which he is willing to sell and takes orders. The quoted-price system is typical of most manufacturing industries. Since most of the theory of imper- fect competition has been developed for industrial markets operating under some variant of the quoted-price system, some caution is necessary in applying the theory to a market operating under supply-and-demand pricing.
In markets for milk and dairy products, further complications arise because of a prevalence of Federal and State orders involving various forms of administrative pricing, such as price-setting operations for fluid-grade milk, and the support-price program for butter, nonfat dry milk, and cheese. Further complications arise from the negotiated prices of large cooperatives.
The objective of any type of pricing system is to establish the price^ for each commodity—including each type, size, grade, and quality—which will equate supply and demand, that is, clear the market, at a given point in time. The price or prices should be set by buyers and sellers with minimum effort, that is, by the most efficient means. Furthermore, the system should minimize uncertainty by minimizing distortions in the price structure—relationships between: (1) Prices of different grades and types of the commodity; (2) prices of substitutable commodities; (3) prices of the commodity at different geo- graphic points; and (4) prices of the commodity at different points in time.
To accomplish these objectives perfectly would require complete knowledge of present, potential, and forthcoming supplies (that is, supply elasticity) and their locations, as well as of present an<f future demands, and their elasticities and cross-elasticities. Complete knowledge is impossible. Even if it were possible, differences in evaluations of the meaning of known facts by different buyers and sellers in the market would cause variations in prices. Thus, the realistic goal is not complete elimination of variations in prices and distortions of the price structure but rather their minimization.
These objectives are met differently under each type of pricing system. The differences are in the time dimension and in the mechanism by which supply and demand are equalized. Variations in the method of equilibrating supply and demand are implicit in the description of each type of pricing system. Differences in the time span include the following. Under supply-and-demand
1/ Underlined numbers in parentheses refer to items listed in Literature
Cited, p. 58.
pricing, the equilibrating of supply and demand takes place in a relatively
short period—this period may be as short as an instant or as long as a month. Under a quoted-price system, there is no fixed period—the supply is readjusted periodically by increasing or decreasing output to keep it in rough balance with sales. With a negotiated-price system, quantity may be specified by contract—at least within fairly well-known ranges—and an adjustment similar to that under the quoted-price system may take place.
PRICING IN THE DAIRY INDUSTRY
A discussion of milk pricing must recognize the interdependency of the entire milk-marketing and pricing system. With a system of classified prices of the general type utilized under Federal orders, manufactured dairy products are the residual use of milk supplies. Fluid-milk products return the higher class I price to producers and have first claim on supply. Semiperishable products, such as ice cream and cottage cheese, may be made from either local milk supplies or intermediate products shipped in from surplus areas. Hard products such as cheese, butter, and powder, are residual claimants on milk supplies. The relative prices of milk for these uses and of the products determine the allocation of milk among the uses. Thus, in analyzing any milk- pricing problem, its impact on the entire dairy-production and marketing system must be considered.
The price of manufacturing-grade milk reflects competitive conditions in the marketplace, including impacts of price support actions; costs of milk production; alternative employment opportunities—both farm and nonfarm; demand for manufactured-milk products; and, indirectly, through its effect on the quantity of milk used, demand for fluid-milk products.
Raw Milk—Fluid Grade
Except for a few isolated markets, fluid-grade raw milk in the United States is priced under Federal orders or State regulations. A classified pricing system is almost universally used. From the outset, classified pricing systems recognized that milk which was indistinguishable in the physical sense could be differentiated in the economic sense and priced by use. Factors other than product use can also enter into pricing decisions.
Organization of the Market
Farmer cooperatives perform a major function in the sale of raw milk to distributors in all but a few isolated fluid-milk markets—a few southern States and California—where, until very recently, producers have relied on State controls to safeguard their interests. In recent years, their role in many markets has been changing. In Federal- and State-controlled markets, their principal role previously had been to represent the producer in the price-making process, through Federal order hearings or whatever arrangements a particular State might have. In some cases, they operated receiving stations, manufacturing plants, or fluid-milk plants. In recent years.
cooperatives have broadened the scope of their operations in an effort to increase their marketing power. In many cases, they have taken over operation of the entire procurement system, including assembly and management of fluid- milk supplies, routing raw milk to distributors as needed, and managing the surplus.
Many handlers have accepted full supply arrangements with a cooperative because of the high cost of procuring and coordinating a fluctuating supply to meet a variable demand, and the possibility of eliminating some uncer- tainty in this area. Under such an arrangement, the cooperative undertakes to supply the exact needs of the handler for milk for fluid use and perhaps for ice cream and cottage cheese, and also to dispose of the surplus for other uses. Milk supply varies from day to day, depending on the vagaries of pro- duction by individual cows, weather, road conditions, and other uncontrollable factors. Demand likewise varies from day to day, partly on the basis of the day of the week, since more and more milk is being sold through supermarkets with a concentration of sales on weekends. Thus, there is a strong element of random variation in both supply and demand from day to day. The larger the volume under the control of one agency, the more the random variations tend to offset one another, both within supply and demand and between the two.
Such an arrangement does not eliminate fluctuations, but it does reduce their impact on the handler by giving him a relatively simple, routine means of adjusting supply to demand with minimum effort and expense. Furthermore, a single agency is in a better position to make necessary adjustments and reduce the burden of uncertainty.
As cooperatives increasingly take over the task of coordinating supply and demand under full supply contracts or some similar arrangement, substan- tial economies become possible (17). Reserve supplies of milk, which must be carried to meet fluctuations, become smaller. Significant savings become possible in the movement of milk—both in farm assembly and in movement to plants—when one agency is routing the total supply of the market. The function of manufacturing supplies of milk not needed for fluid use into various dairy products can be performed much more efficiently under such a system, since receipts of milk are not nearly as variable at a single plant receiving the surplus from an entire market. When each handler attempts to take care of his own surplus, tremendous variations occur from day to day in the volume being manufactured. Total economies in such a centralized supply- coordination and surplus-disposal operation, compared with a system in which each handler manages his own supply and surplus disposal, probably are about 20-22 cents per hundredweight. Potential gains from such arrangements will be shared between cooperatives and processors in some proportion, depending on the relative bargaining strength of each. The economies are substantial enough so that both cooperatives and handlers can make substantial savings.
Changed bargaining relationships in the procurement market and lower operating costs associated with central supply management have helped create a climate in which cooperatives can bargain for and obtain premiums over prices established under the Federal orders. About two-thirds of Federal order markets have had premiums in recent years.
Much of the market power of dairy cooperatives has developed through the use of Federal and State orders. Ij Given these control devices and the substantial quantities of milk available in most markets throughout the country, there is little incentive for fluid-milk distributors to compete for independent milk supplies. They can obtain all they want from a coopera- tive at the going price. Therefore, in many cases, they have turned over the complete procurement job to the cooperative. This transfer of function is usually the subject of spirited bargaining between handler and cooperatives as each attempts to obtain the largest possible share of the savings from centralized supply coordination. Centralized management of fluid-milk supplies and of excess milk improves efficiency and lowers costs for the
total job.
Not all markets, however, are organized in the foregoing manner. In markets in which over-order premiums have been negotiated by a cooperative, or cooperatives, there is an incentive for handlers to break away from the cooperative and attempt to obtain milk supplies from other sources at the minimum order price. This situation can and does happen frequently enough to undercut superpool premium agreements in a number of markets. The standby pool is one device to minimize the possibility of finding alternative sources.
In many fluid-milk markets, cooperatives have taken over an increasing share of the manufacture of surplus milk into various products, particularly butter, cheese, and nonfat dry milk. Ice cream and cottage cheese—higher valued products—are still produced mostly by proprietary handlers; lower- valued, less-perishable products, however, are moving increasingly to cooperative plants.
Within the past 5 years, cooperatives have been merging and federating at a rapid pace. A possibility exists that these large cooperatives will achieve some measure of control over quantities supplied. Some are operating base plans which have an effect on supply, although they do not have complete supply control. Under present legislative authority, most of these plans will probably not be operated under Federal orders.
2_/ Federal and State orders provide the institutional framework within which a cooperative can bargain successfully for prices higher than those in the orders. The only example of successful bargaining in a major market without the existence of either Federal or State order was found in Houston, Tex. There, a strong cooperative in a deficit market achieved complete control of supplies, including the supply of imported milk, and bargained successfully for nearly 20 years. There is no other comparable case any- where in the United States. Competitive pressures from outside the market, however, became so strong that merger of the Houston cooperative into a regional cooperative occurred in 1967, and a Federal order was introduced in 1968.
Raw Milk—Manufacturing Grade
Procurement In manufacturing-milk areas is handled differently. Prices are arrived at more or less competitively, resting on a floor determined largely by support prices of the Federal Government. Processors compete for supplies of milk through some forms of price competition and many more forms of nonprice competition. In general, prices tend to be somewhat higher in areas where more than one processor is competing for manufacturing- milk supplies. Prices are not uniform within an area where several proces- sors compete, owing to producers' incomplete knowledge and because of factors other than price which influence producers' choices of market outlets (28, pp. 81-90).
Improvements in methods of handling and transporting raw milk—princi- pally bulk-tank assembly—and larger average size of producers have lowered costs of assembly and widened procurement areas of plants. As a result, additional alternative outlets for producers have opened up in many areas, although many plants have closed.
As demand conditions change, relative prices of manufactured products also change, affecting the ability of manufecturers of different products to compete for raw-milk supplies. In the I960's, this situation was parti- cularly noticeable in competition between cheese and butter-powder plants. Although these products were equally profitable in 1960, cheese became increasingly more profitable in response to greater demand. In such a profitable market, cheesemakers frequently were willing to bid higher for milk to increase their output. Butter plants competing for the same milk supplies were under considerable pressure to raise their buying prices to compete with those of cheese plants, but they could not increase their product prices. Thus, butter-powder plants were in a very difficult cost- price squeeze for a considerable period in the 1960's.
This competitive situation is further exacerbated because cheese plants are mostly proprietary while butter-powder plants are predominantly coopera- tive. With tight margins in the butter-powder business, cooperatives have been unable to pay patronage refunds of the size to which their members had become accustomed, and, consequently, they have been at a considerable disadvantage in maintaining membership.
Product Pricing
Organization of the Bottled-Milk Market
The competitive situation in the market for bottled milk has changed markedly over the past 30 years. Before the advent of supermarkets and many technological improvements in processing, refrigeration, and distribution of bottled milk, this market was largely a home-delivery operation. Most firms in the market had the same prices, and competition was mainly in terms of services. With the growth of supermarkets, dairy stores, convenience food
Stores, and many other forms of retailing, distributors face a much wider variety of outlets—each a somewhat different market.
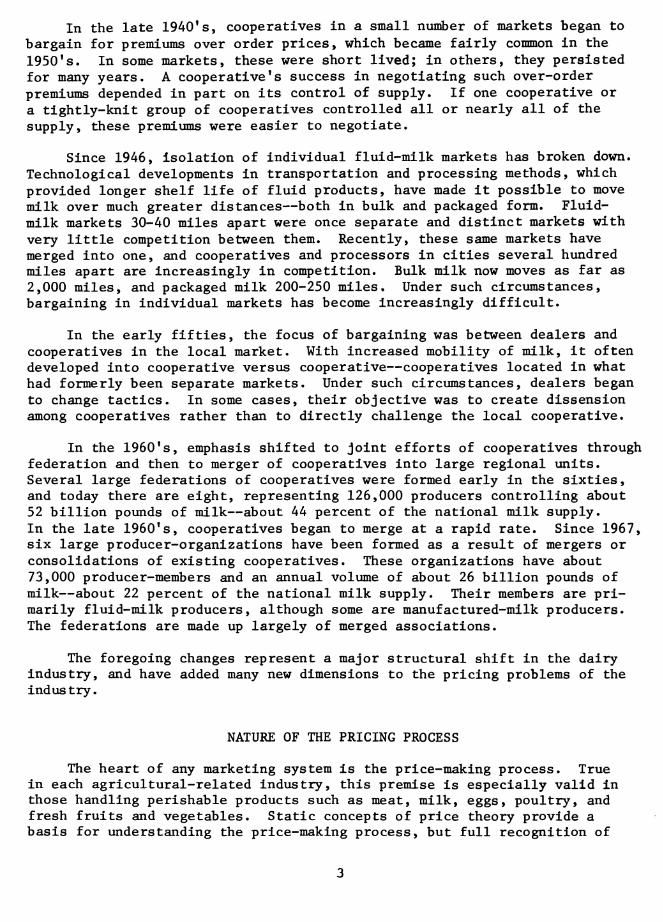
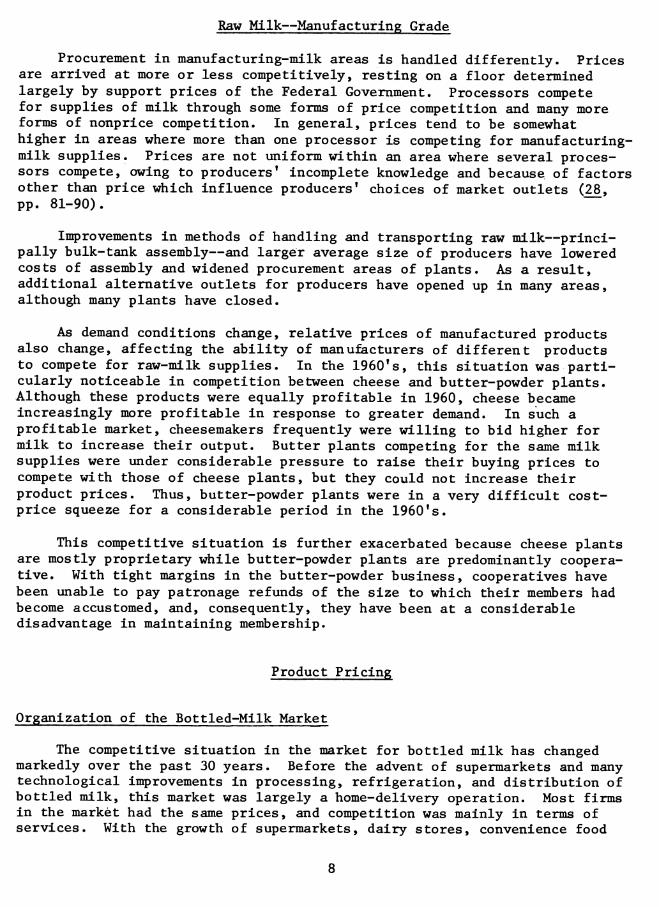
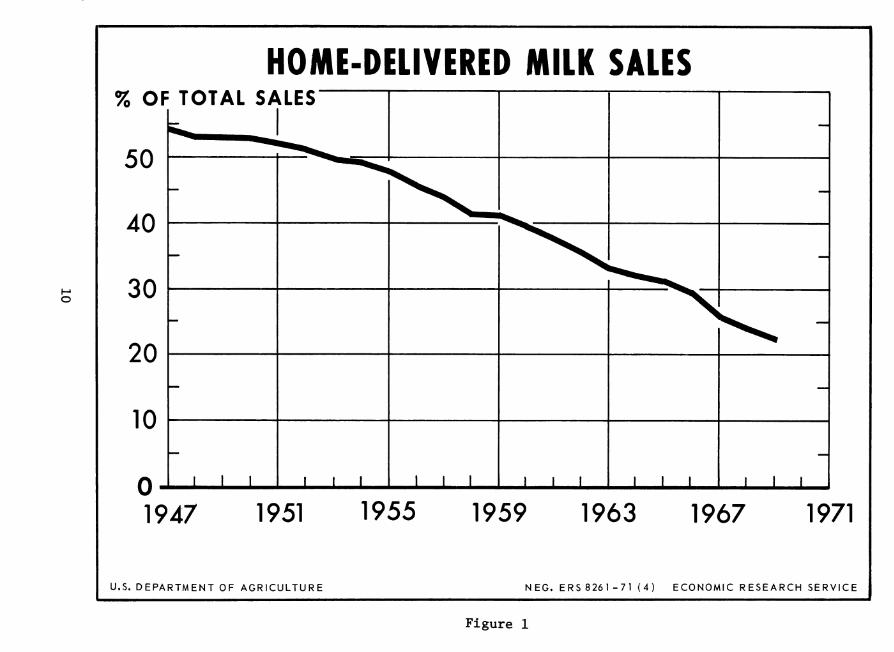
The drastic change in milk distribution in post-World War II years is nowhere better illustrated than by the decline in home-delivery business. Just after World War II, about 54 percent of milk in the United States was delivered to the consumer's doorstep. By 1969, home delivery was down to 22 percent (fig. 1). The change got underway slowly after the war ended. The decline increased to an average of 1.6 percentage points per year between 1955 and 1963, slowed down somewhat for a few years, and, since 1966, has averaged 2.4 percentage points per year.
Although the rise of supermarkets was undoubtedly a major factor in the decline of home-delivery business, it was only one factor. In 1967, super- market sales of milk were about 5 percentage points larger than home-delivery sales, accounting for an estimated 31 percent of total volume (tables 2 and 3). Dairy stores, delicatessens, convenience stores, and other types of food stores accounted for about 19 percent of sales. Sales of plant stores, including farm sales, comprised nearly 4 percent of the total. Restaurants, hotels, institutions, schools, military establishments, and vending machines accounted for 20 percent. Since World War II, the away-from-home-eating market has shown dramatic increases for all kinds of foods. School lunch and special milk programs have expanded sharply. Sales of dairy stores have increased from a fraction of 1 percent 20 years ago to 6 percent today. In many markets, of course, sales are much less.
Whatever the significance of the supermarket in the milk business, it is not that it is making 70 percent of the sales, as sometimes reported, but that it is setting-the pace in many markets. In some cities, supermarket operators are fighting a battle with dairy stores for a larger share of business as well as the leadership in determining prices, margins, and mer- chandising policies. However, in the majority of cities where dairy stores are important, a form of peace—or at least a truce—has been reached between operators of dairy stores and supermarkets. Structures of prices have been established which are livable if not totally satisfactory (15).
In transactions with large retail organizations—whether chains, volun- tary groups, or retailer cooperatives—the processor finds himself in a much different competitive position than in dealing with a large number of indi- vidual households. The chain may be bigger than the distributor and have more bargaining power. Milk and other perishable dairy products constitute only one group of products among many sold in retail stores. Many forms of price and nonprice competition are available to store operators. Fluid- milk distributors no longer depend mainly on hundreds or thousands of individual consumers. Survival of the firm may be contingent on obtaining or losing a share of the business of one supermarket or of one to a dozen supermarket groups in the market area.
Structure of Fluid-Milk Processing.—The number of fluid-milk bottling plants operated by commercial processors has been declining for many years. From 1948 to January 1965, the number in the country as a whole dropped from
HOME-DELIVERED MILK SALES % OF
50
TOTAL SALES —
^"^Ss.
40 ^S^^
^^v^^ 30
"^^1
20
10
n _
**''*'*^
— —
1 1 1 1 1 1 1 1 1 1 1 1 1 1 1 1 1 1
1947 1951 1955 1959 1963 1967 1971
U.S. DEPARTMENT OF AGRICULTURE NEC. ERS 826 1-71 (4) ECONOMIC RESEARCh H SERVICE
Figure 1
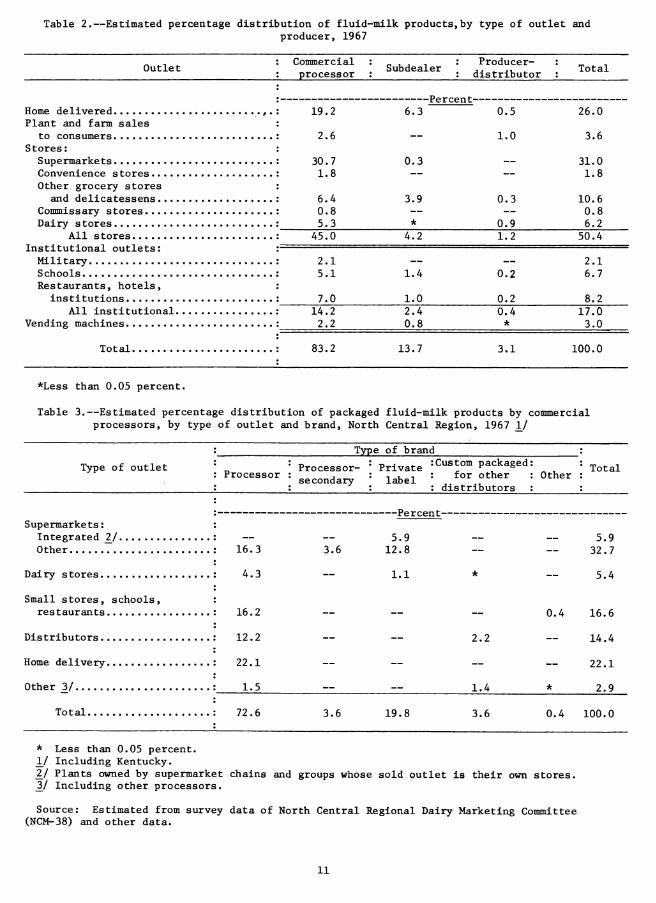
Table 2.—Estimated percentage distribution of fluid-milk products,by type of outlet and producer, 1967
Outlet Commercial processor Subdealer
Producer- distributor Total
Home delivered Plant and farm sales
to consumers Stores:
Supermarkets Convenience stores.... Other grocery stores
and delicatessens... Commissary stores Dairy stores
All stores Institutional outlets: Military Schools Restaurants, hotels,
institutions All institutional
Vending machines
Total
— —rej.L:t; 11 L— — —
19.2 6.3 0.5 26.0
2.6 — 1.0 3.6
30.7 0.3 31.0 1.8 — — 1.8
6.4 3.9 0.3 10.6 0.8 — — 0.8 5.3 * 0.9 6.2
45.0 4.2 1.2 50.4
2.1 __ 2.1 5.1 1.4 0.2 6.7
7.0 1.0 0.2 8.2 14.2 2.2
2.4 0.8
0.4 *
17.0 3.0
83.2 13.7 3.1 100.0
*Less than 0.05 percent.
Table 3.—Estimated percentage distribution of packaged fluid-milk products by commercial processors, by type of outlet and brand. North Central Region, 1967 l^f
Type of outlet
Type of brand
Processor Processor- secondary
Private label
: Custom packaged for other
distributors Other
Total
-Percent- Supermarkets: :
Integrated 2_l • Other : 16.3
Dairy s tores : 4.3
Small stores, schools, : restaurants : 16.2
Distributors : 12.2
Home delivery : 22.1
Other 3/ ; 1.5
Total : 72.6
3.6 5.9
12.8
1.1
2.2
1.4
0.4
5.9 32.7
5.4
16.6
14.4
22.1
2.9
3.6 19.8 3.6 0.4 100.0
* Less than 0.05 percent. _!/ Including Kentucky. _2/ Plants owned by supermarket chains and groups whose sold outlet is their own stores. _3/ Including other processors.
Source: Estimated from survey data of North Central Regional Dairy Marketing Committee (NCM-38) and other data.
11

8,484 to 3,981 plants—a decrease of 47 percent. From January 1965 to December 1969, it decreased to about 2,459 plants—a decline of 38 percent.
The ranks of fluid-milk handlers have diminished since development of city-milk distribution—over 75 years ago. Throughout this period, a major influence has been a shift in the scale curve—the relative costs of small versus large firms. A century ago, very little happened to fluid milk on its way from the farmer to consumer. Simple equipment was used, and the costs of small distributors did not differ greatly from those of large ones. Intro- duction of the glass milk bottle before the turn of the century was probably the earliest development causing some shift in the shape of the scale curve. Even simple bottle-filling equipment was expensive when used for a few quarts of milk a day, and as a result, many small distributors went out of business.
In the 1900's and 1910's, the introduction of many city ordinances requiring the pasteurization of milk resulted in relatively higher costs for small distributors, compared with large ones, and many more small distribu- tors could no longer compete. In the 1920's and 1930's, the introduction of classified pricing plans providing for uniform prices to producers by all handlers, both large and small, forced many small handlers to pay the same prices as their large competitors. Many found it impossible to do so and they, too, went out of business. In the late 1930's and 1940's, the cost levels of smaller distributors were raised further by the introduction of the paper carton. Since World War II, a number of technological and economic developments—no single one of them outstanding—have tilted the scale curve even further.
Economies of scale in plant operations are well demonstrated by the following tabulation (_8, p. 32; _9, pp. 9-11; 25, p. 32):
Plant size Cost per quart larts per day) (cents)
6,000 6.7 20,000 4.5 50,000 3.7 100,000 3.4 200,000 2.8 400,000 2.6 800,000 2.4
Obviously, the smallest plants are severely disadvantaged and cannot compete unless they can obtain access to specialized markets at higher-than-average prices or their owners are willing to accept substantially reduced returns for both investment and management. Middle-sized plants operate at some disadvantage.
Economies of scale in distribution, which are somewhat different in character, have been studied less extensively than those in processing. The chief economies result from having a substantial volume of business in a relatively compact area. Under these conditions, one achieves lower distribution costs than would the same volume of business spread out over a
12
much larger area. To compete for supermarket accounts, the processor must be large enough to handle the total volume of business of a retail store division. Since retail store divisions are often dispersed over large areas, many processors of fairly good size may consequently be cut off. Even if such processors can still compete, the conditions give an advantage to multi- unit processors who have plants covering the entire area served by retail store divisions.
From one point of view, a processor is not large enough to compete for supermarket chain or group accounts if he is not big enough to withstand the financial shock of losing the account later. Many processors are large enough so that, if they were able to obtain a supermarket account, they could afford to expand capacity to handle the business (perhaps by going on multiple shifts). However, the account would represent such a significant share of total business that they would be unable to withstand the shock of loss of income if the account were later changed.
Hence, in general, medium-sized processors can exist primarily by serving the home-delivery market and nonsupermarket portions of the wholesale market. This market is not insignificant, however. On the average, it accounts for about 69 percent of all milk distributed (table 2).
Integration by Supermarkets.—In the thirties, two large national grocery chains built their own milk bottling plants to serve some of their stores. After World War II, they added more plants in other areas. In the last few years, they have been supplying a high proportion of their stores with milk from their own plants. In the postwar period—primarily in the late fifties and sixties—other chains and a few cooperative and voluntary groups built or purchased milk plants.
In 1965, 20 companies in the United States operated 35 plants which processed 3 percent of the total volume (table 4). By 1967, this figure had increased to 4.3 percent and, by 1969, 21 companies operated 39 plants and accounted for 5.7 percent of the total volume.
Some incentive for vertical integration by supermarket chains is provided by the existence of relatively high fixed margins under resale price control. Under resale price control, there has been considerable reluctance to permit quantity discounts and limited service delivery. In such circumstances, supermarket organizations have an incentive to build or acquire their own milk plants to capture the available profits. In parts of the country where resale price control does not provide guaranteed margins, incentives are less clear cut. The argument was given that a retail organization might be able to achieve economies and distribution which a conventional milk processor could not by dealing with a different labor organization. Generally, however, this was not the case. Another possible incentive is that a retail organization operating its own milk plant can be fully assured of capturing all economies possible in a large- volume, limited-service operation, while it may be limited in its ability to negotiate prices with other processors which fully reflect these economies by the trade practice regulation activities of Federal and State agencies.
13

Table 4.—Milk-bottling plants operated by supermarket groups under Federal orders and other regulations, December 1965, 1967, 1969 1/
Item
Plants Federal orders Other (estimated)
Total
Companies
Volume : Federal orders : 88.0 Other (estimated) : 48.6
Total ; 136.6
Percentage of sales of : commercial processors • : 3.0
-Number-
-MiIlion pounds-
142.7 55.5
198.2
-Percent-
Dec. 1969
: 21 : 14
25 14
28 11
: 35 39 39
: 20 22 21
209.7 57.0
266.7
4.3 5.7
1/ With most sales going through own stores. At least five other super- market companies operate milk plants which supply other outlets in addition to their own stores. Their volume is not included here.
Private Labels.—In the early fifties, there were only a few private labels of retail groups—other than those of firms operating their own milk plants. Today, any firm of any size has a private label for homogenized milk, nearly as many for 2-percent milk, and a very large number carry a complete line of fluid products.
A 1964 survey by the North Central Regional Dairy Marketing Committee of 194 midwestem retail food stores—representing all the major chain, voluntary, and cooperative groups in 20 markets in the Midwest—found that 59 percent of the stores carried private-label brands whole milk, and 28 percent had private labels on 2-percent milk. Considering only stores with custom-packaged, private labels of homogenized milk, 6 percent carried only private label; 25 percent also carried the packer brand of the firm packaging the private label; 9 percent had the private-label brand and the packer brand of another packer; and 60 percent had the private-label brand, the packer brand of the custom packager, and at least one other brand (28, pp. 105, 123-124).
14
Private-label brands of homogenized milk in ^-gallon containers were sold at lower prices than packer brands in 82 percent of the stores carrying both brands. The price difference usually was 2 cents per half gallon.
In 1965, the National Commission on Food Marketing reported that 38 percent of retail chains in the United States carried private-label brands of homogenized milk. This figure included 14 of 16 companies with annual sales of $250 million or more, 18 of 50 companies with sales between $50 and $250 million, and 30 of 108 companies with sales of less than $50 million (22, pp. 89-91). About a fourth of the chains with private-label homogenized milk operated their own bottling plants, but most carried another brand of milk in at least some of their stores. All the large chains carried packer brands of milk in at least some stores, including two national chains which have extensive milk-bottling operations. In at least some cases, they carried only private-label milk in stores serviced from their own bottling plants, but carried packer brands in stores in other areas.
In most cases, the wholesale price of homogenized milk under private label was less than under the supplier's label. The most common wholesale price differences were 1 and 2 cents per half gallon.
A more recent study of 39 markets from Maine to Illinois and as far south as Washington, D.C., found that an estimated 69 percent of milk in supermarkets was packaged under the store's brand, with 31 percent under processor brand (table 5). In dairy stores, all but 6 percent of milk was packaged under the store brand, while in convenience stores no store brands were used. However, many convenience stores owned by companies with milk plants carry the company brand of milk which is different from the store name (75 percent of the milk in this survey). There was very little varia- tion among types of markets in the incidence of store-brand milk in supermar- kets, except in smaller markets with State resale price control. There was no store-brand milk in Maine, very little in Vermont, and somewhat less than average in the smaller Pennsylvania markets.
The supermarket-brand milk in these 39 markets was about evenly divided between that supplied by processing plants owned by the retailer and that customed-packaged by other processors. In most cases, supermarkets selling store-brand milk also carried some processor-brand milk. Sales of such milk were more important in smaller markets than in large markets. In all markets combined, about 10 percent of milk sold by supermarkets was processor-brand milk in stores which also had store-brand milk.
Only a little over 20 percent of milk sold by supermarkets was through stores which had only processor brands. In controlled markets, there was a tendency to carry a larger number of brands than in uncontrolled markets. In Maine, some store groups carried as many as four brands.
Since the typical merchandising policy before the introduction of private labels was to sell three to six of the major brands available in the area, the shift to private label and perhaps one other brand usually means that the processors of the remaining brands lose a major outlet when
15
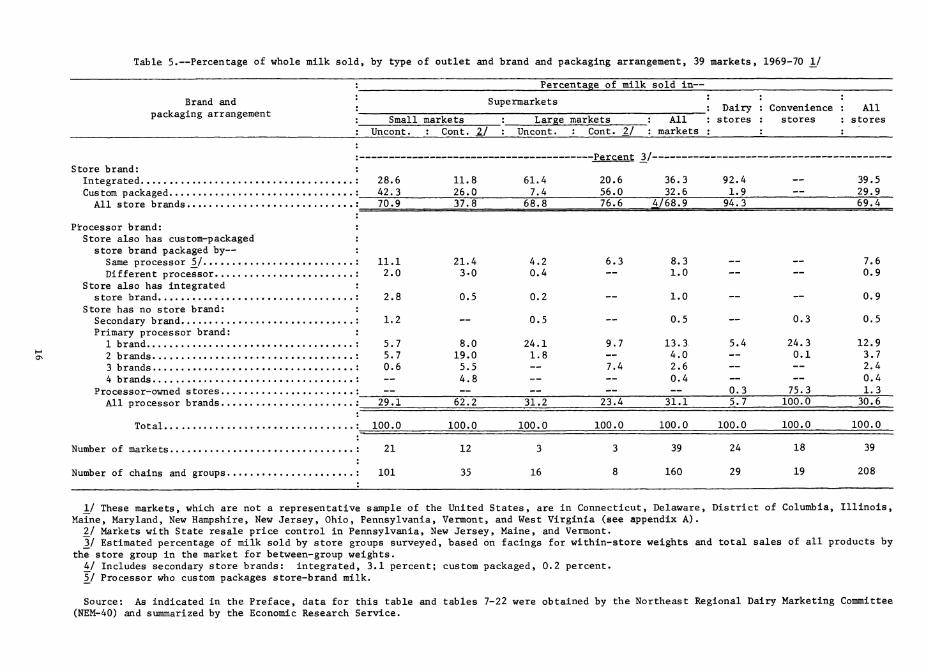
Table 5.—Percentage of whole milk sold, by type of outlet and brand and packaging arrangement, 39 markets, 1969-70 _!/
Percentage of milk sold in—
Brand and packaging arrangement
' Supermarkets Dairy stores
Convenience stores
All : Small markets : Large markets _: All
: markets stores
: Uncont. : Cont. 2/ : Uncont. : Cont. 2/
Store brand: : Integrated : 28.6 Custom packaged : A2. 3
All store brands : 70.9
Processor brand: : Store also has custom-packaged :
store brand packaged by— : Same processor 5_/ : 11.1 Different processor : 2.0
Store also has integrated : store brand : 2.8
Store has no store brand: : Secondary brand : 1.2 Primary processor brand: :
1 brand : 5.7 2 brands : 5.7 3 brands : 0.6 4 brands :
Processor-owned stores : All processor brands : 29.1
Total : 100.0
Number of markets : 21
Number of chains and groups : 101
11.8 26.0 37.8
62.2
100.0
61.4 7.4
—Percent _3/-
20.6 56.0
36.3 32.6
92.4 1.9
68.8 76.6 4/68.9 94.3
21.4 4.2 6.3 8.3 3.0 0.4 — 1.0
0.5 0.2 — 1.0
— 0.5 — 0.5
8.0 24.1 9.7 13.3 19.0 1.8 — 4.0 5.5 — 7.4 2.6 4.8 — — 0.4
5.4
0.3 31.2 23.4 31.1 5.7
100.0 100.0 100.0 100.0
100.0
100.0
39.5 29.9 69.4
— 7.6 — 0.9
— 0.9
0.3 0.5
24.3 12.9 0.1 3.7 — 2.4 — 0.4 75.3 1.3
30.6
100.0
12 3 3 39 24 18 39
35 16 8 160 29 19 208
1/ These markets, which are not a representative sample of the United States, are in Connecticut, Delaware, District of Columbia, Illinois, Maine, Maryland, New Hampshire, New Jersey, Ohio, Pennsylvania, Vermont, and West Virginia (see appendix A).
_2/ Markets with State resale price control in Pennsylvania, New Jersey, Maine, and Vermont. _3/ Estimated percentage of milk sold by store groups surveyed, based on facings for within-store weights and total sales of all products by
the store group in the market for between-group weights. 4^/ Includes secondary store brands: integrated, 3.1 percent; custom packaged, 0.2 percent. V Processor who custom packages store-brand milk.
Source: As indicated in the Preface, data for this table and tables 7-22 were obtained by the Northeast Regional Dairy Marketing Committee (NEM-40) and summarized by the Economic Research Service.
the supermarket group makes the shift in merchandising policy. Thus, the introduction of private-label milk gives a retail organization substantial bargaining power in dealing with its suppliers.
Frequently, private-label brands are sold at somewhat lower prices than processor brands in the market. At times, this has led to a response by distributors in the form of secondary brands sold at the same price level as private labels. Sometimes these secondary brands are of lower butterfat content—approximately the minimum level allowed by local regulations—and sometimes they are indistinguishable from regular brands of the distributor.
Changes in structure and market power relationships—when drastic or a series of small changes—have frequently led to price wars. Price competi- tion has become important in many markets, and frequently has broken out in exaggerated form as a price war. These price wars are often a symptom of change taking place in a market rather than the cause.
Supermarket Pricing Policies and Practices
Pricing is a major element in the merchandising policy of a supermarket. The pricing strategy is designed to bring customers into the store and thereby build sales.
Perishable commodities (meats and fresh fruits and vegetables) have an important role in competitive strategy, serving as "traffic builders." Shoppers generally seem to believe that dry groceries and household supplies will be available in all supermarkets at similar—if not exactly equal— prices. These prices may differ somewhat owing to availability and relative price levels of private brands and the number and variety of items offered. Therefore, their decisions to patronize a particular store can be strongly influenced by their impressions of the quality and price levels of the perishables there. For perishables, quality considerations are relatively more important than for other commodities, which are commonly assumed to be approximately equal in quality. The "store image" that the shopper has— her overall impression of the store and the class of customer patronizing it—appears to be influenced more by quality and price of perishables than by any other factor (24).
As noted above, major traffic builders in a store are meats and fresh produce. Supermarkets advertise a number of items from the meat department each week. Except for those with an "every-day-low-price" policy, these prices are advertised as "specials." Typically, several beef and pork cuts are included. Broilers have been almost universally used as a traffic builder by supermarkets, and have been featured—at prices representing very low margins—by all types and sizes of retailers (12).
Fresh fruits and vegetables also are in the front rank of traffic builders, attested to by produce being located as the first department the shopper sees on entering supermarkets. Freshness and appearance are the most important elements in building a quality reputation for the produce
17

department. With almost no brands or grades at the retail level, fruits and vegetables are bought almost universally by inspection.
Each firm combines and uses differently the elements of competitive strategy, attempting to make a somewhat unique appeal to potential shoppers and to attract a group of customers who will return week after week (19, pp. 115-117). Some stores make their strongest appeal to shoppers seeking economy—they try to offer the lowest general price level within the group of supermarkets available in a given market. Others make their appeal more on the basis of high quality—they offer the best merchandise available, albeit at somewhat higher prices. Still others emphasize wide assortments of items in gigantic stores, a maximimi number of brands of each item, and extensive specialty-food departments.
Typically, a chain sets a target margin for each major department. This target varies fairly widely among chains, depending on the overall target of the firm and on the role which that department has in creating the "store image" and contributing to the profits of the firm. Only a few chains are concerned about being "competitive" on all items in a department; most are interested only in the general impression or "image" that their prices create. Supermarkets do not charge the same margin on all products. If the operator's aim is to maximize the profits of the supermarket, he should not do so (23).
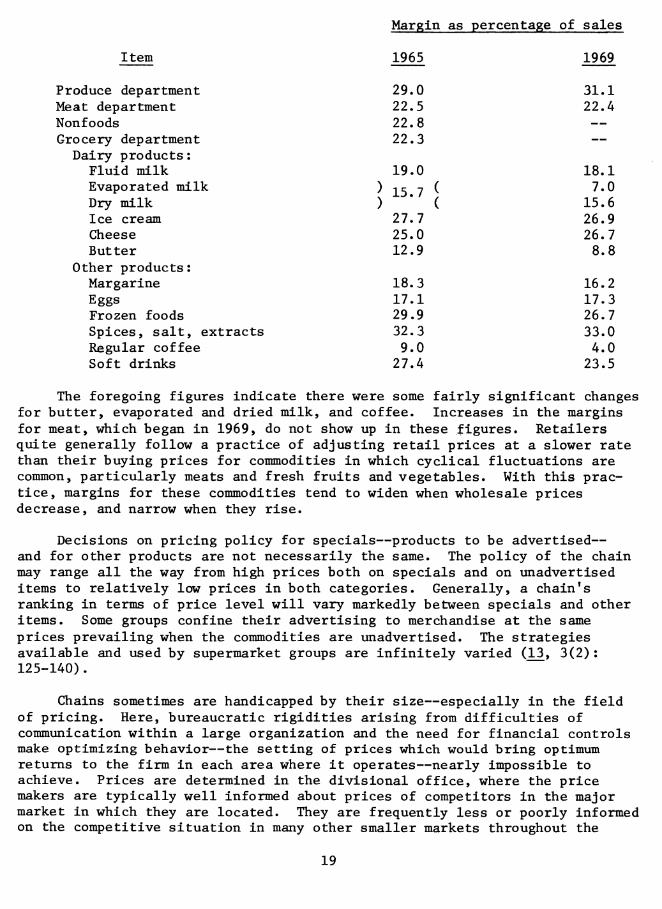
Margins vary widely by departments in supermarkets and even more widely among items within departments. Chain Store Age reports an average margin of 23.0 percent of sales in supermarkets operated by chains in 1965 (^) . The produce department margin was 29.0 percent, meat 22.5, nonfoods 22.8, and groceries 22.3 percent. Dairy products are included in the grocery department. The margin on fluid milk was 19.0 percent of the selling price, ice cream 27.7 percent, cheese 25.0 percent, butter 12.9 percent, and margarine 18.3 percent.
In comparison, margins on spices, salt, and extracts averaged 32.3 percent. These, of course, are items which are almost never specialed. Those on frozen foods averaged 29.9 percent, which must cover increased costs of operating frozen food cabinets, backroom storage, etc. In contrast, margins on regular coffee (excluding instant) averaged 9.0 percent. Coffee, a very high turnover item, is frequently specialed, since it brings customers into the store. Margins on evaporated and dried milk averaged 15.7 percent. These items are specialed moderately often, but generally carry a fairly low margin, since it is considered advantageous to reflect a low-price image with them. In addition, private labels are very common for canned and dried milk.
Margins do not stay the same over time. Changes on selected items between 1965 and 1969 are shown in the following tabulation (4^, p. 57).
18
Item
Margin as percentage of sales
1965 1969
Produce department Meat department Nonfoods Grocery department Dairy products :
Fluid milk Evaporated milk Dry milk Ice cream Cheese Butter
Other products: Margarine Eggs Frozen foods Spices, salt, extracts Regular coffee Soft drinks
29.0 22.5 22.8 22.3
19.0
15.7
27.7 25.0 12.9
18.3 17.1 29.9 32.3 9.0
27.4
31.1 22.4
18.1 7.0
15.6 26.9 26.7 8.8
16.2 17.3 26.7 33.0 4.0
23.5
The foregoing figures indicate there were some fairly significant changes for butter, evaporated and dried milk, and coffee. Increases in the margins for meat, which began in 1969, do not show up in these figures. Retailers quite generally follow a practice of adjusting retail prices at a slower rate than their buying prices for commodities in which cyclical fluctuations are common, particularly meats and fresh fruits and vegetables. With this prac- tice, margins for these commodities tend to widen when wholesale prices decrease, and narrow when they rise.
Decisions on pricing policy for specials—products to be advertised— and for other products are not necessarily the same. The policy of the chain may range all the way from high prices both on specials and on unadvertised items to relatively low prices in both categories. Generally, a chain's ranking in terms of price level will vary markedly between specials and other items. Some groups confine their advertising to merchandise at the same prices prevailing when the commodities are unadvertised. The strategies available and used by supermarket groups are infinitely varied (13, 3(2): 125-140).
Chains sometimes are handicapped by their size—especially in the field of pricing. Here, bureaucratic rigidities arising from difficulties of communication within a large organization and the need for financial controls make optimizing behavior—the setting of prices which would bring optimum returns to the firm in each area where it operates—nearly impossible to achieve. Prices are determined in the divisional office, where the price makers are typically well informed about prices of competitors in the major market in which they are located. They are frequently less or poorly informed on the competitive situation in many other smaller markets throughout the
19
division's trading area. Prices which are reasonably optimal in the central market may be indifferently so in outlying cities (16, pp. 100-101).
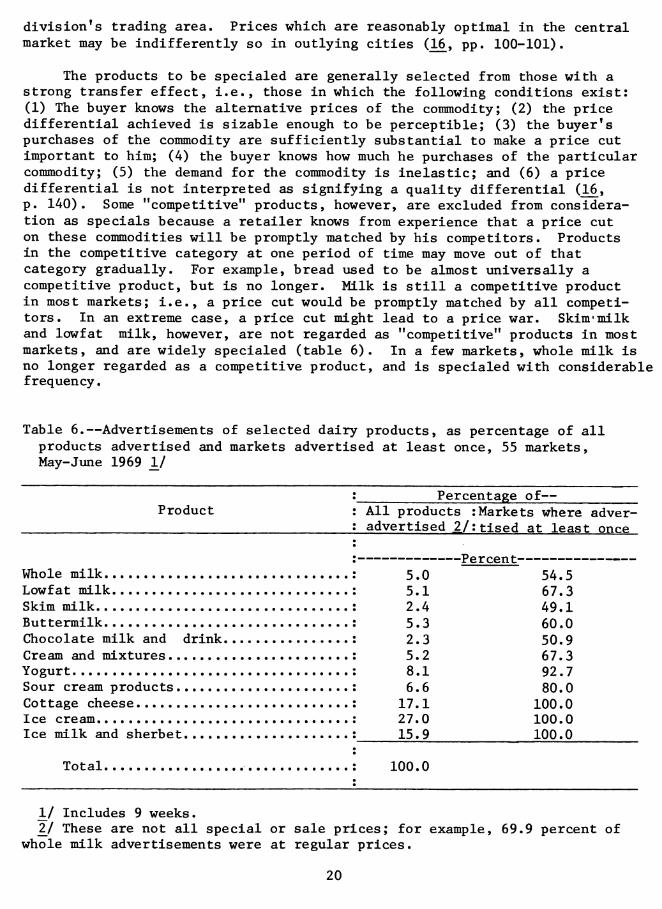
The products to be specialed are generally selected from those with a strong transfer effect, i.e., those in which the following conditions exist: (1) The buyer knows the alternative prices of the commodity; (2) the price differential achieved is sizable enough to be perceptible; (3) the buyer's purchases of the commodity are sufficiently substantial to make a price cut important to him; (4) the buyer knows how much he purchases of the particular commodity; (5) the demand for the commodity is inelastic; and (6) a price differential is not interpreted as signifying a quality differential (16, p. 140). Some "competitive" products, however, are excluded from considera- tion as specials because a retailer knows from experience that a price cut on these commodities will be promptly matched by his competitors. Products in the competitive category at one period of time may move out of that category gradually. For example, bread used to be almost universally a competitive product, but is no longer. Milk is still a competitive product in most markets; i.e., a price cut would be promptly matched by all competi- tors. In an extreme case, a price cut might lead to a price war. Skim«milk and lowfat milk, however, are not regarded as "competitive" products in most markets, and are widely specialed (table 6). In a few markets, whole milk is no longer regarded as a competitive product, and is specialed with considerable frequency.
Table 6.—Advertisements of selected dairy products, as percentage of all products advertised and markets advertised at least once, 55 markets. May-June 1969 \l
Product Percentage of—
All products : Markets where adver- advertised ¿/;tised at least once
Whole milk Lowfat milk Skim milk Buttermilk Chocolate milk and drink Cream and mixtures Yogurt Sour cream products Cottage cheese Ice cream Ice milk and sherbet
Total
5.0 —Percent
54.5 5.1 67.3 2.4 49.1 5.3 60.0 2.3 50.9 5.2 67.3 8.1 92.7 6.6 80.0
17.1 100.0 27.0 100.0 15.9 100.0
100.0
\J Includes 9 weeks. 2J These are not all special or sale prices; for example, 69.9 percent of
whole milk advertisements were at regular prices.
20

Independent supermarkets and those of small chains typically are well informed of the selling prices of their major competitors—larger chains— often through the efforts of wholesalers who furnish them with price lists of the major chains. The selling prices of major competitors have a key role in pricing decisions of small chains. Decisions on which prices to meet depend partly on the image the manager is attempting to maintain—he is "competitive" on price, or quality, or both.
Small retailers generally can be characterized as price takers or followers, although not in the sense that they attempt to meet the prices of the dominant chains. They typically deal with a different class of customer or a different type of business (the off-hours business of those who do most of their shopping at a supermarket).
Pricing Packaged Fluid-Milk Products
In markets for fluid products with the foregoing characteristics, results of the price-making process are more aptly considered in terms of price structures than of prices. There is no one fixed price in a market. At the retail selling level, prices vary not only by type and size of container, but often also between store and processor labels; sometimes between primary and secondary brands under store or processor label; between supermarkets, convenience stores, dairy stores, and small grocery stores; and often within these groups. There may be as many as 26 different retail store selling prices of fluid milk in a market and as few as four. A small number of these price differences are related to actual variations in physical characteristics of fluid milk—butterfat content, grade, vitamins added, etc. Some are cost- related, but more typically, they reflect different merchandising policies of retailers.
Although price structures tend to be reasonably stable for extended time periods, one or more retailers—having a specific objective—will introduce a change, for example, a private-label differential or a secondary brand. Introduction of a new container such as a plastic gallon often triggers a readjustment in price structures. Discount food stores frequently attempt to use milk as a loss leader or at least a zero-margin item, upsetting existing price structures. Often this occurs when a new discount food store
begins operations.
Dairy stores were once innovators in attempting to bring about drastic changes in price structures. In most markets, a modus vivendi has now been achieved. Frequently, supermarkets and dairy stores sell the basic grade of whole milk at the same price. In some markets, differentials still exist, often associated with the type of container—glass in dairy stores and paper in supermarkets. A number of dairy stores, however, have found that consumer bias against returning containers is more important than the cost advantages of glass in a captive operation, and have switched from glass to paper.
Home-delivery prices vary even more than store prices in a great many markets. Many customers on home-delivery routes do not know the prices they are paying—even in a general way—and especially are unaware of prices of
21
other handlers. Routemen usually do not discuss prices unless the buyer does. Hence, dealers receive little pressure to maintain the same price schedule as their competitors.
In many markets, some or all handlers use formal discount plans; in others, there are none. Informal discounts, are often available on an individual bargaining basis between customers and routemen—especially when home delivery is handled by subdealers.
Retail selling prices in stores are almost universally of the quoted- price type. Retailers establish prices, and consumers are quantity adjusters. To some extent, the buyer also has an option of adjusting the type and size of container, type of milk, and place of purchase to respond to varying prices.
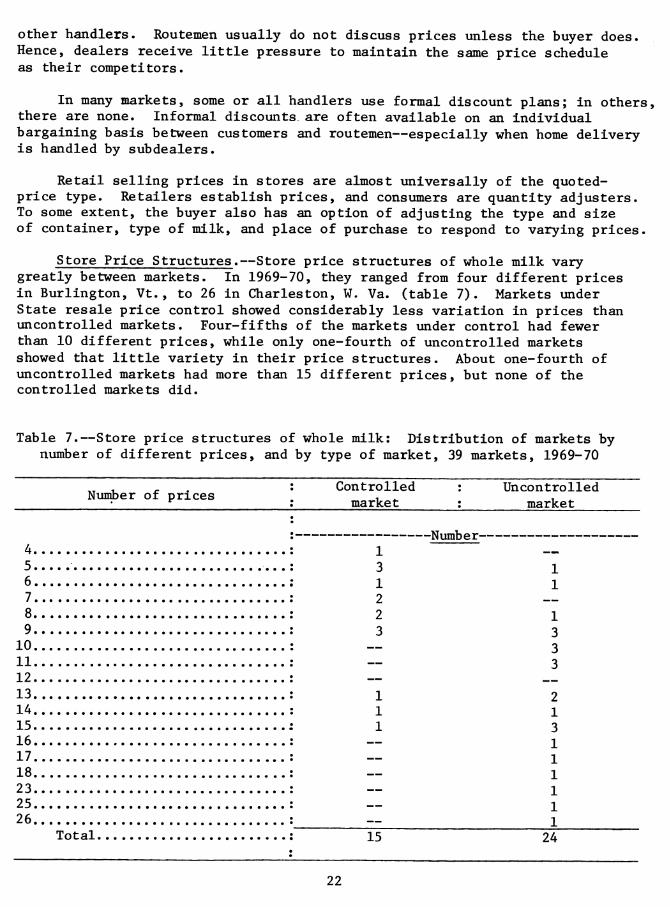
Store Price Structures.—Store price structures of whole milk vary greatly between markets. In 1969-70, they ranged from four different prices in Burlington, Vt., to 26 in Charleston, W. Va. (table 7). Markets under State resale price control showed considerably less variation in prices than uncontrolled markets. Four-fifths of the markets under control had fewer than 10 different prices, while only one-fourth of uncontrolled markets showed that little variety in their price structures. About one-fourth of uncontrolled markets had more than 15 different prices, but none of the controlled markets did.
Table 7.—Store price structures of whole milk: Distribution of markets by number of different prices, and by type of market, 39 markets, 1969-70
NunJjer of prices Controlled market
Uncontrolled market
-Number- 4 5 6 7 8 9
10 11 12 13 14 15 16 17 18 23 25 26
Total.
1 3 1 2 2 3
1 1 1
1 1
1 3 3 3
2 1 3 1 1 1 1 1 1
15 24
22

There is a base price in every market. Nearly always it is the supermarket price for half-gallon paper containers of basic grade milk— usually store-brand milk. If a store does not carry its own brand, it sells a processor brand at the same price that other stores are using for their own brands of milk. However, the proportion of milk sold at this basic price varies greatly (table 8). In 12 of 39 markets, about a fourth of the milk was sold at the modal (most common) price. In another 12 markets, 30-39 percent of milk was sold at the modal price. In only one market was as much as 71 percent of milk sold at the modal price.
In a third of the controlled markets and about a fifth of the uncon- trolled markets, no milk was sold below modal price (table 9). In the remaining markets, the amount of milk sold below the modal price varied substantially—increasing to 55 percent in Dayton, Ohio.
In every market, at least some milk was sold above the modal price (table 10). The amount ranged from 11 percent above the modal price in Burlington, Vt., to 78 percent in Peoria, 111. In 75 percent of uncon- trolled markets—but only 20 percent of controlled markets—5 percent or more of milk was selling at 9 cents or more per half gallon above the modal price.
A considerable part of the variation in prices was, of course, due to differences among sizes and types of containers (table 11). Quarts univer- sally sold at prices 1-20 cents above half-gallon paper containers. Half- gallon glass generally costs less than paper, but not in all areas. Gallons generally were less than two half-gallon paper, with differentials ranging as high as 17 cents per half gallon-equivalent.
Pricing practices of store brands, compared with processor brands, varied widely. In supermarkets having both store and processor brands, there was typically a differential between the two brands of milk in the same size and type of container, except in markets with State resale price control (table 12). In controlled markets, processor-brand and store- brand milk commonly sold at the same price. In uncontrolled markets, the most common differentials between the two types of brands were 2 cents per half gallon and 4 cents per gallon, although they ranged up to 12 cents in Charleston, W. Va.
The most common practice of supermarkets not carrying store-brand milk was to sell processor milk at the price charged by other stores for store- brand milk (table 12). In a few markets, these supermarkets sold their milk at a differential above store-brand milk prices in other stores.
Dairy stores generally sell milk at prices below those in supermarkets, but not in every area (table 13). Dairy store prices for half gallons were below those in supermarkets in 7 of 8 controlled markets and 11 of 16 uncon- trolled markets. The differentials ranged as high as 13 cents per half gallon in New Haven, Conn., although the median differential would be between 1 and 2 cents in uncontrolled markets, and less than 1 cent in
controlled markets.
23

Table 8.—Store price structures of whole milk: Distribution of markets by percentage of milk sold at the modal price, and by type of market, 39 markets, 1969-70
Percentage of milk sold
Markets with specified percentages of milk sold at the modal price
Controlled Uncontrolled
-Number- 0-19
20-29 30-39 40-49 50-59 60-69 70-79 80-100
Total. 15 24
Table 9.—Store price structures of whole milk: Distribution of markets by percentage of milk sold below the modal price, and by type of market, 39 markets, 1969-70
Markets with specified pe rcentages of milk
Percentage of in-i11r cr.1H
sold at pri 2es below the modal price by— : 0.1-1. 9 cents : 5.0 cents or more : Any amount
[Controlled |Uncontrolled]Controlled]Uncontrolled'Controlled [Uncontrolled
_ V u«-
0 ..: 6 8 14 —
17 5 5 0.1-4.9 ..: 4 7 1 2 2 3 5.0-9.9 ..: 4 2 — 1 5 1 10.0-14.9 .. ; 1 — 2 1 3 15.0-19.9 .. : 2 — 1 — 3 20.0-24.9 .. : 1 3 — 1 1 1 25.0-29.9 2 30.0-34.9 .. : — — — 1 1 35.0-39.9 . . : 1 — — — — 40.0-44.9 .. : — — — — 2 45.0-49.9 . . : — — — — 2 50.0-54.9 .. : — — — — 1
Total ..: 15 24 15 24 15 24
24

Table 10.—Store price structures of whole milk: Distribution of markets by percentage of milk sold above the modal price, and by type of market, 39 markets, 1969-70
Percentage of milk sold 0.1-1.9 cents
Markets with specified percentages of milk sold at prices above the modal price by—
'Controlled'Uncontrolled
2.0-5.9 cents
Controlled'Uncontrolled
9.0 cents or more
Controlled'Uncontrolled
Any amount
Controlled'Uncontrolled
to Ln
0 : 1 0.1-4.9 : 3 5.0-9.9 : 2 10.0-14.9 : 3 15.0-19.9 : 1 20.0-24.9 : 2 25.0-29.9 : 2 30.0-34.9 : 1 35.0-39.9 : 40.0-44.9 : 45.0-49.9 : 50.0-54.9 : 55.0-59.9 : 60.0-64.9 : 65.0-69.9 : 70.0-74.9 : 75.0-79.9 ;
Total : 15
6 6 3 3 1 2 3
Number 2 7 4 5 4 3 2
4 2 3 1 1 1
5 3 1 1 3 1 2 1 1 3 1 1
24 15 24 15 24 15 24
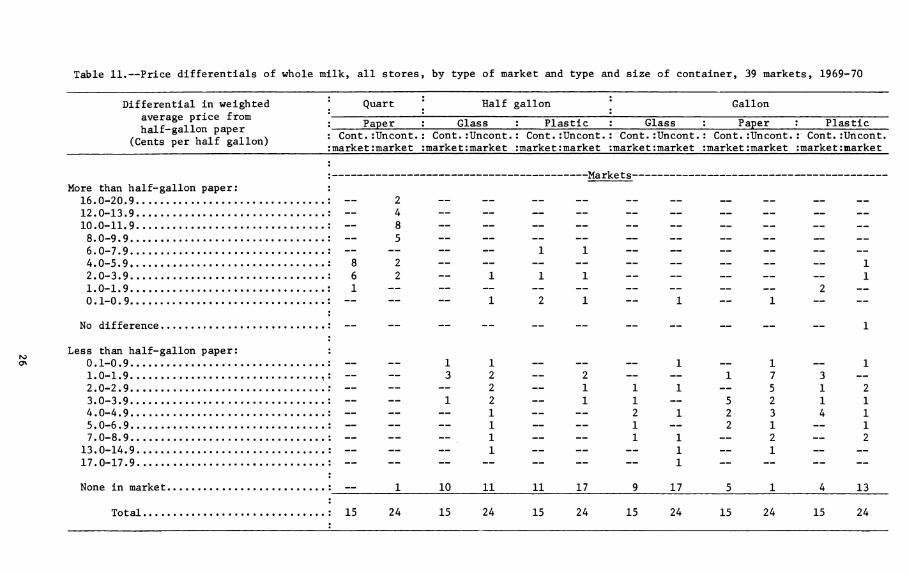
Table 11.—Price differentials of whole milk, all stores, by type of market and type and size of container, 39 markets, 1969-70
Differential in weighted average price from half-gallon paper
(Cents per half gallon)
Quart Half gallon Gallon
Paper Glass Plastic Glass : Cont.lUncont. :market ;market
: Cont.:Uncont. :market:market
Cont.rUncont. marke t:market
: Cont.rUncont. :market :market
Paper Plastic Cont.rUncont.
market :market : Cont.rUncont. rmarket market
r ^Markets- More than half-gallon paperr r
16.0-20.9 : — 2 12.0-13.9 r — 4 10.0-11.9 : — 8 8.0-9.9 r — 5 6.0-7.9 r — — — — 11 4.0-5.9 2 8 2 — — 2.0-3.9 r 6 2 — 1 11 — 1.0-1.9 r 1 0.1-0.9 : — — — 1 2 1
No difference r
Less than half-gallon paperr r 0.1-0.9 : — 1.0-1.9 ,r — 2.0-2.9 r — 3.0-3.9 : — 4.0-4.9 r — 5.0-6.9 r — 7.0-8.9 r —
13.0-14.9 r — 17.0-17.9 r —
None in market r
Total r 15
10 11
— 1 — 1 — 1 2 — — 17 3 — 1 11 — 5 12 1 1 — 5 2 11
2 1 2 3 4 1 I — 2 1 — 1 II — 2 — 2
__ 1 __ 1
11 17 17
24 15 24 15 24 15 24 15 24 15
13
24
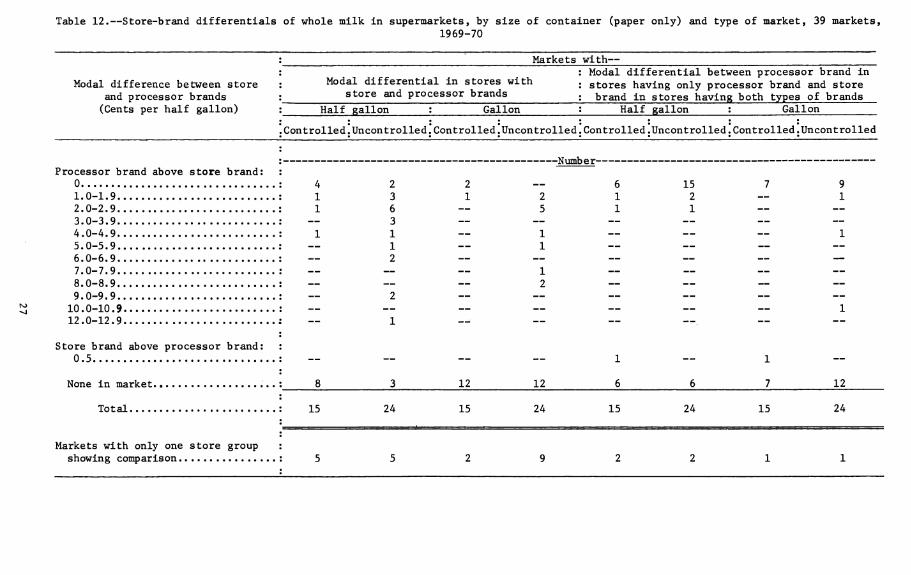
Table 12.—Store-brand differentials of whole milk in supermarkets, by size of container (paper only) and type of market, 39 markets, 1969-70
Modal difference between store and processor brands (Cents per half gallon)
Markets with—
Modal differential in stores with store and processor brands
Half gallon
.Controlled.Uncontrolled
Gallon
Controlled.Uncontrolled
Modal differential between processor brand in stores having only processor brand and store brand in stores having both types of brands
Half gallon
Controlled.Uncontrolled
Gallon
Controlled.Uncontrolled
-Number- Processor brand above store brand
0 1.0-1.9 2.0-2.9 3.0-3.9 4.0-4.9 5.0-5.9 6.0-6.9 7.0-7.9 8.0-8.9 9.0-9.9
10.0-10.9 12.0-12.9
Store brand above processor brand 0.5
None in market
Total
Markets with only one store group showing comparison
15 2 1
8 3 12 12 6 6 7 12
15 24 15 24 15 24 15 24
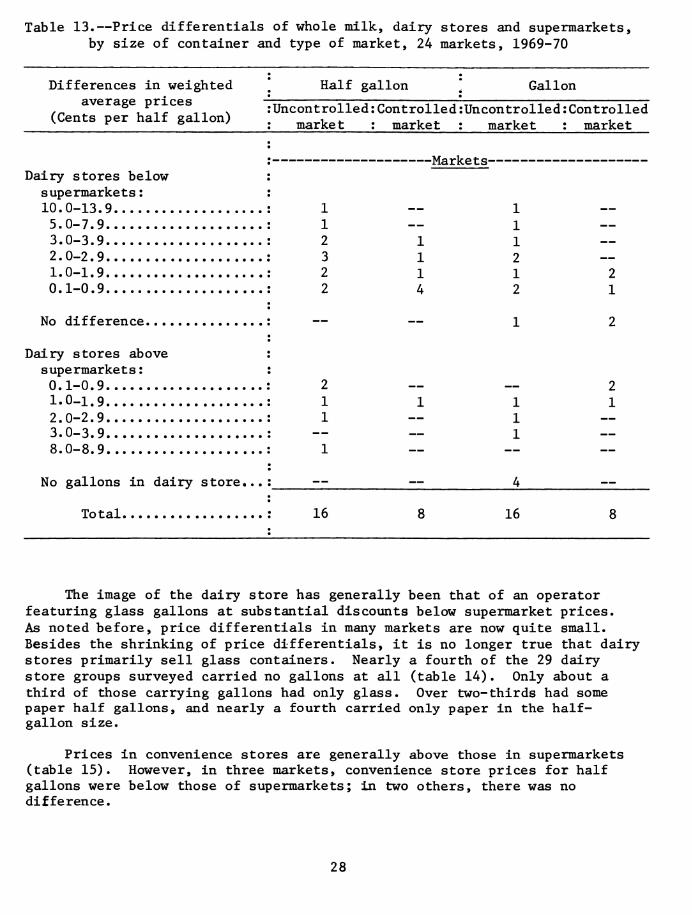
Table 13.—Price differentials of whole milk, dairy stores and supermarkets, by size of container and type of market, 24 markets, 1969-70
Differences in weighted average prices
(Cents per half gallon)
Half gallon
:Uncontrolled:Controlled : market : market
Gallon
Uncontrolled :Controlled market : market
-Markets- Dairy stores below :
supermarkets : :
5.0-7.9 : 1 3.0-3.9 : 2 2.0-2.9 : 3 1.0-1.9 : 2 0.1-0.9 : 2
No difference :
Dairy stores above : supermarkets : : 0.1-0.9 : 2 1.0-1.9 : 1 2.0-2.9 : 1 3.0-3.9 : 8.0-8.9 : 1
No gallons in dairy store...: ^Z.
Total : 16
1 1 1 4
1 1 1 2 1 2
1 1 1
16
2 1
The image of the dairy store has generally been that of an operator featuring glass gallons at substantial discounts below supermarket prices. As noted before, price differentials in many markets are now quite small. Besides the shrinking of price differentials, it is no longer true that dairy stores primarily sell glass containers. Nearly a fourth of the 29 dairy store groups surveyed carried no gallons at all third of those carrying gallons had only glass. paper half gallons, and nearly a fourth carried only paper in the half- gallon size.
(table 14). Only about a Over two-thirds had some
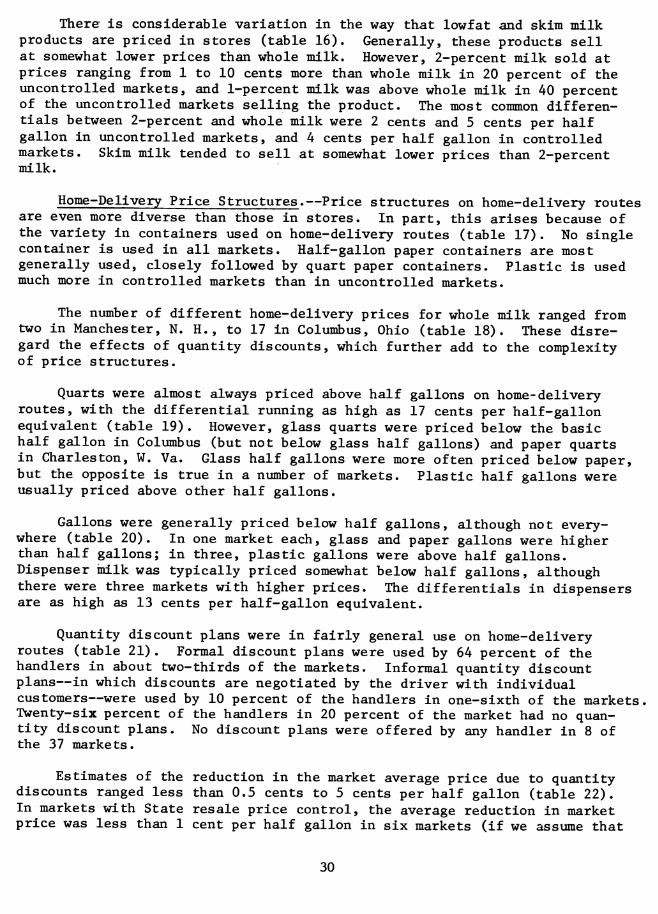
Prices in convenience stores are generally above those in supeimarkets (table 15). However, in three markets, convenience store prices for half gallons were below those of supermarkets; in two others, there was no difference.
28
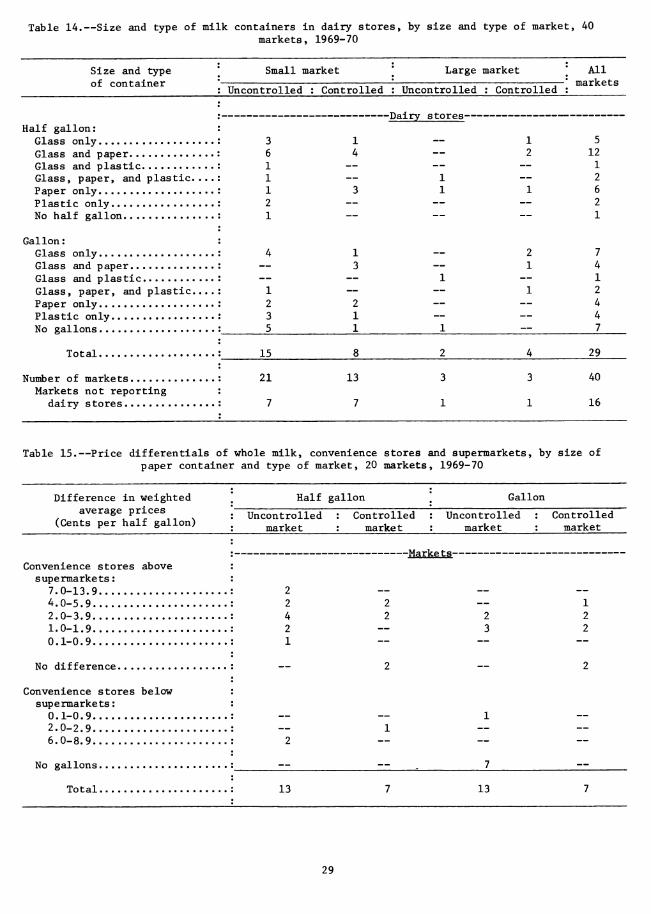
Table 14.—Size and type of milk containers in dairy stores, by size and type of market, 40 markets, 1969-70
Size and type of container
Small market
Uncontrolled : Controlled
Large market
Uncontrolled : Controlled
All markets
Half gallon: Glass only Glass and paper Glass and plastic Glass, paper, and plastic Paper only Plastic only No half gallon
Gallon : Glass only Glass and paper Glass and plastic Glass, paper, and plastic Paper only Plastic only No gallons
Total
Number of markets Markets not reporting
dairy stores
^jj
1
aiiry SLores
1
-•-••—'-——-- —
3 __ 5 6 1 1
4 — 2 12 1 2 1
1 2 1
3 1 1 6 2 1
4 1 2 7 ~ 3
1 1 4
1 2 1 1
2 2 — — 4 3 1 — — 4 5 1 1 — 7
15 8 2 4 29
21 13 3 3 40
7 7 1 1 16
Table 15.—Price differentials of whole milk, convenience stores and supermarkets, by size of paper container and type of market, 20 markets, 1969-70
Difference in weighted average prices
(Cents per half gallon)
Half gallon
Uncontrolled market
Controlled market
Gallon
Uncontrolled market
Controlled market
-Marke ts- Convenience stores above supermarkets :
7.0-13.9 4.0-5.9 2.0-3.9 1.0-1.9 0.1-0.9
No difference
Convenience stores below supermarkets:
0.1-0.9 2.0-2.9 6.0-8.9
No gallons
Total 13 13
29
There is considerable variation in the way that lowfat and skim milk products are priced in stores (table 16). Generally, these products sell at somewhat lower prices than whole milk. However, 2-percent milk sold at prices ranging from 1 to 10 cents more than whole milk in 20 percent of the uncontrolled markets, and 1-percent milk was above whole milk in 40 percent of the uncontrolled markets selling the product. The most common differen- tials between 2-percent and whole milk were 2 cents and 5 cents per half gallon in uncontrolled markets, and 4 cents per half gallon in controlled markets. Skim milk tended to sell at somewhat lower prices than 2-percent milk.
Home-Delivery Price Structures.—Price structures on home-delivery routes are even more diverse than those in stores. In part, this arises because of the variety in containers used on home-delivery routes (table 17). No single container is used in all markets. Half-gallon paper containers are most generally used, closely followed by quart paper containers. Plastic is used much more in controlled markets than in uncontrolled markets.
The number of different home-delivery prices for whole milk ranged from two in Manchester, N. H., to 17 in Columbus, Ohio (table 18). These disre- gard the effects of quantity discounts, which further add to the complexity of price structures.
Quarts were almost always priced above half gallons on home-delivery routes, with the differential running as high as 17 cents per half-gallon equivalent (table 19). However, glass quarts were priced below the basic half gallon in Columbus (but not below glass half gallons) and paper quarts in Charleston, W. Va. Glass half gallons were more often priced below paper, but the opposite is true in a number of markets. Plastic half gallons were usually priced above other half gallons.
Gallons were generally priced below half gallons, although not every- where (table 20). In one market each, glass and paper gallons were higher than half gallons; in three, plastic gallons were above half gallons. Dispenser milk was typically priced somewhat below half gallons, although there were three markets with higher prices. The differentials in dispensers are as high as 13 cents per half-gallon equivalent.
Quantity discount plans were in fairly general use on home-delivery routes (table 21). Formal discount plans were used by 64 percent of the handlers in about two-thirds of the markets. Informal quantity discount plans—in which discounts are negotiated by the driver with individual customers—were used by 10 percent of the handlers in one-sixth of the markets. Twenty-six percent of the handlers in 20 percent of the market had no quan- tity discount plans. No discount plans were offered by any handler in 8 of the 37 markets.
Estimates of the reduction in the market average price due to quantity discounts ranged less than 0.5 cents to 5 cents per half gallon (table 22). In markets with State resale price control, the average reduction in market price was less than 1 cent per half gallon in six markets (if we assume that
30

Table 16.—Price differentials of milk products, paper containers, by type of product, size of container, and type of market, 39 markets, 1969-70
Difference in weighted average prices from whole milk in same container
(Cents per half gallon)
2-percent milk 11-percent milk*. Skim milk
Half gallon Gallon Half gallon Quart Half gallon : Cont.rUncont. :market:market
: Cont.rUncont. :market:market
: Cont.:Uncont. :market:market
: Cont.:Uncont. :market:market
: Cont.:Uncont. :market:market
: Marke ts- Less than whole milk: :
11.0-12.9 : — 8.0-9.9 : ~ — — 1 7.0-7.9 : — 6.0-6.9 : — 5.0-5.9 : — 4 ~ 5 ~ 1 4.0-4.9 : 4 2 2 1 11 3.0-3.9 : 12 12 — 2 2.0-2.9 : —5 — 2 1 ~ 1.0-1.9 : 13 — 2 2 ~ 0.1-0.9 : 2 3 ~ ~ 12
No difference : — — — — 2
More than whole milk: : 0.1-0.9 : 2 ~ ~ — 2 2 1.0-1.9 : — 1 ~ — — 1 2.0-2.9 : ~ ~ ~ 1 3.0-4.9 : ~ ~ — — — 1 6.0-7.9 : — 2 8.0-10.9 : — 2
None in market : 5 0 12 10 6 14_
Total : 15 24 15 24 15 24 15 24 15 24
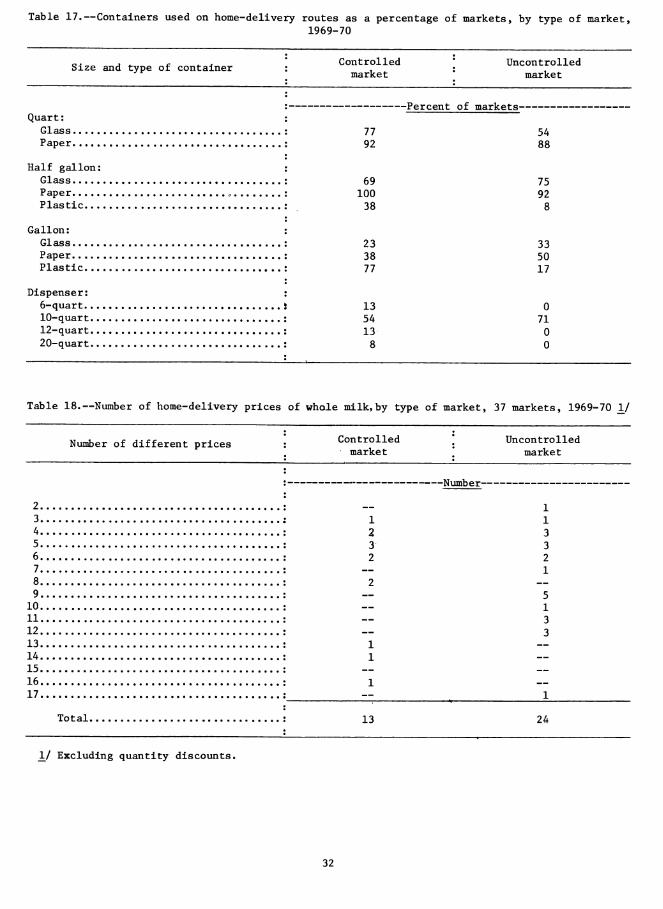
Table 17.—Containers used on home-delivery routes as a percentage of markets, by type of market, 1969-70
Size and type of container Controlled market
Uncontrolled market
-Percent of markets- Quart: :
Glass : Paper :
Half gallon: Glass : Paper ., : Plastic :
Gallon: : Glass : Paper : Plastic :
Dispenser: : 6-quart 5 10-quart. : 12-quart : 20-quart :
77 92
69 100 38
23 38 77
13 54 13 8
54 88
75 92 8
33 50 17
0 71 0 0
Table 18.—Number of home-delivery prices of whole milk, by type of market, 37 markets, 1969-70 _!/
Number of different prices Controlled market
Uncontrolled market
-Number-
2 3 4 5 6 7 8 9
10 11 12 13 14 15 16 17
Total. 13 24
_!/ Excluding quantity discounts.
32
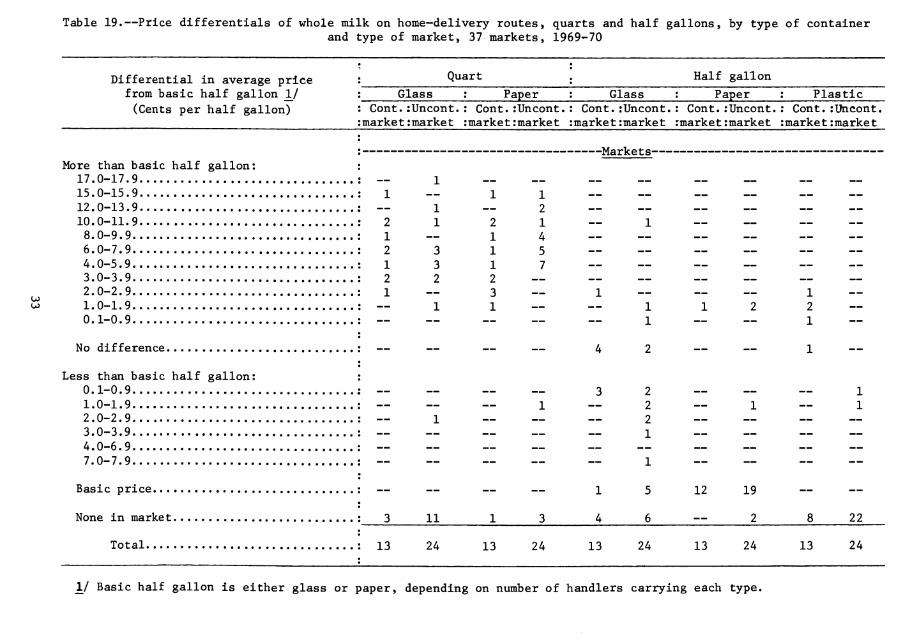
Table 19.—Price differentials of whole milk on home-delivery routes> quarts and half gallons, by type of container and type of market, 37 markets, 1969-70
Differential in average price from basic half gallon \] (Cents per half gallon)
Quart Half gallon
Glass Paper Glass Paper Plastic : Cont.:Uncont.: Cont.rUncont.: Cont.rUncont.: Cont.:Uncont.: Cont.rUncont. :market:market :market:market :market:market rmarket:market :market:market
U5
: Markets- More than basic half gallon: :
17.0-17.9 : — 1 15.0-15.9 : 1 — 1 1 -_ — 12.0-13.9 : — 1 — 2 10.0-11.9 : 2 1 2 1 — 1 8.0-9.9 : 1 — 1 4 — --. 6.0-7.9 : 2 3 1 5 ~ ~ 4.0-5.9 : 13 1 7 ~ ~ 3.0-3.9 : 2 2 2 ~ ~ ~ 2.0-2.9 : 1 — 3 „ 1 „ 1.0-1.9 : — 1 1 „ „ 1 0.1-0.9 : — ~ — — — 1
No difference : — — — — 4 2
Less than basic half gallon: : 0.1-0.9 : — — „ „ 3 2 1.0-1.9 : ~ ~ _ 1 „ 2 2.0-2.9 : — 1 — — — 2 3.0-3.9 : — — — — — 1 4.0-6.9 : ~ 7.0-7.9 : ~ — — — ~ 1
Basic price : — — — — 1 5
None in market ; 3 11 1 3 4 6_
Total : 13 24 13 24 13 24
12 19
2 22
13 24 13 24
jL/ Basic half gallon is either glass or paper, depending on number of handlers carrying each type.
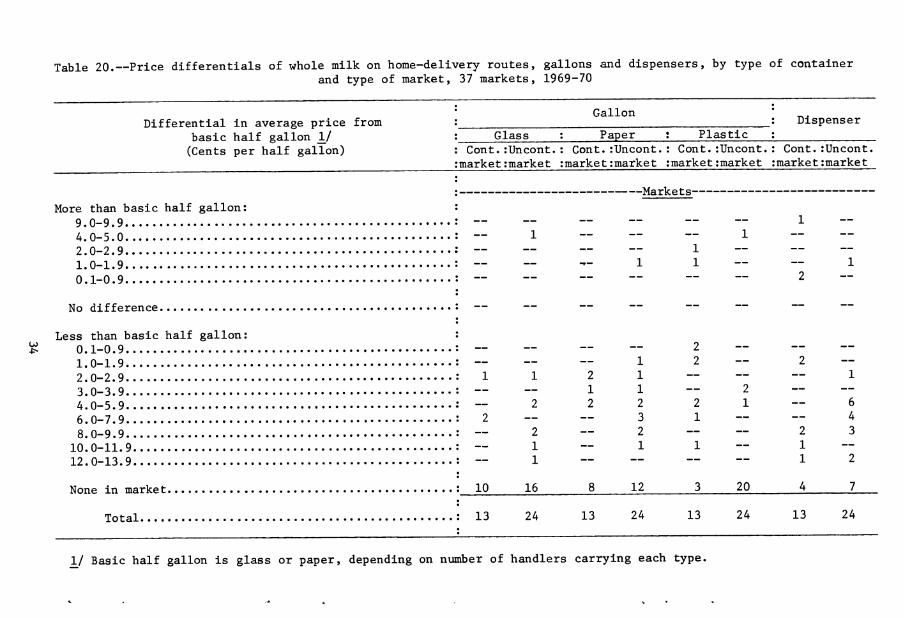
Table 20.—Price differentials of whole milk on home-delivery routes, gallons and dispensers, by type of container and type of market, 37 markets, 1969-70
Differential in average price from basic half gallon 1/ (Cents per half gallon)
Gallon Dispenser
Glass Paper Plastic : Cont.rUncont.: Cont.rUncont. rmarketrmarket ;market:market
: Cont.rUncont. :market :market
: Cont.lUncont. :market :market
More than basic half gallon: 9.0-9.9 4.0-5.0 2.0-2.9 1.0-1.9 0.1-0.9
-Markets-
No difference.
4i-
Less than basic half gallon: 0.1-0.9 1.0-1. 2.0-2. 3.0-3. 4.0-5. 6.0-7. 8.0-9.
10.0-11.9. 12.0-13.9.
None in market.
— — — — 2 — — — — — — 1 2 — 2 —
1 1 2 1 — ~ ~ 1 — — 1 1 — 2 — — — 2 2 2 2 1 — 6
: 2 — — 3 1 — — 4 — 2 — 2 — — 2 3 — 1 — 1 1 — 1 —
: — 1 — — — — 1 2
: 10 16 8 12 3 20 4 7
Total : 13 24 13 24 13 24 13 24
IJ Basic half gallon is glass or paper, depending on number of handlers carrying each type.
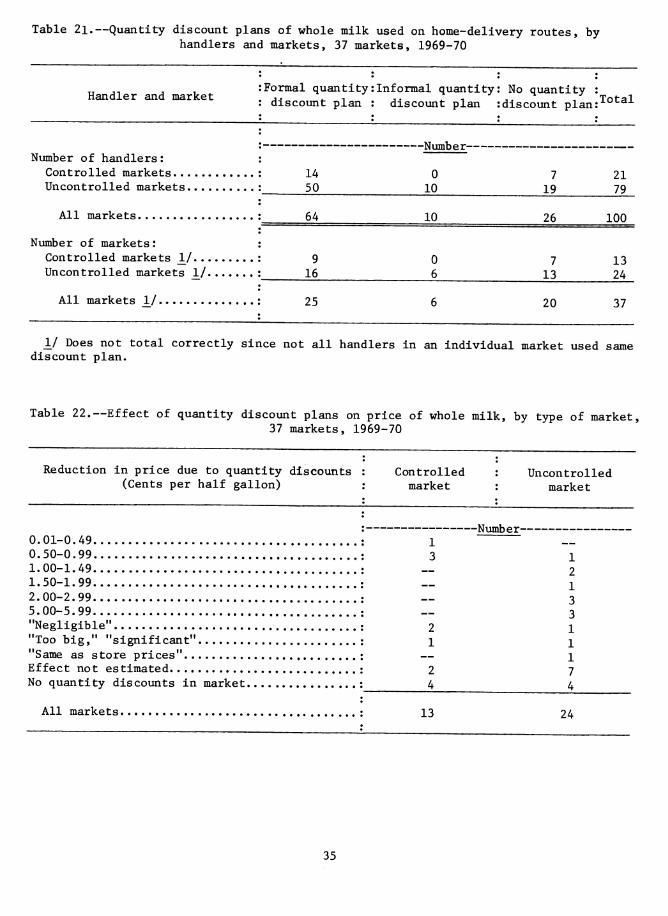
Table 2l.—Quantity discount plans of whole milk used on home-delivery routes, by handlers and markets, 37 markets, 1969-70
Handler and market
Number of handlers : Controlled markets... Uncontrolled markets.
All markets.
Number of markets : Controlled markets 1/.., Uncontrolled markets 1/.
All markets 1/.
Formal quantity: discount plan
Informal quantity: discount plan
No quantity discount plan; Total
-Number-
14 50
0 10
7 19
21 79
64 10 26 100
9 16
0 6
7 13
13 24
25 20 37
1/ Does not total correctly since not all handlers in an individual market used same discount plan.
Table 22.—Effect of quantity discount plans on price of whole milk, by type of market, 37 markets, 1969-70
Reduction in price due to quantity discounts : Controlled (Cents per half gallon) : market
0.01-0.49 0.50-0.99 1.00-1.49 1.50-1.99 2.00-2.99 5.00-5.99 "Negligible" "Too big," "significant" "Same as store prices" Effect not estimated No quantity discounts in market.
All markets
2 1
2 4
Uncontrolled market
-Number-
1 2 1 3 3 1 1 1 7 4
13 24
35

"negligible" is that small) and "significant" in one market. In markets with- out resale price control, price reductions were substantially larger. In 6 of 10 markets where effects were estimated, the average price reduction ranged 2 to 5 cents per half gallon. In Chicago, handlers reported that quantity discounts would lower home-delivery prices to that of store prices— a reduction of nearly 8 cents per half gallon.
Wholesale Pricing.—The pricing process for wholesale sales of fluid-milk products to hotels, restaurants, and other eating places, and for sale to small retail stores is generally of the quoted-price type. Occasionally, there may be some minor element of bargaining—rparticularly through the use of a threat to shift to another supplier. In general, however, such buyers are price-takers. Competitive moves are often nonprice.
The pricing process of chainstores and other groups is different. In general, they negotiate with processors for a contract (either written or oral) to supply fluid-milk products to a chain division or a substantial part of it. An extreme example of this bargaining process is found in the recent Federal Trade Commission case against á major processor arising out of the bargaining process for the supply of chain supermarkets in parts of West Virginia. In general, it is fairly safe to assume that such prices are driven down to levels which approximate the costs of providing the service. In many cases, they may not cover overhead. Activities of the Federal Trade Commission in enforcement of price discrimination legislation will tend to raise these prices above the level which would otherwise exist.
Pricing Other Dairy Products
Dairy products other than fluid milk are sold mostly through food stores— almost entirely supermarkets and convenience stores—except for sales of ice cream through specialty ice cream stores and drug stores. While small amounts of these products are sold on home-delivery routes, the quantity is not large enough to be significant.
Dairy products other than whole milk are not regarded as "competitive" products. Ice cream is widely regarded as an excellent traffic builder and is frequently specialed. It has been treated—like broilers—as a low-margin item for most of the post-World War II period. In fact, supermarket margins on standard ice cream have become so low, due in part to frequent specialing, that intense efforts have been made to build sales of "quality" ice cream at substantially higher prices and margins.
Cheese is frequently specialed. Specials on cheese are particularly useful since they attract buyers to the cheese display which may consist of a very large number of items, most of which carry a large margin. Thus, a special on a relatively inexpensive style of cheese may attract many impulse buyers to higher margin items.
Butter is seldom specialed since it no longer possesses the transfer effect it once had. It is now a specialty item, and the transfer effect of
36

a special on butter is very small. Most butter buyers are dedicated to the product and will shift only with greatest reluctance.
Evaporated milk is specialed fairly frequently since it is often a large-budget item for consumers who use it in quantity. Thus, those using canned milk for baby formula can be attracted by a special when they may buy as much as a case.
Wholesale Pricing.—Wholesale prices of processor-labeled dairy products other than fluid milk are set almost entirely by the quoted-price system. Larger buyers of private-labeled products can obtain products at negotiated prices, while smaller buyers deal with a quoted-price system.
Wholesale prices of butter and cheese fluctuate quite closely according to the changing supply-and-demand situation, so that the pricing system for these products is something of a hybrid between the quoted-price system and supply-and-demand pricing. For most of the other products, prices fluctuate less often, being somewhat less sensitive to changes in supply and demand of raw milk. Butter is particularly sensitive to changes in supply and demand because of its residual nature. Wholesale prices of butter, nonfat dry milk, and American cheese rest on a floor provided by the support purchase program of the U.S. Department of Agriculture so long as the Department is purchasing these products. When supplies become tighter, prices tend to rise above support levels.
ORDER PRICING
This section discusses the setting of prices of raw milk by public authority—either Federal or State. The problem facing the Federal or State pricing authority is the same, although the legal authority and limitations are different. The pricing authority must operate within the pricing process described in the preceding section.
Pricing Class I Milk
Objectives of Class I Pricing—Level
There are two possible objectives in setting the general level of Class I milk prices: (1) Set prices for Class I milk which will maximize gross returns to producers, or (2) set Class I prices which will minimize the price to consumers and thereby maximize consumption. These objectives do not deal with intermarket price relationships, seasonal variation, and similar problems. The pricing authority can use either objective or some combination of the two— that is, a compromise. However, if he selects a compromise, the pricing deci- sion must be recognized as arbitrary—as between the bounds set by the two possible objectives. Some rule of thumb can be used as guidance—for example, midway from the price determined by principle one to that determined by principle two—but the decision is still arbitrary.
37
If the first principle is controlling, then the pricing authority is required to determine the time period over which to maximize producer returns. Since demand for milk is more elastic in the long run than in the short run, different pricing policies would be followed. It seems evident that an extreme short-run pricing policy would be self-defeating, since it would greatly encourage development of substitutes for fluid-milk products.
In contrast, an extreme long-run pricing policy is probably too indeterminant to be useful as a guide. As has been said, "In the long run, we are all dead." It certainly applies to farmers as well as to cows. In the long run, everything changes, so that long-run analysis becomes virtually impossible.
These considerations clearly indicate that a medium-term pricing policy is appropriate. One should not be guided by the objective of maximizing returns today nor be concerned solely about the next generation. The appropriate time period is in the range of 5-10 years.
Clearly, both objectives are respectable; either can be chosen without major damage to public interest. Both are implied by the language of the Agricultural Marketing Agreement Act of 1937, and the weight to be given to each is determined by the pricing authority.
If the objective were to maximize consumption of fluid-milk products, the price would always be set at the same level as that for manufacturing- grade milk. Hence, there would be no price discrimination.
If the objective were to maximize returns to producers, the solution is simply one of knowing the demand curve for Class I milk. The pricing authority selects the point on the demand curve which maximizes total revenue, and the problem is solved. The problem, however, is actually not that simple since our knowledge of the shape of the demand curve is not exact, and we know even less about its shape 5 years hence.
Within these overall objectives, there are secondary considerations of guiding quantity. Quantity consideration pertains to the directing influence of price on production and consumption. Class I price could be set to lead to consumption of a desired quantity or to cause producers to respond by bringing forth the desired quantity. The objective here could be absolute volumes or a better relationship of either production or consumption with the other.
Stability in marketing is implicit in the quantity objective. If violent price and quantity fluctuations are considered undesirable, then stability, or at least gradual change, may well be a worthwhile objective. Realization of stability through Class I pricing depends on properly evaluating the interrelationship between quantity and price.
Certainly, these secondary objectives could be considered part of the overall objectives. Yet, under certain circumstances, they should be recog- nized as separate from the opposing objectives of maximizing returns to producers or minimizing prices to consumers.
38

Classified Pricing in Space, Form, and Time
Economic theory has long recognized that utility exists in at least three forms—space, form, and time. Prices that users are willing to pay, as reflected in their demand schedules, include these three elements.
Prices of raw milk sold by farmers to processors are differentiated on the basis of some of these elements. Typically, prices differ by location by the estimated cost of transportation between points. Thus, milk at the farm brings a lower price than milk delivered to the processor's plant.
In the form dimension, prices are varied on at least three bases. Prices for Grade A, Grade B, Certified, and perhaps other forms of milk, usually vary by at least the cost necessary to meet sanitary requirements for one grade, compared with another. Within the grade, prices are varied according to butterfat content and—at least in some cases—the size of the lot is recognized as influencing costs of milk pickup; pickup charges vary according to the size of the lot.
The time element is generally recognized in only one dimension. Prices are varied seasonally to encourage greater production during short months of the year to even out supplies, but other elements of time utility are ignored in most cases. Time utility includes additional factors that bear economic costs and have economic values, which could be considered in pricing. Milk is produced in a fairly even flow from day to day with essentially random variation between days. In contrast, demand at the fluid-milk processing plant is not steady on a day-to-day basis. There is substantial variation between days of the week, which is fairly uniform in character, and a consid- erable random element. The day-to-day variation from both these causes has increased sharply during the past 20 years, and can be expected to increase further.
In earlier periods, there was much less day-to-day variation in processing plant demand and relatively little difference among processors. Under these circumstances, ignoring variations in time utility in the pricing schedule did not seriously discriminate between handlers or their suppliers. This is no longer the case. Handlers located at the same point with the same annual utilization of milk for fluid products and milk supplies, under the same supply contract with a cooperative, may be receiving substantially different services, but paying the same price. The handler with greater day-to-day variation in demand is avoiding much greater costs by use of the full-supply contract than is his competitor with relatively even demand from day to day. Similarly, a cooperative incurs a much higher cost in serving the first handler than the second.
Thus, there are in effect many subclasses of Class I milk which conceptually and practically could be priced differently. The first sub- division could be on the basis of "contract" milk versus "call" milk; that is, on the distinction of whether the quantities to be delivered are specified in advance, annually, quarterly, or monthly. Contract milk could be further subdivided into deliveries on specified days, 7 days per week,
39
6 days per week, 5 days per week, etc., to once a week. Alternatively, it could be done on the basis of Sunday deliveries, Monday deliveries, etc. Then there would be another subclass of contract milk—that which was delivered in fixed amounts 1 or more days per week, but the day not specified in advance.
Call milk over and above these needs could be subdivided between that needed to meet within-week deficits and that needed to meet seasonal fluctua- tions in demand. Each subclass would be subject to a differential over the basic Class I price for contract milk delivered 7 days a week in fixed quantities specified in advance. The differentials would be determined by the intersection of supply and demand curves—the supply curve reflecting costs of the cooperative providing the service, and the demand curve the costs avoided by the processor in having the cooperative provide the service.
Class II milk used in manufactured products could be subdivided in an analogous fashion. Soft products—ice cream and cottage cheese—could be differentiated from hard products—cheese, butter, and powder—since the nature of their demand for milk by processors is different. Subclasses would be generally similar to those of fluid products. For hard products, there might be some differentiation between specialty items and residual uses such as butter and powder.
Setting Price Levels in Practice
The classified pricing system has a very long history in U.S. milk markets. A classified pricing plan was first introduced in the Boston market about 1886 (_3, p. 67). In 1897, seven "contractors" (wholesalers) who handled about three-fourths of the milk used a classified pricing system which had been negotiated with the Milk Producers Union (26). In 1901, it was replaced by another plan which was essentially a base-rating plan (27). In 1918, a classified pricing program was reintroduced in the Boston market by the New England Milk Producers Association (_3, p. 58). A two-price plan was intro- duced in Minneapolis-St. Paul in 1918, in Baltimore in 1919, in Philadelphia in 1920, and in New York and Milwaukee in 1921 (_11, pp. 31 and 195). Numerous other markets adopted such plans in the 1920's and early 1930's. Their use was almost universal under Federal and State regulations enacted during the 1930's.
The setting of price levels under classified price plans prior to public regulation was a matter of negotiation between the cooperative and handlers. Low-side constraints were dictated by the need to obtain sufficient supplies of milk from producers to supply at least the Class I needs of the market. On the high side, the negotiators were constrained by the fear of loss of sales owing to rising prices and, probably more important, the need to avoid flooding the market with milk if producer prices got too high. Thus, supply and demand factors were not overlooked, but there was still a fairly wide range for negotiation.
Under Federal and State regulations, the bargaining process shifted to the hearing room. The same general arguments were presented, but a final decision was made by the public pricing authority.
40
Following World War II, some experiments were introduced to reduce the necessity for frequent hearings. The Boston Class I price formula attempted to approximate the appropriate Class I price by means of economic indexes. Similar formulas were developed for other northeastern markets. During the 1950's, mldwestem markets generally shifted to a formula which tied the Class I price to a fixed differential over the price of manufacturing milk in Minnesota and Wisconsin.
Until the mid-1960's, both economic formulas and manufacturing-milk formulas recognized that the ability of these formulas to evaluate changes in supply and demand was rather severely limited. Almost universally, they included a supply-demand adjuster which varied the Class I price from the level determined by the formula in response to actual deliveries and sales of milk for Class I use. In the late I960's, supply-demand adjusters were removed from nearly all the Federal orders (or made ineffective)—primarily to increase returns to producers and stimulate production in a period when milk production was declining.
In the last few years, cooperatives have been searching for a method of increasing Class I prices in an inflationary period with a minimum of public resistance. An economic formula to be applied to all Federal orders was proposed and rejected. It did not contain a supply-demand adjuster or other devices to accomplish the same objective.
Intermarket Price Differentials
The basic principles governing intermarket price relationships in a competitive market with classified pricing are well established (_2, 10(4): 113-130). There seems to be no alternative to these principles as a basis for establishing appropriate intermarket price relationships.
Not all points of friction and apparent inequities in intermarket price relationships are due to prices established by Federal and State orders. A substantial proportion of these are the result of different provisions in the orders dealing with all kinds of problems—types of pool, seasonal pricing plans, pooling requirements, use classification, and a very high proportion of the other provisions of orders. Recent decisions eliminating seasonal pricing arrangements in many orders have removed one source of inequities in the prices handlers in adjacent orders are required to pay for milk at various times of the year.
A set of minimum short-run prices can be established in a straightforward manner. Such a system would include the following: (1) Start with the price of manufacturing-grade milk at a plant in Minnesota and Wisconsin; (2) add on the additional costs of producing Grade A milk; (3) establish a base-pricing point, perhaps at Eau Claire, Wis.; and (4) establish a set of price relation- ships based on existing supplies and demands and transportation costs. A set of minimum prices would be established, but it ignores both supply and demand elasticities.
41
A longer run model taking into account both supply and demand elasticities seems preferable, but it emphasizes the need for estimates of both supply and demand elasticities for relatively small areas—which are hard to derive. A further complication arises because it appears that existing price levels for Class I milk are far from optimum in terms of producer returns. If demand elasticities in the range of -0.2 to -0.3 are realistic. Class I prices could be substantially higher than they have been at any time in the historical period, and generate increased returns to producers. For price-setting purposes, it may be desirable to ignore demand elasticities in such a model.
Related Issues
Classification.—Problems in classification concern how many classes there should be and what products should be placed in which class. Concep- tually, there could be an almost infinite number of classes—one for each product. However, problems of administration severely limit the number of classes which are practical to have under a given pricing scheme. Under some Federal orders, there have been as many as four or five classes at one time, but the number has generally been reduced to two, or at most three, because of a need for administrative simplicity.
Classification can make substantial differences in returns to producers. For example, xrnder many State orders in the South, buttermilk and skim milk products are in Class II. These products account for a substantial share of total fluid usage in the South, and the Class II classification significantly reduces producer returns.
Differences among orders in the classification of specific products can cause problems and place handlers under one order at a competitive disadvantage with those under another. Considering the substantial intermarket movement of packaged products and the zones of competition in unregulated areas, the costs and benefits of a national classification scheme should be evaluated. Under such a scheme, classification of an individual product would be the same under all Federal orders. Hearings on such a scheme have been held.
The basis for establishing different classes is the existence of different elasticities of demand for milk from local supplies used in that product (10, p. 20). This is not the same as the elasticity of demand for the final product.
Marketing Area.—USDA uses two factors in determining standards for the definition of marketing areas: (1) Substantial uniformity of sanitary require- ments throughout the area, and (2) market area that would encompass the sales area of the handlers to be regulated, minimizing involvement of handlers whose major Class I business is elsewhere. These standards, of course, assume that prices will appropriately be aligned with those in adjacent markets.
42
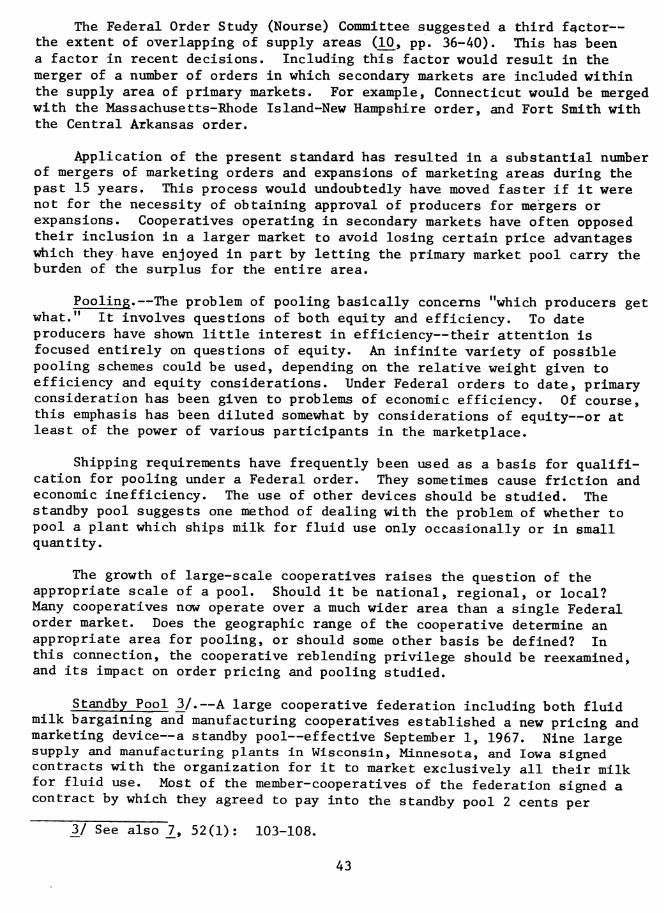
The Federal Order Study (Nourse) Committee suggested a third factor— the extent of overlapping of supply areas (10, pp. 36-40). This has been a factor in recent decisions. Including this factor would result in the merger of a number of orders in which secondary markets are included within the supply area of primary markets. For example, Connecticut would be merged with the Massachusetts-Rhode Island-New Hampshire order, and Fort Smith with the Central Arkansas order.
Application of the present standard has resulted in a substantial number of mergers of marketing orders and expansions of marketing areas during the past 15 years. This process would undoubtedly have moved faster if it were not for the necessity of obtaining approval of producers for mergers or expansions. Cooperatives operating in secondary markets have often opposed their inclusion in a larger market to avoid losing certain price advantages which they have enjoyed in part by letting the primary market pool carry the burden of the surplus for the entire area.
Pooling.—The problem of pooling basically concerns "which producers get what." It involves questions of both equity and efficiency. To date producers have shown little interest in efficiency—their attention is focused entirely on questions of equity. An infinite variety of possible pooling schemes could be used, depending on the relative weight given to efficiency and equity considerations. Under Federal orders to date, primary consideration has been given to problems of economic efficiency. Of course, this emphasis has been diluted somewhat by considerations of equity—or at least of the power of various participants in the marketplace.
Shipping requirements have frequently been used as a basis for qualifi- cation for pooling under a Federal order. They sometimes cause friction and economic inefficiency. The use of other devices should be studied. The standby pool suggests one method of dealing with the problem of whether to pool a plant which ships milk for fluid use only occasionally or in small quantity.
The growth of large-scale cooperatives raises the question of the appropriate scale of a pool. Should it be national, regional, or local? Many cooperatives now operate over a much wider area than a single Federal order market. Does the geographic range of the cooperative determine an appropriate area for pooling, or should some other basis be defined? In this connection, the cooperative reblending privilege should be reexamined, and its impact on order pricing and pooling studied.
Standby Pool 3J.—A large cooperative federation including both fluid milk bargaining and manufacturing cooperatives established a new pricing and marketing device—a standby pool—effective September 1, 1967. Nine large supply and manufacturing plants in Wisconsin, Minnesota, and Iowa signed contracts with the organization for it to market exclusively all their milk for fluid use. Most of the member-cooperatives of the federation signed a contract by which they agreed to pay into the standby pool 2 cents per
y See also 2, 52(1): 103-108.
43
hundredweight on all Class I milk which they sold. In turn, the standby pool agreed to pay 20 cents per hundredweight to the nine plants in the standby pool for all milk supplied for Class I use, except during the 3 flush months when the rate of payment was 10 cents per hundredweight. The selling price for milk from the standby pool to processors was the Minneapolis-St. Paul Federal order price for the location of the standby plant plus 60 cents per hundredweight, except that processors in markets in which the cooperative belonged to the federation paid no more than 25 cents per hundredweight over the local Class I price delivered to the market. In May 1969, the other major federation joined the standby pool so that most of the fluid-milk cooperatives in the central portion of the country are now contributing to the pool. A new cooperative was created in 1970 to operate the standby pool.
The primary objective of the standby pool is to improve the bargaining position of cooperatives in participating markets. The chief benefit to dairymen and their cooperatives derives from the drying up of alternative supplies of milk which might otherwise be available to handlers in regulated markets. Thus, the cooperatives demonstrate their united front to handlers. The handlers, seeing the cooperatives reaching agreement not to undercut each other, are more willing to agree to over-order prices. With increasing use of full supply contracts with handlers, the provision of reserve supplies of milk to fluid-milk markets is a lesser objective.
Experience under the standby pool operated by cooperatives demonstrates that this arrangement does work. Cooperatives in such unlikely places as Minneapolis-St. Paul have succeeded in obtaining over-order premiums where these have been nonexistent for years.
Cooperatives and their member producers can derive the following benefits from a standby pool operated under a marketing agreement, compared with present contractual arrangements: (1) More equitable sharing of the arrange- ment costs among all producers in the regulated markets, including those who are not members of cooperatives; (2) use of the Government's auditing and regulatory powers in the standby pool arrangement; (3) removal of the possi- bility of withdrawing from the arrangement as is now possible; (4) attraction of success and stability—probably increasing the number of participating cooperatives and markets, compared with present arrangements; and (5) different standing before the antitrust agencies.
The chief problem raised by the proposed marketing agreement is the possibility that it might be too great an attraction for unregulated plants. The present voluntary arrangement has the undeniable advantage of being able to exclude potential supply plants on somewhat arbitrary grounds. A Government-operated marketing agreement would have to proceed in a more objective manner. Adequate precautions, however, can probably be written into a marketing agreement to prevent this problem from arising.
Another possible problem^—the location differentials proposed in the marketing agreement—calls for further analysis. The cost of 1.5 cents per 10 miles is somewhat higher than that of long-haul shipment, according to
44
Economic Research Service studies (21). This would seem to indicate the possibility of windfall profits for either the supplying handler or the receiving handler, depending on who paid for the transportation. The implications of using these rates, compared with those more closely aligned to actual costs, should be examined.
The potential disappearance of manufactured grade milk could pose still another problem. Clearly, a standby pool would face very difficult problems if only one grade of milk existed—as would any pooling system (14).
Pricing Class II Milk
The pricing of Class II or "surplus" milk in fluid-milk markets differs considerably from that of Class I pricing. Class II is the residual class, and it is essential to set prices to producers so all milk will find a use and, at the same time, maintain these prices at acceptable levels. If Class II prices under Federal or State orders are set above competitive levels, problems will arise in finding an outlet for the milk. If prices are set below competitive levels, they will encourage plants making manufactured products to become pooled to obtain low-cost milk.
In the post-World War II period, the volume of surplus milk generally increased in fluid-milk markets. Its seasonal nature and uncertain volume and its dispersion among plants results in substantial risks in handling and a wide range in costs. These factors complicate price determination.
Prices of surplus milk in most fluid-milk markets are based on: (1) Prices paid producers of manufacturing-grade milk by plants in principal dairy regions; (2) formulas based on prices of manufactured products in the national market; or (3) prices paid producers of manufactured milk by nearby plants. Pricing based on (1) and (2) above recognizes that the market for manufactured products is national in scope and that all milk used in these products—regardless of where utilized—is competitive. These have worked best in major dairying areas where milk is used for most of the major prod- ucts and in which there is competition for the milk supply. However, in areas where milk production is of lesser importance, there are a fewer number of different types of plants, and these may be widely scattered. In such areas, the national market may not completely reflect local conditions, and some adjustments in the level of prices may be necessary.
If surplus prices are set too low, a higher price must be set for fluid milk and cream to assure producers of an acceptable blend price. Also, a surplus price which is too low may make surplus milk operations sufficiently profitable to encourage processors to divert milk to manufactured products. On the other hand, if the price is set too high, processors cannot process it profitably, and they may refuse to buy it from producers.
The appropriate relationship between Class II prices and the prices of unregulated milk having similar uses may not be the same in all seasons of the year. Seasonal differentials may be required to allow for local conditions.
45

There is a further question of the appropriate number of classes for surplus milk. Differences in the elasticity of demand for locally produced milk used in manufactured products must be considered. These differences arise out of the availability and acceptability of substitutes—both for the final product and as intermediate products used in their manufacture (6^, pp. 32-34).
RELATIVE VALUE OF BUTTERFAT AND NONFAT SOLIDS
Until World War II, butterfat had most of the market value of milk. With the development of the milk drying business during and since World War II, the nonfat solids portion acquired value. This value has become particularly pronounced in the last 10 years. Early pricing plans provided for a basic price of milk with a variation depending on the butterfat content. This type of pricing plan has generally been used, both in fluid-milk and manufacturing- milk markets, since the 1920's. In recent years, plans assigning a specific value to solids-not-fat or protein have been adopted by the State of California and by a few cooperatives in other areas.
The pricing of butterfat and solids-not-fat can be separated into producer and plant pricing. A producer-pricing plan is primarily designed to provide incentives to producers to stimulate production of nonfat solids, protein, or some other component. Such a plan can, of course, be applied in pricing milk to handlers. However, we are primarily concerned here with the pricing of butterfat and nonfat solids to handlers and its effects on product prices and sales.
The relative value of butterfat and solids-not-fat is effectively determined by the support purchase prices of butter and powder under the price support program of the Department of Agriculture (USDA). Until recently, the Department's discretion in determining relative values of butterfat and solids-not-fat was limited by the provisions of legislation requiring support both of milk for manufacturing use and of butterfat (in farmr-separated cream) between 75 and 90 percent of parity. With the signing of the Agricultural Act of 1970 by President Nixon on November 30, 1970, the requirement for the support of butterfat between 75 and 90 percent of parity was suspended until April 1, 1974. Therefore, USDA now has discretion to set support purchase prices in any relationship that will provide a support price for milk between 75 and 90 percent of parity.
Supply and Demand
On the supply side, the number of farmers selling farm-separated cream and the volume sold have been declining quite steadily for many years. In 1970, 1 percent of milk production was sold as farm-separated cream, compared with 17 percent in 1950. Between 1960 and 1969, the percentage of milkfat produced which was sold to plants and dealers increased from 91 to 95 percent. More and more of the nonfat solids are moving into commercial marketing channels. During the same period, the percentage of solids-not-fat produced
46
which was sold to plants and dealers increased from 85 to 94 percent. Hence, although milk production decreased 6 percent from 1960 to 1969, sales of milkfat by farmers dropped only 4 percent and their sales of solids-not-fat increased 3 percent.
On the demand side, the market for fluid-milk products has changed drastically. While total sales of fluid-milk products have increased, whole milk has been displaced by lowfat and skim products. Between 1960 and 1970, whole milk decreased from 89 to 77 percent of fluid-milk products, while lowfat and skim products increased from 8 to 21 percent of the total. Cream and halfrand-half decreased from 3.0 to 1.7 percent of the total. Added to this was a modest decline in the butterfat content of whole milk—from 3.57 percent in 1960 to 3.46 percent in 1970. The butterfat content of cream and half-and-half decreased slightly. This decline was offset somewhat as the sales of 2 percent milk rose sharply and the butterfat content of all lowfat and skim milk items increased from 1.1 to 1.5 percent. The overall effect was a drop of 0.5 percent in the butterfat content of all fluid items—from 3.8 to 3.3 percent. While there was a small decrease in the butterfat content of producer milk during this period, it did not amount to as much as the decline in consumption.
Thus, in 1960 53 billion pounds of fluid-milk products, with an average butterfat test of 3.8 percent, were sold. With a slightly lower butterfat test of producer milk delivered to fluid-milk plants, 21.2 million pounds of fat were added to that contained in the milk received from producers. Thus, 569 million pounds of whole milk were separated to get enough fat to increase the fat test of the milk sold.
In 1970, about 58 billion pounds of fluid-milk products, with an average butterfat test of 3.3 percent, were sold. With a butterfat test of producer milk at 3.7 percent, 234 million pounds of fat were skimmed from the fluid, the equivalent of about 6.4 billion pounds of producer milk. Thus, about an extra quarter billion pounds of butterfat for manufacturing came out of the fluid-milk segment of the supply.
In 1970, about 7 billion pounds—approximately 12 percent of total fluid- product sales—were fortified with solids-not-fat. Fortifying at the rate of 1.5 percent would have taken 105 million pounds of solids-not-fat, about 1.42 billion pounds of skim milk equivalent. Fortifying at 2 percent would have used 140 million pounds of solids-not-fat, about 1.9 billion pounds of skim equivalent. This represents additional sales of nonfat solids, but they are almost entirely at Class II prices.
Under the price-support program, USDA buys butter, nonfat dry milk, and American cheese at prices designed to result in a U.S. average price for manufacturing milk at least equal to announced support prices. These pur- chases provide the best measure available of the amount of surplus over commercial needs at going prices. Until 1969, the surplus of solids-not-fat had always exceeded that of milkfat; in recent years, the ratio has been declining. In 1960, removals of milkfat from the commercial market by USDA programs accounted for 2.9 percent of the milkfat sold by farmers; by 1969,
47
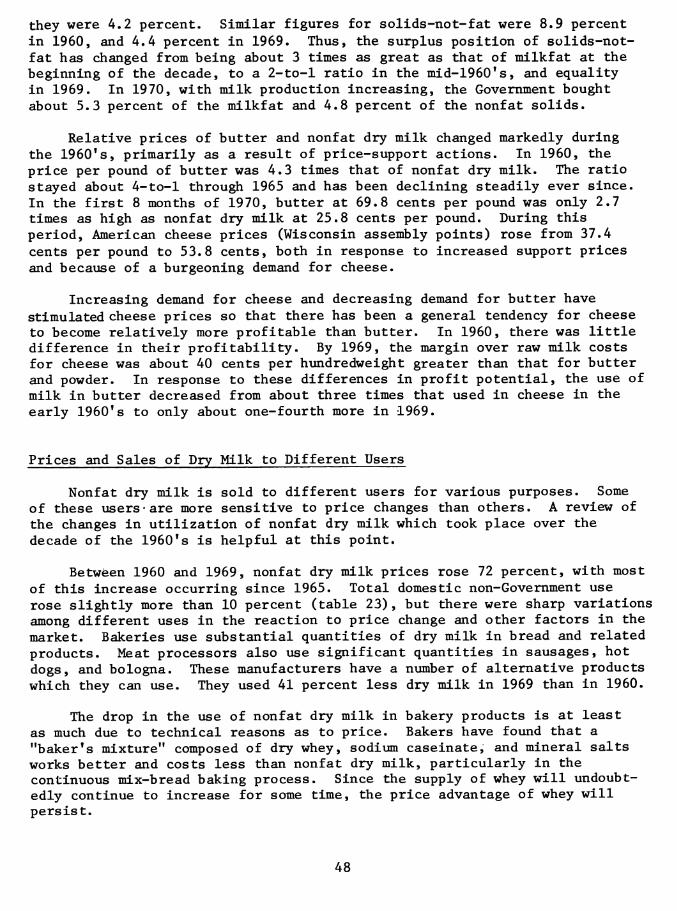
they were 4.2 percent. Similar figures for solids-not-fat were 8.9 percent in 1960, and 4.4 percent in 1969. Thus, the surplus position of solids-not- fat has changed from being about 3 times as great as that of milkfat at the beginning of the decade, to a 2-to-l ratio in the mid-1960's, and equality in 1969. In 1970, with milk production increasing, the Government bought about 5.3 percent of the milkfat and 4.8 percent of the nonfat solids.
Relative prices of butter and nonfat dry milk changed markedly during the I960's, primarily as a result of price-support actions. In 1960, the price per pound of butter was 4.3 times that of nonfat dry milk. The ratio stayed about 4-to-l through 1965 and has been declining steadily ever since. In the first 8 months of 1970, butter at 69.8 cents per pound was only 2.7 times as high as nonfat dry milk at 25.8 cents per pound. During this period, American cheese prices (Wisconsin assembly points) rose from 37.4 cents per pound to 53.8 cents, both in response to increased support prices and because of a burgeoning demand for cheese.
Increasing demand for cheese and decreasing demand for butter have stimulated cheese prices so that there has been a general tendency for cheese to become relatively more profitable than butter. In 1960, there was little difference in their profitability. By 1969, the margin over raw milk costs for cheese was about 40 cents per hundredweight greater than that for butter and powder. In response to these differences in profit potential, the use of milk in butter decreased from about three times that used in cheese in the early I960's to only about one-fourth more in 1969.
Prices and Sales of Dry Milk to Different Users
Nonfat dry milk is sold to different users for various purposes. Some of these users are more sensitive to price changes than others. A review of the changes in utilization of nonfat dry milk which took place over the decade of the I960's is helpful at this point.
Between 1960 and 1969, nonfat dry milk prices rose 72 percent, with most of this increase occurring since 1965. Total domestic non-Government use rose slightly more than 10 percent (table 23), but there were sharp variations among different uses in the reaction to price change and other factors in the market. Bakeries use substantial quantities of dry milk in bread and related products. Meat processors also use significant quantities in sausages, hot dogs, and bologna. These manufacturers have a number of alternative products which they can use. They used 41 percent less dry milk in 1969 than in 1960.
The drop in the use of nonfat dry milk in bakery products is at least as much due to technical reasons as to price. Bakers have found that a "baker's mixture" composed of dry whey, sodium caseinate, and mineral salts works better and costs less than nonfat dry milk, particularly in the continuous mix-bread baking process. Since the supply of whey will undoubt- edly continue to increase for some time, the price advantage of whey will persist.
48
Table 23.—Domestic non-Government sales of nonfat dry milk for food use, by type of user, 1960 and 1969
Type of user 1960 1969 as percentage of 1960
: Million pounds Sales declined: : Meat processing : 81 45 Bakery : 312 187
Subtotal : 393 232
Sales increased: : Prepared mixes : 48 112 Confectionery : 16 19 Soft drink : 3 6 Soup : 1 4
Subtotal : 68 131
Dairy : 210 283 Packaged for home use : 184 324
Subtotal : 394 607
All other ; 49 46^
Total : 904 1,016
-Percent-
56 60
59
213 119 200 400
193
135 176
154
94
112
Source: American Dry Milk Institute, Census of Dry Milk Distribution and Production Trends, 1961 and 1970.
Apparently, the decrease in consumption of nonfat dry milk in meat processing is not related to price. In the last few years, meat-processing plants which were formerly under State inspection have either come under Federal inspection or have been regulated by State standards which were revised to meet Federal levels. A number of States used to allow the addi- tion of nonfat dry milk in sausage and similar products at higher levels than permitted under Federal standards. These plants have had to conform to Federal standards or obtain a special label showing how much nonfat dry milk was added. In these plants, the use of nonfat dry milk has dropped sharply in the last 2 years. In recent months, a few plants have been authorized to use soy flour for similar purposes, but soy flour is more expensive than nonfat dry milk.
49
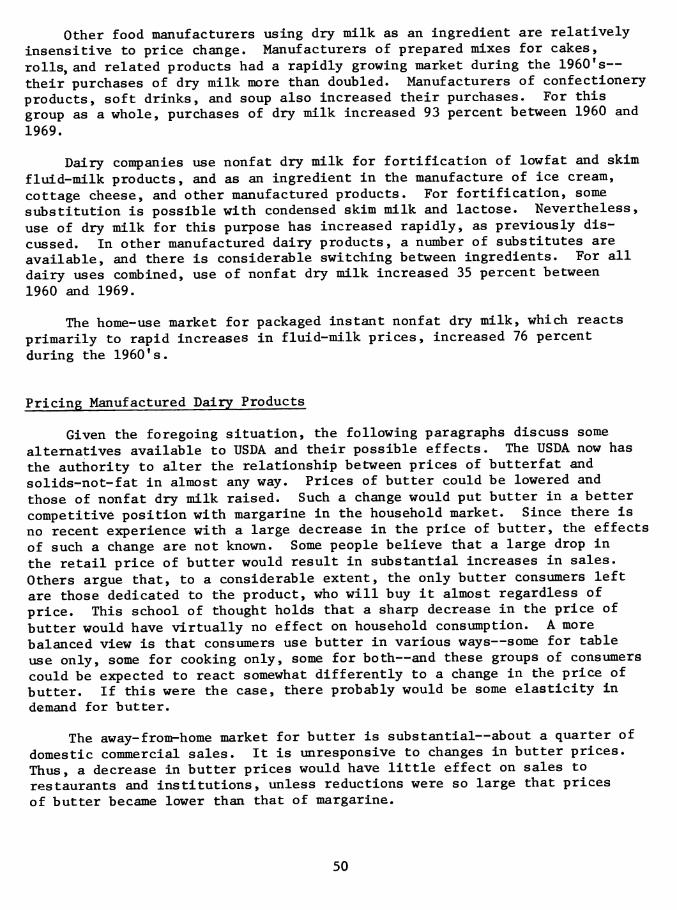
other food manufacturers using dry milk as an ingredient are relatively insensitive to price change. Manufacturers of prepared mixes for cakes, rolls, and related products had a rapidly growing market during the I960's— their purchases of dry milk more than doubled. Manufacturers of confectionery products, soft drinks, and soup also increased their purchases. For this group as a whole, purchases of dry milk increased 93 percent between 1960 and
1969.
Dairy companies use nonfat dry milk for fortification of lowfat and skim fluid-milk products, and as an ingredient in the manufacture of ice cream, cottage cheese, and other manufactured products. For fortification, some substitution is possible with condensed skim milk and lactose. Nevertheless, use of dry milk for this purpose has increased rapidly, as previously dis- cussed. In other manufactured dairy products, a number of substitutes are available, and there is considerable switching between ingredients. For all dairy uses combined, use of nonfat dry milk increased 35 percent between
1960 and 1969.
The home-use market for packaged instant nonfat dry milk, which reacts primarily to rapid increases in fluid-milk prices, increased 76 percent
during the I960's.
Pricing Manufactured Dairy Products
Given the foregoing situation, the following paragraphs discuss some alternatives available to USDA and their possible effects. The USDA now has the authority to alter the relationship between prices of butterfat and solids-not-fat in almost any way. Prices of butter could be lowered and those of nonfat dry milk raised. Such a change would put butter in a better competitive position with margarine in the household market. Since there is no recent experience with a large decrease in the price of butter, the effects of such a change are not known. Some people believe that a large drop in the retail price of butter would result in substantial increases in sales. Others argue that, to a considerable extent, the only butter consumers left are those dedicated to the product, who will buy it almost regardless of price. This school of thought holds that a sharp decrease in the price of butter would have virtually no effect on household consumption. A more balanced view is that consumers use butter in various ways—some for table use only, some for cooking only, some for both—and these groups of consumers could be expected to react somewhat differently to a change in the price of butter. If this were the case, there probably would be some elasticity in demand for butter.
The away-from-home market for butter is substantial—about a quarter of domestic commercial sales. It is unresponsive to changes in butter prices. Thus, a decrease in butter prices would have little effect on sales to restaurants and institutions, unless reductions were so large that prices of butter became lower than that of margarine.
50
On the other hand, an accompanying increase in the price of dry milk
would provide further incentive to bakers to substitute other products for nonfat dry milk. Bakers now account for about 18 percent of the total sales of nonfat dry milk. Price increases in the past have caused considerable substitution of other products for dry milk in bread baking. If dry-milk prices were raised above the price of soy flour, considerable substitution could be expected in meat processing.
The foregoing discussion indicates that caution is warranted in further altering price relationships between butter and powder. 4^/
Pricing Fluid-Milk Products
In the present system of determining prices of milk for fluid use under Federal and State orders (except in California), producers are paid for milk on a hundredweight basis with a differential for fat content above or below the established price for 3.5 percent butterfat content. Butterfat differen- tials are generally determined by a formula related to the price of butter. The formula is not the same in all markets.
In the present system, butterfat differentials paid by handlers are sometimes higher in Class I than in Class II. With the average butterfat content of fluid-milk products selling generally below 3.5 percent, producers are receiving less total returns for milk delivered under present arrange- ments than they would under one in which butterfat differentials were higher for Class II than Class I. Hence, more total money would be paid into the pool if the magnitude of butterfat differentials were reversed. Then it would be both practical and desirable from the point of view of producers to lower Class I butterfat differentials, if the effects of such a change on prices and consumption of lowfat and skim products did not offset other gains. Class II butterfat differentials would need to be kept in line with butter prices to keep the ingredient cost of butterfat from Class II milk approximately equal to that of butterfat available in inteirmediate products.
Such changes in butterfat differentials would raise handlers' costs of milk going into lowfat and skim products. Ingredient costs per half gallon before fortification generally range from 5-7 cents less for lowfat milk than for whole milk, and 10-12 cents less for skim milk, depending both on fat content and butterfat differential. Both handlers and retailers take larger margins on lowfat and skim products than on whole milk. Store prices of lowfat milk in 34 markets recently surveyed ranged from 6 cents per half gallon less than whole milk to 9 cents more (table 16). The median difference was 2 cents per half gallon less for lowfat milk than for whole milk. Nearly 20 percent of the markets were charging more for 2-percent milk than for whole milk and, in one-fourth of the markets, 2-percent milk cost from 0.1 cent to 2 cents less than whole milk.
kj Recent estimates by Leo Blakley indicate that the present prices of butter and powder are about optimal in terms of minimizing Government costs, compared with other relative prices analyzed (_1, p. 15).
51
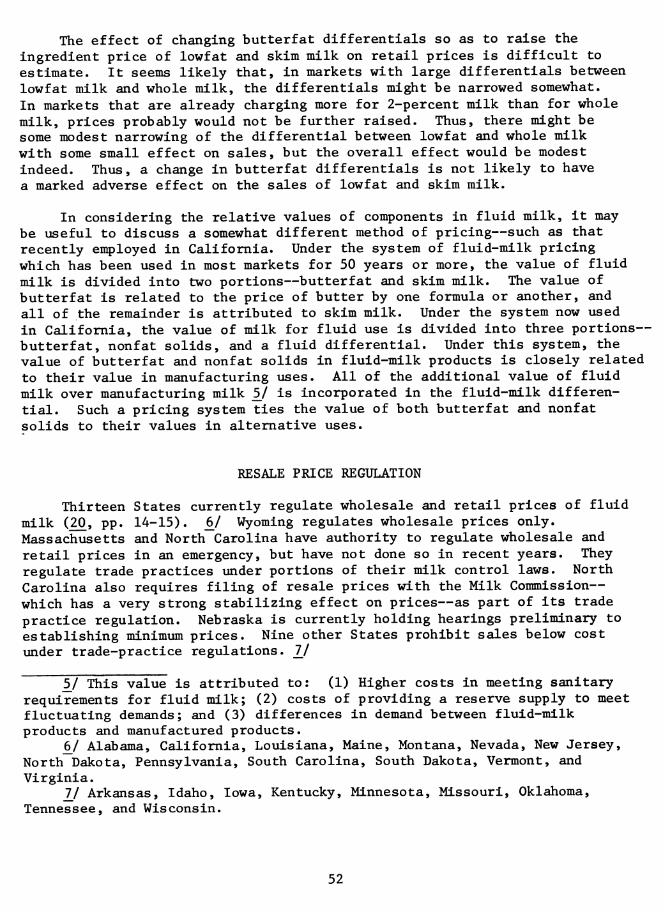
The effect of changing butterfat differentials so as to raise the ingredient price of lowfat and skim milk on retail prices is difficult to estimate. It seems likely that, in markets with large differentials between lowfat milk and whole milk, the differentials might be narrowed somewhat. In markets that are already charging more for 2-percent milk than for whole milk, prices probably would not be further raised. Thus, there might be some modest narrowing of the differential between lowfat and whole milk with some small effect on sales, but the overall effect would be modest indeed. Thus, a change in butterfat differentials is not likely to have a marked adverse effect on the sales of lowfat and skim milk.
In considering the relative values of components in fluid milk, it may be useful to discuss a somewhat different method of pricing—such as that recently employed in California. Under the system of fluid-milk pricing which has been used in most markets for 50 years or more, the value of fluid milk is divided into two portions—butterfat and skim milk. The value of butterfat is related to the price of butter by one formula or another, and all of the remainder is attributed to skim milk. Under the system now used in California, the value of milk for fluid use is divided into three portions— butterfat, nonfat solids, and a fluid differential. Under this system, the value of butterfat and nonfat solids in fluid-milk products is closely related to their value in manufacturing uses. All of the additional value of fluid milk over manufacturing milk 5j is incorporated in the fluid-milk differen- tial. Such a pricing system ties the value of both butterfat and nonfat solids to their values in alternative uses.
RESALE PRICE REGULATION
Thirteen States currently regulate wholesale and retail prices of fluid milk (20, pp. 14-15). 6^/ Wyoming regulates wholesale prices only. Massachusetts and North Carolina have authority to regulate wholesale and retail prices in an emergency, but have not done so in recent years. They regulate trade practices under portions of their milk control laws. North Carolina also requires filing of resale prices with the Milk Commission— which has a very strong stabilizing effect on prices—as part of its trade practice regulation. Nebraska is currently holding hearings preliminary to establishing minimum prices. Nine other States prohibit sales below cost under trade-practice regulations. ]_/
5J This value is attributed to: (1) Higher costs in meeting sanitary requirements for fluid milk; (2) costs of providing a reserve supply to meet fluctuating demands; and (3) differences in demand between fluid-milk products and manufactured products.
6^/ Alabama, California, Louisiana, Maine, Montana, Nevada, New Jersey, North Dakota, Pennsylvania, South Carolina, South Dakota, Vermont, and Virginia.
Ij Arkansas, Idaho, Iowa, Kentucky, Minnesota, Missouri, Oklahoma, Tennessee, and Wisconsin.
52
While States differ in their regulation of resale prices—some set minimum prices, some maximum prices, and some both minimum and maximum, in every case except New Jersey and Vermont, the effect of regulation is to fix prices. In New Jersey, as a matter of policy, minimum prices are set at a stop-loss level, and market prices are generally above them. There is a very strong tendency under resale price regulation, whether done directly by price setting or more circuitously through trade-practice regulation, to maintain the status quo (22, p. 168). Any change represents a potential competitive threat to someone. Accordingly, there usually is resistance to change. Often the rate of innovation—whether new containers, new services, new products, or changes in a price structure—tends to be slower in areas with' such regulation than elsewhere. The nearly universal use of cost figures as justification for changes in wholesale or retail price structures produces a strong tendency toward average-cost pricing. In such a situation, changes in price structures to reflect lower cost containers or methods of distribution are resisted. Prices tend to be set at levels reflecting average or higher costs of all distributors. In these cases, the distributor whose costs are below average cannot reduce prices to reflect his own costs—thereby removing a strong incentive to increased efficiency in the marketing system.
While many other factors affect the exit rate of fluid-milk bottling plants, some evidence indicates that by guaranteeing gross margins. State resale price controls tend to keep more processors in business than would otherwise be the case. In nine States with retail price control for all of the 18 years between 1948 and 1965, the decline in plant numbers was 44 percent, compared with 55 percent in 33 States that did not have retail price control (18, p. 29).
The complex price structures which exist in the milk business at both wholesale and retail levels practically defy regulation. Any attempt by a pricing authority to regulate all of the variations would be futile. It is possible to set minimum prices at a stop-disaster level, which reflects the lowest costs attainable, and permit the price structure to develop above that through competitive pressures. Whether this is necessary to achieve objectives of public policy is another question.
There are a number of reasons for maintaining resale price control of milk—not the least of which is the desire to retain the backing of handlers for control at the producer level by giving them guaranteed margins. From a public policy standpoint, however, the argument that retail pricing is inherently unstable and frequently leads to destructive price wars is the most important. The changing structure of milk marketing and accompanying change in the nature of the pricing process, previously discussed, has substantially weakened this argument.
Under the typical milk-marketing system of the 1950's, handlers provided full service to retail stores, including price marking, display case arrangements, and daily delivery. A typical store had from two to a half-dozen brands of milk, each one serviced by a different handler. As a practical matter, a retail store handled milk as a consignment item. Prices
53

were determined by the handlers, and the store received a fixed margin. While the handler did not have as absolute control over prices as did a gasoline company in its leased stations, the control was still quite strong. In such a situation, if one handler reduced retail prices, others with milk in the same store were under strong pressure to follow.
In the present market, retailers generally exert a stronger control over pricing. In the typical situation, there is not more than one brand per store in addition to private label, and often there is only private label. Thus, the "pass-through" effect is gone. Under these circumstances, resale price control no longer serves the function it once did.
POLICY ISSUES
Policy issues to be resolved in the pricing of milk and dairy products in the next decade can only be postulated incompletely and imperfectly at this time. The most important problems will arise from changes in the market organization and competitive climate in the dairy industry. Many of these are foreshadowed by changes that have already taken place since the 1930's. These developments, however, are now accelerating sharply and appear to be reaching a climax. The competitive situation and pricing system of the dairy industry in 1980, compared with 1971, will be unrecog- nizable in several aspects. Anticipated changes—many of which have already been discussed—are at three levels: Production, raw milk market, and packaged milk market.
At the production level, dairy farms are expected to grow larger in size and fewer in number. The number may drop from 300,000 to 100,000. Farms of less than 50 cows will virtually disappear; the modal size may well be several hundred cows. While drastic changes can be anticipated in the number and size of dairy-producing units, the number and size distribu- tion would show that the appropriate economic model would be competitive rather than oligopoly, if cooperatives could be ignored.
The imminent demise of manufacturing-grade milk production and the conversion to one grade of milk have been predicted with increasing fre- quency in recent years. While some of these predictions have been overoptimistic, development is expected to accelerate during the seventies. It is not unreasonable to opine that production of manufacturing-grade milk will be small enough by the end of the decade that it can be ignored for most policy-making purposes. This development is, of course, closely related to the economies of scale in milk production. A high proportion of small milk producers who are expected to leave the business will be manufacturing-milk producers.
At the production level, the question of whether excess resources will be out of milk production by the end of the decade is the most imponderable. The foregoing developments will undoubtedly move in this direction. Achieve- ment of such an objective would create a different environment than has existed—at least since 1929. Decisions about public policy in the
54
beginning of this decade will strongly influence whether excess resources are still in dairy production at the end of the seventies.
Thus, by the end of the decade we can anticipate a milk supply produced by good-sized commercial dairy farmers. There is no reason to expect that a substantial proportion of these dairy farmers will be other than two- or three-man family farms, unless substantial incentives are provided by the system for integration by processors into milk production. The provision of substantial premiums over Class I prices could provide such an incentive. This would evolve into a problem of market power in the raw-milk market.
If recent developments in the raw-milk market continue, a market with three significant characteristics will emerge: (1) Centralized control of the disposition of the entire milk supply in very large areas; (2) pooling on a regional or larger basis—much larger than present market pools; and (3) no alternative sources of milk for handlers. In such a market, most handlers would operate on full-supply contracts and those who did not would achieve virtually no advantage from failing to sign them. Again the problem of potential integration by handlers in milk production arises.
The developing packaged-milk market has the following characteristics:
(1) Dominant outlet is supermarket groups because they set the pace of competition and prices.
(2) Supermarket groups are contract buyers. They buy private-label and packer-brand milk in large volumes. These contracts are easily moved between suppliers.
(3) Only large processors can serve supermarket groups.
(4) Multiunit processors have some advantage in dealing with supermarket groups because in many cases they have better coverage of the retail division.
(5) Smaller processors must deal with other outlets or start owned or franchised outlets.
Clearly, large fluid-milk handlers no longer have their former market power position. They confront large and powerful groups both on the buying and selling end. The following alternatives seem open to handlers: (1) To accept their role as a provider of services on a more or less cost-plus basis; (2) to abjure the supermarket outlet entirely and develop other outlets; or (3) to become developers and marketers of products other than conventional fluid-milk items.
The broadest and most basic question concerns the appropriate role of public authority in the pricing of milk and dairy products. Do developments such as those anticipated remove the necessity for public programs and regulations specific to the dairy industry? If some public programs are still required, what should be their nature? What kind of programs would assist or retard these developments or, if considered desirable, mitigate their impacts on producers, distributors, or consumers?
55
The changes discussed above will dictate a need for rethinking the entire pricing system. If essentially all fluid milk becomes fluid grade, the pricing structure of the entire dairy system will change. The insula- tion between the manufacturing-milk segment and the fluid-milk segment will no longer exist. New institutions will then be required to deal with the problems generated, particularly in the pricing area. Consequently, the present system of Federal and State orders will need considerable modification.
The growth of large cooperatives makes the nonmember problem potentially more disruptive. As cooperatives increase their services and, hence, the cost of providing them, the advantages to an individual of the nonmember status increase. Here again, new institutional devices must be considered, perhaps including something like the marketing agreements used in fruits and vegetables to enforce the agreement made by a majority of producers against the minority. The minority in such a case includes not only milk producers on family farms but also the integrated operations of processors.
The problem of price levels, which is a mirror image of the income problem of producers, looms large. Consideration of a wide variety of devices for maintaining producer incomes at levels which will yield a satisfactory income but not induce the entry of excess resources into the dairy industry is indicated. The Class I base plan is one such device. Undoubtedly, others will also need to be considered.
The relative values of the components of milk require continuous review. As milk is used more as a source of a wide variety of raw materials for fabrication of many products throughout the food industry, consideration will have to be broadened beyond the question of the relative value of butterfat and solids-not-fat. As more and more dried whey comes onto the market, it will have an increasing role in the pricing of dairy products. It is not outside the realm of possibility that, within the seventies, it will be worthwhile to develop and institute a price support purchase program for dried whey, the secondary product from cheese manufacture, similar to the USDA program for butter and nonfat dry milk.
Pricing problems of milk at wholesale and retail levels revolve around the activities of State resale-price regulations and trade-practice regula- tions in a great many States. Reconsideration of the problems generated by such regulatory efforts—their costs and benefits—will undoubtedly be necessary.
56

APPENDIX A
MARKETS IN NEM-40 SURVEY, 1969-70
Small Markets Large Markets
UNCONTROLLED
New Hampshire Concord Manchester
Connecticut Hartford New Haven
Delaware Wilmington
Maryland Baltimore
CONTROLLED
Maine Augusta Caribou Portland Presque Isle
Vermont Burlington
New Jersey Atlantic City Camden Trenton
UNCONTROLLED CONTROLLED
District of Columbia New Jersey Washington Newark-
Elizabeth Ohio
Cleveland Pennsylvania Philadelphia
Illinois Pittsburgh Chicago
West Virginia Charleston Huntington Wheeling
Ohio Akron Canton Cincinnati Columbus Dayton Toledo Youngstown
Illinois Alton Peoria Rockford Rock Island Springfield
Pennsylvania Erie Harrisburgh Reading Scranton-Wilkes Barre
57
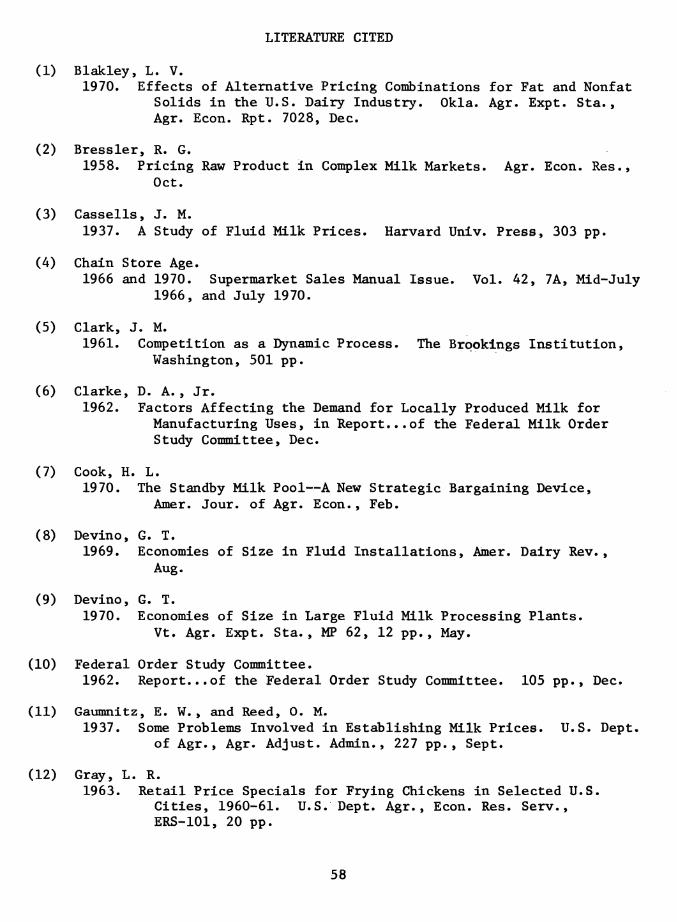
LITERATURE CITED
(1) Blakley, L. V. 1970. Effects of Alternative Pricing Combinations for Fat and Nonfat
Solids in the U.S. Dairy Industry. Okla. Agr. Expt. Sta., Agr. Econ. Rpt. 7028, Dec.
(2) Bressler, R. G. 1958. Pricing Raw Product in Complex Milk Markets. Agr. Econ. Res.,
Oct.
(3) Cassells, J. M. 1937. A Study of Fluid Milk Prices. Harvard Univ. Press, 303 pp.
(4) Chain Store Age. 1966 and 1970. Supermarket Sales Manual Issue. Vol. 42, 7A, Mid-July
1966, and July 1970.
(5) Clark, J. M. 1961. Competition as a Dynamic Process. The Brpokings Institution,
Washington, 501 pp.
(6) Clarke, D. A., Jr. 1962. Factors Affecting the Demand for Locally Produced Milk for
Manufacturing Uses, in Report...of the Federal Milk Order Study Committee, Dec.
(7) Cook, H. L. 1970. The Standby Milk Pool—A New Strategic Bargaining Device,
Amer. Jour, of Agr. Econ., Feb.
(8) Devino, G. T. 1969. Economies of Size in Fluid Installations, Amer. Dairy Rev.,
Aug.
(9) Devino, G. T. 1970. Economies of Size in Large Fluid Milk Processing Plants.
Vt. Agr. Expt. Sta., MP 62, 12 pp.. May.
(10) Federal Order Study Committee. 1962. Report...of the Federal Order Study Committee. 105 pp., Dec.
(11) Gaxminitz, E. W. , and Reed, 0. M. 1937. Some Problems Involved in Establishing Milk Prices. U.S. Dept.
of Agr., Agr. Adjust. Admin., 227 pp., Sept.
(12) Gray, L. R. 1963. Retail Price Specials for Frying Chickens in Selected U.S.
Cities, 1960-61. U.S. Dept. Agr., Econ. Res. Serv., ERS-101, 20 pp.
58
(13) Gray, R. W. , and Anderson, R. 1962. "Advertised Specials and Local Competition Among Supermarkets,"
Food Research Institute Studies, May.
(14) Hammond, J. W. , and Buxton, B. M. 1970. Consequences of Changing Production Standards for Manufacturing
Grade Milk. Minn. Agr. Ext. Serv., Spec. Rpt. No. 37, 16 pp.
(15) Harris, E. S. 1966. Price Wars in City Milk Markets, U.S. Dept. Agr., Econ. Res.
Serv., AER No. 100, 95 pp., Oct.
(16) Holdren, B. R. 1960. The Structure of a Retail Market and the Market Behavior of
Retail Units. Prentice-Hall, Inc., Englewood Cliffs, N.J., 203 pp.
(17) Lasley, F. A. 1966. Coordinating Fluid Milk Supplies in the Pittsburgh Market.
U.S. Dept. Agr., Econ. Res. Serv., MRR-746, 51 pp.. Mar.
(18) Manchester, A. C. 1968. The Structure of Fluid Milk Markets, Two Decades of Change.
U.S. Dept. Agr., Econ. Res. Serv., AER No. 137, 51 pp., July.
(19) Manchester, A. C. 1964. The Structure of Wholesale Produce Markets. U.S. Dept. Agr.,
Econ. Res. Serv., AER No. 45, 128 pp., Apr.
(20) Mathis, A. G., and Fravel, D. 1968. Government's Role in Pricing Fluid Milk in the United States.
U.S. Dept. Agr., Econ. Res. Serv., AER No. 152, 31 pp., Dec.
(21) Moede, H. H. 1971. Over-the-Road Costs of Hauling Bulk Milk. U.S. Dept. Agr.,
Econ. Res. Serv., MRR No. 919, 26 pp., Jan.
(22) National Commission on Food Marketing 1966. Organization and Competition in the Dairy Industry. Tech.
Study No. 3, 409 pp., June.
(23) Preston, L. E. 1963. Profits, Competition and Rules of Thumb in Retail Food Pricing,
An Investigation of the Theory and Practice of Pricing in Retail Food Stores, Inst. of Bus. and Econ., Univ. of Calif., Dec.
(24) Schapker, B. L. 1961. 1961 Survey of Supermarket Shoppers, Their Buying Habits and
Attitudes. 8th Annual Report by Burgoyne Index, Inc., 48 pp., Oct.
59
(25) Webster, Fred, and others 1963. Economies of Size in Fluid Milk Processing Plants. Vt. Agr.
Expt. Sta. Bui. 636, 32 pp., June.
(26) Whitaker, G. M. 1898. The Milk Supply of Boston and Other New England Cities. U.S.
Dept. Agr., Bur. Anim. Ind., Bul. 20, 37 pp.
(27) Whitaker, G. M. 1905. The Milk Supply of Boston, New York, and Philadelphia. U.S.
Dept. Agr., Bur. Anim. Ind., Bul. 81.
(28) Williams, S. W., and others 1970. Organization and Competition in the Midwest Dairy Industries.
Iowa State Univ. Press, 339 pp.
60