
PricewaterhouseCoopers India Pvt Ltd MoneyTree … India Pvt Ltd ... 44 41 47 63 101 87 108 98 118...
23
www.pwc.com/globalmoneytree www.pwc.in PricewaterhouseCoopers India Pvt Ltd MoneyTree TM India Report Q1 2015 Technology Institute This special report provides summary results of Q1 ’14, Q4 ’14, and Q1 ’15. Data provided by Venture Intelligence
-
Upload
duongthien -
Category
Documents
-
view
216 -
download
1
Transcript of PricewaterhouseCoopers India Pvt Ltd MoneyTree … India Pvt Ltd ... 44 41 47 63 101 87 108 98 118...

www.pwc.com/globalmoneytree www.pwc.in
PricewaterhouseCoopers India Pvt Ltd
MoneyTreeTM India Report Q1 2015
Technology Institute
This special report provides summary results of Q1 ’14, Q4 ’14, and Q1 ’15.
Data provided by Venture Intelligence

PwC MoneyTreeTM India Report – Q1 ’15 2
Table of contents
1. Overview 3 2 Analysis of private equity investments 4
Total equity investments 4 Investments by industry 6 Investments by stage of development 7 Investments by region 8 Top 20 PE deals 9
3. Analysis of PE exits 10 Total PE exits 10 Exits by industry 11 Exits by type 12 Top five PE exits 13
4. Active PE firms 14 5. Sector focus: IT & ITeS sector 15
Sector overview 15 Total PE investments 16 Investments by stage of development 18 Investments by region 19 Investments by subsector 20 PE exits in the sector 21
6. Definitions 22 Contacts 23

PwC MoneyTreeTM India Report – Q1 ’15 3
1. Overview
A promising year The first quarter of 2015 started on a steady note, attracting 2.8 billion USD across 130 deals. Although lower than Q4’14 levels (4.4 billion USD), it was still 15% higher than the prior period (Q1 2014).
Banking, financial services & insurance (BFSI) was the most active sector, attracting 891 million USD in investments, which included two large deals, a 260-million USD investment in microfinance player Bandhan Finance and a 100-million-USD investment in Ujjivan Finance. The information technology (IT) & IT-enabled services (IT&ITeS) sector was relatively quiet at 836 million USD with no significant e-commerce investment.
While the fundamentals appear to be getting better, with declining inflation, lower interest rates and a growing GDP, overall investor sentiment seems to be waning compared to six to nine months ago.
While one school of thought is that rhetoric is high compared to actual on-the-ground action, the other line of thinking is that investors are getting impatient too quickly and that one needs to wait to see words translate into action.
The Budget was considered by some “not bold enough” and with the Minimum Alternate Tax (MAT), the foreign investor tax quandary seems to have only taken another twist.
Overall, while the appetite to invest is there, market sentiment seems to swing all too quickly from one end to the other. One hopes the next two quarters will show a definite direction in which way investors are swaying.
Sanjeev Krishan Private Equity and Transaction Services Leader PwC India

PwC MoneyTreeTM India Report – Q1 ’15 4
2. Analysis of private equity investments
Total equity investments in PE-backed companies
The first quarter of 2015 saw 130 private equity deals worth 2.77 billion USD, and was the best performing first quarter since 2011.
Despite a 10% drop in volume in Q1 ’15, the value surged by 15% as compared to the same period in 2014, which saw 144 deals worth 2.42 billion USD. But this is still a 37% drop in terms of value as compared to the previous quarter’s 4.39 billion USD in 117 deals.
This quarter, the BFSI sector displaced the IT & IT-enabled services sector from its top slot, attracting 891 million USD in 14 deals, up 83% from the previous quarter and over eight times from the same period last year.
The IT & ITeS sector attracted investment of 836 million USD in 71 deals this quarter, an almost 68% drop from the previous quarter’s 2.65 billion USD.
Late-stage investments once again outperformed growth investments, receiving 1.26 billion USD whereas growth investments saw 704 million USD.
Bangalore made a comeback to the top slot with regard t0 PE investments—both by value and volume of deals—this quarter, seeing 715 million USD invested in 35 deals.
Total private equity investments
Quarter Q1 Q2 Q3 Q4 Q1 Q2 Q3 Q4 Q1 Q2 Q3 Q4 Q1 Q2 Q3 Q4 Q1 Q2 Q3 Q4 Q1 Q2 Q3 Q4 Q1 Q2 Q3 Q4 Q1 Q2 Q3 Q4 Q1 Q2 Q3 Q4 Q1 Q2 Q3 Q4 Q1
Number of deals
44 41 47 63 101 87 108 98 118 96 141 180 163 107 134 87 75 50 69 103 98 90 123 104 128 136 156 133 146 135 142 120 118 128 116 105 144109122117 130
Data provided by Venture Intelligence
576351
729846
1,384
2,0381,790 2,006
2,578
2,128
4,579
5,405
3,811
2,7172,578
1,194
711814
945
1,735
2,1122,180
2,419
1,945
3,939
2,570 2,698
1,797
2,292 2,168
4,045
1,303 1,237
4,849
1,562
2,2292,417
2,7442,927
4,390
2,774
0
1,000
2,000
3,000
4,000
5,000
6,000
Value of deals (in US$ Mn)
2006 2007 2008 2009 2010 2011 2012 2013 2014 20152005

Analysis of private equity investments
PwC MoneyTreeTM India Report – Q1 ’15 5
Investments by industry Q1 ’14, Q4 ’14 and Q1 ’15
The BFSI sector led the rally of investments this quarter by bumping IT & ITeS to the second slot, attracting 891 million USD in 14 deals, up 83% from the previous quarter and over eight times from the same period last year. In the previous quarter, 488 million USD was invested in this sector from 10 deals while the same period last year saw just 107 million USD in 11 deals. This year, the rally was mainly led by the 260-million- and 100-million-USD investments in microfinance players, Bandhan Finance and Ujjivan Finance, respectively. Coming in a close second, the IT & ITeS sector attracted 836 million USD investment in 71 deals, almost a 68% drop from the previous quarter’s 2.65 billion USD and a 14% drop from last year’s performance of 969 million USD. Healthcare & life sciences was again back in limelight with 392 million USD worth of investments in just nine deals, an almost four-time surge as compared to the previous quarter and the same period last year (110 million and 100 million USD, respectively).
The energy sector has witnessed deals worth 207 million USD, down 57% from the previous quarter’s 481 million USD, but more than double as compared to the first quarter of 2014. The manufacturing sector improved considerably, with 147 million USD worth of investments in nine deals, a growth of almost three times as compared to the previous quarter’s 59 million USD and up 15% as compared to 128 million USD worth investment of the first quarter of last year.
Investments by industry
166
0
10
6
36
147
30
55
891
392
207
836
410
95
58
1
6
59
28
8
488
110
481
2647
301
347
51
125
9
128
102
82
107
100
97
969
0 500 1,000 1,500 2,000 2,500 3,000
Others
Engineering & construction
Fast-moving consumer goods(FMCG)
Textiles & garments
Education
Manufacturing
Shipping & logistics
Travel & transport
Banking, financial services &insurance
Healthcare & life sciences
Energy
Information technology (IT) & IT-enabled services
Q1 2014
Q4 2014
Q1 2015
Note: 'Others' include other services, media & entertainment, hotels & resorts, sports & fitness, agri-business, food & beverage and retail.

Analysis of private equity investments
PwC MoneyTreeTM India Report – Q1 ’15 6
This quarter saw a decline in the total investment in the IT&ITeS space as compared to the previous quarter. However, overall value remained higher than most quarters. As has been the trend over the past year, investments were dominated by the e-commerce companies, with ShopClues, Freecharge, CarDekho and PolicyBazaar leading the pack. Among e-commerce companies, demand for funding from early-stage enterprises is likely to be strong in the coming year. These companies offer a wide variety of innovative products and are aided by sustainable business. Additionally, robust profitability models could bring huge opportunity for returns for PE firms.
Sandeep Ladda Technology Sector Leader, PwC India
The healthcare sector saw a higher-than-average deal size of 43.5 million USD in the quarter compared to 10 million USD in the previous quarter and 7.14 million USD in the same quarter a year ago. Three of the leading healthcare chains underwent transactions for fresh equity infusions and secondary transactions in order to provide exits to existing investors during this quarter. Some of the leading diagnostic and single-speciality hospitals are planning IPOs in the coming months which will allow retail investors to enter the fray.
Rana Mehta Healthcare Leader, PwC India
The deals trends are quite remarkable and reflective of the change in the underlying mood of the economy. With more positive energy and enthusiasm, expectations of growth have also seen an uptick and investors are returning strongly to the lead sectors such as financial services and IT&ITeS. It is clear that there is a shortage of long-term capital and investment in many sectors in India and for the growth potential to be converted to reality over the next decade, such investments need to be brought in now.
Manoj Kashyap Financial Services Leader, PwC India
Analysis of private equity investments
PwC MoneyTreeTM India Report – Q1 ’15 7
Investments by stage of development Q1 ’14, Q4 ’14 and Q1 ’15
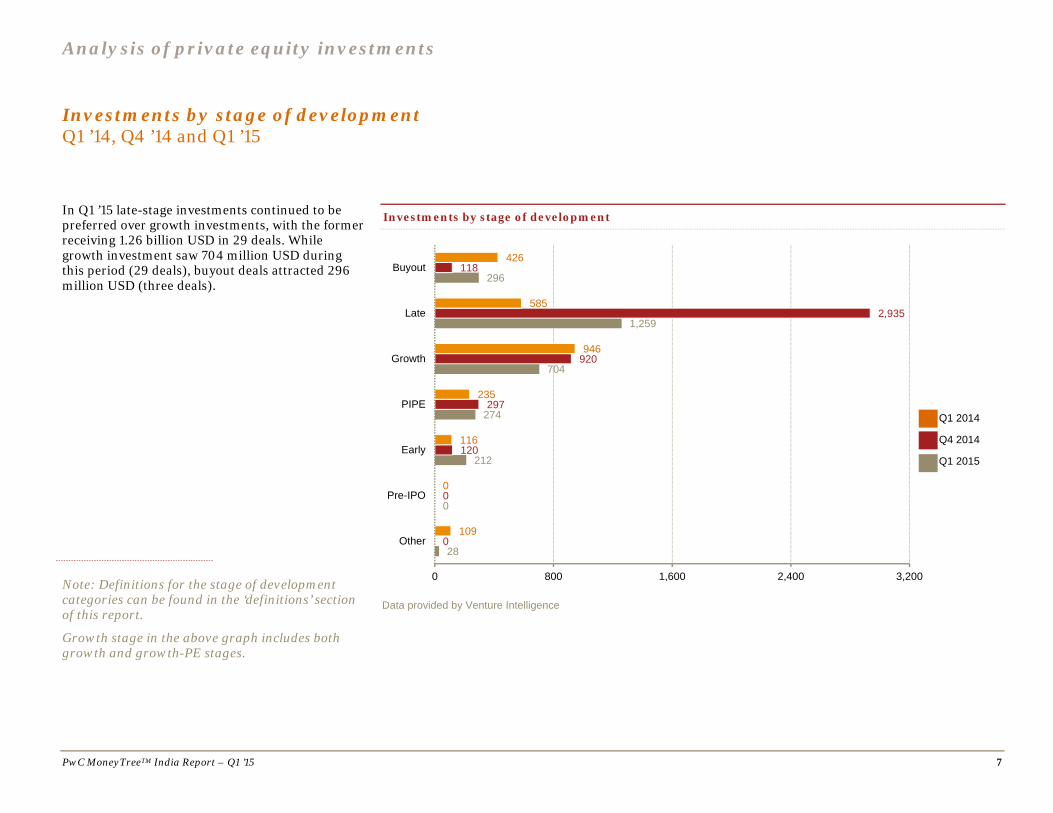
In Q1 ’15 late-stage investments continued to be preferred over growth investments, with the former receiving 1.26 billion USD in 29 deals. While growth investment saw 704 million USD during this period (29 deals), buyout deals attracted 296 million USD (three deals).
Investments by stage of development
Data provided by Venture Intelligence
28
0
212
274
704
1,259
296
0
0
120
297
920
2,935
118
109
0
116
235
946
585
426
0 800 1,600 2,400 3,200
Other
Pre-IPO
Early
PIPE
Growth
Late
Buyout
Q1 2014
Q4 2014
Q1 2015
Note: Definitions for the stage of development categories can be found in the ‘definitions’ section of this report.
Growth stage in the above graph includes both growth and growth-PE stages.

Analysis of private equity investments
PwC MoneyTreeTM India Report – Q1 ’15 8
Investments by region Q1 ’14, Q4 ’14 and Q1 ’15
Bangalore was once again the the busiest investment destination with 715 million USD worth of investments in 35 deals. While the National Capital Region (NCR) received 691 million USD in 33 deals, Mumbai has been pushed to third place with 623 million USD investments in 26 deals.
Unlike other quarters, Kolkata sprung a surprise with 351 million USD in just four deals.
Investments by region
Data provided by Venture Intelligence
483
71
11
92
88
691
715
623
575
8
292
623
17
998
913
966
291
66
87
66
24
380
539
964
0 400 800 1,200
Others
Pune
Hyderabad
Chennai
Ahmedabad
NCR
Bangalore
Mumbai
Q1 2014
Q4 2014
Q1 2015
Note: The National Capital Region (NCR) includes Delhi, Gurgaon and Noida.

Analysis of private equity investments
PwC MoneyTreeTM India Report – Q1 ’15 9
Top 20 PE deals Q1 ’15
The top 20 deals comprised just 55% of the total deal value in Q1 ’15. Rather than a few big deals, this quarter has witnessed a range of mid-sized deals. The top five deals constituted just 26% of the total deal value. The average deal value of this quarter was 21.34 million USD.
Top 20 PE deals in Q1 2015
Company Industry Investors Deal amount (in USD Mn)
Bandhan Financial Services BFSI IFC, GIC 260
Manipal Health Enterprises Healthcare & Life sciences
TPG Capital 150
Medanta Medicity Healthcare & lifesciences
Temasek 113.5
ShopClues.com IT & ITeS Tiger Global, Helion Ventures, Nexus Ventures 100
Ujjivan Financial Services BFSI IFC, CDC Group, CX Partners, Newquest, Others 100
Diligent Power Energy IDFC PE 81.3
Freecharge.in IT & ITeS Sequoia Capital India, Valiant Capital, Ru-Net Holdings, Tybourne Capital, Others
80
Magma Fincorp BFSI India Value Fund, KKR, LeapFrog 80
Manthan Systems IT & ITeS Temasek, Norwest 60
Antuit IT & ITeS Goldman Sachs, Zodius Capital 56
CarDekho IT & ITeS Sequoia Capital India, Hillhouse Capital, Tybourne Capital
50
Bill Forge Manufacturing Kedaara Capital 50
Meru Call Taxi Travel & Transport India Value Fund 50
PolicyBazaar IT & ITeS Tiger Global, PremjiInvest, Steadview, Ribbit Capital
50
Narayana Hrudayalaya Healthcare & Life sciences
CDC Group 48
SVB India Finance BFSI Temasek 46.4
M&M Financial BFSI Temasek 42.42
Sundaram BNP Paribas Home Finance
BFSI IFC 40
Verse Innovation IT & ITeS Sequoia Capital India, Matrix Partners India, Omidyar Network, Falcon Edge Capital
40
PTC India Financial Services BFSI IFC
Data provided by Venture Intelligence

PwC MoneyTreeTM India Report – Q1 ’15 10
3. Analysis of PE exits
Total PE exits
As compared to the same period last year, exit activity for the quarter was three times higher, at 1.14 billion USD in 40 deals against 470 million USD of exit value (27 deals) in Q1 ’14, but marginally lower than the previous quarter’s 1.17 billion USD in 39 deals.
Overall, exit activities remain sluggish and the trend is unlikely to change anytime soon unless big secondary sales happen.
The BFSI sector has outshone others with 472 million USD worth of exits in seven deals while the IT & ITeS sector has seen exits worth 232 million USD.
Almost 50% of total exits happened through strategic deals valued at 584 million USD across 12 deals.
Total private equity exits
Quarter Q1 Q2 Q3 Q4 Q1 Q2 Q3 Q4 Q1 Q2 Q3 Q4 Q1 Q2 Q3 Q4 Q1 Q2 Q3 Q4 Q1 Q2 Q3 Q4 Q1 Q2 Q3 Q4 Q1 Q2 Q3 Q4 Q1 Q2 Q3 Q4 Q1 Q2 Q3 Q4 Q1
Number of deals
17 18 23 23 20 19 23 31 35 38 38 33 31 14 21 11 18 42 33 33 48 37 44 61 33 32 31 31 45 34 34 35 37 41 22 32 27 59 45 39 40
Data provided by Venture Intelligence
1,479
179
2,001
1,162
482
671607
948
801
664
1,513
789
947
276 210268 283
706606
370
973 942
1,227
3,079
777
1,080
801
440
1,323
403
1,4681,596
1,122
1,913
528
1,258
470
1,214
1,354
1,169
1,139
0
500
1,000
1,500
2,000
2,500
3,000
3,500Value of deals (in US$ Mn)
2005 2006 2007 2008 2009 2010 2011 2012 2013 2014 2015

Analysis of PE exits
PwC MoneyTreeTM India Report – Q1 ’15 11
Exits by industry Q1 ’14, Q4 ’14 and Q1 ’15
As on the investment side, the BFSI sector again outshone other sectors with 472 million USD worth of exits in seven deals which is really encouraging for the sector when comparing it with the lackluster performances of the previous quarter (50 million USD in four deals) and the year-ago period (67 million USD in five deals).
The IT & ITeS sector’s exit value for this quarter is 232 million USD from 12 deals, which represents a 37% drop compared to the previous quarter’s deal size of 367 million USD in the same number of deals. The energy sector reached third place with 183 million USD worth of exits, while the manufacturing sector dropped to the fourth slot with just 139 million in eight exits as against last quarter’s 444 million USD in seven exits.
Exits by industry
Data provided by Venture Intelligence
81
472
232
183
8
139
24
274
50
367
0
25
444
10
196
67
181
0
0
25
0
0 50 100 150 200 250 300 350 400 450 500 550
Others
Banking, financial services& insurance
Information technology &IT-enabled services
Energy
Textiles & garments
Manufacturing
Healthcare & life sciences
Q1 2014
Q4 2014
Q1 2015
Note: Others include engineering & construction, shipping & logistics, other services, retail, food & beverages and hotels & resorts.

Analysis of PE exits
PwC MoneyTreeTM India Report – Q1 ’15 12
Exits by type Q1 ’14, Q4 ’14 and Q1 ’15
Strategic sales have become the preferred mode of exit in this quarter, with more than 50% of the total exit value emerging from strategic sales (584 million USD in 12 deals). Public market sales (371 million USD in 21 deals) fell to second as the preferred mode of exit while secondary deals saw 110 million USD in four deals.
Exits by type
Data provided by Venture Intelligence
0
75
584
0
110
371
0
125
107
21
2001
634
2
0
153
0
45
269
0 100 200 300 400 500 600 700
Other
Buyback
Strategicsale
IPO
Secondarysale
Publicmarket sale
Q1 2014
Q3 2014
Q1 2015
Note: Definitions of the types of exit can be found in the ‘definitions’ section of this report.

Analysis of PE exits
PwC MoneyTreeTM India Report – Q1 ’15 13
Top five PE exits Q1 ’15
The top five exits comprised 60% of the total exit value in Q1 ’15.
Top 5 PE exits in Q1 2015
Company Industry Investors Deal amount (in USD Mn)
Destimoney BFSI New Silk Route 200 Green Infra Energy IDFC PE 171 ING Vysya Bank BFSI ChrysCapital 137
Agile Electric Manufacturing Blackstone 106 JustDial IT & ITeS Tiger Global 50
Data provided by Venture Intelligence
PwC MoneyTreeTM India Report – Q1 ’15 14
4. Active PE firms
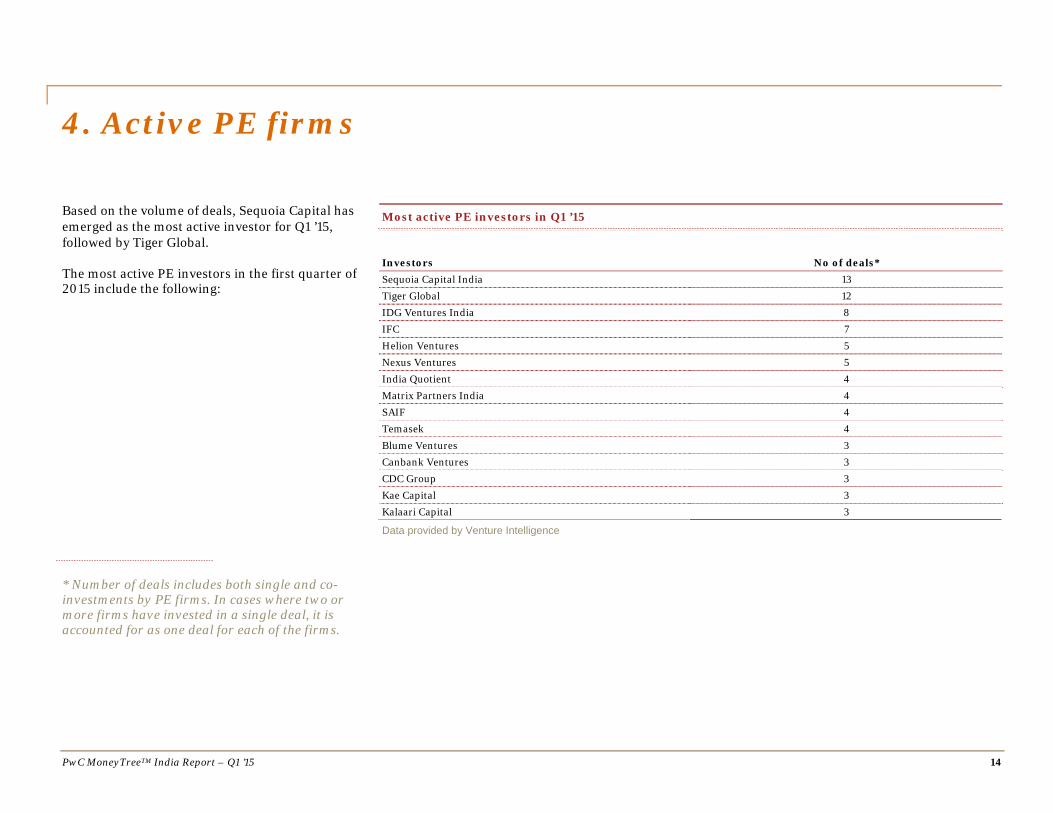
Based on the volume of deals, Sequoia Capital has emerged as the most active investor for Q1 ’15, followed by Tiger Global.
The most active PE investors in the first quarter of 2015 include the following:
Most active PE investors in Q1 ’15
Investors No of deals* Sequoia Capital India 13 Tiger Global 12 IDG Ventures India 8 IFC 7
Helion Ventures 5 Nexus Ventures 5 India Quotient 4 Matrix Partners India 4 SAIF 4 Temasek 4
Blume Ventures 3 Canbank Ventures 3 CDC Group 3 Kae Capital 3 Kalaari Capital 3
Data provided by Venture Intelligence
* Number of deals includes both single and co-investments by PE firms. In cases where two or more firms have invested in a single deal, it is accounted for as one deal for each of the firms.

PwC MoneyTreeTM India Report – Q1 ’15 15
5. Sector focus IT & ITeS sectorSector overview Technology has always been a rapidly changing industry, and is presently at the cusp of yet another major transformation. Mobile technology, analytics, cloud computing and wearables have emerged as new forms of technology, and several traditional companies have started to add capabilities in these areas in order to cater to growing customer demand.
India continues to consolidate its position as the global hub for the IT&ITeS industry, by developing capabilities around traditional and emerging markets, expanding delivery capabilities and increasing focus on high value services for product development and technology incubation. The new government's focus on technology-enabled growth through the ‘Digital India’ and ‘Make in India’ campaigns has significantly boosted overall market prospects and investor sentiment. In 2014, there was significant investor interest in the technology sector and growth was driven in part by technology-enabled business models. Growth was strong across the software, services and hardware segments.
Growing demand for IT from the small- and medium-sized businesses (SMB) segment, especially in emerging markets, also fuelled growth. There are strong market opportunities driven by vendor consolidation, infrastructure modernization and rationalization of operations. Enabling digital transformation for clients is serving as a further value addition for companies in the IT&ITeS sector. Companies are looking to build capabilities in emerging technologies in cloud applications, big data, mobility, analytics, Interent of Things and robotics. Apart from Internet start-ups and e-commerce, niche areas around software-as-a-service, enterprise solutions and mobility also show strong growth opportunities.
The largest pie of PE funding in 2014 was attributable to the e-commerce sector. E-commerce is driving rapid growth of the domestic IT-BPM (business process management) industry and attracting unprecedented levels of global interest and funding. The sector in India has grown by 34% (CAGR) since 2009 to reach 16.4 billion USD in 2014. It is expected to be in the range of 22 billion USD in 2015. Apart from companies in e-tail and marketplaces, the focus is also on ancillary service providers—companies involved in support functions ranging from delivery, to logistics and payments. In 2014, newer online business segments such as classifieds, real estate, grocery and healthcare were also launched.
From an investment perspective, the e-commerce market is a minority stake market, with maximum traction in early-stage deals. Yet, companies such as Flipkart, Snapdeal and BigBasket have raised multiple rounds of funding and this scenario is likely to continue in the coming year.
These trends appear persistent into the new year based on initial activity in the deal market, with further growth expected in e-commerce segments, both mainstream and niche, and horizontal software subsectors (e.g., SaaS, HR, data and analytics, etc.).
Sandeep Ladda Technology Leader, PwC India

Sector focus: IT & ITeS
PwC MoneyTreeTM India Report – Q1 ’15 16
Total PE investments
The first quarter of the year was not so great for the IT & ITeS sector as the total investment during the period declined by 68% to 836 million USD in 71 deals as compared to the previous quarter’s 2.65 billion USD in 62 deals. The same period last year saw 969 million USD in 64 deals.
The average deal size in this sector is down to 11.8 million this quarter as compared to 42.7 million USD in the previous quarter.
The average deal size in the early stage investment climbed to 3.26 million USD in this quarter.
Value of PE investments in the IT & ITeS sector (in USD Mn)
Quarter Q1 Q2 Q3 Q4 Q1 Q2 Q3 Q4 Q1 Q2 Q3 Q4 Q1 Q2 Q3 Q4 Q1 Q2 Q3 Q4 Q1 Q2 Q3 Q4 Q1 Q2 Q3 Q4 Q1 Q2 Q3 Q4 Q1 Q2 Q3 Q4 Q1 Q2 Q3 Q4 Q1
Number of deals
12 11 10 16 28 18 35 21 34 35 35 32 32 27 48 27 25 16 21 21 28 16 36 24 41 47 43 42 47 48 59 41 45 43 42 47 64 47 67 62 71
Data provided by Venture Intelligence
241
4855
84217
850
366
151
625 647
307233
554
353439
166 12465
397
106
273
111 148
311
671
347
515428
303 312
2,415
189 146
481
645
986 969
726
1,604
2,646
836
0
500
1,000
1,500
2,000
2,500
3,000
Value of deals (in US$ Mn)
2005 2006 2007 2008 2009 2010 2011 2012 2013 2014 2015

Sector focus: IT & ITeS
PwC MoneyTreeTM India Report – Q1 ’15 17
A comparison of quarter-on-quarter growth rates of IT & ITeS PE investments and total PE investments in the last decade proved that funding for the sector was higher than total PE funding in most quarters. But this quarter proved to be an aberration as the IT&ITeS sector growth declined by 68% against the last quarter while total PE investment declined by only 37%.
Value of PE investments in the IT & ITeS sector
Quarter Q1 Q2 Q3 Q4 Q1 Q2 Q3 Q4 Q1 Q2 Q3 Q4 Q1 Q2 Q3 Q4 Q1 Q2 Q3 Q4 Q1 Q2 Q3 Q4 Q1 Q2 Q3 Q4 Q1 Q2 Q3 Q4 Q1 Q2 Q3 Q4 Q1 Q2 Q3 Q4 Q1
Years 2005 2006 2007 2008 2009 2010 2011 2012 2013 2014 2015
Data provided by Venture Intelligence
-200%
-100%
0%
100%
200%
300%
400%
500%
600%
700%
800%
1 3 5 6 7 9 11 13 15 17 19 21 23 25 27 29 31 33 35 37 39 41 43
IT & ITeS investment growth

Sector focus: IT & ITeS
PwC MoneyTreeTM India Report – Q1 ’15 18
Investments by stage of development Q1 ’14, Q4 ’14 and Q1 ’15
Growth investments made a comeback to the top slot this quarter, with 490 million USD investments in 19 deals. Late stage has seen a 90% dip in value from its 2 billion USD investments in the last quarter to just 197 million USD, as none of the top e-tailers or IT players raised money in this quarter. Interestingly, early-stage investments have shown renewed optimism, with 150 million USD going into 46 deals, fueling the average deal size to 3.26 million USD.
IT & ITeS investments by stage of development
Data provided by Venture Intelligence
0
150
0
490
197
0
0
90
53
470
2001
33
0
67
0
581
61
260
0 500 1,000 1,500 2,000 2,500
Pre-IPO
Early
PIPE
Growth
Late
Buyout
Q1 2014
Q3 2014
Q1 2015

Sector focus: IT & ITeS
PwC MoneyTreeTM India Report – Q1 ’15 19
Investments by region Q1 ’14, Q4 ’14 and Q1 ’15
NCR became the most popular IT investment destination this quarter with 274 million USD investments in 16 deals. Bangalore attracted 243 million USD in 25 deals, while Mumbai has seen only 153 million USD in 13 deals.
Chennai got only 52 million USD in five deals.
IT & ITeS investments by region
Data provided by Venture Intelligence
80
0
30
5
52
274
243
153
112
0
8
50
512
822
787
356
74
0
23
53
23
216
363
216
0 200 400 600 800 1,000
Others
Kochi
Pune
Hyderabad
Chennai
NCR
Bangalore
Mumbai
Q1 2014
Q4 2014
Q1 2015

Sector focus: IT & ITeS
PwC MoneyTreeTM India Report – Q1 ’15 20
Investments by subsector Q1 ’14, Q4 ’14 and Q1 ’15
Not surprising, the online services subsector retained first place, receiving 62% of the total deal value (520 million USD in 38 deals) followed by mobile services (134 million USD in 17 deals). Online services registered a decline of 72% compared to the previous quarter’s 1.84 billion USD in 31 deals.
IT & ITeS investments by subsector
Data provided by Venture Intelligence
0
0
134
107
14
4
56
520
66
0
151
81
19
58
433
1,839
1
0
38
142
14
53
265
455
0 200 400 600 800 1,000 1,200 1,400 1,600 1,800 2,000
Others
Networkingtechnology
Mobile services
Enterprise software
IT products
IT services
ITeS – BPO
Online services
Q1 2014
Q4 2014
Q1 2015

Sector focus: IT & ITeS
PwC MoneyTreeTM India Report – Q1 ’15 21
PE exits in the sector Q1 ’14, Q4 ’14 and Q1 ’15
The IT & ITeS sector recorded a decline of 37% in exit activity as compared to the last quarter. There were 12 exits worth 232 million USD in this quarter while the previous quarter saw 367 million USD worth of exits in the same number of deals. But this quarter saw a healthy 28% growth as compared to the 181 million USD in the same period last year in eight exits.
Public market sales led the exit rally in the IT & ITeS sector with 98 million USD worth of deals, followed by exits via strategic sales worth 69 million USD.
Total private equity exists
Quarter Q1 Q2 Q3 Q4 Q1 Q2 Q3 Q4 Q1 Q2 Q3 Q4 Q1 Q2 Q3 Q4 Q1 Q2 Q3 Q4 Q1 Q2 Q3 Q4 Q1 Q2 Q3 Q4 Q1 Q2 Q3 Q4 Q1 Q2 Q3 Q4 Q1 Q2 Q3 Q4 Q1
Number of deals
5 6 8 7 7 6 11 11 9 16 7 8 6 5 4 3 5 4 8 8 14 10 4 13 8 8 4 9 11 8 8 8 5 10 9 6 8 14 6 12 12
Data provided by Venture Intelligence
26 29
679
57
316 379
81104
78261
287
5618
67
12 1232 25
162
48
393
161 156
1,719
337
612
154
96
129
106
1,056
257225
519
275
408
181
185
48
367
232
0
500
1,000
1,500
2,000
Value of deals (in US$ Mn)
2005 2006 2007 2008 2009 2010 2011 2012 2013 2014 2015

PwC MoneyTreeTM India Report – Q1 ’15 22
6. Definitions
Stages of development
Early stage: This refers to the first or second round of institutional investments in companies that adhere to the following:
Less than five years old
Not part of a larger business group
Investment is less than 20 million USD
Growth stage: This refers to investments of less than 20 million USD. Also, investments meeting the following criteria are considered in the growth stage:
Third or fourth round funding of institutional investments
First or second round of institutional investments for companies that are more than five years old and less than 10 years old or spin-outs from larger businesses
Growth stage-PE: This includes the following:
First or second round of investments worth 20 million USD or more
Third or fourth round funding for companies that are more than five years old and less than 10 years old or subsidiaries or spin-outs of larger businesses
Fifth or sixth rounds of institutional investments
Late stage: This comprises the following:
Investment in companies that are a decade old
Seventh or later rounds of institutional investments
PIPEs: The following constitute as PIPEs:
PE investments in publicly listed companies via preferential allotments or private placements
Acquisition of shares by PE firms via the secondary market
Buyout: This is an acquisition of controlling stake via purchase of stakes of existing shareholders.
Buyout – large: This includes buyout deals of 100 million USD or more in value.
Other: This includes PE investments in special purpose vehicle (SPV) or project-level investments.
Types of PE exits
Buyback: This includes the purchase of the PE or VC investors’ equity stakes by either the investee company or its founders or promoters.
Strategic sale: This includes the sale of the PE or VC investors’ equity stakes (or the entire investee company itself) to a third-party company (which is typically a larger company in the same sector).
Secondary sale: Any purchase of the PE or VC investors’ equity stakes by another PE or VC investors constitutes secondary sale.
Public market sale: This includes the sale of the PE or VC investors’ equity stakes in a listed company through the public market.
Initial public offering (IPO): This includes the sale of PE or VC investors’ equity stake in an unlisted company through its first public offering of stock.

PwC MoneyTreeTM India Report – Q1 ’15
PricewaterhouseCoopers and Venture Intelligence have taken responsible steps to ensure that the information contained in the MoneyTreeTM report has been obtained from reliable sources. However, neither of the parties can warrant the ultimate validity of the data obtained. Results are updated periodically. Therefore, all data is subject to change at any time. Before making any decision or taking any action, you should consult a competent professional adviser.
© 2015 PwC. All rights reserved. PwC refers to the PwC network and/or one or more of its member firms, each of which is a separate legal entity.
Please see http://www.pwc.com/structure for further details. This content is for general information purposes only, and should not be used as a
substitute for consultation with professional advisors. MW-15-0805
www.pwc.com/globalmoneytree www.pwc.in
Contacts
Sandeep Ladda Leader, Technology PwC India [email protected]
Sanjeev Krishan Leader, Private Equity PwC India [email protected]
This report was researched and written by the following:
Pradyumna Sahu Director, Technology PwC India [email protected]
Sibi Sathyan Knowledge Manager, Private Equity PwC India [email protected]
About PwC’s Technology Institute
The Technology Institute is PwC’s global research network that studies the business of technology and the technology of business with the purpose of creating thought leadership that offers both fact-based analysis and experience-based perspectives. Technology Institute insights and viewpoints originate from active collaboration between our professionals across the globe and their first-hand experiences working in and with the technology industry.
About PwC
PwC firms help organisations and individuals create the value they are looking for. We are a network of firms in 157 countries with more than 195,000 people who are committed to delivering quality in assurance, tax and advisory services. Tell us what matters to you and find out more by visiting us at www.pwc.com.
www.pwc.com