Prices These Days! The Cost of Living in Australia
44
The cost of living in Australia AMP.NATSEM Income and Wealth Report Issue 31 - May 2012 Price these da ys!
-
Upload
abc-news-online -
Category
Documents
-
view
214 -
download
0
Transcript of Prices These Days! The Cost of Living in Australia

8/2/2019 Prices These Days! The Cost of Living in Australia
http://slidepdf.com/reader/full/prices-these-days-the-cost-of-living-in-australia 1/44
The cost of living in Australia
AMP.NATSEM Income and Wealth Report
Issue 31 - May 2012
Pricethese days!

8/2/2019 Prices These Days! The Cost of Living in Australia
http://slidepdf.com/reader/full/prices-these-days-the-cost-of-living-in-australia 2/44
8/2/2019 Prices These Days! The Cost of Living in Australia
http://slidepdf.com/reader/full/prices-these-days-the-cost-of-living-in-australia 3/44
Contents
Foreword 2
Introduction 3
Measuringthecostofliving 4
Luxuriesandnecessities 7
Livingcosts 16
Standardofliving 19
Biggerlifestyles 22
Capitalcitycostoflivingcomparison 26
Internationalcostoflivingcomparison 28
Conclusion 31
AppendixA 32
AppendixB 33
Technicalnotes 37
References 38

8/2/2019 Prices These Days! The Cost of Living in Australia
http://slidepdf.com/reader/full/prices-these-days-the-cost-of-living-in-australia 4/44
Inrecenttimes,hoursofairtimehavebeendevotedtothecost
oflivingandhowitaffectsusasindividualsandfamilies.It’sa
subjectthat’simportanttoalmostallofus,whichiswhymedia
storiesconsideringthepriceofeverydayitemslikeelectricity,
petrolandfoodandtheirimpactonthefamilybudgetappear
sofrequently.
Everyyeartheperceptionseemstobethatitgetshardertoafford
thebasics.Butarepricesreallyoutpacingourincomes?While
somepricessuchaselectricityandpetrolhavecertainlyshotup
inrecentyears,manyotherpriceshavefallensuchastelevisions
orclothing.Coulditbethatwe’replacinggreaterexpectationsonourselvesandwhatourstandardoflivingshouldbe?
ThelatestAMP.NATSEMreportPrices these days!exploreshow
thecostoflivinghaschangedsince1984.Thereportrevealsthat
overalltheaveragefamilyisaheadby$224perweekandthe
benefitshavespreadtobothhighandlowincomefamilies.Low
incomehouseholdsareaheadby$93aweeksince1984while
highincomehouseholdsare$429perweekbetteroff.
Australiansearningincomefrominvestments-typicallyself-
fundedretirees-didparticularlywell,experiencingincome
growthof$547perweekabovetheirlivingcostsoverthesame
period,largelyduetostrongdividendgrowthfromshares,superannuationincome,andpropertyincome.
So where are we spending our money?
Notunexpectedlywearepayingmoreonmortgagesandrent
todaythanwedid20yearsago.We’respendingmoreofour
disposableincomeondiscretionaryexpenses,suchasrestaurant
meals,holidaysandprivateeducation.
Around40percentofhouseholdspendingisdiscretionary
spending,upfrom38percentin1984.Lowincomehouseholds
devotearoundoneinthreedollarsondiscretionaryspending
whilehighincomehouseholdsdevotearound45percent.
DoesthismeanAustralianshavere-defined‘luxury’anddoourspendinghabitsrepresentalargerlifestyle?Andwhydo
Australiansfeelasthoughthestruggletomakeendsmeetis
gettingincreasinglytougher?
Todayit’snotuncommontoexpecttoeatatgoodrestaurants,
buythelatesttechnologyandenjoyholidayswhichdon’tinvolve
campingorstayingwithrelatives.Andchildcarehasbecomea
lifenecessityforpeopleofallincomelevelsratherthanaluxury
enjoyedbyonlythewealthy.
Somaybeit’snotthecostoflivingthat’ssoaringoutofcontrol,
butratherouraspirationalselvestellingusweneedmore.Or
becauseourliveshavebecomesofastpacedweneedtospend
moretokeepup,beitonchildcareoreducationorotherservices.
Sowhatisthenewnormal?Hasthelinebetweenbasic
necessitiesandluxuryitemsblurred?Itseemsthemoreweearn,
themorethingswewanttobuy,orhave,oruse.
Somecouldarguethatasanationwe’veneverhaditsogood.
Australianshaveitbetterthanmost,especiallyincomparison
torecession-hitcountriesinEurope.Onaninternationalcomparisonthereportshowsthatwhileourpricesarehigher
thanmostothercountries,ourincomesandgeneralstandard
oflivingarealsoveryhigh.
Whilethereisnodoubtmanyfamiliescontinuetostruggleto
makeendsmeetitishearteningtoseeincomeshavebeenrising
morethanlivingcosts,andthishasbeenspreadacrossall
incomegroups.
Debatearoundthecostoflivingisunlikelytoabateanytimesoon
butit’sreassuringtoknowthatalotofwhatwearespendingour
moneyonarethingsthatallowustospendmoretimewithour
friendsandfamilies.
Ifspendingmoneyonaholidaymeansqualitytimewithour
family,eatingoutmeanssharingamealwithfriendsandthe
latestsmartphonemeansimprovedcommunicationwiththose
thatmattertousthenwearealmostcertainlylivingricherlives.
Craig Meller
ManagingDirectorAMPFinancialServices
Foreword
2
8/2/2019 Prices These Days! The Cost of Living in Australia
http://slidepdf.com/reader/full/prices-these-days-the-cost-of-living-in-australia 5/44
Introduction
InthisreportweinvestigatethecostoflivinginAustralia,anissue
thatdominatespoliticalandsocialdebate.Itisoftensaidthatthe
costoflivingisspirallingoutofcontrol,withfamiliesatbreaking
pointandstrugglingtomakeendsmeet.
Formanygroupssuchastheunemployed,students,pensioners,
thedisabledandlowincomeworkingfamilies,makingendsmeet
isoftenadailybattle.Evenforhigherincomefamiliesmaking
endsmeetcanoftenbeastruggle.Thisreportdoesn’tattemptto
argueagainstthis,butratherconsidersjustwhatthesecostof
livingpressuresareandwhethertheyaregettingworse.Couldit
bethatthesecostoflivingpressuresaredrivenbygreater
expectationsorsocietalchangesorisitthatpricesreallyareout
ofcontrolandfamilyincomesarenotkeepingup?
Mostpoliticaldebateonthetopicofcostoflivingpressures
focusesonanarrowrangeofeasilyidentifiablepricessuchas
petrol,electricity,orthepriceofbananasandotherfruitsand
vegetables.Thesepricesareviewedasbeingofsuchimportance
thattheFederalGovernmentlookedintosettingup‘watchdog’
websitessuchasFuelWatchandGroceryWatch.Thisreport
providesacomprehensiveanalysisofallpricesfacedby
householdsacrossarangeofhouseholdtypesatdifferentends
ofthesocio-economicspectrum.
Therealityisofcoursethatpricesalmostalwaysrise,soit’s
inevitablethiswouldcauseconcerninthecommunity.Asprices
rise,afamily’spurchasingpowerdeclinesandstandardsofliving
fall.Keyfactorsthattendtobeoverlookedarethefactthatfamily
incomesalsotendtoriseaswagesgrow,workinghoursincrease
orfamilieshavemorethanoneincomeearner.
Anotherelementoftenoverlookedisthatmanypriceshave
actuallyfallen.Thepriceofmanyhightechnologygoods,suchas
largescreentelevisions,havefallendramaticallyinrecenttimes.
Thepriceofclothinghasbarelyalteredsincethe1980sasimport
tariffswereremoved.ThemuchstrongerAustraliandollarhasalsoactedasabarriertoinflationforimportedgoods,suchas
carsandcomputers.
Dothesefactorsmorethancompensatefortheinevitableprice
increases?Arecostoflivingpressuresmoretheoutcomeofthat
innatehumantraittokeepupwithourneighboursbybuying
biggercars,televisionsorhouses?Arecostoflivingpressures
relatedtochangesinexpectationsorsocietalchanges?Orare
priceincreasesdrivingcostoflivingpressures?AMPandNATSEM
haveundertakenacomprehensiveinvestigationofprices,
householdexpenditureandincomepatternsovertimetohelp
answerthesequestions.
“The No.1 concern for put-uponfamilies is the cost of living”
The Daily Telegraph
3

8/2/2019 Prices These Days! The Cost of Living in Australia
http://slidepdf.com/reader/full/prices-these-days-the-cost-of-living-in-australia 6/44
Measuring the cost of living
Acuriouselementofthecostoflivingdebateisthatofficial
statisticsrarelybackuptheclaimpricesareoutofcontrol.
Australianinflationrates,asmeasuredbytheConsumerPrice
Index(CPI),haveremainedatstableandverylowratesfor
20years,eversincewageswerebroughtundercontrolviathe
PricesandIncomesAccordinthe1980sandtheReserveBank
becameindependentofgovernmentinthe1990sandtargeted
lowinflation.Sowhat’sallthefussabout?Howcanitbethat
we’vehad20yearsofuninterruptedeconomicprosperitywith
verylowinflationyetthecostoflivingremainsahottopic?
Australia’sofficialmeasureofpricechangeforhouseholdsisthe
AustralianBureauofStatistics’(ABS)CPI,howeveritisnota
measurespecificallydesignedtomeasurethecostofliving.
TheCPI,ameasureofpricemovementsinAustralia,witharound
100,000priceobservationsmadeeverythreemonths,isoneof
themostcontroversialandcloselywatchedeconomicstatisticsin
Australia.Themeasureitselffocusesonpriceinflationofafixed
basketofgoodsandservicesanddoesnottakeintoaccount
changesinconsumerbehaviour.Themeasureisnotdesignedto
specificallymeasurethecostoflivingbutisconsideredbymost
economistsandstatisticiansasagoodindicatorofbothprice
changeandthecostoflivingorhouseholdpurchasingpower.
Forpracticalandtheoreticalreasons,atruecostoflivingindexis
verydifficulttomeasureandnosuchindexiscompiledwithin
Australiaorinternationally.Itmaysurprisemanytoknowthatthe
CPInaturallyoverstatespriceinflationcomparedtoatruecostof
livingindex.Thisiscalledthe‘CPIbias’andhasbeenestimatedby
theABStobearound0.2ofapercentagepointperannumon
average(ABS2010).
AnothercommonconcernwiththeABSCPIisthetreatmentof
houseprices.Thecurrentindexdoesnotincludehousepricesor
mortgagerepaymentsastheyarenotconsideredtobe
‘consumption’items.InsteadtheABSusesausuallylessvolatile
componentcallednewhousepurchase.Fromacostoflivingperspectiveonewouldexpectthatthefamily
mortgageisanimportantelementofafamilybudgetandshould
beincludedinanycostoflivinganalysis.TheABSincluded
mortgageinterestintheirLivingCostIndexfrom1998to
overcomethislimitationandthisseriesispublishedalongsidethe
CPIpublication(ABS2011a).
AfurtherconcernoftheABS’CPIisthatthebasketofgoodsmay
notreflectthetrueexpenditurepatternsoflowerincome
households(SACOSS2012)whotypicallyspendalargershareof
incomeonhouseholdnecessitiessuchaselectricity,rentorpetrol.
Thesepriceshaverisensharplyinrecentyearsandforlowincome
households,wouldtakeongreaterimportanceintheABSbasket
ofgoods.
TheABSlargelyovercomestheseconcernsbyprovidingseparate
LivingCostIndexesforpensionersandemployeesintheirsuiteof
LivingCostIndexes.
ThisAMP.NATSEMreportgreatlyexpandsupontheABS’LivingCost
IndexesbyprovidingindexesforanumberoftypicalAustralian
households,definedbytheirincomelevels,familytype,agegroup,
employmentandtenurestatusandmainsourceofincome.
TodevelopLivingCostIndexesforeachofthesehouseholdtypes
weconsideredthespendingpatternsofeachgroupseparately.
Weknowthatfamilieswithchildrenspendonitemssuchaschildcareorchildren’sclothingcomparedtosingles,sotheirrespective
LivingCostIndexreflectstheseimportantdifferencesin
spendingpatterns.
Bycomparingchangesineachgroup’sdisposableincomeand
livingcostswecandeterminewhichgroupsaresufferingthe
mostfromcostoflivingpressuresandwhichgroupsarewell
aheadofpricechangesandexperiencingimprovingstandards
ofliving.
Ifitisfoundthathouseholdincomesareoutpacingtheircostof
living,thenperhapsthedriverofthisdebateisnotsomuch
prices,butgreaterexpectationspushingfamiliestodemandmore
orbettergoodsandservices.Theliftinexpectationsmayrelatetokeepingupwithourneighboursoritmayrelatetoachanged,
morecomplicatedworldwherefamiliesaretimepoorandface
alteredandlargersocietaldemands.
Forexample,atimepoorfamilymayhavebothparentsworking,
whichoftennecessitatesout-sourcingofservicesthatwerenot
paidforinthepast,suchaschildcare,foodpreparation,
gardeningandhousekeeping.Wealsofacegreaterdemandsin
termsofincreasededucationalrequirements,changed
communicationchannelsandmoresophisticatedtechnology.
Allthesefactorspushfamiliestoincreasetheirspendingbeyond
whatwasrequiredinpastdecades.
4
8/2/2019 Prices These Days! The Cost of Living in Australia
http://slidepdf.com/reader/full/prices-these-days-the-cost-of-living-in-australia 7/44
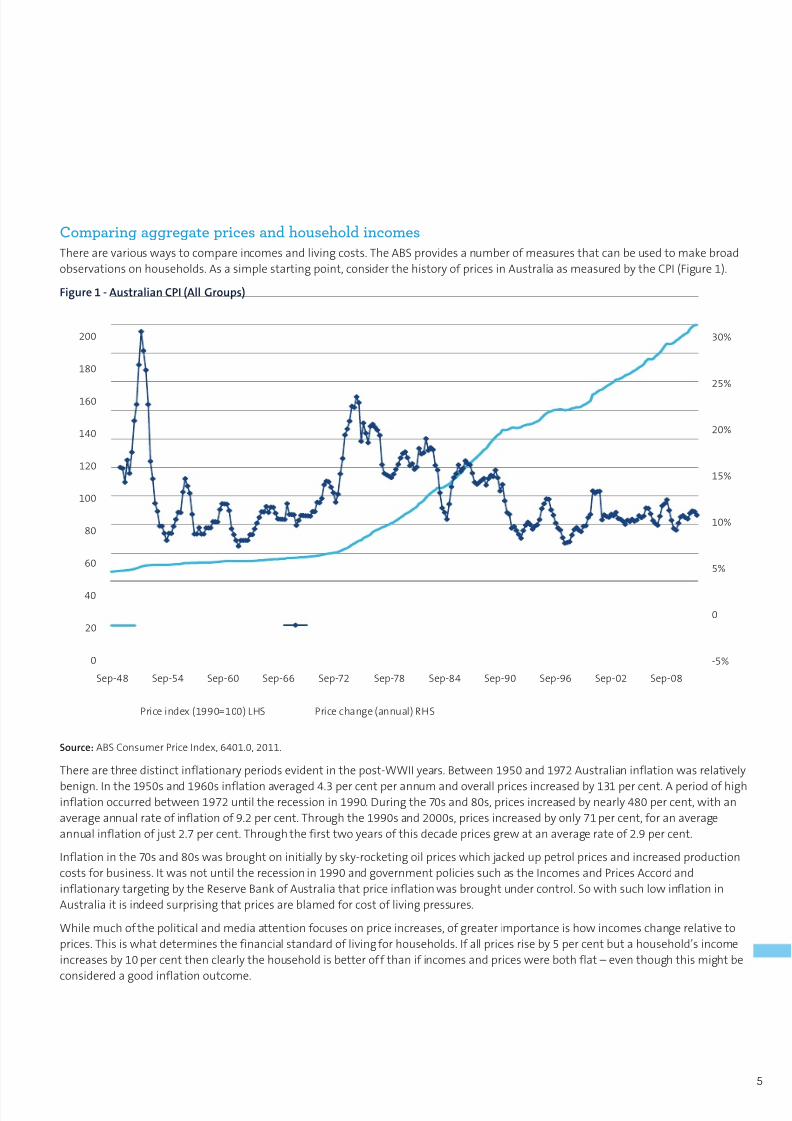
Comparing aggregate prices and household incomes
Therearevariouswaystocompareincomesandlivingcosts.TheABSprovidesanumberofmeasuresthatcanbeusedtomakebroad
observationsonhouseholds.Asasimplestartingpoint,considerthehistoryofpricesinAustraliaasmeasuredbytheCPI(Figure1).
Figure 1 - Australian CPI (All Groups)
200
180
160
140
120
100
80
60
40
20
0
30%
25%
20%
15%
10%
5%
0
-5%
Sep-48 Sep-54 Sep-60 Sep-66 Sep-72 Sep-78 Sep-84 Sep-90 Sep-96 Sep-02 Sep-08
Price index (1990=100) LHS Price change (annual) RHS
Source:ABSConsumerPriceIndex,6401.0,2011.
Therearethreedistinctinflationaryperiodsevidentinthepost-WWIIyears.Between1950and1972Australianinflationwasrelatively
benign.Inthe1950sand1960sinflationaveraged4.3percentperannumandoverallpricesincreasedby131percent.Aperiodofhighinflationoccurredbetween1972untiltherecessionin1990.Duringthe70sand80s,pricesincreasedbynearly480percent,withan
averageannualrateofinflationof9.2percent.Throughthe1990sand2000s,pricesincreasedbyonly71percent,foranaverage
annualinflationofjust2.7percent.Throughthefirsttwoyearsofthisdecadepricesgrewatanaveragerateof2.9percent.
Inflationinthe70sand80swasbroughtoninitiallybysky-rocketingoilpriceswhichjackeduppetrolpricesandincreasedproduction
costsforbusiness.Itwasnotuntiltherecessionin1990andgovernmentpoliciessuchastheIncomesandPricesAccordand
inflationarytargetingbytheReserveBankofAustraliathatpriceinflationwasbroughtundercontrol.Sowithsuchlowinflationin
Australiaitisindeedsurprisingthatpricesareblamedforcostoflivingpressures.
Whilemuchofthepoliticalandmediaattentionfocusesonpriceincreases,ofgreaterimportanceishowincomeschangerelativeto
prices.Thisiswhatdeterminesthefinancialstandardoflivingforhouseholds.Ifallpricesriseby5percentbutahousehold’sincome
increasesby10percentthenclearlythehouseholdisbetteroffthanifincomesandpriceswerebothflat–eventhoughthismightbe
consideredagoodinflationoutcome.
5

8/2/2019 Prices These Days! The Cost of Living in Australia
http://slidepdf.com/reader/full/prices-these-days-the-cost-of-living-in-australia 8/44
Figure2displaysatimeseriesofincomeandexpenditureforallAustralianhouseholdswhereallmeasuresaredeflated(CPIgrowth
removed)andaveragedacrosshouseholds.Thefigureclearlyshowsthatincomesandexpenditurehaveout-pacedinflation.Infact,
after-tax(disposable)incomegrewoverthelast25yearsby45percent,whichmaygiverisetotheconclusionthatlivingstandardsin
Australiahaveimprovedtremendously.
Figure 2 - Real household income and expenditure (December 2011 $)
$150,000
$140,000
$130,000
$120,000
$110,000
$100,000
$90,000
$80,000
$70,000
$60,000
$50,000
J u n - 8 6
J u n - 8 7
J u n - 8 8
J u n - 8 9
J u n - 9 0
J u n - 9 1
J u n - 9 2
J u n - 9 3
J u n - 9 4
J u n - 9 5
J u n - 9 6
J u n - 9 7
J u n - 9 8
J u n - 9 9
J u n - 0 0
J u n - 0 1
J u n - 0 2
J u n - 0 3
J u n - 0 4
J u n - 0 5
J u n - 0 6
J u n - 0 7
J u n - 0 8
J u n - 0 9
J u n - 1 0
J u n - 1 1
Gross income Disposable income Expenditure
Source:ABSAustralianNationalAccounts,ABSCatNo.6401,2011.
However,thesecalculationsfocusonaggregateoutcomes.Thesenumbersalonedon’trevealifthespoilsof20yearsofsustained
economicgrowthhavebeensharedthroughoutthecommunity.Itmaybethatincomegrowthhasbeenconcentratedamongsthigh
incomehouseholdsorthatlowincomehouseholdsarefacedwithhigherenergybillsorever-increasingpetrolcostswhichtakeupa
largerportionoftheirdisposableincomes.
Subsequentsectionsofthisreportconsiderthesequestionsandseekstoexplainwhetherornotdifferentgroupsinthecommunitytrulyare,inspiteofthisrosyaggregatestory,strugglingtomakeendsmeet.
6
8/2/2019 Prices These Days! The Cost of Living in Australia
http://slidepdf.com/reader/full/prices-these-days-the-cost-of-living-in-australia 9/44
Luxuries and necessities
The big price movers
ThebasketofgoodsusedfortheCPIisanaverageforallhouseholds.Itisnotintendedthatthebasketshouldrepresentlowincome
groups,orpensioners,orjusttheitemsthatmightbedescribedasnecessities.ItisoftensuggestedthattheCPIunderstatesinflation
forlowincomefamilies,workingfamilieswithkidsorpensionerhouseholds,astheydevoteahigherproportionoftheirincometothe
necessitiesoflifecomparedtotheaveragehouseholds.Populardiscussiononthetopicalsosuggeststhatthesefamiliesareforcedto
spendever-increasingamountsontheessentialsoflifewithpreciouslittleelsetospareforluxuries.
Tobetterunderstandthecostoflivingpressuresissue,itisusefultoconsiderwhichitemsintheCPIbasketofgoodsareincreasingin
pricethemostandwhich,ifany,aredeclining.
Figure3showssomepriceshavegrownverystrongly.Tobaccoisacase-in-point,increasinginpriceby9.2percentperannum,or978per
centoverthepast27years.ThisgrowthisdramaticcomparedtotheoverallCPIgrowthforthisperiodof171percentor3.8percentperannumandmostlyduetosuccessivegovernmentsincreasingtobaccotaxation.Somehealthrelatedandinsurancecostshavealso
increasedquitestrongly.Educationexpensesforsecondarystudentsincreasedby4.9percentperannumor264percent.Thesecosts
mostlyrelatetoprivateschooleducationfees.Someotherbasicsoflivingsuchasfruitandbreadhavealsoseenverystrongpricegrowth.
However,notallpriceshaverisen,withaudiovisualandcomputingequipmentnowonlyonetenthofpricesin1984 1helpingtooffset
thesepriceincreases.Anothersignificantareaofpricedeflationisforclothingandfootwearwhereaveragepricesarelittlechanged,and
oftenlowertodaythan27yearsago.Thischangereflectsamovetoimportedclothingandreductionsintariffsontheseimportedgoods.
1.CautionshouldbetakenininterpretingthispricechangeastheABSappliesaconsiderable‘qualitychange’factor.Thispricechangecouldbeconsideredunrealisticasthepricechangeeffectivelyrelatestothepricechangeofasimilaritemin1984whichcouldnowbeconsideredirrelevantgiventechnologicalchangeinthiscategoryofgoods.
7

8/2/2019 Prices These Days! The Cost of Living in Australia
http://slidepdf.com/reader/full/prices-these-days-the-cost-of-living-in-australia 10/44
Small electrical appliances
Footwear for men
Garments for kids/babies
Garments for women
Garments for men
Games, toys and hobbies
Glass, tableware and utensils
Audio visual and computing services
Equipment for sporting and camping
Audio visual and computing
Incomes
CPI
Bread
Spirits
Fruit
Secondary education
Urban transport fares
Lamb and goat
Insurance
Dental services
Medical/hospital
Tobacco
-0.0%
-0.1%
-0.1%
-0.2%
-0.4%
-0.4%
-0.4%
-0.6%
-0.12%
-8.1%
4.4%
3.8%
4.8%
4.9%
4.9%
4.9%
5.1%
5.2%
5.7%
5.8%
7.2%
9.2%
-10% -8% -6% -4% -2% 0% 2% 4% 6% 8% 10%
Price drops
Price gains
Figure 3 - Top 10 and bottom 10 price movers
(ABS Expenditure Class)
Average annual change 1984–2011 %
Source:ABSCPI.
8

8/2/2019 Prices These Days! The Cost of Living in Australia
http://slidepdf.com/reader/full/prices-these-days-the-cost-of-living-in-australia 11/44
OtheritemsnotlistedinFigure3butofparticularnoteincludeelectricity(+253percent),rent(+223percent)andmortgages
(+256percent)(seeTableA1).Alltheseitemsgrewmoresharplythanthe171percentincreaseinCPIsince1984.Attheotherend
ofthescale,carsincreasedbyonly19percentandmajorhouseholdapplianceshavenotchangedinpriceoverthepast27years.2
Ifevertherewasasingleitemthatrepresentsthecostoflivingforfamiliesitispetrol.Petrolistheonepricethatpeoplecanidentify
sincemostpeoplefilluptheirpetroltanksonaregularbasis.Petrolhasincreasedinpriceby208percentsince1984.Yetthisisonly
around14percentmorethantheaggregateCPIoverthesameperiod.Furthermore,acrossthedevelopedworldAustralia’spetrolprices
areamongthelowestwithonlyCanada,USAandMexicocheaper.3ComparedwithAustralia’scurrentaverageunleadedpetrolpriceof
aroundA$1.40perlitre,mostEuropeancountriesfacepetrolpricesthatarewellovertheequivalentofA$2perlitrebecauseof
significantlyhighertaxation.
Whileitistruethatthepriceofsomeitems,oftenthenecessitiesoflife,haveincreasedsignificantlymorethantheCPI,thereisalsoarangeofotheritemsthathelptooffsetthesepriceincreasesincludingclothing,sportingandcampingandchildren’stoys.
TheCPIisacomplexassortmentofgoodsandserviceswitheachitemhavingitsownrelativeimportanceinthesocalled‘basketof
goods’.However,consideringonlyafewitemsandascribingbroadstatementsaboutthecostoflivingisnotappropriate.Inthesection
belowweinvestigatetheexpenditurepatternsofthefullrangeofitemsandplacethemincategoriesthathelpidentifyshiftsin
householdexpenditure.
Discretionary and necessary expenditure
WeusetheABSHouseholdExpenditureSurvey(HES)toinvestigatehouseholdspendingandtherelativesharedevotedtodiscretionary
versusnecessityexpenditure.TheHESisthemostcomprehensiveexpendituresurveyinAustraliawiththelatest2009–10surveyasking
nearly10,000householdstoreportonover600expenditurecategories.Thisallowsdetailedanalysisofthespendinghabitsofdifferent
households.WealsoanalyseallHESsbackto1984,whichallowsustoinvestigatetrendsandbetterunderstandcostoflivingpressures.
Toinvestigatethequestionofdiscretionaryandnecessityspending,wesplitthedetailedcategoriesofexpenditureintothree
separatecategories:
1. Basicnecessities
2. Relativenecessities
3. Discretionary
Thisisafarfromsimpleexerciseandrequiressomesubjectivity.Asastartingpoint,Table1offersexamplesofitemsineachcategory.
Thebasicnecessitiesdescribeitemsthathouseholdscannotdowithout.Theseitemsareforbasicsurvivalsuchasshelter,food
andclothing.
Relativenecessities,whilenotitemsforbasicsurvival,areusuallyconsideredessentialformoderndayliving.Theseitemsincludethose
usedformodernsocialcommunication,whileitemssuchascomputersmaybeconsideredaspirationalitemsastheyareimportantforeducationoremployment.
Discretionaryitemsarethedollarswespendwithwhatisleftoverafterthesenecessaryexpenses.
2.TheABSappliesasignificantqualityadjustmenttocarswhichwouldmeanthatactualpricesofnewcarsincreasedbyalargerfactorthantheCPIsuggests.
3.Source:AustralianPetroleumStatistics,DepartmentofResources,Energy&Tourism.
9
8/2/2019 Prices These Days! The Cost of Living in Australia
http://slidepdf.com/reader/full/prices-these-days-the-cost-of-living-in-australia 12/44
Table 1 - Commodity categories (selected examples)
Basic necessity Relative necessity Discretionary
Rent Television Alcoholandtobacco
Mortgage(interestpayments) Mobilephone Preparedfoods
Basicfoods(bread,meat,cereal,etc) Computer Restaurantmeals
Electricity Childcare Householdservices
Clothing CDplayer Airfares
Publictransport Suits Holidays
Thegroupingissubjectiveandmaychangethroughtime.Forexample,mobilephoneswerealuxuryiteminthe1980sbut,today,verge
onbeingabasicnecessity.IntheHESweonlyknowthecategoryofpurchase-wedonotknowanythingaboutthebrandorpricepaid
forthepurchase.Assuch,someitemscouldspananyofthethreecategoriesabove.Asanexample,amortgageforapenthouseonthe
GoldCoasthasacleardiscretionaryelement,whileafirsthomebuyer’smortgageinoutersuburbanMelbourneisabasicnecessity.
Inspiteofthecomplexities,the600pluscommoditiesintheHESweregroupedaccordingtothethreecategoriesandexpenditures
talliedforvarioushouseholdtypes.Wefoundthatoverall,householdsdevotearound40percentofexpendituretodiscretionaryitems,
38percenttobasicnecessitiesand22percenttorelativenecessities.Overtime,thisrelationshiphasbeenquitestablewithasmall
shifttowardsdiscretionaryitemsandnecessitiesandawayfromrelativenecessities.
ForAustralianhouseholdsonthewhole,wethereforefindlittleevidencethathouseholdsarespendingagreaterproportiononbasic
necessities.GiventheprosperityofAustraliaandstronggrowthinincomerelativetopricelevelsdepictedinFigure2theshifttodiscretionaryitemsshouldnotsurprise.Economistsgenerallyexpectthatasincomelevelsrisesotoowouldexpenditureon
discretionaryitems.Thenextsectiondelvesintoamoredetailedstorytoinvestigatewhetherthisisthecaseforallhouseholdtypes
orwhetherthisisjustastorythatholdsforcertaingroupsthathelpdraguptheaverage.
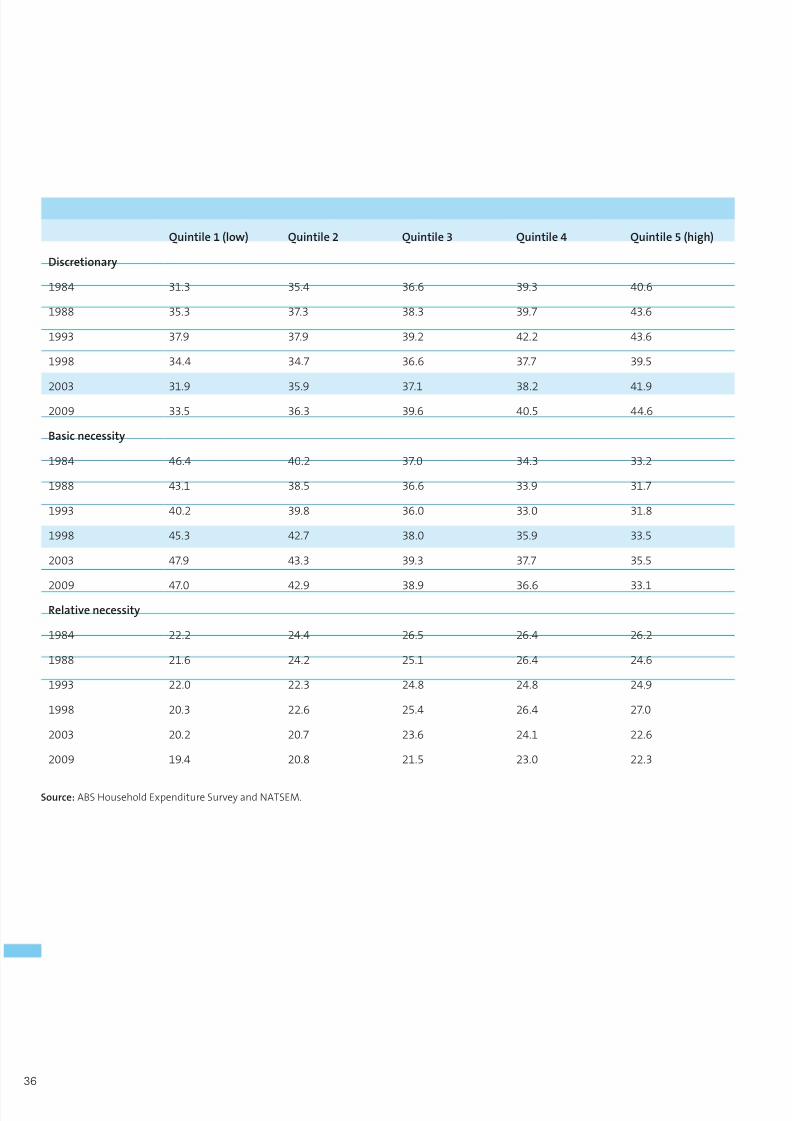
Income levels
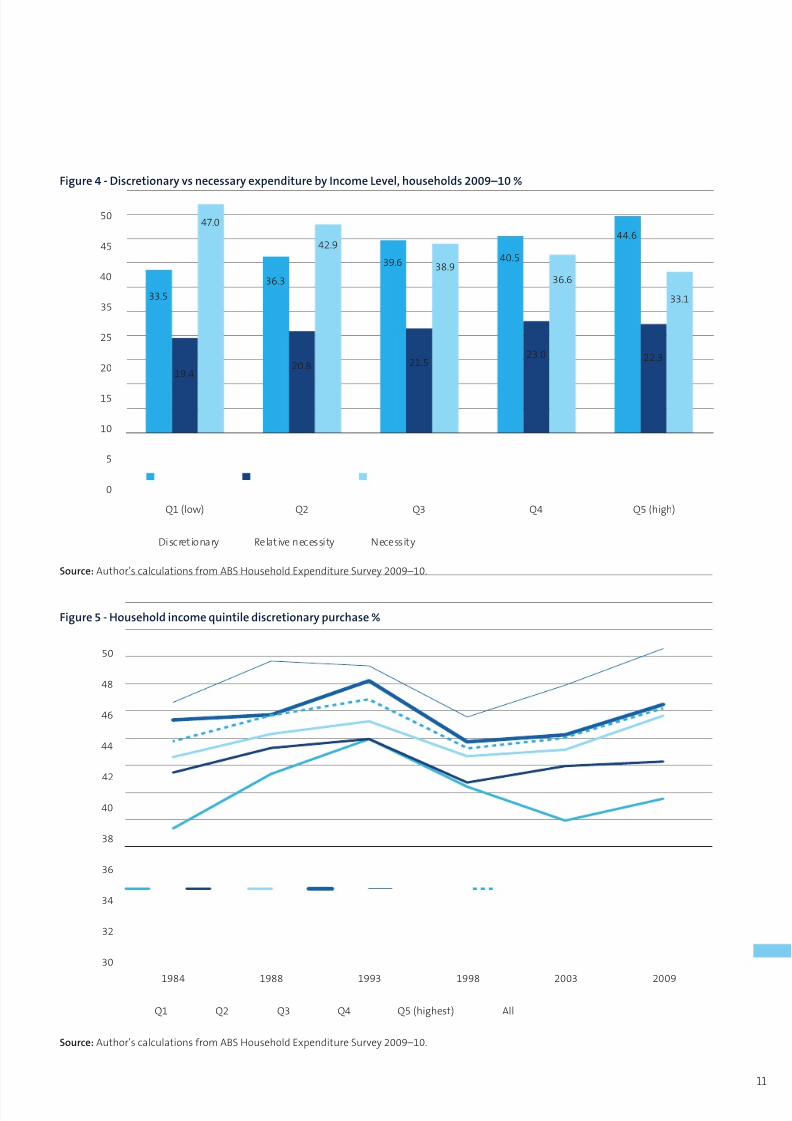
Figure4demonstratestheproportionsofexpendituredevotedtodiscretionaryincomeandbasic/relativenecessitiesbyincomelevel.
Unsurprisingly,wefindthatlowincomehouseholds(quintileoneorthebottom20percent)spendasmallerfractionofexpenditure
ondiscretionaryitems.However,westillfindthatlowincomehouseholdsdevotearoundoneinthreedollarstodiscretionaryitems.
Thosehouseholdsinthetopquintileofincomedevote45percentofexpendituretodiscretionaryitemsandonedollarinthreeon
basicnecessities.4
ThenumbersinFigure5toFigure7showthetrendsthroughtimesince1984indiscretionary,necessaryandrelativenecessityspending.Bothhighandlowincomehouseholdsareincreasinglyspendingmoreondiscretionaryitems,whileexpenditureonbasic
necessitiesisrelativelyunchangedasaproportionoftotalspend.Figure7demonstratesthatallincomegroupsarespending
proportionatelylessonlife’snecessities.Themaindriverofthischangeisthatmostoftheseitemshavesignificantlyreducedinprice
soit’snotthathouseholdsarebuyingless,theyarejustcheaper.5
4.TheOECD‘modified’equivalisedincomeadjustmentisappliedtoincometoaccountfordifferenthouseholdsizesandstructures.Seetechnicalnotesforfurtherinformation.
5.TheactualfiguresbehindFigure5toFigure7andresultsforotherhouseholdtypesaredisplayedinAppendixB.
10
8/2/2019 Prices These Days! The Cost of Living in Australia
http://slidepdf.com/reader/full/prices-these-days-the-cost-of-living-in-australia 13/44
Figure 4 - Discretionary vs necessary expenditure by Income Level, households 2009–10 %
Q1 (low) Q2 Q3 Q4 Q5 (high)
50
45
40
35
25
20
15
10
5
0
Discretionary Relative necessity Necessity
33.5
47.0
42.9
38.936.6
33.1
36.3
39.6 40.5
44.6
20.819.4
21.523.0 22.3
Source:Author’scalculationsfromABSHouseholdExpenditureSurvey2009–10.
Figure 5 - Household income quintile discretionary purchase %
50
48
46
44
42
40
38
36
34
32
30
Q1 Q2
1984 1988 1993 1998 2003 2009
Q3 Q4 Q5 (highest) All
Source:Author’scalculationsfromABSHouseholdExpenditureSurvey2009–10.
11

8/2/2019 Prices These Days! The Cost of Living in Australia
http://slidepdf.com/reader/full/prices-these-days-the-cost-of-living-in-australia 14/44
Figure 6 - Household income quintile basic necessity purchase %
50
48
46
44
42
40
38
36
34
32
30
Q1 Q2
1984 1988 1993 1998 2003 2009
Q3 Q4 Q5 (highest) All
Source:Author’scalculationsfromABSHouseholdExpenditureSurvey2009–10.
Figure 7 - Household income quintile relative necessity purchase %
29
27
25
23
21
19
17
15
Q1 Q2
1984 1988 1993 1998 2003 2009
Q3 Q4 Q5 (highest) All
Source:Author’scalculationsfromABSHouseholdExpenditureSurveys,1984–2009.
12
8/2/2019 Prices These Days! The Cost of Living in Australia
http://slidepdf.com/reader/full/prices-these-days-the-cost-of-living-in-australia 15/44
Source of income
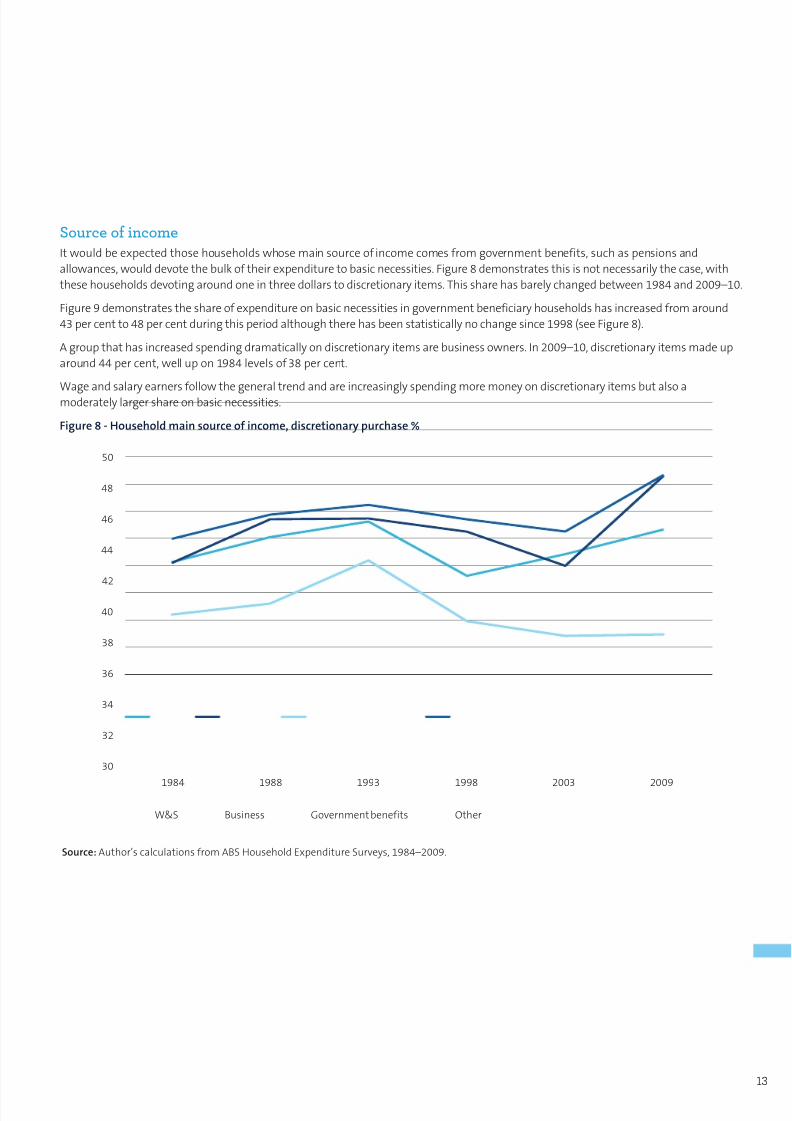
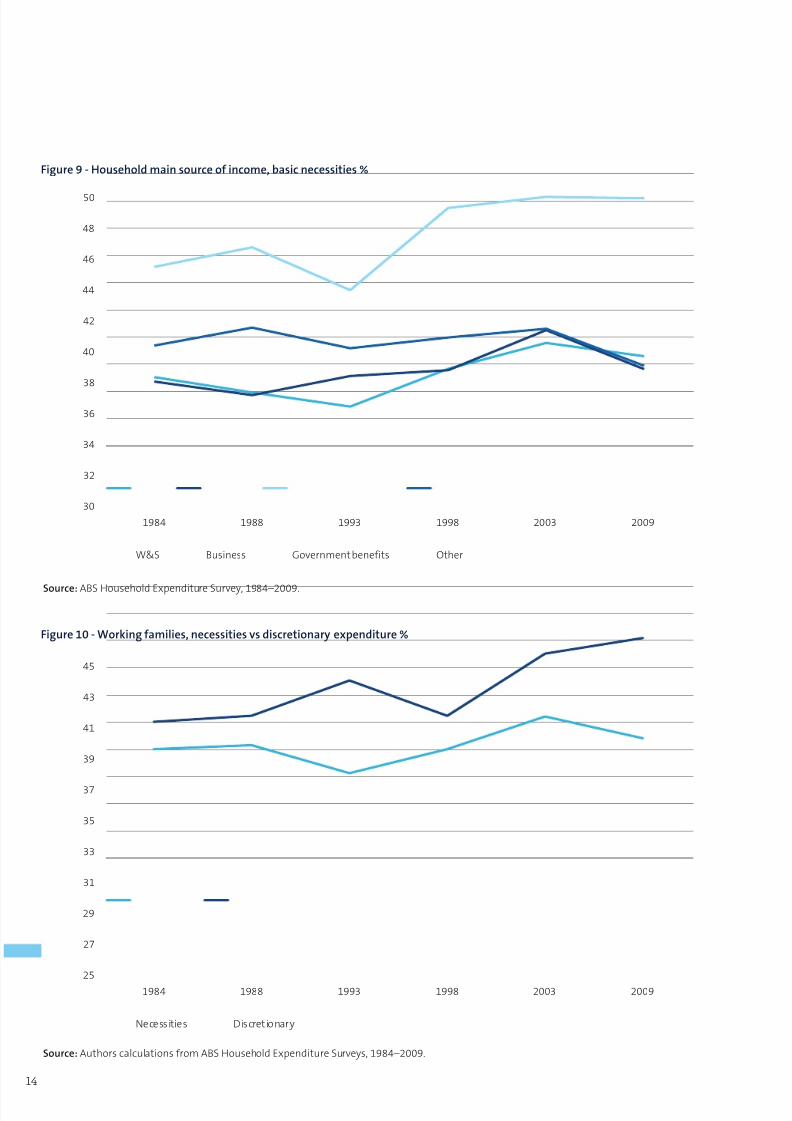
Itwouldbeexpectedthosehouseholdswhosemainsourceofincomecomesfromgovernmentbenefits,suchaspensionsand
allowances,woulddevotethebulkoftheirexpendituretobasicnecessities.Figure8demonstratesthisisnotnecessarilythecase,with
thesehouseholdsdevotingaroundoneinthreedollarstodiscretionaryitems.Thissharehasbarelychangedbetween1984and2009–10.
Figure9demonstratestheshareofexpenditureonbasicnecessitiesingovernmentbeneficiaryhouseholdshasincreasedfromaround
43percentto48percentduringthisperiodalthoughtherehasbeenstatisticallynochangesince1998(seeFigure8).
Agroupthathasincreasedspendingdramaticallyondiscretionaryitemsarebusinessowners.In2009–10,discretionaryitemsmadeup
around44percent,wellupon1984levelsof38percent.
Wageandsalaryearnersfollowthegeneraltrendandareincreasinglyspendingmoremoneyondiscretionaryitemsbutalsoamoderatelylargershareonbasicnecessities.
Figure 8 - Household main source of income, discretionary purchase %
50
48
46
44
42
40
38
36
34
32
30
W&S Business Other
1984 1988 1993 1998 2003 2009
Government benefits
Source:Author’scalculationsfromABSHouseholdExpenditureSurveys,1984–2009.
13
8/2/2019 Prices These Days! The Cost of Living in Australia
http://slidepdf.com/reader/full/prices-these-days-the-cost-of-living-in-australia 16/44
Figure 9 - Household main source of income, basic necessities %
50
48
46
44
42
40
38
36
34
32
30
W&S Business Other
1984 1988 1993 1998 2003 2009
Government benefits
Source:ABSHouseholdExpenditureSurvey,1984–2009.
Figure 10 - Working families, necessities vs discretionary expenditure %
45
43
41
39
37
35
33
31
29
27
25
Necessities Discretionary
1984 1988 1993 1998 2003 2009
Source:AuthorscalculationsfromABSHouseholdExpenditureSurveys,1984–2009.
14

8/2/2019 Prices These Days! The Cost of Living in Australia
http://slidepdf.com/reader/full/prices-these-days-the-cost-of-living-in-australia 17/44
Thissplitbetweennecessaryanddiscretionaryitemsissomewhatlimitedinthatitdoesnotdetailtheoverallexpenditurelevels,only
relativelevelsofspending.Theanalysisdoessuggestthattherehasbeennolargeincreaseintherelativeexpendituredevotedtothe
basicnecessitiesoflifeasmightbecommonlyperceived.Thesharesdevotedtothesecategorieshavebeenstableoverthepast
25yearsandthatstabilityappearstoextendthroughoutincomelevelsandsourcesofhouseholdincome.
ThetableinAppendixBshowsthefullsetofresultsforthenecessitiesanddiscretionaryexpenditureanalysis.Wefindthathouseholds
whoownahouseoutrightorhaveamortgagespendamuchlargerportionondiscretionaryitemscomparedtorentersandthis
percentagehasincreasedsharplyovertimedespiteknownmortgagestressissuesand‘mortgagebelt’costoflivingpressures.6
Between1984and2009,rentersspentproportionatelyless(32percent,downfrom37percent)ondiscretionaryitemsandmoreon
necessities(47percent,upfrom42percent).
Costoflivingpressuresarealsooftenassociatedwith‘workingfamilies’.Thesefamiliestypicallyhaveamortgageandchildrenwhereatleastoneoftheparentsworksfull-time.ThehistoricaldatainFigure10showsthatthisgroup,morethananyother,hasincreased
spendingtowardsdiscretionaryitemswhilemaintainingasteadyproportionofbasicnecessities.
Thissuggeststhatinspiteofknownpricerisesinmanyhighlyvisiblecommoditiessuchaspetrol,electricity,rentsandmortgagesand
fruitandvegetables,whichareoftenlumpedtogetheraslifeessentials,householdsarenotdevotinganincreasingshareofexpenditure
tothebasics.Itcouldbethatotheressentialsarecheaperorhouseholdsarepurchasingsmallerquantitiesofthesehigherpriced
essentials.Whiletherewassomeincreaseintheproportionofexpenditureallocatedtothenecessitiesinthe1990sforlowincomeand
governmentbeneficiaryhouseholds,thistrendflattenedoutduringthelastdecade.
Cost of living pressures arealso often associated with‘working families’
6.TheAMP.NATSEMReport29onhousingaffordabilityshowedthatmortgagepressuresarefeltmoststronglybyrecentpurchasers,suchasfirsthomebuyers,ratherthanthevastbulkofhouseholdswithamortgagewhopurchasedtheirfirsthousepriortothehousingboomsince2000whooftenhavequitesmallmortgages.
15

8/2/2019 Prices These Days! The Cost of Living in Australia
http://slidepdf.com/reader/full/prices-these-days-the-cost-of-living-in-australia 18/44
Inthefirstsectionwediscussedtherelationshipbetween
householdincomesandtheCPI.Figure2(onpage6)showsclearly
thathouseholdsareearningmoreandspendingmorethanever,
evenafterinflationistakenintoaccount.
Thissectiontakesadetailedlookattheincomesofdifferent
householdtypesandcomparesthoseincomeswithlivingcoststo
seeiftheprosperityofournationhasbeenspreadevenlyoris
disproportionatelyfallingintothelapsofthewealthy.
Living costs index
Aspreviouslydiscussed,theCPImeasureisnotdesignedasacost
oflivingindex.SowehavemodifiedtheCPIdatatobetterinform
thecostoflivingdiscussion.Todothiswehaveusedasimilar
methodologytothatoftheABSwiththeirLivingCostIndexes.
ThemajordifferencebetweentheLivingCostIndexesandtheCPI
istheinclusionofmortgageinterestpayments;thisdifferenceis
incorporatedinourlivingcostmeasure.Wealsorecalculatethe
LivingCostIndexestosuitthehouseholdexpenditurepatternsof
awiderangeofhouseholdtypes.7
Analysingthesehouseholdtypesovercomestheconcernthatthe
CPIdoesnotadequatelymirrortheexpenditurepatternsof
certaingroupsinsociety.Forexample,manyarguethat
pensionersandotherlowincomehouseholdshavemuchhigher
costoflivingpressuresthanothergroupsinsociety.By
developingseparateindexesthatreflecttheexpenditurepatterns
ofeachofthesegroupswecantestthisargument.Ouranalysis
providesLivingCostIndexesforthefollowinghousehold
categories:
– Incomequintiles
– Familytype
– ‘Working’families
– Mainsourceofincome
– Tenuretype,and
– Age
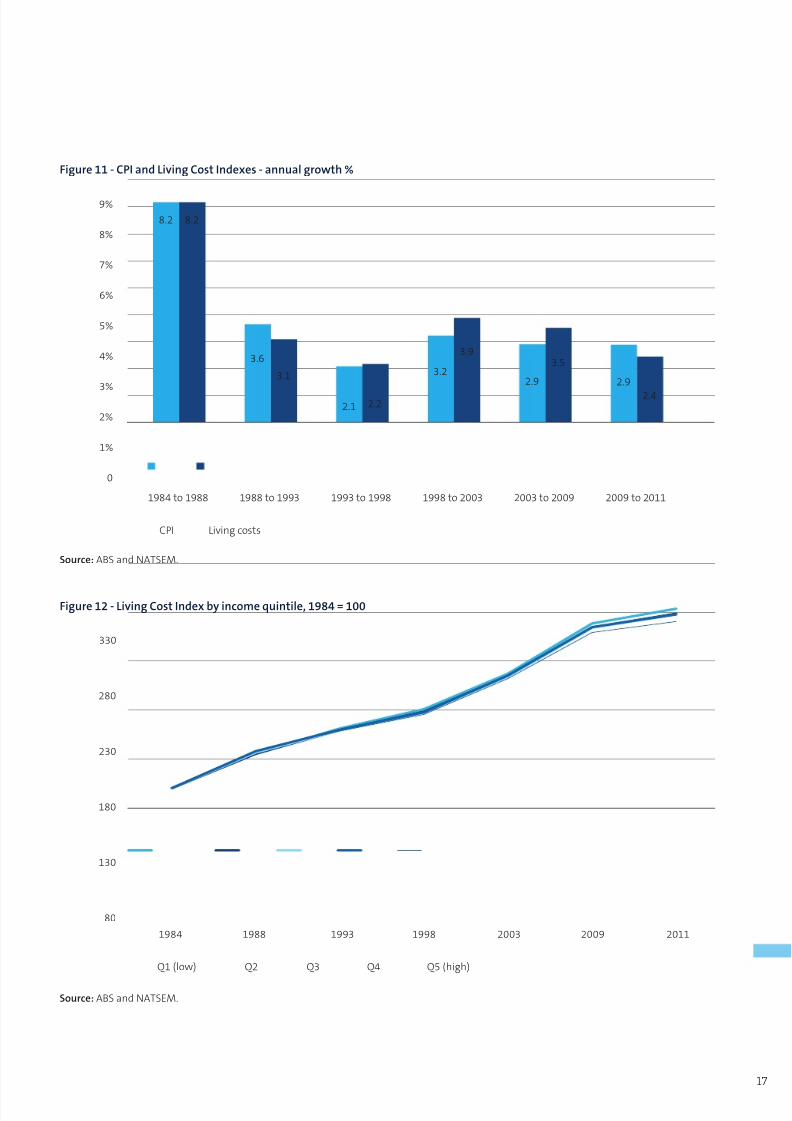
Beforedetailingeachhouseholdtypeitisworthconsideringhow
theseLivingCostIndexescomparewiththeCPIhistoricallyforall
householdsinaggregate.Figure11showsthattheLivingCost
IndexdidincreasemoresharplythantheCPIoverthelastdecade.
Between2003and2009livingcostsincreasedby3.5percent
eachyear,whiletheCPIincreasedbyonly2.9percent.The
differencebetweenthetwocanbelinkedtothestronggrowthin
mortgageinterestrepayments.
Aparticularlyinterestingcomparisoncanbemadethroughtime
regardingwhichgovernmentwasmostsuccessfulincontaining
costoflivingpressures.DuringtheHawkeyears(1983to1991)thecostoflivingindexgrewbyanannualrateof6.2percentwhile
mortgageinterestratesincreasedto17percentandthecountry
wasstillinthegripofthelegacyofmanyyearsofhighinflation.
TheKeatingGovernment(1991to1996)managedthelowestliving
costincreaseswithanaverageannualgrowthrateofjust2.7per
cent.TheKeatingyearswerenodoubtboostedbyinterestrates
comingoffnearrecordhighsandarecessionthatstymiedinflation.
Suchhasbeenthestabilityoflivingcostssince1996,thateachof
theHoward,RuddandGillardgovernmentsaveragedannual
growthinlivingcostsof2.9percent.
Inrealitytheinflationstoryisacomplexoneand,whilepoliticallyinteresting,itisdifficulttoascribeinflationarypressurestoany
onegovernment.Bytheirverynature,inflationarypressuresare
dynamicandimpactedbyarangeoffactorslargelyoutofa
government’scontrol,suchasexchangeratesorthestateofthe
globaleconomy.
TheoverallstoryforlivingcostsinAustraliaoverthepasttwo
decadeshasbeenoneofbeingincontrol,notoutofcontrol.With
theexceptionofthelate1980s,wheninflationwasstillaserious
matterfortheAustralianeconomy,livingcostsinaggregatehave
remainedrelativelysubdued.
Living costs by income
Conventionalwisdomsuggeststhatlivingcostpressuresare
becomingagreaterissueforlowincomehouseholds.These
householdsspendproportionatelymoreoftheirincomeonitems
suchaspetrolandenergyandpriceinflationforthesegoodshas
beenstrong.
Earlier,weshowedthatsince1984,lowincomehouseholdshave
infactnotincreasedtheirexpenditureshareonthebasicsof
livingwhichsuggeststhatwhilethesehouseholdsdodevotetheir
expenditurestocertainitemsthatareincreasingstronglyinprice,
suchasenergy,healthcostsorfreshfruit,theyalsodevotean
equallylargeportionofexpendituretoitemsthatarenowrelativelycheapersuchasclothingandaudiovisualand
computingequipment.
Tobetterunderstandthelivingcostsofhouseholdswithdifferent
incomes,Figure12showsthelivingcostsastheyrelateto
differentincomelevels.Thegraphshowsthatoverall,changesin
livingcostsdonotdivergegreatlybasedonincome.
Throughouttheentire27yearsanalysed,thegapinthegrowthof
pricesfacedbetweenthebottomquintilehouseholdsandthetop
quintileisonly4.9percent.Since2003,thelowestincome
householdshaveexperiencedannuallivingcostincreasesof
3.4percent,moderatelyhigherthanthehighestincomegroups
livingcostincreasesof3.1percent.
Living costs
7. TheABS’PBLCI(PensionerandBeneficiaryLivingCostIndex)providestheLivingCostIndexspecificallyforpensioners,self-fundedretirees,andemployees.
16
8/2/2019 Prices These Days! The Cost of Living in Australia
http://slidepdf.com/reader/full/prices-these-days-the-cost-of-living-in-australia 19/44
Figure 11 - CPI and Living Cost Indexes - annual growth %
1984 to 1988 1988 to 1993 1993 to 1998 1998 to 2003 2003 to 2009 2009 to 2011
9%
8%
7%
6%
5%
4%
3%
2%
1%
0
CPI Living costs
8.2 8.2
3.6
3.1
2.1 2.2
3.9
3.22.9
3.5
2.9
2.4
Source: ABSandNATSEM.
Figure 12 - Living Cost Index by income quintile, 1984 = 100
330
280
230
180
130
80
1984 1988 1993 1998 2003 2009 2011
Q1 (low) Q2 Q3 Q4 Q5 (high)
Source: ABSandNATSEM.
17
8/2/2019 Prices These Days! The Cost of Living in Australia
http://slidepdf.com/reader/full/prices-these-days-the-cost-of-living-in-australia 20/44
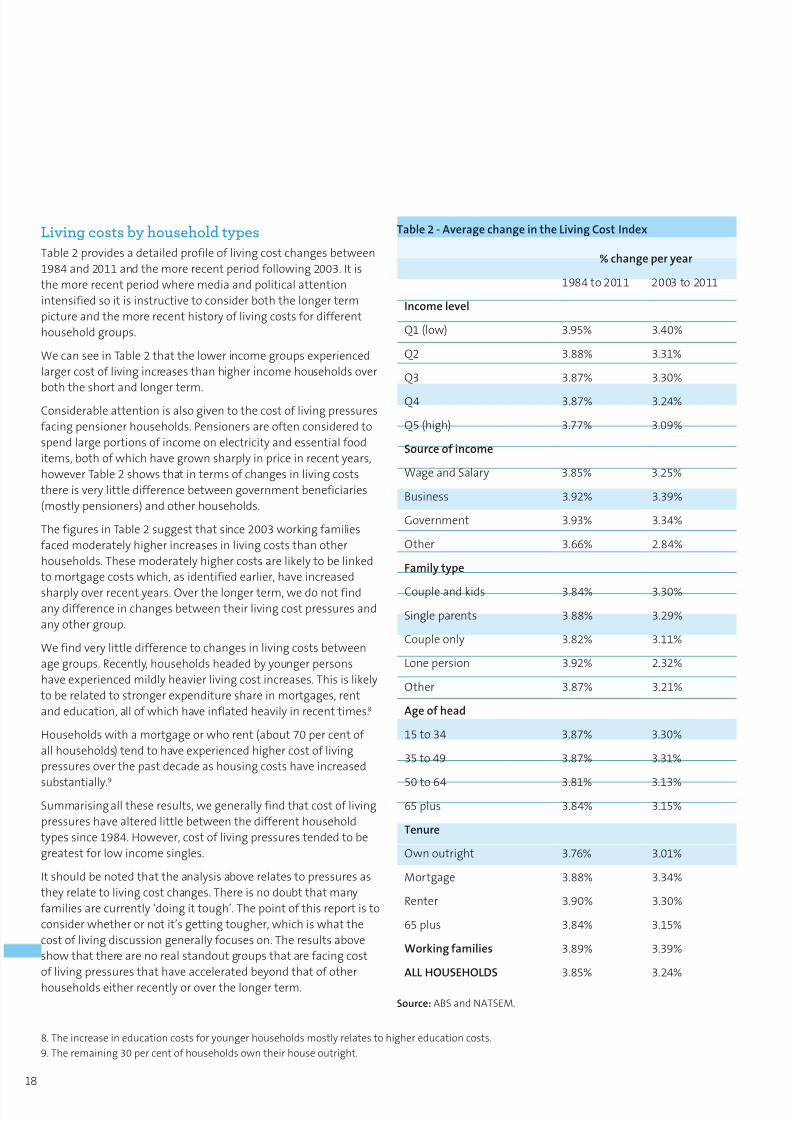
Living costs by household types
Table2providesadetailedprofileoflivingcostchangesbetween
1984and2011andthemorerecentperiodfollowing2003.Itis
themorerecentperiodwheremediaandpoliticalattention
intensifiedsoitisinstructivetoconsiderboththelongerterm
pictureandthemorerecenthistoryoflivingcostsfordifferent
householdgroups.
WecanseeinTable2thatthelowerincomegroupsexperienced
largercostoflivingincreasesthanhigherincomehouseholdsover
boththeshortandlongerterm.Considerableattentionisalsogiventothecostoflivingpressures
facingpensionerhouseholds.Pensionersareoftenconsideredto
spendlargeportionsofincomeonelectricityandessentialfood
items,bothofwhichhavegrownsharplyinpriceinrecentyears,
howeverTable2showsthatintermsofchangesinlivingcosts
thereisverylittledifferencebetweengovernmentbeneficiaries
(mostlypensioners)andotherhouseholds.
ThefiguresinTable2suggestthatsince2003workingfamilies
facedmoderatelyhigherincreasesinlivingcoststhanother
households.Thesemoderatelyhighercostsarelikelytobelinked
tomortgagecostswhich,asidentifiedearlier,haveincreased
sharplyoverrecentyears.Overthelongerterm,wedonotfindanydifferenceinchangesbetweentheirlivingcostpressuresand
anyothergroup.
Wefindverylittledifferencetochangesinlivingcostsbetween
agegroups.Recently,householdsheadedbyyoungerpersons
haveexperiencedmildlyheavierlivingcostincreases.Thisislikely
toberelatedtostrongerexpenditureshareinmortgages,rent
andeducation,allofwhichhaveinflatedheavilyinrecenttimes.8
Householdswithamortgageorwhorent(about70percentof
allhouseholds)tendtohaveexperiencedhighercostofliving
pressuresoverthepastdecadeashousingcostshaveincreased
substantially.9
Summarisingalltheseresults,wegenerallyfindthatcostofliving
pressureshavealteredlittlebetweenthedifferenthousehold
typessince1984.However,costoflivingpressurestendedtobe
greatestforlowincomesingles.
Itshouldbenotedthattheanalysisaboverelatestopressuresas
theyrelatetolivingcostchanges.Thereisnodoubtthatmany
familiesarecurrently‘doingittough’.Thepointofthisreportisto
considerwhetherornotit’sgettingtougher,whichiswhatthe
costoflivingdiscussiongenerallyfocuseson.Theresultsabove
showthattherearenorealstandoutgroupsthatarefacingcost
oflivingpressuresthathaveacceleratedbeyondthatofother
householdseitherrecentlyoroverthelongerterm.
Table 2 - Average change in the Living Cost Index
% change per year
1984to2011 2003to2011
Income level
Q1(low) 3.95% 3.40%
Q2 3.88% 3.31%
Q3 3.87% 3.30%
Q4 3.87% 3.24%
Q5(high) 3.77% 3.09%
Source of income
WageandSalary 3.85% 3.25%
Business 3.92% 3.39%
Government 3.93% 3.34%
Other 3.66% 2.84%
Family type
Coupleandkids 3.84% 3.30%
Singleparents 3.88% 3.29%
Coupleonly 3.82% 3.11%
Lonepersion 3.92% 2.32%
Other 3.87% 3.21%
Age of head
15to34 3.87% 3.30%
35to49 3.87% 3.31%
50to64 3.81% 3.13%65plus 3.84% 3.15%
Tenure
Ownoutright 3.76% 3.01%
Mortgage 3.88% 3.34%
Renter 3.90% 3.30%
65plus 3.84% 3.15%
Working families 3.89% 3.39%
ALL HOUSEHOLDS 3.85% 3.24%
Source:ABSandNATSEM.
8.Theincreaseineducationcostsforyoungerhouseholdsmostlyrelatestohighereducationcosts.
9.Theremaining30percentofhouseholdsowntheirhouseoutright.
18
8/2/2019 Prices These Days! The Cost of Living in Australia
http://slidepdf.com/reader/full/prices-these-days-the-cost-of-living-in-australia 21/44
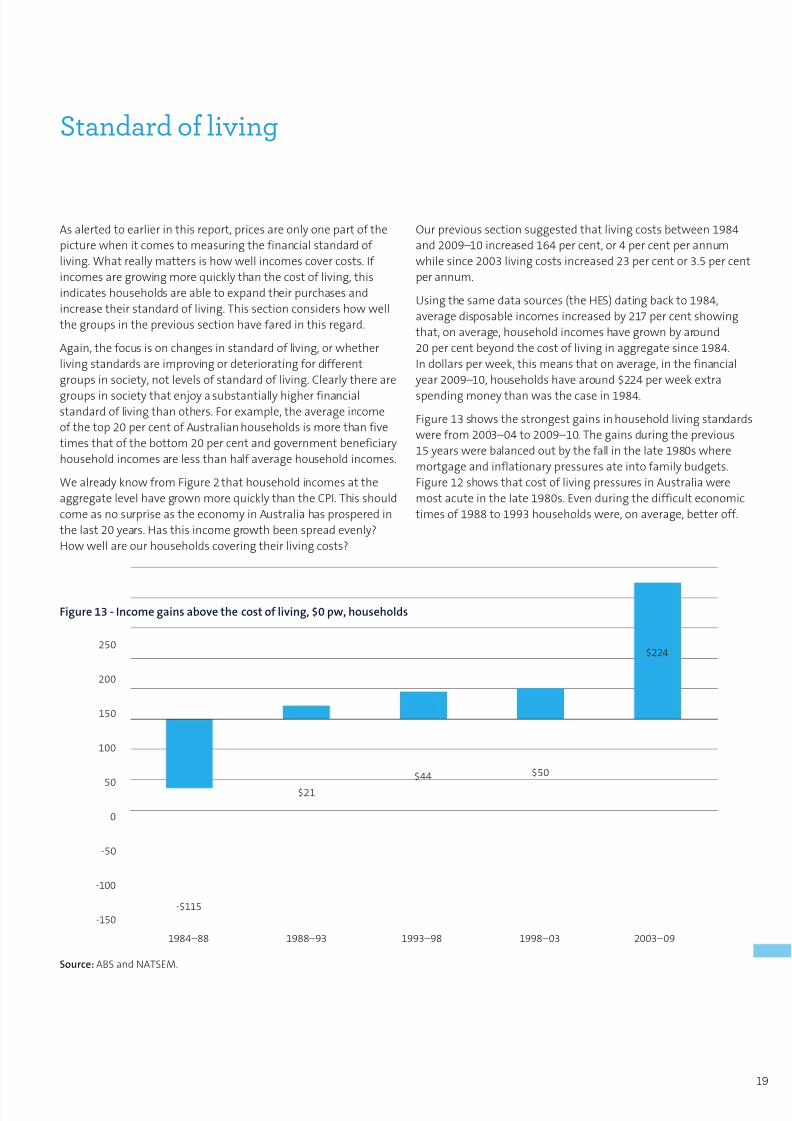
Asalertedtoearlierinthisreport,pricesareonlyonepartofthe
picturewhenitcomestomeasuringthefinancialstandardof
living.Whatreallymattersishowwellincomescovercosts.If
incomesaregrowingmorequicklythanthecostofliving,this
indicateshouseholdsareabletoexpandtheirpurchasesand
increasetheirstandardofliving.Thissectionconsidershowwell
thegroupsintheprevioussectionhavefaredinthisregard.
Again,thefocusisonchangesinstandardofliving,orwhether
livingstandardsareimprovingordeterioratingfordifferent
groupsinsociety,notlevelsofstandardofliving.Clearlythereare
groupsinsocietythatenjoyasubstantiallyhigherfinancialstandardoflivingthanothers.Forexample,theaverageincome
ofthetop20percentofAustralianhouseholdsismorethanfive
timesthatofthebottom20percentandgovernmentbeneficiary
householdincomesarelessthanhalfaveragehouseholdincomes.
WealreadyknowfromFigure2thathouseholdincomesatthe
aggregatelevelhavegrownmorequicklythantheCPI.Thisshould
comeasnosurpriseastheeconomyinAustraliahasprosperedin
thelast20years.Hasthisincomegrowthbeenspreadevenly?
Howwellareourhouseholdscoveringtheirlivingcosts?
Ourprevioussectionsuggestedthatlivingcostsbetween1984
and2009–10increased164percent,or4percentperannum
whilesince2003livingcostsincreased23percentor3.5percent
perannum.
Usingthesamedatasources(theHES)datingbackto1984,
averagedisposableincomesincreasedby217percentshowing
that,onaverage,householdincomeshavegrownbyaround
20percentbeyondthecostoflivinginaggregatesince1984.
Indollarsperweek,thismeansthatonaverage,inthefinancial
year2009–10,householdshavearound$224perweekextra
spendingmoneythanwasthecasein1984.
Figure13showsthestrongestgainsinhouseholdlivingstandards
werefrom2003–04to2009–10.Thegainsduringtheprevious
15yearswerebalancedoutbythefallinthelate1980swhere
mortgageandinflationarypressuresateintofamilybudgets.
Figure12showsthatcostoflivingpressuresinAustraliawere
mostacuteinthelate1980s.Evenduringthedifficulteconomic
timesof1988to1993householdswere,onaverage,betteroff.
Standard of living
Figure 13 - Income gains above the cost of living, $0 pw, households
1984–88 1988–93 1993–98 1998–03 2003–09
250
200
150
100
50
0
-50
-100
-150
-$115
$21
$44
$224
$50
Source:ABSandNATSEM.
19
8/2/2019 Prices These Days! The Cost of Living in Australia
http://slidepdf.com/reader/full/prices-these-days-the-cost-of-living-in-australia 22/44
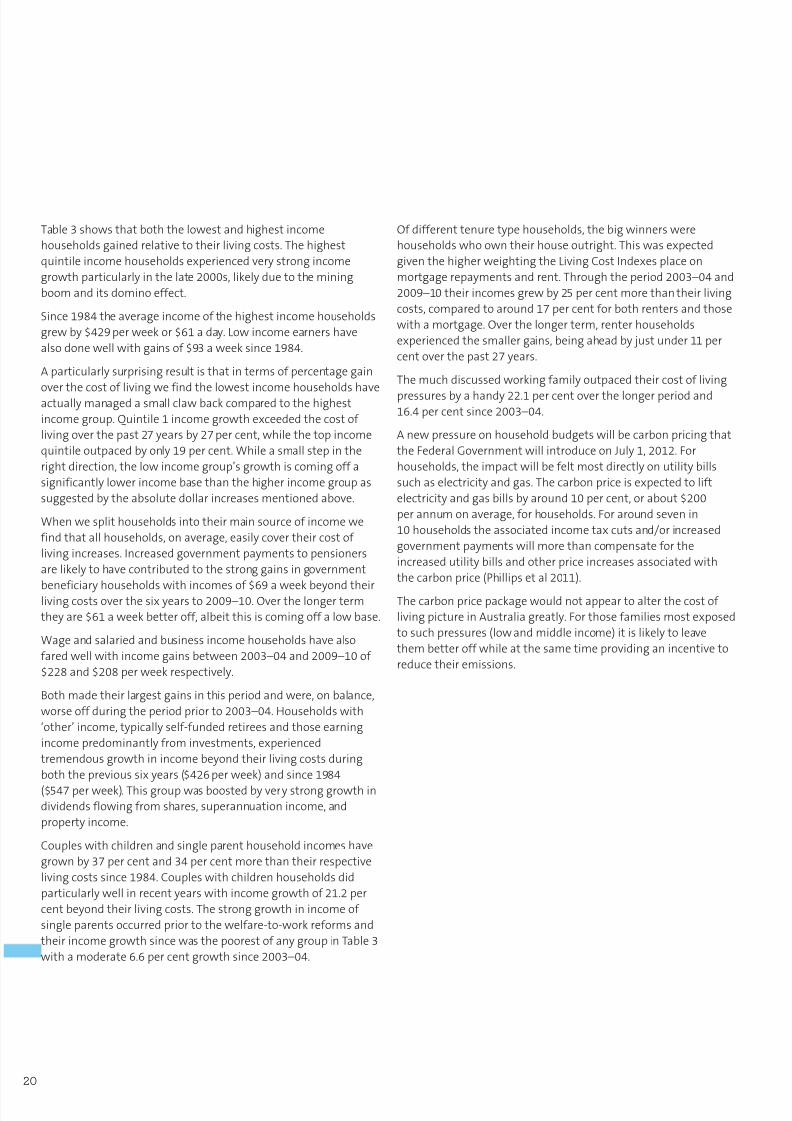
Table3showsthatboththelowestandhighestincome
householdsgainedrelativetotheirlivingcosts.Thehighest
quintileincomehouseholdsexperiencedverystrongincome
growthparticularlyinthelate2000s,likelyduetothemining
boomanditsdominoeffect.
Since1984theaverageincomeofthehighestincomehouseholds
grewby$429perweekor$61aday.Lowincomeearnershave
alsodonewellwithgainsof$93aweeksince1984.
Aparticularlysurprisingresultisthatintermsofpercentagegain
overthecostoflivingwefindthelowestincomehouseholdshaveactuallymanagedasmallclawbackcomparedtothehighest
incomegroup.Quintile1incomegrowthexceededthecostof
livingoverthepast27yearsby27percent,whilethetopincome
quintileoutpacedbyonly19percent.Whileasmallstepinthe
rightdirection,thelowincomegroup’sgrowthiscomingoffa
significantlylowerincomebasethanthehigherincomegroupas
suggestedbytheabsolutedollarincreasesmentionedabove.
Whenwesplithouseholdsintotheirmainsourceofincomewe
findthatallhouseholds,onaverage,easilycovertheircostof
livingincreases.Increasedgovernmentpaymentstopensioners
arelikelytohavecontributedtothestronggainsingovernment
beneficiaryhouseholdswithincomesof$69aweekbeyondtheirlivingcostsoverthesixyearsto2009–10.Overthelongerterm
theyare$61aweekbetteroff,albeitthisiscomingoffalowbase.
Wageandsalariedandbusinessincomehouseholdshavealso
faredwellwithincomegainsbetween2003–04and2009–10of
$228and$208perweekrespectively.
Bothmadetheirlargestgainsinthisperiodandwere,onbalance,
worseoffduringtheperiodpriorto2003–04.Householdswith
‘other’income,typicallyself-fundedretireesandthoseearning
incomepredominantlyfrominvestments,experienced
tremendousgrowthinincomebeyondtheirlivingcostsduring
boththeprevioussixyears($426perweek)andsince1984
($547perweek).Thisgroupwasboostedbyverystronggrowthindividendsflowingfromshares,superannuationincome,and
propertyincome.
Coupleswithchildrenandsingleparenthouseholdincomeshave
grownby37percentand34percentmorethantheirrespective
livingcostssince1984.Coupleswithchildrenhouseholdsdid
particularlywellinrecentyearswithincomegrowthof21.2per
centbeyondtheirlivingcosts.Thestronggrowthinincomeof
singleparentsoccurredpriortothewelfare-to-workreformsand
theirincomegrowthsincewasthepoorestofanygroupinTable3
withamoderate6.6percentgrowthsince2003–04.
Ofdifferenttenuretypehouseholds,thebigwinnerswere
householdswhoowntheirhouseoutright.Thiswasexpected
giventhehigherweightingtheLivingCostIndexesplaceon
mortgagerepaymentsandrent.Throughtheperiod2003–04and
2009–10theirincomesgrewby25percentmorethantheirliving
costs,comparedtoaround17percentforbothrentersandthose
withamortgage.Overthelongerterm,renterhouseholds
experiencedthesmallergains,beingaheadbyjustunder11per
centoverthepast27years.
Themuchdiscussedworkingfamilyoutpacedtheircostofliving
pressuresbyahandy22.1percentoverthelongerperiodand16.4percentsince2003–04.
Anewpressureonhouseholdbudgetswillbecarbonpricingthat
theFederalGovernmentwillintroduceonJuly1,2012.For
households,theimpactwillbefeltmostdirectlyonutilitybills
suchaselectricityandgas.Thecarbonpriceisexpectedtolift
electricityandgasbillsbyaround10percent,orabout$200
perannumonaverage,forhouseholds.Foraroundsevenin
10householdstheassociatedincometaxcutsand/orincreased
governmentpaymentswillmorethancompensateforthe
increasedutilitybillsandotherpriceincreasesassociatedwith
thecarbonprice(Phillipsetal2011).
Thecarbonpricepackagewouldnotappeartoalterthecostof
livingpictureinAustraliagreatly.Forthosefamiliesmostexposed
tosuchpressures(lowandmiddleincome)itislikelytoleave
thembetteroffwhileatthesametimeprovidinganincentiveto
reducetheiremissions.
20
8/2/2019 Prices These Days! The Cost of Living in Australia
http://slidepdf.com/reader/full/prices-these-days-the-cost-of-living-in-australia 23/44
Table 3 - Incomes gains after living cost changes
1984 to 2009–10 2003–04 to 2009–10
$pw** %gain* $pw %gain
Income quintile
Q1(low) $93 27.1% $42 10.7%
Q2 $191 30.5% $105 14.7%
Q3 $200 19.5% $153 14.2%
Q4 $211 14.6% $250 17.8%
Q5(high) $429 19.1% $576 27.4%
Source of income
Wagesandsalaries $170 11.3% $228 15.9%
Business $175 15.6% $208 19.1%
Governmentbenefits $61 11.9% $69 13.7%
Other $547 64.8% $426 44.1%
Family type
Coupleandchildren $475 34.0% $328 21.2%
Singleparents $257 37.4% $59 6.6%
Coupleonly $181 16.0% $220 20.0%
Loneperson $86 14.0% $115 19.8%
Otherfamily/group -$74 -4.0% $266 17.4%
Tenure type
Outrightowner $241 27.0% $228 25.2%
Purchaser $254 16.8% $254 16.9%
Renter $112 10.7% $173 17.5%Other $199 23.9% $197 23.7%
Working families $306 22.1% $238 16.4%
ALL $199 19.9% $224 19.9%
* Equivalisedincome(seetechnicalnotes).
**Actualincome.
Source:ABSandNATSEM.
21
8/2/2019 Prices These Days! The Cost of Living in Australia
http://slidepdf.com/reader/full/prices-these-days-the-cost-of-living-in-australia 24/44
Bigger lifestyles
Theobviousquestionthatremainsisifwearealldoingsowell,
howcanitbethatcostoflivingpressuresremainsofrontof
mind?Thissectionexploreshouseholdpatterns.Welookatthe
typesofgoodsandservicespurchasedandcomparewithearlier
times.Perhapsitisallthisspendingthatmakesusstressabout
thecostofliving?Keepingupwithourreferencegroup(often
named‘theJoneses’)maybeasourceofstresstosome.Friends
purchasingthatnewplasmascreentelevision,afivebedroom
housewithahometheatreroomorashinynewSUVcanalllead
tofeelingsofenvy.Forothersitmaybethattheworldtoday
demandsmorefromusintermsofeducationalrequirements,morehightechnologyequipmentorleanersparetimemeans
outsourcingchildcareandchores(AMP.NATSEM2011b).
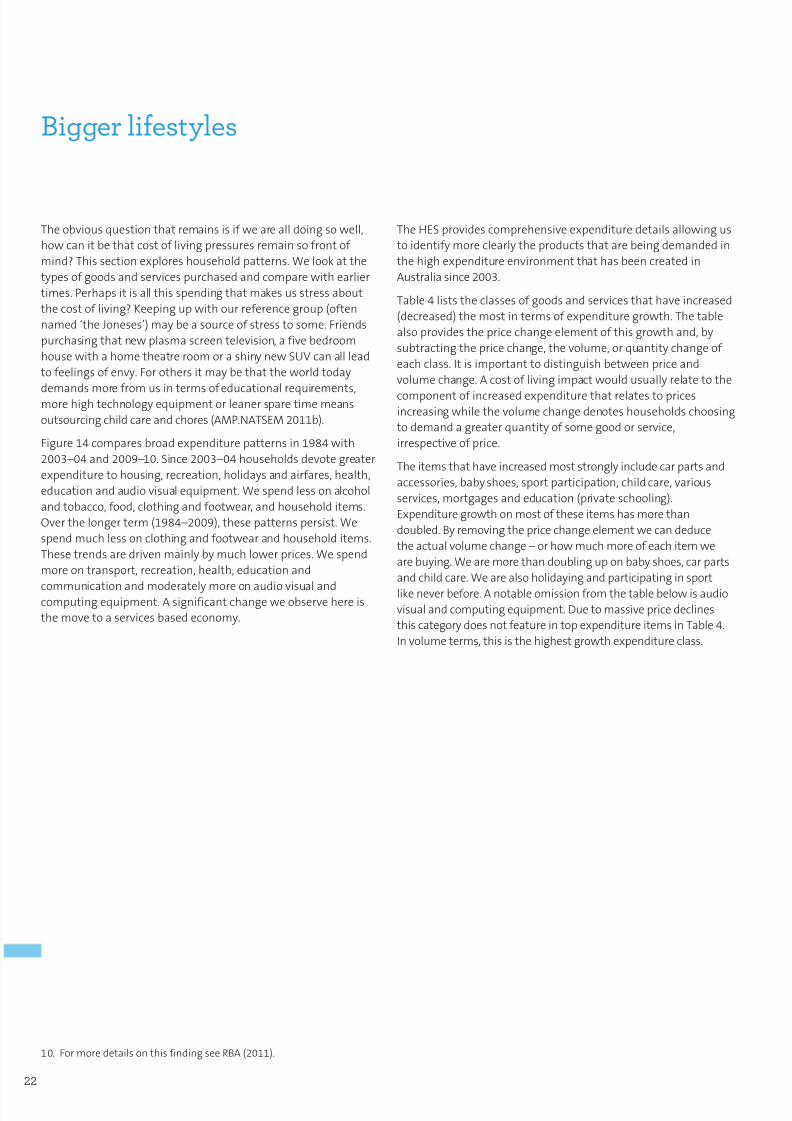
Figure14comparesbroadexpenditurepatternsin1984with
2003–04and2009–10.Since2003–04householdsdevotegreater
expendituretohousing,recreation,holidaysandairfares,health,
educationandaudiovisualequipment.Wespendlessonalcohol
andtobacco,food,clothingandfootwear,andhouseholditems.
Overthelongerterm(1984–2009),thesepatternspersist.We
spendmuchlessonclothingandfootwearandhouseholditems.
Thesetrendsaredrivenmainlybymuchlowerprices.Wespend
moreontransport,recreation,health,educationand
communicationandmoderatelymoreonaudiovisualandcomputingequipment.Asignificantchangeweobservehereis
themovetoaservicesbasedeconomy.
TheHESprovidescomprehensiveexpendituredetailsallowingus
toidentifymoreclearlytheproductsthatarebeingdemandedin
thehighexpenditureenvironmentthathasbeencreatedin
Australiasince2003.
Table4liststheclassesofgoodsandservicesthathaveincreased
(decreased)themostintermsofexpendituregrowth.Thetable
alsoprovidesthepricechangeelementofthisgrowthand,by
subtractingthepricechange,thevolume,orquantitychangeof
eachclass.Itisimportanttodistinguishbetweenpriceand
volumechange.Acostoflivingimpactwouldusuallyrelatetothe
componentofincreasedexpenditurethatrelatestopricesincreasingwhilethevolumechangedenoteshouseholdschoosing
todemandagreaterquantityofsomegoodorservice,
irrespectiveofprice.
Theitemsthathaveincreasedmoststronglyincludecarpartsand
accessories,babyshoes,sportparticipation,childcare,various
services,mortgagesandeducation(privateschooling).
Expendituregrowthonmostoftheseitemshasmorethan
doubled.Byremovingthepricechangeelementwecandeduce
theactualvolumechange–orhowmuchmoreofeachitemwe
arebuying.Wearemorethandoublinguponbabyshoes,carparts
andchildcare.Wearealsoholidayingandparticipatinginsport
likeneverbefore.Anotableomissionfromthetablebelowisaudiovisualandcomputingequipment.Duetomassivepricedeclines
thiscategorydoesnotfeatureintopexpenditureitemsinTable4.
Involumeterms,thisisthehighestgrowthexpenditureclass.
10. FormoredetailsonthisfindingseeRBA(2011).
22
8/2/2019 Prices These Days! The Cost of Living in Australia
http://slidepdf.com/reader/full/prices-these-days-the-cost-of-living-in-australia 25/44
Figure 14 - Expenditure shares (1984, 2003–04, 2009–10), % total expenditure
Utilities
Other
Housing
Food
Clothing and footwear
Alcohol and tobacco
Transport
Recreation
Personal care
Holidays and airfares
Health
Education
Communication
0% 5% 10% 15% 20%
Household contentsand appliances
Audio visual andcomputing
2009–10 2003–04 1984
Source:ABSandHouseholdExpenditureSurveyandNATSEM.
23

8/2/2019 Prices These Days! The Cost of Living in Australia
http://slidepdf.com/reader/full/prices-these-days-the-cost-of-living-in-australia 26/44
Table 4 - Expenditure growth detailed expenditure classes (2003–04 to 2009–10)
% change
Top 15 expenditure classes Expenditure Volume Price
Carparts/accessories 154% 102% 26%
Footwearforbabies 129% 132% -2%
Sportparticipation 123% 75% 28%
Otherservices-cars 122% 59% 40%
Childcare 106% 131% -11%
Otherhouseholdservices 105% 59% 29%
Secondaryeducation 101% 34% 50%
Holidaytravelandaccommodation 91% 73% 11%
Preschool/primaryeducation 79% 28% 40%
Mortgageinterest 75% 22% 43%
Restaurantmeals 68% 35% 25%
Rents 68% 27% 32%
Hair/personalgrooming 61% 32% 22%
Games/toys/hobbies 57% 56% 1%
Pharmaceuticalproducts 57% 37% 15%
Bottom 15 expenditure classes % change
Alterationsandadditions(housing) -29% -52% -48%
Carpetsandotherfloorcoverings -20% -31% 16%
Tools-houseandgarden -9% -14% 6%
Footwearformen -7% -1% -6%
Cars -5% 1% -6%Majorhouseholdappliances 8% 10% -2%
Tobacco 8% -15% 27%
Furniture 11% 7% 4%
Garmentsforbaby/children 11% 13% -1%
Papers/magazines/stationery 14% 1% 12%
Milk 14% -9% 25%
Garmentsformen 14% 16% -1%
Veterinaryservices 17% -6% 25%
Smallhouseholdelectricalappliances 18% 25% -6%
Pork 18% 4% 14%
Source:ABSandNATSEM.
24
8/2/2019 Prices These Days! The Cost of Living in Australia
http://slidepdf.com/reader/full/prices-these-days-the-cost-of-living-in-australia 27/44
Attheotherendofthescalehouseholdsspendlessonaverage,bothinactualdollarsandafterinflation,onandaroundthehousewith
lowerexpenditureonrenovations,carpetsandotherflooringandtools.Wealsospendlessonnewcarpurchasesandhavehadonly
moderatelyincreasedexpenditureonmen’sclothingandfootwear,majorhouseholdappliances,tobacco,milkandfurniture.
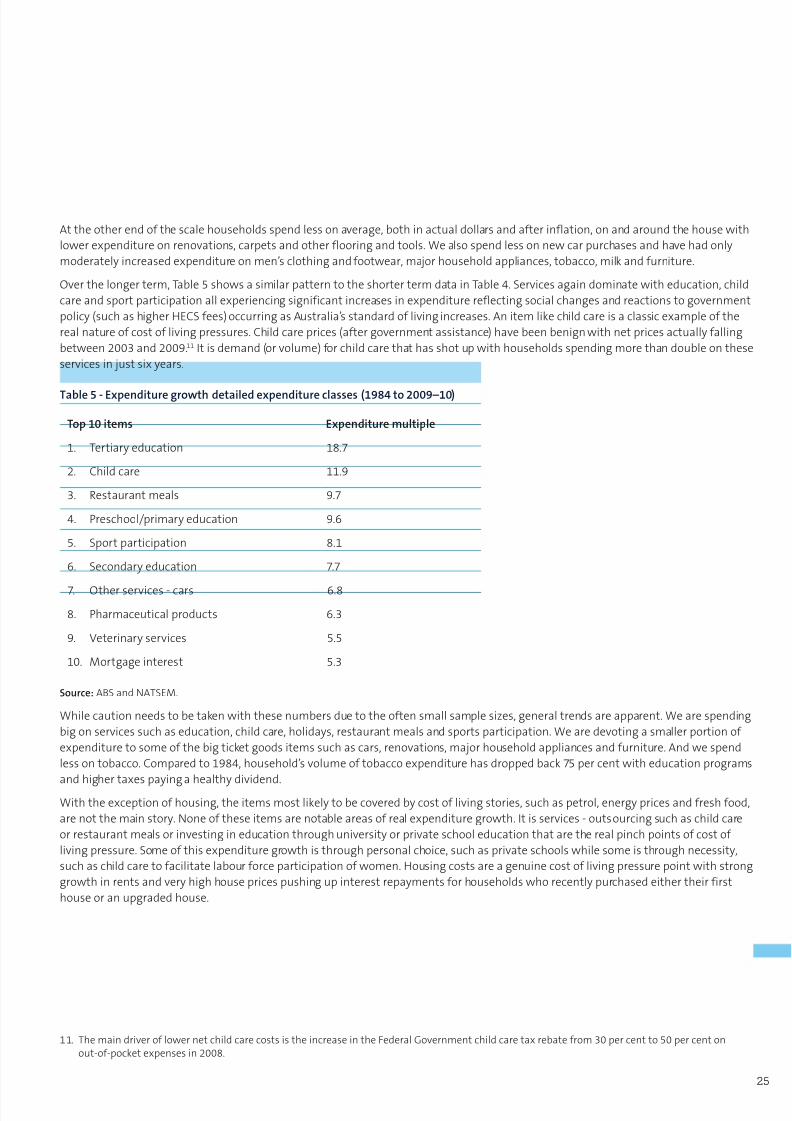
Overthelongerterm,Table5showsasimilarpatterntotheshortertermdatainTable4.Servicesagaindominatewitheducation,child
careandsportparticipationallexperiencingsignificantincreasesinexpenditurereflectingsocialchangesandreactionstogovernment
policy(suchashigherHECSfees)occurringasAustralia’sstandardoflivingincreases.Anitemlikechildcareisaclassicexampleofthe
realnatureofcostoflivingpressures.Childcareprices(aftergovernmentassistance)havebeenbenignwithnetpricesactuallyfalling
between2003and2009.11Itisdemand(orvolume)forchildcarethathasshotupwithhouseholdsspendingmorethandoubleonthese
servicesinjustsixyears.
Table 5 - Expenditure growth detailed expenditure classes (1984 to 2009–10)
Top 10 items Expenditure multiple
1. Tertiaryeducation 18.7
2. Childcare 11.9
3. Restaurantmeals 9.7
4. Preschool/primaryeducation 9.6
5. Sportparticipation 8.1
6. Secondaryeducation 7.7
7. Otherservices-cars 6.8
8. Pharmaceuticalproducts 6.3
9. Veterinaryservices 5.5
10. Mortgageinterest 5.3
Source:ABSandNATSEM.
Whilecautionneedstobetakenwiththesenumbersduetotheoftensmallsamplesizes,generaltrendsareapparent.Wearespending
bigonservicessuchaseducation,childcare,holidays,restaurantmealsandsportsparticipation.Wearedevotingasmallerportionof
expendituretosomeofthebigticketgoodsitemssuchascars,renovations,majorhouseholdappliancesandfurniture.Andwespend
lessontobacco.Comparedto1984,household’svolumeoftobaccoexpenditurehasdroppedback75percentwitheducationprograms
andhighertaxespayingahealthydividend.Withtheexceptionofhousing,theitemsmostlikelytobecoveredbycostoflivingstories,suchaspetrol,energypricesandfreshfood,
arenotthemainstory.Noneoftheseitemsarenotableareasofrealexpendituregrowth.Itisservices-outsourcingsuchaschildcare
orrestaurantmealsorinvestingineducationthroughuniversityorprivateschooleducationthataretherealpinchpointsofcostof
livingpressure.Someofthisexpendituregrowthisthroughpersonalchoice,suchasprivateschoolswhilesomeisthroughnecessity,
suchaschildcaretofacilitatelabourforceparticipationofwomen.Housingcostsareagenuinecostoflivingpressurepointwithstrong
growthinrentsandveryhighhousepricespushingupinterestrepaymentsforhouseholdswhorecentlypurchasedeithertheirfirst
houseoranupgradedhouse.
11. ThemaindriveroflowernetchildcarecostsistheincreaseintheFederalGovernmentchildcaretaxrebatefrom30percentto50percentonout-of-pocketexpensesin2008.
25

8/2/2019 Prices These Days! The Cost of Living in Australia
http://slidepdf.com/reader/full/prices-these-days-the-cost-of-living-in-australia 28/44
TheCPIandLivingCostindexesprovideinformationonthe
changeofpriceswithincities,butdon’tdescribetheactual
pricelevel.
TheABSprovidedacomparisonofpricelevelsinanexperimental
pieceofresearchin2003(ABS2007).Table6updatesthisresearch
byincludingadditionalinformationonhousingcosts(excludedin
theABSwork)andupdatingthepricechangestoDecember2011.
ThetableprovidesthecostofafixedbasketofgoodsforSydney
andcomparesthecostofthatsamebasketineachothercapital
city.Thetablebreaksthesecostsintoexpenditurecategories.Inaggregate,Sydneyisthemostexpensivecapitalcitytolivein,
costingonaverage,$71,426forthestandardbasketofgoods.
Adelaideisthecheapestcapitalcitywheretheaveragehousehold
wouldspend$4,442peryearlessrelativetoSydney.Brisbaneand
Melbournealsorateasconsiderablycheapercitiestoliveinthan
Sydneyspendinglessthan$2,439and$3,228peryearrespectively
oftheirSydneycounterparts.Thevastmajorityofreduced
spendingrelatestorentandmortgagecosts.Beyondthosetwo
elementsthecostsarequitesimilar.TwoexceptionsareBrisbane
andAdelaidewherenon-housingcostsare$1,365and$938per
yearlessthanSydneyrespectively.
OfthestatecapitalsPerthisthesecondmostexpensivecity,however,duetohigherincomesthanotherstatecapitals,Perth
hasthehighestfinancialstandardofliving.Theminingboomhas
nodoubtplayedanimportantroleinboostingtheincomesof
Perthhouseholds.
Thisstandardoflivingstoryisimpactedbydifferingaverage
incomes.WhileSydneyhashighercosts,itisalsolikelythat
incomesaresomewhathigherassistingtomakeupforthe
costdifferential.ThestandardoflivingcomparisoninTable
6comparestheindexofcostandtheindexofincomefor
householdsineachstatecapitalcitytoformafinancialstandard
oflivingcomparison.12Thiscomparisonchangestherankingof
capitalcitiescomparedtothecostIndexwithSydneyranking
aheadofAdelaideandHobart.Canberrahasthehigheststandard
oflivinginAustraliatakingintoaccountbothaveragecostsand
income,followedbyDarwinandthenPerth.Brisbanehasthehigheststandardoflivingofourthreelargestcities.Inspiteof
havingrelativelylowcosts,onceweaccountfortheloweraverage
incomes,Hobarthaseasilythelowestfinancialstandardofliving
ofAustralia’scapitalcities.
Capital city cost of living comparison
12. Boththeindexforcostandincomearebasedonaveragehouseholdsandtakeintoaccounthouseholdsizedifferences.
26

8/2/2019 Prices These Days! The Cost of Living in Australia
http://slidepdf.com/reader/full/prices-these-days-the-cost-of-living-in-australia 29/44
Table 6 - Cost of Sydney ‘basket of goods’ - capital city comparison
December 2011 per annum Sydney Melbourne Bri sbane Ade lai de Perth Hobart Darwin Canberra
Food $11,074 $11,285 $10,745 $10,592 $11,281 $11,515 $12,247 $10,931
Alcoholandtobacco $4,515 $4,626 $4,580 $4,556 $4,981 $5,067 $5,141 $4,758
Clothingandfootwear $2,673 $2,816 $3,040 $2,879 $2,848 $2,910 $2,652 $2,793
Housing
Rent $4,769 $3,598 $4,132 $2,936 $3,628 $2,660 $3,950 $4,981
Electricity $1,166 $1,018 $1,050 $1,077 $846 $946 $794 $963
Otherutilities $801 $872 $890 $793 $820 $722 $712 $881
Otherhousing $2,357 $2,643 $2,271 $2,409 $2,594 $2,447 $2,321 $2,494
Mortgageinterest $4,086 $2,952 $2,860 $2,415 $3,046 $2,087 $4,024 $3,344
Householdcontentsandservices $6,793 $6,493 $6,422 $6,4 44 $6,651 $6,838 $6,136 $6,826
Health $3,559 $3,829 $3,378 $3,734 $3,439 $3,619 $3,582 $3,671
Transportation $9,356 $8,701 $8,633 $8,855 $8,793 $8,557 $8,905 $9,296
Communication $2,362 $2,355 $2,357 $2,339 $2,356 $2,375 $2,375 $2380
Recreation $8,475 $8,412 $8,460 $8,315 $8,355 $8,419 $8,075 $8,442
Education $1,970 $1,961 $1,885 $2,078 $1,988 $1,850 $1,539 $1,668
Financialandinsuranceservices $7,471 $7,425 $7,493 $7,561 $7,603 $7,381 $7,727 $7,598
Total cost $71,426 $68,968 $68,198 $66,983 $69,227 $67,391 $70,178 $71,024
Costindex 1 0.966 0.955 0.938 0.969 0.944 0.983 0.994
Incomeindex 1 0.973 0.994 0.895 1.040 0.829 1.060 1.230
Standardoflivingcomparison 1.000 1.008 1.041 0.954 1.073 0.879 1.079 1.237
2011 comparison with Sydney
Food 212 -329 -482 207 441 1,173 -143
Alcoholandtobacco 111 65 41 466 552 626 243
Clothingandfootwear 143 366 206 174 236 -22 119
Housing
Rent -1,170 -636 -1,832 -1,140 -2,109 -818 212
Electricity -148 -116 -89 -320 -220 -372 -203
Otherutilities 71 90 -7 20 -79 -88 80
Otherhousing 286 -85 52 237 90 -36 138
Mortgageinterest -1,135 -1,227 -1,672 -1,040 -1,999 -63 -743
Householdcontentsandservices -300 -371 -349 -142 45 -657 33
Health 271 -180 175 -120 60 23 112
Transportation -655 -723 -501 -563 -799 -451 -60
Communication -7 -4 -22 -5 14 13 18
Recreation -63 -15 -160 -120 -56 -400 -33
Education -9 -84 108 18 -120 -431 -302
Financialandinsuranceservices -46 22 90 132 -90 256 127
Total -2,439 -3,228 -4,442 -2,198 -4,034 -1,247 -401
Rentandmortgage -2,305 -1,863 -3,504 -2,181 -4,108 -881 -531
Other -135 -1,365 -938 -17 74 -366 129
Source:ABSandNATSEMcalculations.27
8/2/2019 Prices These Days! The Cost of Living in Australia
http://slidepdf.com/reader/full/prices-these-days-the-cost-of-living-in-australia 30/44
International cost of living comparison
Internationalcostoflivingcomparisonsaremoredifficultto
estimatethanacomparisonofAustralianstatecapitals.Large
differencesexistbetweenthequalityofproductsandthetask
ofappropriatelydealingwiththesedifferencesandobtaininga
broadselectionofgoodsthattrulyrepresentthepurchasing
patternsindifferentcountriesisprohibitivelyexpensive.
Comparingafixedbasketofgoodsbetweencountriesalsomakes
littlesenseaswhatisimportantinonecountrymaybeirrelevant
inanother.
Inspiteofthesedifficultiesindexesdoexistthatattemptto
compareinternationalcostsofliving.Forexample,theEconomicIntelligenceUnit(EIU)hasdevelopedanindexthatpricesa
representativebasketofgoodsintermsofasinglecurrency
(EIU2012).
AstheEIUpointsout,thisindexisdesignedforthoseinthe
internationaljobmarkettocomparerelativecostsofliving.The
mostimportantdriverofchangeinthisindexistheexchangerate
ofindividualcountriesasexchangeratesusuallydeviatefarmore
thandomesticprices.ForAustralia,thismeansthatinrecent
yearsasourcurrencyappreciatedourcostoflivingpositioninthe
indexalsoincreased.
SinceAustralianspurchasegoodswithAustraliandollars,thefactthatourdollarhasappreciatedagainstmostcurrenciesdoes
notmeanthatAustralianhouseholdsaredisadvantaged–infact
quitetheopposite.ForanAmericantravellingtoAustraliato
work,theirpurchasingpoweroftheir$USinlocalcurrencyterms
certainlydoesshrink,howevertheircostoflivinginAustralia
alsodeclines.
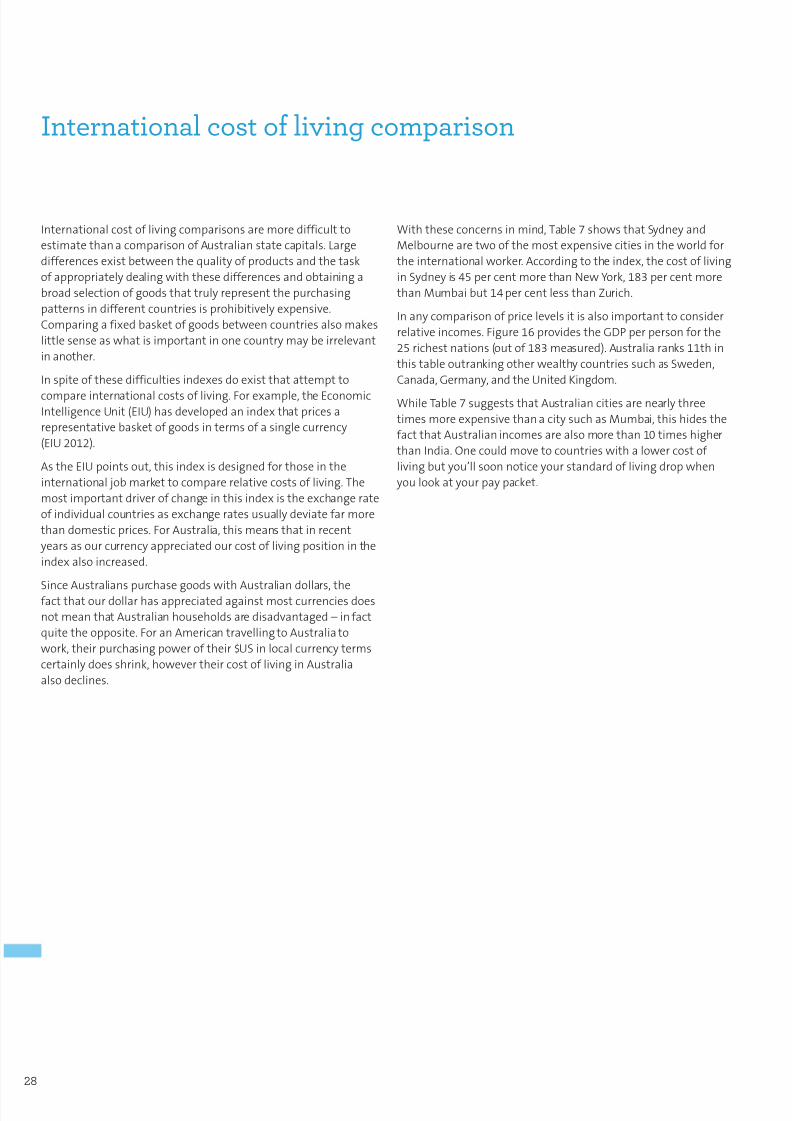
Withtheseconcernsinmind,Table7showsthatSydneyand
Melbournearetwoofthemostexpensivecitiesintheworldfor
theinternationalworker.Accordingtotheindex,thecostofliving
inSydneyis45percentmorethanNewYork,183percentmore
thanMumbaibut14percentlessthanZurich.
Inanycomparisonofpricelevelsitisalsoimportanttoconsider
relativeincomes.Figure16providestheGDPperpersonforthe
25richestnations(outof183measured).Australiaranks11thin
thistableoutrankingotherwealthycountriessuchasSweden,
Canada,Germany,andtheUnitedKingdom.
WhileTable7suggeststhatAustraliancitiesarenearlythree
timesmoreexpensivethanacitysuchasMumbai,thishidesthe
factthatAustralianincomesarealsomorethan10timeshigher
thanIndia.Onecouldmovetocountrieswithalowercostof
livingbutyou’llsoonnoticeyourstandardoflivingdropwhen
youlookatyourpaypacket.
28

8/2/2019 Prices These Days! The Cost of Living in Australia
http://slidepdf.com/reader/full/prices-these-days-the-cost-of-living-in-australia 31/44
Table 7 - Cost of living international city comparison
Top 10 most expensive cities
Rank Country City Index (New York=100)
1 Switzerland Zurich 170 1
2 Japan Tokyo 166 2
3 Switzerland Geneva 157 =3
4 Japan Osaka,Kobe 157 =3
5 Norway Oslo 156 5
6 France Paris 150 6
7 Australia Sydney 147 7
8 Australia Melbourne 145 8
9 Singapore Singapore 142 9
10 Germany Frankfurt 137 10
Top 10 least expensive cities
1 Amman Muscat 63 120=
2 Bangladesh Dhaka 61 123
3 Algeria Algiers 59 124
4 Nepal Kathmandu 58 125=
5 Panama PanamaCity 58 125=
6 SaudiArabia Jeddah 57 127
7 India NewDelhi 56 128
8 Iran Tehran 54 129
9 India Mumbai 52 13010 Pakistan Karachi 46 131
Source:EconomicIntelligenceUnit2012.
29

8/2/2019 Prices These Days! The Cost of Living in Australia
http://slidepdf.com/reader/full/prices-these-days-the-cost-of-living-in-australia 32/44
Figure 16 - Top 25 (out of 183) GDP per capita countries, IMF (2011), $ per year
Korea, South
Japan
France
United Kingdom
Finland
Belgium
Denmark
Taiwan
Germany
Iceland
Ireland
Canada
Sweden
Kuwait
Australia
Austria
Netherlands
Switzerland
United States
United Arab Emirates
Hong Kong
Brunei
Norway
Singapore
Luxembourg
Qatar
0 20,000 60,000 80,000 100,000 120,00040,000
Source:InternationalMonetaryFund-WorldEconomicOutlookDatabase,September2011.
GDPmeasuresaregenerallyconsideredtocorrelatewellwithacountry’sstandardofliving.ThedrawbackofGDPmeasuresarethat
theytakeanarroweconomicperspectiveanddonotnecessarilytakeintoaccountotherimportantmeasuresofstandardoflivingsuch
aseducationlevels,qualityoflife,lifeexpectancyandinequality.
TheHumanDevelopmentIndexdevelopedbyTheUnitedNationshelpstoovercometheseproblemsbyincludingsuchmeasures
(UnitedNations2011).WiththisindexAustraliaperformsparticularlywellrankingsecondoutofthe188countriesmeasured.Only
resource-richNorwayoutranksAustralia.13
Whileourpricesarehigherthanmostothernations,ourincomesandgeneralstandardoflivingareexceptionallyhigh.
13. AustraliarankssecondonboththerawHDIandtheinequality-adjustedHDI.
30

8/2/2019 Prices These Days! The Cost of Living in Australia
http://slidepdf.com/reader/full/prices-these-days-the-cost-of-living-in-australia 33/44
Conclusion
Costoflivingpressuresdominatepoliticaldebate.However,theevidenceofhouseholdbudgetsexaminedinthisreportshowsthatthepressuresarelesstodowiththepoliticallysensitivepricesofpetrol,energyorfreshfruitandmoretodowithchangesinourspendinghabitsandexpectationsandoutsourcingtothe
servicesindustry.
Inspiteofcostoflivingpressures,priceinflationinAustraliaandlivingcostsappeartoberelativelybenignandhavebeenforthepasttwodecades.WithincomesrisingmoresharplythanlivingcostsAustralianfamilieshaveahigherstandardofliving.The
averagefamilyisaheadby$224perweekandthisgrowthinaverageincomeshasbeenspreadacrossallendsoftheincomeandsocio-economicspectrum.
Householdsarespendingmoremoneyondiscretionary
expenditureandwefindthatevenlowincomeandpensionerhouseholdsspendoneinthreedollarsondiscretionaryitems.Theproportionofhouseholdexpenditureonthebasicessentialsofliferemainvirtuallyunchangedsince1984ataround38percentofhouseholdbudgets,approaching50percentforlowerincomehouseholds.
Thestabilityofexpensesorlivingcostsover-timeuncoveredinthisreportareconsistentlydemonstratedinspiteofsomeitems
experiencingstrongpriceinflationsuchashealth,tobaccoandeducation.Otheritemscompensatewithmuchlowerornegativepriceinflation,suchasaudiovisualandcomputingequipmentandclothingandfootwear.
Indexesdevelopedspecificallyformeasuringthelivingcostsfordifferenthouseholdtypesshowthatalmostwithoutexception,regardlessofthetypeorsocio-economicpositionofhouseholds,incomeshavegrownwellbeyondlivingcosts.
Australianhouseholdsnowdevoteagreatershareofexpendituretoservicesanditemsofadiscretionarynaturethaninthepast.Someofthisexpenditurerepresentsaspirationalpurchasessuchasprivateeducationandhighereducation,somerelateto
expenditureonservicesthatweremorecommonlyperformedin-housesuchaschildcareorfoodpreparation.
Housingisoneareaofnecessaryexpenditurewherepriceshaveimpactedonthecostofliving,butevenheretherearedistinctionsbetweendifferentgroups.Thosewithrecent
mortgagesorwhorentarepayingamuchhigherpricethanindecadespast.
Ifyouwanttoescapethesesocalledcostoflivingpressures,AdelaideandHobartaretheleastexpensiveoptions,butaverageincomesarealsomuchlowerhere.VeryhighhousingcostsmeanthatSydney,inspiteofhigherincomes,hasalowerfinancialstandardoflivingthanotherlargecapitalcities.Canberraoffers
thebestfinancialstandardoflivinginAustraliawithincomes23percenthigherthanSydneybutwithacomparablepricelevel.
Thecarbonpriceisnotexpectedtoalterthecostoflivingpicturewithpriceincreasesmetwithcompensationintheformofreducedincometaxandhighergovernmentpayments
adequatelycompensatinglowandmiddleincomefamilies–thefamiliesmostatriskofcostoflivingpressures.
Onaglobalcomparisonofarepresentativebasketofgoodsandservices,Australiancitiesrankamongthemostexpensive.The
strongAustraliandollarinrecentyearshasmadeAustraliaamoreexpensivedestinationforinternationaltravellersandworkersbutthisdoesnottranslatetoAustraliancitizenspaidinAustraliandollars.Australiaremainsoneoftherichestnationsandenjoysastandardoflivinghigherthanmostoftheworld.
Costoflivingpressuresareperhapsafactoflifeformanyhouseholdsbuttheyaren’tprimarilysourcedfrompetrolpricesorelectricitybillsorthepriceofbananas.Infact,theymostly
donotrelateto‘pricesthesedays’atall.Instead,theyrelatetohouseholdshavinglargerincomesandspendingmoremoneyonawholerangeofnewgoodsand,inparticular,servicesthatareeitheraspirationalinnatureornecessaryindealingwiththedemandsofamodernsociety.
FocussingpolicyonanarrowcostoflivingdebatearoundthepriceofelectricityorpetrolmissestherealpressurepointsfacingAustralianhouseholdssuchaswork/lifebalanceandtakes
thespotlightoffothermorepressingmattersthatwillactuallyhelptomaintainAustralia’senviablestandardoflivingforyearstocome.
31
8/2/2019 Prices These Days! The Cost of Living in Australia
http://slidepdf.com/reader/full/prices-these-days-the-cost-of-living-in-australia 34/44
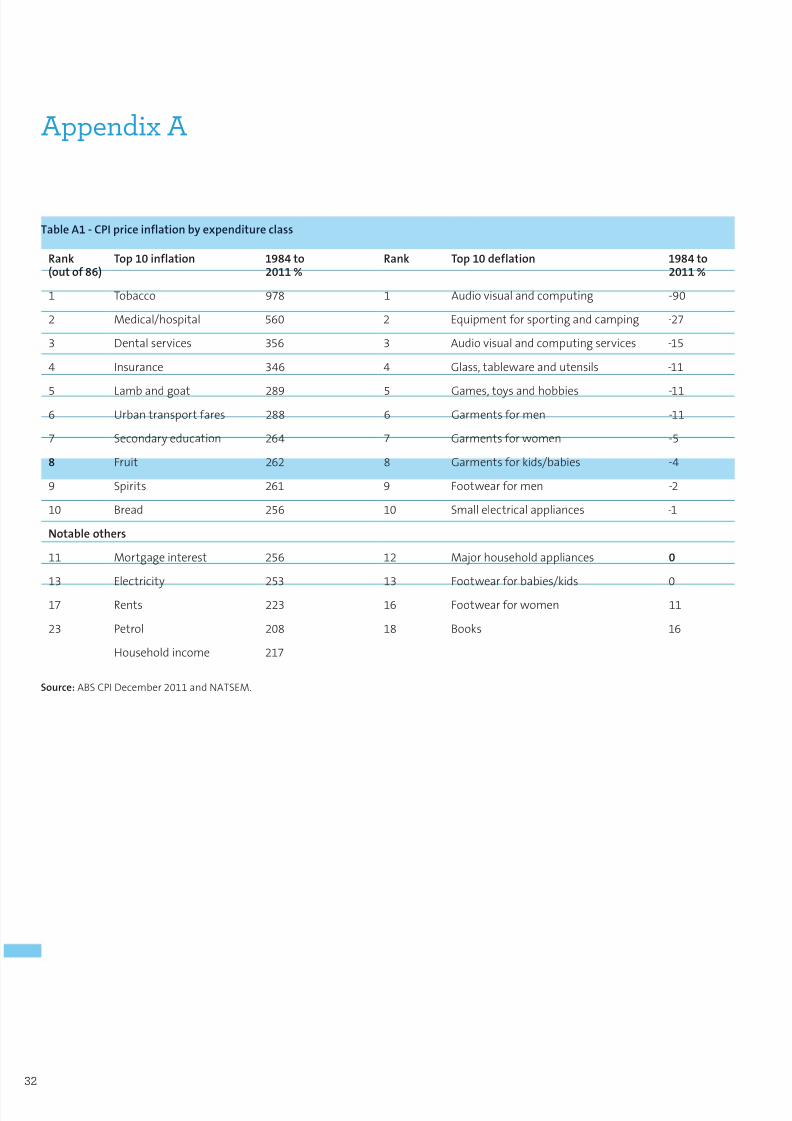
Table A1 - CPI price inflation by expenditure class
Rank(out of 86)
Top 10 inflation 1984 to2011 %
Rank Top 10 deflation 1984 to2011 %
1 Tobacco 978 1 Audiovisualandcomputing -90
2 Medical/hospital 560 2 Equipmentforsportingandcamping -27
3 Dentalservices 356 3 Audiovisualandcomputingservices -15
4 Insurance 346 4 Glass,tablewareandutensils -11
5 Lambandgoat 289 5 Games,toysandhobbies -11
6 Urbantransportfares 288 6 Garmentsformen -11
7 Secondaryeducation 264 7 Garmentsforwomen -5
8 Fruit 262 8 Garmentsforkids/babies -4
9 Spirits 261 9 Footwearformen -2
10 Bread 256 10 Smallelectricalappliances -1
Notable others
11 Mortgageinterest 256 12 Majorhouseholdappliances 0
13 Electricity 253 13 Footwearforbabies/kids 0
17 Rents 223 16 Footwearforwomen 11
23 Petrol 208 18 Books 16
Householdincome 217
Source:ABSCPIDecember2011andNATSEM.
Appendix A
32

8/2/2019 Prices These Days! The Cost of Living in Australia
http://slidepdf.com/reader/full/prices-these-days-the-cost-of-living-in-australia 35/44
Table B1 - Discretionary and necessary expenditure shares %
Outright owner Purchaser Renter Other All
Discretionary
1984 39.5 36.4 36.5 44.0 37.7
1988 42.1 37.4 38.5 41.3 39.7
1993 43.1 39.2 38.7 47.7 40.8
1998 41.3 36.3 32.7 40.3 37.2
2003 40.2 40.3 31.5 38.1 38.0
2009 43.1 43.1 32.3 42.3 40.1
Basic necessity
1984 38.2 32.2 42.9 29.8 36.7
1988 36.4 31.8 40.7 37.4 35.6
1993 35.2 31.0 40.6 30.6 35.1
1998 36.6 32.2 47.4 33.8 37.6
2003 38.2 35.4 47.8 35.3 39.4
2009 36.9 33.1 47.3 35.0 38.1
Relative necessity
1984 22.3 31.5 20.7 26.2 25.6
1988 21.5 30.8 20.9 21.3 24.8
1993 21.7 29.8 20.6 21.6 24.1
1998 22.1 31.5 19.9 25.9 25.1
2003 21.7 24.2 20.8 26.6 22.6
2009 20.0 23.8 23.8 22.4 21.8
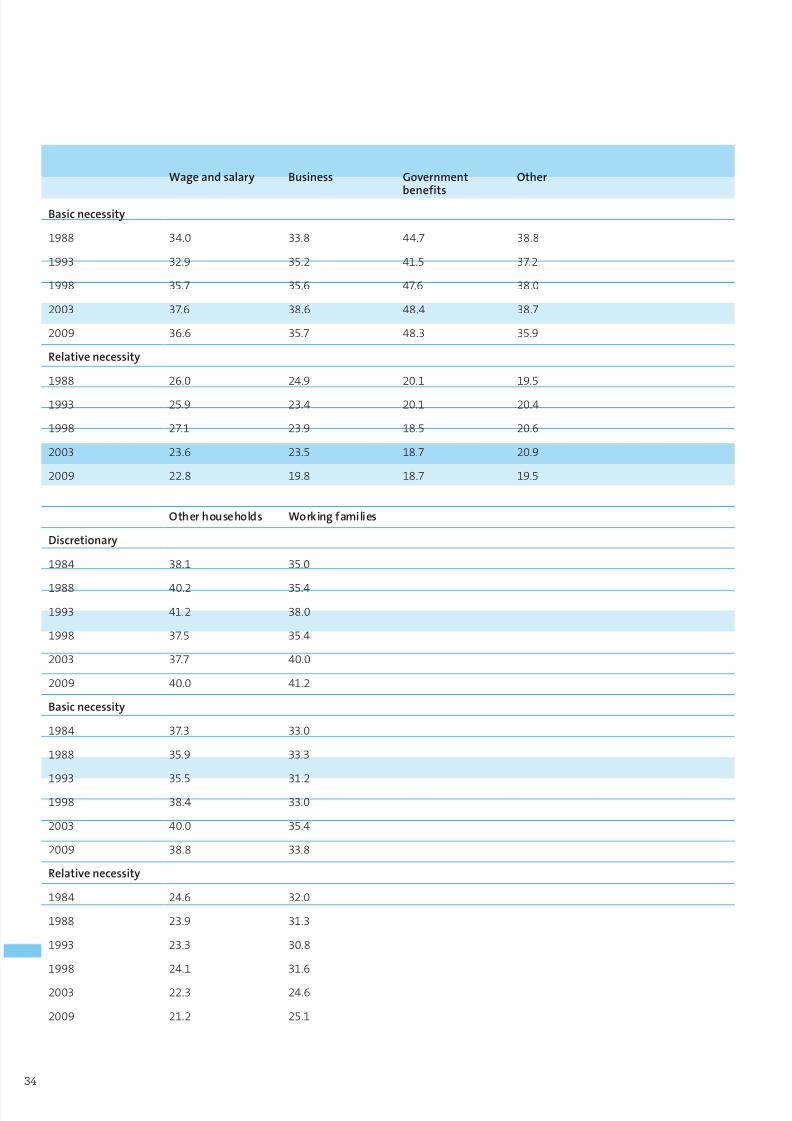
Wage and salary Business Governmentbenefits
Other
Discretionary
1988 40.1 41.4 35.2 41.7
1993 41.2 41.4 38.4 42.4
1998 37.2 40.5 33.9 41.4
2003 38.8 38.0 32.8 40.5
2009 40.6 44.6 32.9 44.6
Appendix B
33
8/2/2019 Prices These Days! The Cost of Living in Australia
http://slidepdf.com/reader/full/prices-these-days-the-cost-of-living-in-australia 36/44
Wage and salary Business Government
benefits
Other
Basic necessity
1988 34.0 33.8 44.7 38.8
1993 32.9 35.2 41.5 37.2
1998 35.7 35.6 47.6 38.0
2003 37.6 38.6 48.4 38.7
2009 36.6 35.7 48.3 35.9
Relative necessity
1988 26.0 24.9 20.1 19.5
1993 25.9 23.4 20.1 20.4
1998 27.1 23.9 18.5 20.6
2003 23.6 23.5 18.7 20.9
2009 22.8 19.8 18.7 19.5
Other households Working families
Discretionary
1984 38.1 35.0
1988 40.2 35.4
1993 41.2 38.0
1998 37.5 35.4
2003 37.7 40.0
2009 40.0 41.2
Basic necessity
1984 37.3 33.0
1988 35.9 33.3
1993 35.5 31.2
1998 38.4 33.0
2003 40.0 35.4
2009 38.8 33.8
Relative necessity
1984 24.6 32.0
1988 23.9 31.3
1993 23.3 30.8
1998 24.1 31.6
2003 22.3 24.6
2009 21.2 25.1
34
8/2/2019 Prices These Days! The Cost of Living in Australia
http://slidepdf.com/reader/full/prices-these-days-the-cost-of-living-in-australia 37/44
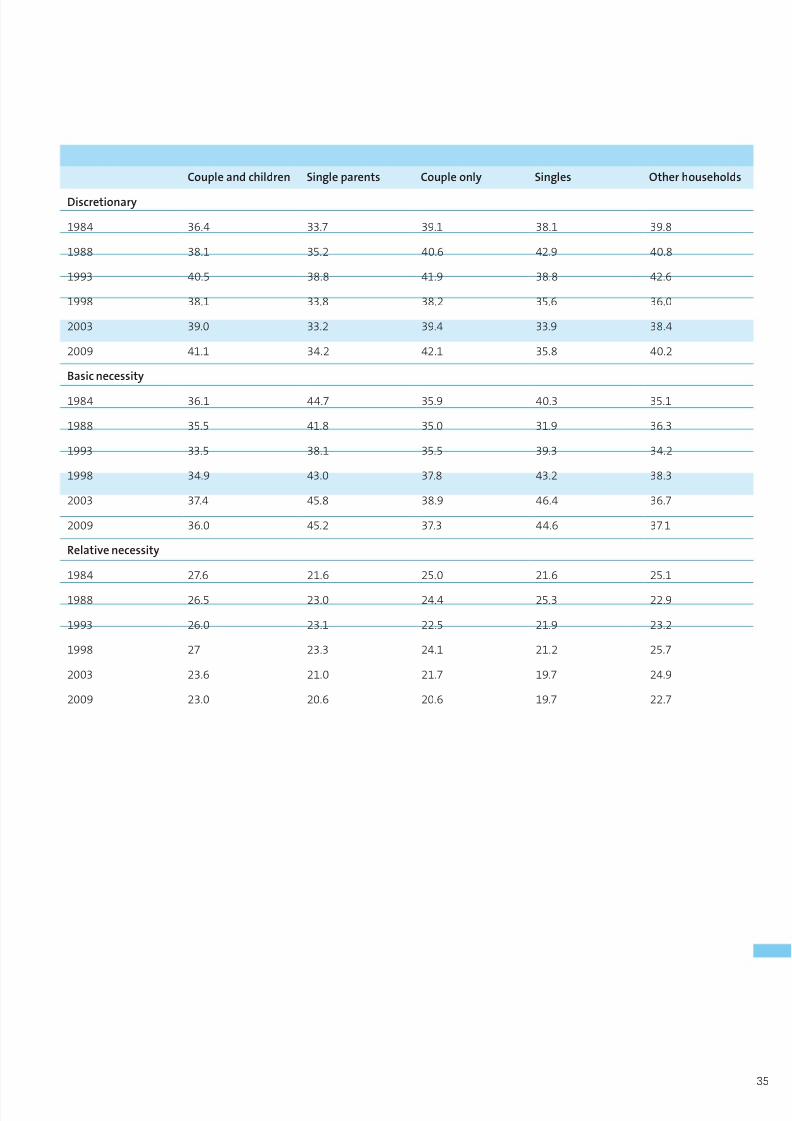
Couple and children Single parents Couple only Singles Other households
Discretionary
1984 36.4 33.7 39.1 38.1 39.8
1988 38.1 35.2 40.6 42.9 40.8
1993 40.5 38.8 41.9 38.8 42.6
1998 38.1 33.8 38.2 35.6 36.0
2003 39.0 33.2 39.4 33.9 38.4
2009 41.1 34.2 42.1 35.8 40.2
Basic necessity
1984 36.1 44.7 35.9 40.3 35.1
1988 35.5 41.8 35.0 31.9 36.3
1993 33.5 38.1 35.5 39.3 34.2
1998 34.9 43.0 37.8 43.2 38.3
2003 37.4 45.8 38.9 46.4 36.7
2009 36.0 45.2 37.3 44.6 37.1
Relative necessity
1984 27.6 21.6 25.0 21.6 25.1
1988 26.5 23.0 24.4 25.3 22.9
1993 26.0 23.1 22.5 21.9 23.2
1998 27 23.3 24.1 21.2 25.7
2003 23.6 21.0 21.7 19.7 24.9
2009 23.0 20.6 20.6 19.7 22.7
35
8/2/2019 Prices These Days! The Cost of Living in Australia
http://slidepdf.com/reader/full/prices-these-days-the-cost-of-living-in-australia 38/44
Quintile 1 (low) Quintile 2 Quintile 3 Quintile 4 Quintile 5 (high)
Discretionary
1984 31.3 35.4 36.6 39.3 40.6
1988 35.3 37.3 38.3 39.7 43.6
1993 37.9 37.9 39.2 42.2 43.6
1998 34.4 34.7 36.6 37.7 39.5
2003 31.9 35.9 37.1 38.2 41.92009 33.5 36.3 39.6 40.5 44.6
Basic necessity
1984 46.4 40.2 37.0 34.3 33.2
1988 43.1 38.5 36.6 33.9 31.7
1993 40.2 39.8 36.0 33.0 31.8
1998 45.3 42.7 38.0 35.9 33.5
2003 47.9 43.3 39.3 37.7 35.5
2009 47.0 42.9 38.9 36.6 33.1
Relative necessity
1984 22.2 24.4 26.5 26.4 26.2
1988 21.6 24.2 25.1 26.4 24.6
1993 22.0 22.3 24.8 24.8 24.9
1998 20.3 22.6 25.4 26.4 27.0
2003 20.2 20.7 23.6 24.1 22.6
2009 19.4 20.8 21.5 23.0 22.3
Source:ABSHouseholdExpenditureSurveyandNATSEM.
36
8/2/2019 Prices These Days! The Cost of Living in Australia
http://slidepdf.com/reader/full/prices-these-days-the-cost-of-living-in-australia 39/44
Technical notes
DataABS Survey Data
MuchofthedatainthisreportcomesfromtheAustralianBureau
ofStatistics(ABS)HouseholdExpenditureSurvey.Thissurveyis
performedbytheABSabouteveryfiveyears.Thesurveyhasa
surveysamplesizeofbetween5,000and10,000households
dependinguponthesurveyyearchosen.Thesurveyyearsinthis
reportrangefrom1984to2009–10.
Thedetailofexpenditureclassificationsallowsaround600
differentclasses(commoditycodes)ineachsurvey.Theclassificationsaresubjecttominoralterationsfrombetween
surveys.NATSEMhasusedABSconcordancestomatchtheclasses
asaccuratelyaspossible.NATSEMaggregatedthecommodity
codestotheABSCPIexpenditureclassusinganABSconcordance
andaddedclasseswherenomatchingwaspossible–forexample,
thereisnoABSexpenditureclassformortgageinterest
repaymentsassuchexpenditureisnotincludedintheCPI.
Living Cost Index
TheLivingCostIndexwasdevelopedinbroadlythesamemanner
astheABSLivingCostIndex.Foreachhouseholdtypewe
calculatetheimportance(expenditureshares)ofeachABSexpenditureclass(asdefinedbytheABSCPI)throughtimeusing
therelevantABSHouseholdExpenditureSurvey.Weapplythe
knownCPIpricemovementsatanationallevelforeachofthese
expenditureclassesusingtheexpendituresharesasweights.The
maindifferencebetweentheCPIandtheLivingCostIndexisthe
removaloftheexpenditureclass‘housepurchase’andthe
inclusionofmortgageinterestpaymentsonowneroccupier
housing.Tomeasurepricechangeinthiscomponentweusedthe
growthinrepaymentsrequiredfortheaveragehousingloanin
AustraliaasmeasuredbytheABS’HousingFinancepublication.
TheinterestrepaymentusedtheRBA’sstandardvariableloan
interestrateandaonepercentperannumfactorwasappliedto
accountforqualitychangeinthestockofhousing.
ABS CPI Data
TheABSConsumerPriceIndex(CPI)showshowconsumerprices
havechangedforafixedbasketofgoodsandservicessince1948.
TheABSproducestheCPIeverythreemonthsandcompilesthe
indexusingaround100,000priceobservationscollectedincapital
citiesaroundthecountryeachquarter.TheABSaveragesthese
pricechangestakingintoaccounttherelativeimportanceofeach
iteminthe‘average’Australianhousehold’sbudget.Greatcareis
takentoremovetheimpactsofqualityorvolumechange.This
qualitychangeinvolvescheckingeachsampleditemforchanges
fromthepreviousquarterlypriceobservationforfactorssuchassize,weightormorecomplexfeaturessuchasmemoryorspeed
ofacomputer.ForamoredetailedexplanationoftheABS
publicationConsumer Price Index (ABS2011b).
TheABS’CPIhasaknownupwardbiasthatiscausedbytheABS
onlyupdatingtherelativeimportanceofitemsinthebasketof
goodsroughlyeveryfiveyears.CycloneYasiontheNorthCoastof
Queenslandprovidesthebestrecentexample.Bananaprices
increasedwildlyfromanormalpriceofaround$3akilogramto
$15akilogram.TheABSCPIassumesthatpeoplearestillbuying
thenormalquantitiesofbananasasprescribedintheABSbasket
ofgoods.Ofcourse,peoplesensiblystopbuyingbananasand
switchtoanotherfruitsuchasapples.So,sincetheABShasnoinformationonthedeclineinbananasalestheirCPIoverstates
therealimpactofgoodsandservicesthatincreaseinprice
relativetoothergoods.
Equivalised Income
Throughoutthereportthehouseholdincomemeasureused
removesthehouseholdsize–thisisoftencalledequivalising
income.NATSEMusestheOECDmodifiedmethodwhichdivides
householdincomebyanequivalisingfactorsuchthatthefirst
adultreceivesaweightofone,subsequentadultsaweightof
0.5andchildrenunder15aweightof0.3.Equivalisedincomeis
considered‘equivalent’toalonepersonhouseholdincome.
37
8/2/2019 Prices These Days! The Cost of Living in Australia
http://slidepdf.com/reader/full/prices-these-days-the-cost-of-living-in-australia 40/44
References
AustralianPetroleumStatistics,DepartmentofResources,
Energy&Tourism.
ABS(1984)HouseholdExpenditureSurvey1984,6531.0.
ABS(1989)HouseholdExpenditureSurvey1988–89,6531.0.
ABS(1995)HouseholdExpenditureSurvey1993–94,Second
Edition,6531.0.
ABS(1999)HouseholdExpenditureSurvey1998–99,6531.0.
ABS(2004)HouseholdExpenditureSurvey2003–04,6531.0.
ABS(2010)HouseholdExpenditureSurvey2009–10,6531.0.
ABS(2007)ComparingLivingCostsinAustralianCapitalCities,
ResearchPaper.
ABS(2010)Outcomeofthe16thSeriesAustralianConsumerPrice
IndexReview,Dec2010.
ABS(2011a).Cat6463.0-AnalyticalLivingCostIndexesfor
SelectedAustralianHouseholdTypes,Dec2011.
ABS(2011b).Cat.6401.0.ConsumerPriceIndex,December2011.
ABS(2011c).Cat.5206.0.AustralianNationalAccounts,
December2011.
AMP-NATSEM(2011a)TheGreatAustralianDream:JustaDream?
AMP-NATSEMReport29.
AMP-NATSEM(2011b)RaceAgainstTime–HowAustralian’s
SpendTheirTime,AMP-NATSEMReport30.
EconomicIntelligenceUnit(2012)WorldwideCostofLiving2012:
Whichcityisthemostexpensivetolivein?Whichcityisthe
cheapest?
IMF(2011)WorldEconomicOutlookDatabase,September2011.
PhillipsB....2011.CarbonTaxAnalysis,NATSEM,University
ofCanberra.
RBA(2011)InsightsfromthehouseholdExpenditureSurvey.
SouthAustraliaCouncilOfSocialService(2012)CostofLiving
Update,February2012.
UnitedNations(2011),HumanDevelopmentReport.
Recent AMP.NATSEM Income and Wealth Reports
– BabyBoomers-Doingitforthemselves(March2007)
– GenerationwhY?(July2007)
– HoneyIcalculatedthekids...it’s$537,000-Australianchild
costsin2007(December2007)
– WhereverIlaymydebt,that’smyhome-Trendsinhousing
affordabilityandhousingstress1995–1996to2005–2006
(March2008)
– AdvanceAustraliaFair?-Trendsinsmallareasocio-economic
inequality2001–2006(July2008)
– Whatpricetheclevercountry?ThecostoftertiaryeducationinAustralia(November2008)
– Sheworkshardforthemoney-Australianwomenandthe
genderdivide(April2009)
– Healthy,wealthyandwise?-Therelationshipbetweenhealth,
employmentandearningsinAustralia(July2009)
– Don’tstopthinkingabouttomorrow-Thechangingface
ofretirement–thepast,thepresentandthefuture
(November2009)
– SavingTomorrow–Thesavingandspendingpatternsof
Australians(April2010)
– ThePursuitofHappiness(July2010)
– CallingAustraliaHome(November2010)
– LittleAustralians.DifferencesinEarlyChildhoodDevelopment
(April2011)
– TheGreatAustralianDream-JustaDream?(July2011)
– Raceagainsttime:HowAustraliansspendtheirtime
(November2011).
Alltheabovereportsareavailablefrom
www.amp.com.au/ampnatsemreports
38
8/2/2019 Prices These Days! The Cost of Living in Australia
http://slidepdf.com/reader/full/prices-these-days-the-cost-of-living-in-australia 41/44
Thispagehasbeenleftblankintentionally.

8/2/2019 Prices These Days! The Cost of Living in Australia
http://slidepdf.com/reader/full/prices-these-days-the-cost-of-living-in-australia 42/44

8/2/2019 Prices These Days! The Cost of Living in Australia
http://slidepdf.com/reader/full/prices-these-days-the-cost-of-living-in-australia 43/44
This report was written by Ben Phillips from the National Centre for Social and Economic Modelling (NATSEM) atthe University of Canberra and published by AMP. This report contains general information only and although theinformation was obtained from sources considered to be reliable, the author, NATSEM and AMP do not guarantee that it
is accurate or complete. Therefore, readers should not rely upon this information for any purpose including when makingany investment decision. Except where liability under any statute cannot be excluded, NATSEM, AMP and their advisers,employees and officers do not accept any liability (where under contract, tort or otherwise) for any resulting loss ordamage suffered by the reader or by any other person.Suggested citation: Phillips B, Li, J, Taylor, M (2012), Prices these days! The cost of living in Australia.AMP.NATSEM Income and Wealth Report, Issue 31, May 2012, Sydney, AMP.

8/2/2019 Prices These Days! The Cost of Living in Australia
http://slidepdf.com/reader/full/prices-these-days-the-cost-of-living-in-australia 44/44