PRICE TRENDS IN KARNATAKA 2013des.kar.nic.in/docs/prices/2013-PTK.pdf · ii PREFACE . rices...
56
PRICE TRENDS IN KARNATAKA 2013 Directorate of Economics & Statistics Bangalore
Transcript of PRICE TRENDS IN KARNATAKA 2013des.kar.nic.in/docs/prices/2013-PTK.pdf · ii PREFACE . rices...

PRICE TRENDS IN KARNATAKA 2013
Directorate of Economics & Statistics Bangalore


Government of Karnataka
PRICE TRENDS IN KARNATAKA 2013
Directorate of Economics & Statistics Bangalore
2014
No. DES 02 of 2014


ii
PREFACE
rices continue to be a cause of concern to the economy of a country
where the inflation rate is showing an upward trend. In order to have
a more closer and comprehensive idea of the price behavior, it is felt
necessary to trace the price movements at different intervals of time to access the
trends in Karnataka, in particular and the country as a whole notwithstanding the
variations in respect of certain specific commodities/groups.
For this, the prices of selected commodities are being collected on weekly,
fortnightly, monthly basis from selected markets and shops of the districts,
depending on the requirements by the Directorate. Index numbers are also being
generated based on this data. Several types of indices are being worked out by the
department to arrive at the price trends in the State.
The Directorate had decided to bring out “PRICE TRENDS IN KARNATAKA
- 2013” annually, from this year onwards. Earlier, this was being published once in
every five years. This publication has been prepared by the Prices Section of the
Directorate of Economics & Statistics.
I wish to place on record, their best efforts in processing the data, computing
the index and bringing out this publication as was desired. I hope this publication will
be of use to all those who are interested in “price statistics”.
I look forward suggestions for further improvement of this publication.
Place : Bangalore Date : 06.06.2014
(K.Lakshmipathy)
Director
P


iii
Sl. No
Particulars Page No
1 Introduction ... 1
2 Measurement of Fluctuations in Prices ... 2
3 Price Collection System in Karnataka ... 3
4 Price Trends
i. Wholesale Prices of Agricultural Commodities ... 4
ii. Retail Prices of Agricultural Commodities ... 7
iii. Wholesale Price Index Numbers of Agricultural Commodities
... 10
iv. (a) Farm Harvest Prices of Agricultural Commodities ... 18
(b) Farm Harvest Price Index Numbers of Agricultural Commodities ... 20
v. Consumer Price Index (CPI) Numbers
a) Industrial Workers ... 23
b) Agricultural Labourers ... 27
vi. Rural Retail Price Index Numbers ... 29
vii. Urban Retail Price Index Numbers ... 32
viii. Annexures ... A1 – A7
CONTENTS


f
1. INTRODUCTION
Prices play a very significant role in the economic development of a Country or State.
Prices affect both producers and consumers significantly. A rise in prices would upset all
developmental activities and also affect an individual’s household budget. Thus price
movement affects different sections of the population in different ways. Slow and steady
rise in prices is a must for healthy & progressive growth of the country. Whereas the
sudden rise or fall in the prices is bound to have an adverse effect on the whole economy.
The spurt in the prices or the movement of prices with a high acceleration is termed as high
inflation. Abnormal behavior of prices especially in case of food articles, causes a great
concern to administrators and public. The price rise is characterised by rising deficits, high
growth in money supply, depreciating rupee, nominal rates lagging behind real interest
rates and an abysmally low growth of employment.
The mechanism of prices is basically a function of supply and demand. In practical
terms, it therefore depends upon the Gross National Product (GNP) & money supply. The
purchasing power of money varies inversely with the price level. Price is often termed as a
Barometer of real purchasing power of the community. The changes in prices, both in
absolute and relative terms influence a wide range of economic activities and a constant
watch on prices becomes necessary for the operation and regulation of current economic
policies as well as for the purposes of planning and policy formulation. A rise in the price
level means a reduction in the purchasing power of money. Inflation may be caused due to
an excess demand over short supply of the commodities, pumping of more money in the
economy, unwise import/export policies, unsound taxation policies, natural calamities, war,
adverse seasonal conditions etc.
The State implements the policies formulated by the National level. The steps are
taken to ensure stability and to control prices of essential commodities to protect interest of
both consumer and producer, by adopting the procedure of procuring coarse grain from the
farmer at minimum supporting prices fixed by the Government of India, on the other side
the public distribution system was introduced to protect the poorer section of the society.
However the State Governments play a limited role in the matter of controlling prices.
PRICE TRENDS IN KARNATAKA 2013
Price Trends in Karnataka - 2013 Page 1

Apart from having a regressive impact on the standard of living of the people, the price rise
also affects the export targets. Thus, the high inflationary pressure would not only erode the
support for the economic restructuring programme but would also put on a squeeze on the
purchasing power of the poor, thereby further limiting the growth of the home market.
2. MEASUREMENT OF FLUCTUATIONS IN PRICES
Variation in prices are measured by different methods. Among them, two methods
which are extensively used at all-India level are known as “Wholesale Price Index Numbers”
and “Consumer Price Index Numbers”. But none of these two methods cover the entire
range of the economy. The Wholesale Price Index at the national level is based on weekly
price collection of data covering as many as 676 commodities with 5482 quotations. This
index does not cover the services which account for about one third of the Gross National
Product.
A number of CPI series have been available in the Country from time to time because
of the constant need felt for proper wage regulation of an ever increasing labour force and
also the need for proper indicators to guide the formulation of important economic policies.
At National level Consumer Price Index for Industrial Workers, Agricultural Labourers,
Rural Labourers are constructed and released every month by Labour Bureau, Shimla. The
three Consumer Price Indices are primarily computed for wages of blue and white collar
workers in industry and Government services and also for agricultural labourers. These
indices do not cover all the segments of the population in the Country. In order to overcome
the above, the Central Statistics Office (CSO) of the Ministry of Statistics and Programme
Implementation compiles Consumer Price Index for Rural and Urban Areas & releases every
month. Though these indices are confined to a wide range of commodities and services
utilised by a consumer, it covers only the consumer class. Thus the Wholesale and
Consumer Price Indices are used in general for measuring price movement/inflation at the
national level inspite of certain limitations.
At the State level, only for 33 Agricultural Commodities Wholesale Price Index
Numbers are being computed. Like All India level more number of commodities are not
covered on account of the inadequacy of the availability of data such as inflow and outflow
of commodities from State to State especially in respect of price quotations of non–
agricultural commodities and basic data required for working out weighting diagram.
Page 2 Price Trends in Karnataka - 2013

In Karnataka, the following tools are adopted for measuring the price trends.
i. Wholesale Prices of Agricultural Commodities
ii. Retail Prices of Agricultural Commodities
iii. The Wholesale Price Index Numbers of Agricultural Commodities
iv. a) Farm Harvest Prices of Agricultural Commodities
b) Farm Harvest Price Index of Agricultural Commodities
v. Consumer Price Index Numbers
a) Industrial Workers
b) Agriculture Labourers
(Complied by Labour Bureau Shimla)
vi. Rural Retail Price Index Numbers
vii. Urban Retail Price Index Numbers
viii. Agricultural Wages
As already mentioned, each of the above price measurements has a limited coverage
of goods, services and population.
3. PRICE COLLECTION SYSTEM IN KARNATAKA
The Directorate of Economics and Statistics (DES) was made the sole authority
during 1983 for all price statistics generated at the State level in view of the increasing role
this organisation has to play in the field of prices. Accordingly, the District Statistical Offices
has been collecting fortnightly Wholesale and Retail prices of 110 commodities from district
head quarter, Agricultural Produce Marketing Committees (APMCs) of Agricultural
Marketing Department. This information is collected to build up time series data of the State
and for preparation of periodicals.
The wholesale prices are being collected from APMCs on a weekly basis by DES for
computing Wholesale Price Index. Besides, the Wholesale & Retail prices of 20 important
essential commodities are being collected on every Monday by the District Statistical Offices.
Farm Harvest Prices are being collected by the staff of District Statistical Offices,
during the peak marketing period for three seasons viz; Kharif, Rabi, Summer. Similarly
retail prices are collected from 11 specified centres for computing Consumer Price Index
Numbers for Industrial Workers. Further, retail prices from selected villages are also being
collected for computing Rural Retail Price Index Numbers. In addition to this Agricultural
wages are also being collected for knowing the movements in agricultural wages among
skilled labourers and agriculture labourers in the dry, wet and garden lands. As above the
District Statistical Offices & APMCs are the main data suppliers of price statistics.
Price Trends in Karnataka - 2013 Page 3
4 PRICE TRENDS
An attempt has been made here to study the price trends/fluctuations in the State
based on different tools as explained in the previous paragraphs.
i. Wholesale Prices of Agricultural Commodities:
"Wholesale Price" is defined as the price at which a commodity is sold to the sellers
or processors and not for ultimate consumption. The wholesale price in this case is the
“Model Price” which means the price of the commodity at which the largest transaction
takes place.
The important commodities nearly about 29 commodities are taken from Wholesale
and Retail Prices of 110 Commodities Report. These wholesale prices have been collected
fortnightly from the district head quarter Agricultural Produce Marketing Committees
(APMCs) by Distirict Statistical Office. The formula used in computing this report is "Simple
average ".
Average Wholesale Prices (in Rs. per quintal) of Agricultural Commodities for the
year 2000, 2005, 2010, and 2011 to 2013 along with percentage variation in prices are
presented in Table – 1.
As can be seen from the table, wholesale prices of 18 commodities in 2011, 23
commodities in 2012 and 25 commodities in 2013 have shown a rise when compared to the
corresponding previous years. During 3 years of movement of prices, prices of more number
of commodities rose during 2013 over 2012. However, wholesale prices of Paddy(fine),
(medium), (coarse), Jowar(white), Ragi, Maize, Groundnut oil, Chillies dry(byadgi) and
Arecanut commodities have shown a continuous rise from 2011, The prices of the remaining
commodities were fluctuating between 2011 and 2013.
In the year 2011 over the prices of 2010, except the prices of Rice(fine), Rice(medium),
Rice(coarse), Wheat(white), Tur(whole), Greengram(whole), Gur(both ball & square), Sugar,
Potato and Onion, prices of all other commodities have shown a rise. Cotton lint(58.05%) has
shown a highest price rise followed by Coconut(29.69%), Cotton (kapas) with 27.24% and
the lowest rise was recorded in case of Chillies dry (byadgi)(2.07%). The price fall was much
higher in case of Potato(-13.43%) during 2011.
During the year 2012, except the prices of Bajra, Blackgram(whole), Coconut oil,
Coconut(per 1000), Onion and Cotton(kapas), prices of all other commodities have shown a
Page 4 Price Trends in Karnataka - 2013

Table No - 1 Average Wholesale Prices of Important Agricultural Commodities in Karnataka for the year 2000, 2005, 2010,
2011 to 2013 (Rs.Per Quintal)
Sl.No. Commodity 2000 2005 2010 2011 2012 2013
1 Paddy (fine) 654 755 1310 1339 1442 1786 (15.44) (73.51) (2.21) (7.69) (23.86)
2 Paddy (medium) 588 640 1094 1150 1289 1593 (8.84) (70.94) (5.12) (12.09) (23.58)
3 Paddy (coarse) 536 618 946 1014 1113 1393 (15.30) (53.07) (7.19) (9.76) (25.16)
4 Rice (fine) 1522 1699 2973 2616 3362 4361 (11.63) (74.99) -(12.01) (28.52) (29.71)
5 Rice (medium) 1331 1464 2424 2291 2743 3555 (9.99) (65.57) -(5.49) (19.73) (29.60)
6 Rice (coarse) 1061 1004 1810 1591 1687 2326 -(5.37) (80.28) -(12.10) (6.03) (37.88)
7 Wheat (white) 1004 1091 1832 1806 2007 2368 (8.67) (67.92) -(1.42) (11.13) (17.99)
8 Jowar (white) 675 789 1414 1759 2061 2168 (16.89) (79.21) (24.40) (17.17) (5.19)
9 Ragi 590 539 1026 1089 1250 2135 -(8.64) (90.35) (6.14) (14.78) (70.80)
10 Bajra 566 529 1224 1466 1280 1425 -(6.54) (131.38) (19.77) -(12.69) (11.33)
11 Maize 471 541 893 1015 1194 1348 (14.86) (65.06) (13.66) (17.64) (12.90)
12 Tur (Whole) 1613 1710 3657 3608 4158 4439 (6.01) (113.86) -(1.34) (15.24) (6.76)
13 Green gram (whole) 2194 2431 5875 5124 5912 6233 (10.80) (141.67) -(12.78) (15.38) (5.43)
14 Blackgram (whole) 2592 1979 3841 4634 4572 4781 -(23.65) (94.09) (20.65) -(1.34) (4.57)
15 Gram (whole) 1788 1984 2536 2867 4510 4341 (10.96) (27.82) (13.05) (57.31) -(3.75)
16 Groundnut 1375 1751 2724 3145 4236 3575 (27.35) (55.57) (15.46) (34.69) -(15.60)
17 Groundnut (seeds) 2197 2766 4381 5361 7431 4301 (25.90) (58.39) (22.37) (38.61) -(42.12)
18 Groundnut oil 3622 5374 6795 7448 7880 9630 (48.37) (26.44) (9.61) (5.80) (22.21)
19 Coconut oil 5847 7585 8248 9622 9365 10837 (29.72) (8.74) (16.66) -(2.67) (15.72)
20 Gur (Ball) 1228 1635 2903 2786 3174 3502 (33.14) (77.55) -(4.03) (13.93) (10.33)
21 Gur (Square) 1339 1712 3004 2980 3204 3701 (27.86) (75.47) -(0.80) (7.52) (15.51)
22 Sugar (open market) 1419 1716 3088 2820 3260 3294 (20.93) (79.95) -(8.68) (15.60) (1.04)
23 Chillies dry (Byadgi) 5350 4802 8201 8371 9556 11409 -(10.24) (70.78) (2.07) (14.16) (19.39)
24 Coconut (per 1000) 4389 6174 5887 7635 7171 7334 (40.67) -(4.65) (29.69) -(6.08) (2.27)
25 Arecanut (cured / dry) 13670 9980 13252 13531 15873 16562 -(26.99) (32.79) (2.11) (17.31) (4.34)
26 Potato 439 650 1318 1141 1433 1719 (48.06) (102.77) -(13.43) (25.59) (19.96)
27 Onion 438 606 1441 1326 955 2562 (38.36) (137.79) -(7.98) -(27.98) (168.27)
28 Cotton (kapas) 1919 2074 3465 4409 3982 4778 (8.08) (67.07) (27.24) -(9.68) (19.99)
29 Cotton (lint) 3194 2858 4036 6379 8922 8376 -(10.52) (41.22) (58.05) (39.87) -(6.12)
Note : Figure in bracket indicate percentage variation over previous year.
Source : Agricultural Marketing Department , Bangalore, DES.
Price Trends in Karnataka - 2013 Page 5

Average Wholesale Prices of Important Agricultural Commodities in Karnataka from 2011 to 2013
Average Wholesale Prices of Important Agricultural Commodities in Karnataka from 2011 to 2013
500
1000
1500
2000
2500
3000
3500
4000
4500
5000
2011
2012
2013
2000
4000
6000
8000
10000
12000
14000
16000
18000
2011
2012
2013
Page 6 Price Trends in Karnataka - 2013

rise over 2011. The price of Gram(whole)(57.31%) has shown a highest price rise. The other
commodities which has shown a higher price rise was Cotton(lint)(39.87%) Groundnut seeds
(38.61%) and Groundnut(34.69%) and the lowest rise was recorded in case of Groundnut oil
(5.80%). The price fall was much higher in case of Black Gram(whole)(-32.29%).
In 2013 the percentage variation in price rise was very high in case of Onion(168.27%)
followed by Ragi(70.80%), Rice(coarse) (37.88%). The lowest price rise was noticed in case of
Sugar(1.04%). Except the prices of Gram(whole), Groundnut, Groundnut seeds, Cotton(lint),
prices of all other commodities have shown a rise over 2012. Higher price fall was noticed in
case of Groundnut seeds (-42.12%).
ii. Retail Prices of Agricultural Commodities:
"Retail Price" is defined as the price paid by the consumer which includes all taxes
and excludes discount. Along with the wholesale prices, retail prices have also been
collected fortnightly from the district head quarter Agricultural Produce Marketing
Committees (APMCs) of Agriculture Marketing Department by District Statistical Office.
The important commodities nearly about 32 commodities are taken from Wholesale and
Retail Prices of 110 commodities Report.
Average Retail Prices(in Rs. per quintal) of Agricultural Commodities for the year
2000, 2005, 2010, 2011 to 2013 along with percentage variation in prices are presented in
Table – 2.
As can be seen from the table, the prices of Jowar(white), Maize, Groundnut oil,
Castor oil, Cashewnut, Arecanut, Ghee, Pepper, Cardamum and Mutton have shown
continuous rise from 2011 to 2013. Year-wise prices reveal that in 2011 the prices of 16
commodities have shown a rise, in 2012, price rise was noticed in case of 24 commodities
and in 2013 it was 28 commodities as compared to the prices prevailed during the
corresponding period of the previous year.
In 2011, as compared to 2010 prices varied between the lowest of 5.71% in case of
Egg'A' grade to highest of 60.66% in case of Pepper. The price of some of the commodities
remains constant viz, Ragi, Gur(Ball), Onion and Chillies(Dry) & Kerosene. It was observed
that in Pepper price rose with 60.66%, followed by Tamarind with 55.56% & Cashewnut
with 27.65%.
The price of Green gram(split) declined maximum of -15.85%, whereas least decrease
was noticed in case of Gur(square) with -3.03%.
Price Trends in Karnataka - 2013 Page 7

Table No - 2 Average Retail Prices of Important Commodities in Karnataka for the year 2000, 2005, 2010, 2011 to 2013 (Rs.Per Quintal)
Sl.No. Commodity 2000 2005 2010 2011 2012 2013
1 Rice (fine) 16.66 18.38 31.44 28.00 36.00 46.00 (10.32) (71.06) -(10.94) (28.57) (27.78)
2 Rice (medium) 14.45 16.02 26.54 25.00 29.00 38.00 (10.87) (65.67) -(5.80) (16.00) (31.03)
3 Rice (coarse) 11.69 11.84 20.00 19.00 19.00 26.00 (1.28) (68.92) -(5.00) (0.00) (36.84)
4 Wheat (white) 11.44 12.37 21.00 20.00 22.00 26.00 (8.13) (69.77) -(4.76) (10.00) (18.18)
5 Jowar (white) 8.84 9.71 16.00 20.00 23.00 25.00 (9.84) (64.78) (25.00) (15.00) (8.70)
6 Bajra 6.76 7.39 14.00 17.00 15.00 17.00 (9.32) (89.45) (21.43) -(11.76) (13.33)
7 Maize 5.93 6.73 11.00 13.00 14.00 16.00 (13.49) (63.45) (18.18) (7.69) (14.29)
8 Ragi 6.98 7.27 13.00 13.00 15.00 24.00 (4.15) (78.82) (0.00) (15.38) (60.00)
9 Gram (split) 22.63 25.79 35.00 40.00 61.00 56.00 (13.96) (35.71) (14.29) (52.50) -(8.20)
10 Tur (split) 29.50 31.02 67.16 63.00 66.00 71.00 (5.15) (116.51) -(6.19) (4.76) (7.58)
11 Greengram (split) 28.93 31.75 82.00 69.00 67.00 78.00 (9.75) (158.27) -(15.85) -(2.90) (16.42)
12 Blackgram (split) 37.57 32.27 73.00 70.00 65.00 69.00 -(14.11) (126.22) -(4.11) -(7.14) (6.15)
13 Gur (Ball) 13.40 18.89 32.00 32.00 35.00 39.00 (40.97) (69.40) (0.00) (9.38) (11.43)
14 Gur (Square) 13.45 19.43 33.00 32.00 35.00 41.00 (44.46) (69.84) -(3.03) (9.38) (17.14)
15 Sugar (open market) 15.21 18.57 33.00 31.00 35.00 35.00 (22.09) (77.71) -(6.06) (12.90) (0.00)
16 Groundnut oil 41.38 56.25 72.00 81.00 95.00 105.00 (35.94) (28.00) (12.50) (17.28) (10.53)
17 Castor oil 43.72 49.88 68.00 74.00 82.00 92.00 (14.09) (36.33) (8.82) (10.81) (12.20)
18 Coconut oil 63.78 84.07 84.00 98.00 94.00 111.00 (31.81) -(0.08) (16.67) -(4.08) (18.09)
19 Potato 6.19 8.92 15.00 14.00 19.00 21.00 (44.10) (68.16) -(6.67) (35.71) (10.53)
20 Onion 5.65 8.30 16.00 16.00 13.00 32.00 (46.90) (92.77) (0.00) -(18.75) (146.15)
21 Cashewnut 281.90 267.12 340.00 434.00 461.00 504.00 -(5.24) (27.28) (27.65) (6.22) (9.33)
22 Arecanut (dry / curdnut) 179.68 137.50 151.00 160.00 177.00 194.00 -(23.48) (9.82) (5.96) (10.63) (9.60)
23 Ghee (AG mark) 135.21 156.99 238.00 277.00 349.00 354.00 (16.11) (51.60) (16.39) (25.99) (1.43)
24 Tamarind 26.51 32.10 45.00 70.00 59.00 66.00 (21.09) (40.19) (55.56) -(15.71) (11.86)
25 Chillies dry (Byadgi) 59.59 55.98 90.00 90.00 98.00 130.00 -(6.06) (60.77) (0.00) (8.89) (32.65)
26 Garlic 25.70 26.60 80.00 73.00 56.00 60.00 (3.50) (200.75) -(8.75) -(23.29) (7.14)
27 Pepper 253.98 98.47 183.00 294.00 401.00 429.00 -(61.23) (85.84) (60.66) (36.39) (6.98)
28 Cardamom 695.17 568.22 695.00 766.00 794.00 851.00 -(18.26) (22.31) (10.22) (3.66) (7.18)
29 Mutton 96.88 118.06 209.00 259.00 301.00 347.00 (21.86) (77.03) (23.92) (16.22) (15.28)
30 Egg 'A' grade (per dozen) 19.43 20.67 35.00 37.00 46.00 46.00 (6.38) (69.33) (5.71) (24.32) (0.00)
31 Vanaspati 43.90 50.04 55.00 64.00 76.00 72.00 (13.99) (9.91) (16.36) (18.75) -(5.26)
32 Kerosene (per litre) 10.56 19.61 31.00 31.00 34.00 34.00 (85.70) (58.08) (0.00) (9.68) (0.00)
Note : Figure in bracket indicate percentage variation over previous year. Source : Agricultural Marketing Department, Bangalore, DES.
Page 8 Price Trends in Karnataka - 2013

Av
Av
10
15
20
25
30
35
40
45
50
verage Reta
verage Reta
20
30
40
50
60
70
80
ail Prices of
ail Prices of
f Important2
f Important2
t Agricultur2011 to 2013
t Agricultur2011 to 2013
ral Commo3
ral Commo3
dities in Ka
dities in Ka
arnataka fr
arnataka fr
om
om
2011
2012
2013
2011
2012
2013
Price Trends in Karnataka - 2013 Page 9

Average Retail Prices of Important Agricultural Commodities in Karnataka from 2011 to 2013
During 2012, except the prices of Bajra, Greengram(split), Blackgram(split), Coconut
oil, Onion, Tamarind and Garlic prices of all other commodities increased compared to their
prices in 2011. The Price rise was varied from lowest of 6.22% in case of Cashewnut to
highest of 52.50% in case of Gram(split). The price of Rice(coarse) remains constant.
In 2013, except the prices of Gram(split) and Vanaspathi declined as compared to the
prices of previous year. Gram(split) price declined by -8.20%. The least decline was in
respect of Vanaspathi with only -5.26%. In 2013, highest increase in price i.e. 146.15% was
found in case of Onion, followed by 60% in case of Ragi and 36.84% in case of Rice(coarse).
The lowest was in case of Ghee with only 1.43% price rise. The price of Sugar and Egg
remains constant.
iii. Wholesale Price Index Numbers(WPI) of Agricultural Commodities:
Since 1991, the DES has been computing the Wholesale Price Index Numbers of 33
Agricultural Commodities in the State with the base year 1981-82. Prior to this up to 1990,
indices have been computed for 24 important agricultural commodities with the base year
1952-53. At present, index is computed under 7 groups viz., Cereals, Pulses, Oilseeds, Gur &
Sugar, Fibre, Condiment & Spices and Miscellaneous.
0
100
200
300
400
500
600
700
800
900
2011
2012
2013
Page 10 Price Trends in Karnataka - 2013

The price data for computing index is collected through selected 40 Agricultural
Produce Marketing Committiees (APMCs) of Agriculture Marketing Department every
week and also from Spices Board, Coffee Board, Tobacco Board and Sugar Directorate every
month. APMCs have been selected for commodity keeping in view the volume of its (or its
varieties) transactions in the markets during the base year period.
WPI is being used in estimation of State Domestic Product and to study the trends in
prices in the first stages of commercial transaction. The formula used in computing WPI is
"Laspeyers Formula"
Trend in Wholesale Prices and Wholesale Price Index of Agricultural Commodities
are strictly not comparable as due to the following limitations:
1. The wholesale prices data is based on the price information received from the district
head quarter APMCs (which was reported in earlier paragraphs) while the prices
data for the computing wholesale price index are received from the selected 40
APMCs..
2. Market coverage are totally different for wholesale prices and wholesale price Index.
3. Index is a weighted average
4. There is difference in time lag and variety of the commodity.
Wholesale Price Index Numbers of 33 Agricultural Commodities for the year 2000,
2005, 2010, 2011 to 2013 with yearly percentage variation over the corresponding previous
years are presented in Table – 3.
As can be seen from the table, the percentage variation of index of all commodities
gradually increased to 12.31% in 2011, 7.42% in 2012 and 11.16% in 2013. The index which
was 876 in 2011 raised to 941 in 2012 and to 1046 in 2013. The index of Cereals, Oilseeds and
Gur & Sugar groups raised in all the 3 years under report where as in case of Pulses index
declined in 2011, rose in subsequent years, Fibre group, Miscellaneous group and
Condiments & Spices group index has declined in 2012 and rose in 2013. The index of 12
commodities declined in 2011 and 2012, only 4 commodities in 2013. The index of Jowar,
Castor and Coffee has declined continuously in 2012 & 2013 and whereas index of Linseed,
Cardamom and Tobacco has declined in 2011 and 2012.
Among all the 33 commodities Ragi, Wheat, Bajra, Maize, Groundnut, Safflower,
Sunflower, Cotton lint, Pepper and Arecanut have shown an increased index in all the years
Price Trends in Karnataka - 2013 Page 11

Table No - 3 Wholesale Price Index Numbers of Agricultural Commodities in Karnataka for the year 2000, 2005, 2010, 2011 to 2013
(Base year: 1981-82=100) Sl
No. Commodity Weights 2000 2005 2010 2011 2012 2013
I . Cereals 29.890 435 449 894 902 990 1149
(4.23) (99.11) (0.89) (9.76) (16.06)
1 Rice 19.500 468 470 1010 948 1032 1209
(1.49) (114.89) -(6.14) (8.86) (17.15)
2 Jowar 1.170 381 453 673 1247 1187 959
-(10.82) (48.57) (85.29) -(4.81) -(19.21)
3 Ragi 1.390 346 344 664 703 916 1276
(7.85) (93.02) (5.87) (30.30) (39.30)
4 Wheat 2.560 412 457 734 789 839 942
(15.97) (60.61) (7.49) (6.34) (12.28)
5 Bajra 1.740 436 435 732 871 1022 1244
(12.41) (68.28) (18.99) (17.34) (21.72)
6 Maize 3.530 325 375 625 709 813 940
(13.33) (66.67) (13.44) (14.67) (15.62)
II . Pulses 4.920 427 487 989 889 1067 1177
(18.28) (103.08) -(10.11) (20.02) (10.31)
7 Tur 2.670 393 458 977 852 1007 1212
(2.84) (113.32) -(12.79) (18.19) (20.36)
8 Gram 1.120 398 451 537 704 1083 866
(27.94) (19.07) (31.10) (53.84) -(20.04)
9 Greengram 0.810 489 572 1429 1128 1129 1330
(34.27) (149.83) -(21.06) (0.09) (17.80)
10 Blackgram 0.220 781 738 1857 1478 1532 1669
(56.91) (151.63) -(20.41) (3.65) (8.94)
11 Horsegram 0.100 407 395 887 701 939 1388
(35.19) (124.56) -(20.97) (33.95) (47.82)
III . Oil seeds 17.310 323 409 676 777 1006 1056
(1.71) (65.28) (14.94) (29.47) (4.97)
12 Groundnut 13.460 327 415 699 812 1060 1085
(1.20) (68.43) (16.17) (30.54) (2.36)
13 Sesamum 0.910 388 466 784 673 967 1364
(9.87) (68.24) -(14.16) (43.68) (41.05)
14 Safflower 1.450 313 432 592 691 971 1059
-(2.08) (37.04) (16.72) (40.52) (9.06)
15 Sunflower 0.760 155 219 338 434 480 494
(9.13) (54.34) (28.40) (10.60) (2.92)
16 Castor 0.290 468 460 844 1215 1008 980
(0.00) (83.48) (43.96) -(17.04) -(2.78)
17 Linseed 0.440 280 352 514 485 459 523
-(7.10) (46.02) -(5.64) -(5.36) (13.94)
Page 12 Price Trends in Karnataka - 2013

Sl No. Commodity Weights 2000 2005 2010 2011 2012 2013
IV . Gur & Sugar 14.560 291 394 571 598 645 670
(2.03) (44.92) (4.73) (7.86) (3.88)
18 Gur 3.700 260 427 724 671 724 804
-(2.11) (69.56) -(7.32) (7.90) (11.05)
19 Leavy Sugar 4.180 379 513 512 687 721 721
(0.00) -(0.19) (34.18) (4.95) (0.00)
20 Free Sale Sugar 6.680 254 301 522 501 555 563
(7.31) (73.42) -(4.02) (10.78) (1.44)
V . Fibre 9.640 376 350 609 692 682 722
(5.43) (74.00) (13.63) -(1.45) (5.87)
21 Cotton (kappas) 7.970 374 350 639 716 671 716
(14.86) (82.57) (12.05) -(6.28) (6.71)
22 Cotton (lint) 1.670 388 351 468 579 731 750
-(7.69) (33.33) (23.72) (26.25) (2.60)
VI . Condiments & Spices 2.270 412 301 623 847 720 816
(29.24) (106.98) (35.96) -(14.99) (13.33)
23 Dry Chillies 1.210 450 351 649 1031 856 944
(45.58) (84.90) (58.86) -(16.97) (10.28)
24 Cardamom 0.650 273 155 532 436 287 301
-(20.65) (243.23) -(18.05) -(34.17) (4.88)
25 Pepper 0.070 1264 410 1040 1511 2003 2220
(32.68) (153.66) (45.29) (32.56) (10.83)
26 Coriander 0.340 370 379 572 843 801 1059
(14.51) (50.92) (47.38) -(4.98) (32.21)
VII . Miscellaneous 21.410 546 602 894 1195 1133 1291
(11.30) (48.50) (33.67) -(5.19) (13.95)
27 Onion 1.190 460 758 1435 1468 1038 2858
-(32.59) (89.31) (2.30) -(29.29) (175.34)
28 Potato 0.630 220 356 550 535 716 801
(35.67) (54.49) -(2.73) (33.83) (11.87)
29 Tamarind 0.380 317 459 609 1155 846 873
(14.16) (32.68) (89.66) -(26.75) (3.19)
30 Arecanut 7.290 690 445 672 730 827 930
(47.42) (51.01) (8.63) (13.29) (12.45)
31 Coconut 1.200 299 404 385 538 497 609
-(7.92) -(4.70) (39.74) -(7.62) (22.54)
32 Coffee 8.990 536 782 1053 1692 1555 1553
(1.41) (34.65) (60.68) -(8.10) -(0.13)
33 Tobacco 1.730 395 479 1183 1091 993 1116
(5.22) (146.97) -(7.78) -(8.98) (12.39)
All Commodities 100.00 412 456 780 876 941 1046
(6.80) (71.05) (12.31) (7.42) (11.16) Note : Figure in bracket indicate percentage variation over previous year. Source : Agricultural Marketing Department and Directorate of Economic & Statistics, Bangalore.
Price Trends in Karnataka - 2013 Page 13

Wholesale Price Index Numbers of Agricultural Commodities in Karnataka from 2011 to 2013
under report. In 2011 the index of 12 commodities i,e Rice(-6.14%), Tur(-12.79%),
Greengram(-21.06%), Blackgram(-20.41%), Horsegram(-20.97%), Sesamum(-14.16%),
Linseed(-5.64%), Gur(-7.32%), Free Sale Sugar(-4.02%), Cardamom(-18.05), Potato(-2.73%),
and Tobacco(-7.78%) in 2012, 12 commodities i,e Jowar(-4.81%), Castor(-17.04%), Linseed
(-5.36%), Cotton(Kapas) (-6.28%), Dry Chillies(-16.97%), Cadamum(-34.17%), Corriander
(-4.98%), Onion (-29.29%), Tamarind(-26.75%), Coconut(-7.62%), Coffee(-8.10%) and
Tobacco(-8.98%) and in 2013, 4 commodities i,e Jowar(-19.21%), Gram(-20.04%), Castor
(-2.78%) and Coffee(-0.13%) have declined. The index of other commodities increased when
compared to corresponding previous years
In 2013, the index of 29 commodities has shown an increased index, whereas the
index of remaining commodities has declined. Among all the 33 commodities, the highest
percentage of increase in index was observed in respect of Onion with 175.34%, 47.82% in
case of Horsegram followed by 41.05% in case of Sesamum, 39.30% in respect of Ragi and
32.21% in case of Corriander. Lowest decline in index was observed in Gram with -20.04%
The Cereals group has recorded a highest increase in index with 16.06%, within this
group the highest percentage variation increase was observed in respect of Ragi with
39.30%, 21.72% in case of Bajra, Rice by 17.15%, Maize by 15.62% and 12.28% in case of
Wheat and decrease in index of Jowar by -19.21%.
500
600
700
800
900
1000
1100
1200
1300
1400
2011
2012
2013
Page 14 Price Trends in Karnataka - 2013
The Index of Miscellaneous group has increased by 13.95%, in this, Onion shows an
increase in index i.e an increase of 175.34%, followed by Coconut (22.54%), Arecanut
(12.45%), Tobacco(12.39%), Potato (11.87%) and Tamarind with (3.19%). Highest increase in
index of Onion has resulted in the increase of the State index.
Condiments & Spices group index has been increased by 13.33% within this group
the index of Coriander recorded a highest percentage of increase with 32.21%, 10.83% in case
of Pepper followed by 10.28% in respect of Dry Chillies and by 4.88% by Cardamom.
The Indices of Pulses group has increased with 10.31%, in this, viz Horsegram, Tur,
Greengram, Black gram have recorded an increase by 47.82%, 20.36%, 17.80%, 8.94%
respectively.
It has been observed, that there was an increase in index of Cotton(kappas) with
6.71% and Cotton (lint) with 2.60% in Fibre group, which has increased by 5.87%.
The Index of Oilseeds has increased by 4.97%, Highest rise in index has been
observed in Sesamum, followed by Linseed Safflower, Sunflower, Groundnut with
41.05%,13.94%, 9.06%, 2.92% and 2.36% respectively in this group.
An increase in index of Gur by 11.05% and Free Sale Sugar by 1.44% has been
observed in Gur and Sugar group, which has recorded lowest increase in index with 3.88%.
The Wholesale Price Index Numbers of Selected Groups for All India for the year
2000, 2005, 2010, 2011 to 2013 has shown in Table – 4
As it can be seen from the table, except the index of Pulses group in 2011, 2013 Fibre
and Condiments & Spices group in 2012, the index of all other groups have shown an
increasing trend, in which the highest percentage variation was noticed in case of Fibre
group with 39.25% in 2011 followed by Oilseeds group with 21.93% in 2012 and Cereals
with 15.16% in 2013.
The Wholesale Price Index Numbers of Selected Groups for Karnataka State for the
year 2000, 2005, 2010, 2011 to 2013 has shown in Table – 5
It can be seen from the table that, the index of Cereals, Oil seeds, Gur & Sugar has
shown a continuous increasing trend, whereas the index varied in case of Pulses, Fibre and
Condiments & Spices, Miscellaneous groups. The index of all commodities was 876 in 2011
rose to 941 in 2012, 1046 in 2013. Thus the percentage variation was 12.31% in 2011, 7.42% in
2012 and 11.16% in 2013. In respect of Fibre, there was a marginal fall of -1.45% in 2012.
Price Trends in Karnataka - 2013 Page 15

Table No - 4
Wholesale Price Index Numbers of Selected Groups for All - India for the year
2000, 2005, 2010, 2011 to 2013
Sl No. Group Base year : 1993-94=100 Base year : 2004-05=100
Weights 2000 Weights 2005 2010 2011 2012 2013
1 Cereals 4.41 173.00 3.37 103.80 168.45 174.97 191.67 220.73 (62.28) (3.87) (9.54) (15.16)
2 Pulses 0.60 179.60 0.72 106.63 200.84 197.20 234.20 231.03 (88.35) -(1.81) (18.76) -(1.35)
3 Oil seeds 2.67 129.30 1.78 92.60 138.77 154.34 188.18 202.99 (49.86) (11.22) (21.93) (7.87)
4 Fibre 1.52 156.7 0.88 92.73 169.28 235.73 204.86 231.45 (82.55) (39.25) -(13.10) (12.98)
5 Condiments & Spices 0.66 202.5 0.57 92.58 228.74 249.56 209.05 234.27
(147.07) (9.10) -(16.23) (12.06)
Note : 1)Figures in bracket indicate percentage variation over previous year. 2) * New base year from 2005-06
Source : Office of the Economic Adviser, New Delhi.
Table No - 5
Wholesale Price Index Numbers of Selected Groups for Karnataka for the year
2000, 2005, 2010, 2011 to 2013
Base year: 1981-82=100
Sl No. Group Weights 2000 2005 2010 2011 2012 2013
1 Cereals 29.89 435 449 894 902 990 1149 (3.22) (99.11) (0.89) (9.76) (16.06)
2 Pulses 4.92 427 487 989 889 1067 1177 (14.05) (103.08) -(10.11) (20.02) (10.31)
3 Oil seeds 17.31 323 409 676 777 1006 1056 (26.63) (65.28) (14.94) (29.47) (4.97)
4 Gur & Sugar 14.56 291 394 571 598 645 670 (35.40) (44.92) (4.73) (7.86) (3.88)
5 Fibre 9.64 376 350 609 692 682 722 -(6.91) (74.00) (13.63) -(1.45) (5.87)
6 Condiments & Spices 2.27 412 301 623 847 720 816 -(26.94) (106.98) (35.96) -(14.99) (13.33)
7 Miscellaneous 21.41 546 602 894 1195 1133 1291 (10.26) (48.50) (33.67) -(5.19) (13.95)
All Commodities 100.00 412 456 780 876 941 1046 (10.68) (71.05) (12.31) (7.42) (11.16)
Note : Figures in bracket indicate percentage variation over previous year.
Source : Directorate of Economics & Statistics & Agricultural Marketing Department, Bangalore.
Page 16 Price Trends in Karnataka - 2013

Wholesale Price Index Numbers of Selected Groups for All - India from 2011 to 2013
Wholesale Price Index Numbers of Selected Groups for Karnataka from 2011 to 2013
140
160
180
200
220
240
260
Oil seeds Cereals Pulses Fibres Condiments &Spices
2011
2012
2013
400
500
600
700
800
900
1000
1100
1200
1300
2011
2012
2013
Price Trends in Karnataka - 2013 Page 17

During 2013, groupwise indices of all the 7 groups has shown increasing trend, in
which the highest percentage variation was noticed in case of Cereals group with 16.06%
followed by Miscellaneous with 13.95%, Condiments & Spices group with 13.33%, Pulses
with 10.31%, Fibre with 5.87%, Oilseeds with 4.97% & Gur & Sugar with 3.88%. Higher
increase in index of Cereals group has resulted in the increase of the State index.
iv. (a) Farm Harvest Prices of Agricultural Commodities
The Farm Harvest Prices are being collected by this Directorate as per the directions
of Ministry of Agriculture, Agriculture and Co-operation Department, GOI. The Farm
Harvest Price is defined as the average wholesale price at which the commodity is disposed
off by the producer to the trader or buyer during the peak marketing period after the harvest
is over. The price relate to what the farmer ultimately receives for his produce which is
calculated by deducting the transport and other market charges from the wholesale prices
quoted at the APMCs where the produce is disposed off.
For the collection of farm harvest prices, wholesale price of agricultural commodities
are considered taking model prices from APMCs in respect of all the important agricultural
commodities which account for major cropped area which involves bulk of transactions in
the APMCs of Taluk Head Quarters. The prices are being collected for nearly about 32
commodities in all the three seasons i.e. Kharif, Rabi and Summer for about 8 to 10 weeks.
The reports collected from all the District Statistical Offices are consolidated and
State weighted average of farm harvest prices is sent to the Ministry of Agriculture,
Agriculture & Cooperation Department, GOI.
The formula used in computing this report is "Simple & Weighted average”.
State Weighted Average Price =fnpn / pn, Where fn = farm harvest price of nth
district and pn = production figure of agriculture commodity of nth district (District wise
production information is taken from Fully Revised Estimates of Principal crops in
Karnataka)
Year-wise and Commodity-wise Farm Harvest Prices for the years 1999-2000, 2004-
05, 2009-10, 2010-11 are presented in Table – 6
As can be seen from the table, it is observed that in 2010-11, out of 29 commodities,
farm harvest prices of 22 commodities showed an upward trend as compared to previous
year. The highest price rise was noticed in Pepper with 78.60% as compared to previous
Page 18 Price Trends in Karnataka - 2013

Table No - 6 Farm Harvest Prices of Agricultural Commodities (State weighted average prices)
for the year 1999-2000, 2004-05, 2009-10 to 2010-11 (Rs. Per Quintal)
Sl. No Commodity 1999-2000 2004-05 2009-10 2010-11
1 Paddy 577 568 1022 1057 -(1.56) (79.93) (3.42)
2 Jowar 636 632 929 1438 -(0.63) (46.99) (54.79)
3 Ragi 444
583 900 941 (31.31) (54.37) (4.56)
4 Maize 449 498 808 987 (10.91) (62.25) (22.15)
5 Bajra 434 544 749 802 (25.35) (37.68) (7.08)
6 Wheat (Rabi) 747 951 1457 1597 (27.31) (53.21) (9.61)
7 Bengalgram (Rabi) 1340 1531 1906 2335 (14.25) (24.49) (22.51)
8 Tur 1617 1792 4358 3567 (10.82) (143.19) -(18.15)
9 Horsegram 661 648 1817 1301 -(1.97) (180.40) -(28.40)
10 Greengram 1569 1685 4355 3649 (7.39) (158.46) -(16.21)
11 Blackgram 1555 1444 4224 3861 -(7.14) (192.52) -(8.59)
12 Avare 1695 1583 2477 3147 -(6.61) (56.48) (27.05)
13 Cowpea - - 3691 2800 - - -(24.14)
14 Sunflower 1064 1604 2155 2658 (50.75) (34.35) (23.34)
15 Soyabean - - 2098 1889 - - (-9.96)
16 Groundnut 1153 1576 2424 3073 (36.69) (53.81) (26.77)
17 Sesamum 2066 2681 4004 4119 (29.77) (49.35) (2.87)
18 Castor 1237 1143 2375 2570 -(7.60) (107.79) (8.21)
19 Safflower - - 2088 2093 - - (0.24)
20 Drychillies 3022 4610 5107 5744 (52.55) (10.78) (12.47)
21 Pepper 20616 6686 12005 21441 -(67.57) (79.55) (78.60)
22 Arecanut 11106 6680 8898 10755 -(39.85) (33.20) (20.87)
23 Cashewnut 3649 3346 4331 6616 -(8.30) (29.44) (52.76)
24 Sugarcane 82.26 - 145 160 - - (10.34)
25 Cotton (pooled) 1789 2388 2619 4573 (33.48) (9.67) (74.61)
26 Tobacco 4197 4742 11098 8624 (12.99) (134.04) -(22.29)
27 Potato 395 484 991 1002 (22.53) (104.75) (1.11)
28 Onion 325 - 925 946 - - (2.27)
29 Coconut (per 1000 nuts) 4361 5255 4472 6265 (20.50) -(14.90) (40.09)
Note : Figure in bracket indicate percentage variation over previous year. Source : Directorate of Economics & Statistics, Bangalore.
Price Trends in Karnataka - 2013 Page 19

year. The price of Pepper which was Rs. 12005/- per quintal in 2009-10 shoot up to
Rs. 21441/- per quintal in 2010-11. The least price rise was noticed in case of
Safflower(0.24%).The highest fall in prices was found in case of Horsegram(-28.40%), whose
price fell from Rs. 1817/- per quintal in 2009-10 to Rs. 1301/- per quintal in 2010-11.
Other than Pepper, the sharpest price rise was found with Cotton(pooled)(74.61%)
followed by Jowar (54.79%), Cashewnut(52.76%), Coconut(40.09%), Avare (27.05%),
Groundnut(26.77%), Sunflower (23.34%), Bengalgram(22.51%), Maize(22.15%), Arecanut
(20.87%), Dry chillies(12.47%), Sugarcane(10.34%), Wheat(Rabi)(9.61%), Castor(8.21%),
Bajra(7.08%), Ragi (4.56%), Paddy(3.42%), Sesamum(2.87%), Onion(2.27%) and Potato with
only 1.11%. The lowest rise was in case of Safflower with (0.24%) when compared to
previous year.
iv. (b)Farm Harvest Price Index Numbers of Agricultural Commodities:
For the computation of farm harvest price index, the prices collected in the peak
marketing seasons are utilized. The objective of computing these indices is primarily to
measure changes in the wholesale prices received by the producers. The weights in
proportion to the value of the production of each commodity during the base year 1961-62
have been made use of for the computation of the index. The weighted arithmetic average is
considered for the construction of index numbers. Index of farm harvest prices of
Agricultural Commodities is being constructed on the basis of weighted average of farm
harvest prices.
The index numbers for food and non-food crops are computed annually unlike other
indices which are computed once a month.
The Farm Harvest Price Index Numbers of Agricultural Commodities and their
trends from 1999-2000, 2004-05, 2009-10, 2010-11 are shown in Table –7.
It can be noticed from the table, the rise in the index of non-food crops was of the
order of 16.18% and that of food crops was 14.43% during 2010-11 over 2009-10. During the
same period, among food crops, the index of cereals had gone up by 17.68% and that of
Pulses declined by -11.32%. Among Cereals, the highest increase was in respect of Jowar
(54.78%) followed by Maize with 22.17%, Wheat with 9.62%, Bajra with 7.11%, Ragi with
4.58% and the lowest rise was in case of Paddy with 3.40%. The index of Gram rose by
22.50% and Tur declined by -18.15% under pulses. Among non-food crops, the index of
Fibre has gone up by 74.59%, Oilseeds by 24.80%, and Miscellaneous by 11.22%. Under Fibre
group, index of Cotton had gone up by 74.59%.
Page 20 Price Trends in Karnataka - 2013

Table No - 7 Farm Harvest Prices Index Numbers of Agricultural Commodities for the year 1999-2000, 2004-05, 2009-10 to 2010-11
Base year: 1961-62=100 Sl. No. Commodity Weights 1999-2000 2004-05 2009-10 2010-11
I . Food Crops 40.967 1502 1574 2641 3022 (4.79) (67.79) (14.43)
1 Cereals 39.526 1426 1488 2432 2862 (4.35) (63.44) (17.68)
a Paddy 19.376 1570 1631 2702 2794 (3.89) (65.67) (3.40)
b Jowar 10.764 1527 1623 2408 3727 (6.29) (48.37) (54.78)
c Bajra 1.052 1271 1328 2067 2214 (4.48) (55.65) (7.11)
d Maize 0.111 1337 1377 2440 2981 (2.99) (77.20) (22.17)
e Ragi 7.562 956 954 1834 1918
-(0.21) (92.24) (4.58)
f Wheat 0.661 1197 1519 2328 2552
(26.90) (53.26) (9.62)
2 Pulses 1.441 3577 3929 8385 7436 (9.84) (113.41) -(11.32)
a Gram 0.449 3176 3416 4519 5536 (7.56) (32.29) (22.50)
b Tur 0.992 3759 4160 10135 8295
(10.67) (143.63) -(18.15)
II . Non Food Crops 59.033 1984 2083 3412 3964 (4.99) (63.80) (16.18)
3 Oil seeds 4.912 2127 2670 4323 5395
(25.53) (61.91) (24.80)
a Groundnut 4.577 2099 2599 4271 5415
(23.82) (64.33) (26.79)
b Sesamum 0.116 2599 3363 5038 5182
(29.40) (49.81) (2.86)
c Mustard 0.022 3437 3937 4738 4458
(14.55) (20.35) -(5.91)
d Linseed 0.092 2172 3730 5324 5060
(71.73) (42.73) -(4.96)
e Castor 0.105 2521 3817 4842 5240
(51.41) (26.85) (8.22)
2 Fibre 3.919 1939 2028 2838 4955 (4.59) (39.94) (74.59)
a Cotton 3.919 1939 2028 2838 4955 (4.59) (39.94) (74.59)
III . Miscellanenous 1943 1973 2030 3368 3746 (2.89) (65.91) (11.22)
a Sugarcane 48.226 1932 2061 3396 3747 (6.68) (64.85) (10.34)
b Pepper 1.051 4454 1200 2595 4632
-(73.06) (116.25) (78.50)
c Tobacco 0.222 1473 1769 3894 3026
(20.10) (120.12) -(22.29)
d Potato 0.438 1159 1229 2486 2514 (6.04) (102.28) (1.13)
e Dry Chillies 0.265 1429 1198 2415 2716
-(16.17) (101.59) (12.46)
All Commodities 100 1700 1875 3096 3578
Note : Figure in bracket indicate percentage variation over previous year. Source : Directorate of Economics & Statistics, Bangalore.
Price Trends in Karnataka - 2013 Page 21

Far
Far
0
500
1000
1500
2000
2500
3000
0
5000
10000
15000
20000
25000
rm Harvest
rm Harvest
t Prices of A
t Prices of A
Agriculturalfor t
Agriculturalfor t
l Commodithe year 201
l Commodithe year 201
2010-11
2010-11
ities (State 10-11
ities (State 10-11
weighted a
weighted a
average pric
average pric
ces)
ces)
Page 22 Price Trends in Karnataka - 2013

Among Oilseeds, the index of Groundnut registered a rise of 26.79% followed by
Castor(8.22%) and Sesamum(2.86%) and the decline of index was in respect of Mustard with
-5.91% and that of Linseed by -4.96%. Under Miscellaneous, the index of Pepper registered
maximum rise of 78.50%, followed by Dry Chillies(12.46%), Sugarcane(10.34%).
Potato(1.13%) and the fall in index was noticed in Tobacco with (-22.29%).
Farm Harvest Price Index Numbers of Agricultural Commodities for the year 2010-11
v. Consumer Price Index(CPI) Numbers:
a) Consumer Price Index Numbers for Industrial Workers: (CPI-IW)
Index numbers are used to feel the pulse of an economy and are used as indicators of
inflationary or deflationary tendencies. The consumer price index numbers are intended to
represent the average change over time in the prices paid by the ultimate consumers for a
fixed basket of goods and services. The CPI helps in determining the effects of rise and fall
in prices in different classes of consumers living in different areas. This index also helps to
find out how much the consumers of a particular class have to pay for a certain basket of
goods and services in a given period compared to the base period.
The construction of CPI numbers is of great significance, as millions of individuals
whose wages are linked to a consumer price index series. The CPI numbers measures the
2500
2700
2900
3100
3300
3500
3700
3900
4100
Food Crops Non Food Crops All Commodities
2010-11
Price Trends in Karnataka - 2013 Page 23

average increase in the cost of maintaining the same standard in a given year as in the base
year. Two series are adopted for computing the index in the State viz., Central Series and
State Series. The Consumer Price Index Numbers for Industrial Workers of both the series
for the year 2000, 2005, 2010, 2011 to 2013 are presented in Table – 8.
Central Series:
In Karnataka, up to 1989, in respect of four centres viz., Bangalore, Ammathi(Kodagu
District), Chickmagalur and KGF(Kolar District) for which CPI(IW) were computed by
Labour Bureau, Shimla with base year 1960. From 1990 onwards, except for Bangalore, the
construction of CPI numbers for the other three centres were discontinued and instead three
new centres viz Belgaum, Hubli-Dharwad & Mercara were introduced & base year was also
shifted from 1960 to 1982. Subsequently, while shifting the base year to 2001, with effect
from January 2006 Mysore centre was also included. At present in respect of 78 industrial
centres in the country, including five centres of Karnataka viz., Bangalore, Belgaum, Hubli –
Dharwad, Mysore and Mercara with base year 2001 Labour Bureau, Shimla constructs CPI
Numbers for Industrial Workers and releases every month. Thus for five centres prices are
being collected by District Statistical Office and sent to Labour Bureau, Shimla for
computation of index.
It can be seen from Table – 8 that the index of all the centres shown an increasing
trend from 2011 to 2013. The Mysore centre recorded a hike of 17.97% followed by Mercara
Consumer Price Index Numbers for Industrial Workers at different selected centres in Karnataka from 2011 to 2013 [Central Series]
150
170
190
210
230
250
Bangalore Belgaum Hubli -Dharwad
Mercara Mysore
2011
2012
2013
Page 24 Price Trends in Karnataka - 2013

Table - 8 Consumer Price Index Numbers for Industrial Workers at different selected centres in
Karnataka and All India for the year 2000, 2005, 2010, 2011 to 2013 Sl. No Centres 2000 2005 2010 2011 2012 2013
(Base year : 1982 = 100) (Base year : 2001=100)
1 Bangalore * 425 287
533 360
181 552
194 591
211 643
238 725
(4.75) (25.44) (53.33) (7.07) (8.80) (12.75)
2 Belgaum * 473 307
637 382
179 585
200 652
217 707
242 790
(3.37) (24.43) (53.14) (11.45) (8.44) (11.74)
3 Hubli - Dharwad * 434 276
540 346
182 545
200 599
219 657
248 743
(0.73) (25.36) (57.51) (9.91) (9.68) (13.09)
4 Mercara * 458 316
495 341
172 530
188 580
208 640
240 739
(3.27) (7.91) (55.43) (9.43) (10.34) (15.47)
5 Mysore * -
- -
- 174
436 187
469 205
512 242
604
- - - (7.57) (9.17) (17.97)
(Base year : 1987-88 =100)
6 Bellary 250 288 452 472 521 596
(0.00) (15.20) (56.94) (4.42) (10.38) (14.40)
7 Bhadravathi 261 311 446 490 566 648
(3.57) (19.16) (43.41) (9.87) (15.51) (14.49)
8 Davanagere 258 298 488 533 608 698
(0.39) (15.50) (63.76) (9.22) (14.07) (14.80)
9 Dandeli 286 330 467 511 562 632
(2.51) (15.38) (41.52) (9.42) (9.98) (12.46)
10 Gulbarga 253 293 419 461 516 568
-(4.17) (15.81) (43.00) (10.02) (11.93) (10.08)
11 Harihar 249 283 402 441 513 599
(1.22) (13.65) (42.05) (9.70) (16.33) (16.76)
12 Hassan 254 295 443 486 541 627
(6.72) (16.14) (50.17) (9.71) (11.32) (15.90)
13 Mandya 263 313 470 521 598 696
(3.95) (19.01) (50.16) (10.85) (14.78) (16.39)
14 Mangalore 237 291 435 474 491 555
(0.85) (22.78) (49.48) (8.97) (3.59) (13.03)
15 Raichur 270 312 504 548 609 689
-(1.82) (15.56) (61.54) (8.73) (11.13) (13.14)
16 Tumkur 235 278 389 415 448 524
(4.91) (18.30) (39.93) (6.68) (7.95) (16.96)
17 Mysore 261 295 This centre has been shifted to Central series with base year-
2001=100 (5.67) (13.03)
State Average 274 332 504 544 597 680
(3.40) (21.17) (51.81) (7.94) (9.74) (13.90)
All India* 441 536 176 815 192 889 209 968 232 1074
(4.01) (21.54) (52.05) (9.08) (8.89) (10.95)
Note: 1. Figures in bracket indicate percentage variation over previous year 2.* Indicates Central series Source : i) 1 to 5 and All India, Labour Bureau, Shimla ii) 6 to 16 and State average Directorate of Economics & Statistics, Bangalore.
Price Trends in Karnataka - 2013 Page 25

with 15
11.74%,
Stat
Worker
Dandel
year is
and we
Family
constitu
and Exp
Transpo
compris
being c
each cen
Cons
400
450
500
550
600
650
700
5.47%, Hub
, in 2013 wh
te Series:
In respect
rs in the 11
i, Gulbarga
shifted from
eighting dia
Income an
utes of CPI
penditure s
ort, Port &
sing of goo
collected we
ntre.
sumer Price
bli-Dharwa
hen compar
of State ser
selected ce
a, Harihara,
m 1960 to 1
agram have
nd Expend
series are (
urvey inclu
Docks, Ra
ods and ser
eekly/mont
e Index NumKarn
d with 13.
red with the
ries, Directo
entres in th
, Hassan, M
1987-88 from
been derive
diture Surv
(i) weightin
udes employ
ilways & E
rvices which
thly by Dis
mbers for Innataka from
.09%, Bang
e correspon
orate is com
he State, the
Mandya, Ma
m January 1
ed separate
vey conduc
ng diagram
yees workin
Electricity se
h are gener
strict Statist
ndustrial Wm 2011 to 20
galore with
nding previo
mputing th
ey are Bella
angalore, R
1993 onwar
ely for each
cted during
(ii) retail p
ng in Factor
ectors. Reta
rally used
tical Office
Workers at d013 [State Se
h 12.75%, a
ous year.
he CPI num
ary, Bhadra
aichur and
ds. The nec
centre on t
g 1987-88.
rices. Gene
ries, Mines,
ail prices fo
by the indu
for compu
different seeries]
and Belgau
mbers for In
avathi, Dava
Tumkur. T
cessary item
the basis of
The two e
eral Family
Plantations
or nearly 15
ustrial wor
utation of in
elected cent
um with
ndustrial
anagere,
The base
m basket
General
essential
y Income
s, Motor
50 items
kers are
ndex for
tres in
2011
2012
2013
Page 26 Price Trends in Karnataka - 2013

CPI(IW) is being utilised by various labour unions, departments, small and large
scale industries for revision of wages and determination of dearness allowances for their
employees.
The formula used in computing Consumer Price Index [IW] is "Laspeyers’ Formula".
Or
Where In = Index Numbers, Pn = Price for current period, Po = Price for base period Qo = Quantity for base period (weights derived by the Family Budget Survey)
Accordingly, on the basis of information collected every month Index Numbers of 11
centres are being constructed seperately in head office and released for the users.
Monthly weighted average of 16 centres is being prepared every month after
converting five centres of central series to the base 1987-88 which are released by Labour
Bureau, Shimla.
On the basis of monthly weighted average Karnataka State Annual Average of
Consumer Price Index Numbers of Industrial Workers is released.
It can be seen from Table–8, there is a continuous increase in index of all the centres
of State series from 2011 to 2013. The movement of index numbers in 2013 varied from
10.08% in Gulbarga to 16.96% in Tumkur. There was continuous rise in index at State
average and also all India average. State Annual average in 2011, 2012, 2013 has been
increased by 40, 53, 83 points respectively as compared to corresponding previous year.
v. (b) Consumer Price Index Numbers for Agricultural Labourers:[CPI-AL]
The Labour Bureau, Shimla has been computing CPI numbers for Agricultural
Labourers for 20 states including Karnataka with the base year 1986-87. CPI-AL is being
utilised for fixation and revision of wages engaged in agricultural occupations under
Minimum Wages Act, 1948. At all India level from 20 States 600 villages have been selected
for the purpose of collecting the retail prices and this data is being utilised for the
computation of index numbers. The collection of retail prices in the selected villages have
been entrusted to Field Operations Division (FOD) of NSSO, Govt. of India.
The CPI Numbers for Agricultural Labourers for the State of Karnataka and All India
with Food and General Index for the year 2000, 2005, 2010, 2011 to 2013 are presented in
Table –9.
100
PoQo
PnQoIn
100
PoQo
Po
PnPoQo
In
Price Trends in Karnataka - 2013 Page 27

Table - 9 Consumer Price Index Numbers for Agricultural Labourers in Karnataka State
and All India for the year 2000, 2005, 2010, 2011 to 2013 (Base year: 1986 - 87=100)
Sl.
No Year
Karnataka All – India
Food General Food General
1 2000 321 311 307 307
(2.10) (3.55) (7.33) (6.89)
2 2005 333 338 341 348
(3.74) (8.68) (11.07) (13.36)
3 2010 579 557 562 553
(73.87) (64.79) (59.66) (54.47)
4 2011 646 634 598 602
(11.57) (13.82) (6.41) (8.86)
5 2012 710 701 638 652
(22.63) (25.85) (13.52) (17.90)
5 2013 828 803 724 735
(16.62) (14.55) (13.48) (12.73)
Note : Figures in bracket indicate percentage variation over previous year. Source : Labour Bureau, Shimla.
Consumer Price Index Numbers for Agricultural Labourers in Karnataka State and All
India, from 2011 to 2013
500
550
600
650
700
750
800
850
Food General Food General
Karnataka All - India
2011
2012
2013
Page 28 Price Trends in Karnataka - 2013

It can be seen from the above table during 2013 in Karnataka, the food index has
increased by 16.62% and the general index by 14.55%. At all India level, the food and the
general index have increased by 13.48% and 12.73% respectively. The percentage variation
was higher in the State as compared to the variation noticed at all India level.
vi. Rural Retail Price Index Numbers
The rural retail prices in respect of 29 essential commodities are being collected by
the District Statistical Offices from each taluk of 2 villages and in each village of 2 selected
shops as on 5th of every month. This data is made use of for preparation of periodicals,
computation of Rural Retail Price Index Numbers and to know that trends of retail prices in
rural areas. This index number are computed with base year 1970. The index numbers series
is based on unweighted diagram. The formula used in computing this index is Simple
Average of Price Relatives = P / n, where =P=price relative= pn/ po*100
Rural Retail Price Index Numbers for the year 2000, 2005, 2010, 2011 to 2013 is
presented in Table – 10.
As can be seen from the table the retail price index of 16 commodities viz Wheat,
Bajra, Ragi, Gramdhal, Coconut, Groundnut oil, Castor oil, Milk, Salt, Mutton, Tea, Coffee,
Firewood, Kerosene oil, Beedi and Washing Soap has shown a continuous rise year from
2011 onwards till the year 2013. The index of Uraddhal has continuously decreased from
2011 to 2013, whereas the index of Mungdhal has decreased in 2011 and 2012. In respect of
other commodities it has shown a fluctuation. But when we look at the index of all
commodities together the retail price index is continuously increased from 2011 till 2013. The
index increase was very high during 2013 as compared to its previous year.
Out of 29 commodities in 2011, index of 7 commodities in 2012, only 4 commodities
in 2013, 5 commodities have been declined.
In 2011, the index of Rice(-4.39%), Turdal(-7.67%), Uraddal (-1.14%), Mungdhal
(-7.32%), Sugar (-6.70%) and Gur(-3.39%) has declined as compared to previous years
whereas in case of Rice, Turdal, Potato, Sugar & Gur the index went up during subsequent
years. The least decline was observed in case of Potato with -0.43%. However, the price
index increase was very steep in respect of Jowar (55.02%) and lowest in respect of Wheat
(5.01%).
Price Trends in Karnataka - 2013 Page 29

Table No - 10 Rural Retail Price Index Numbers in Karnataka for the year 2000, 2005, 2010, 2011 to 2013
(Base year: 1970=100) Sl
No. Commodity 2000 2005 2010 2011 2012 2013
1 Rice 1240 1267 2232 2134 2366 3012 (2.18) (76.16) -(4.39) (10.87) (27.30)
2 Wheat 1072 1134 1937 2034 2203 2445 (5.78) (70.81) (5.01) (8.31) (10.99)
3 Jowar 1545 1669 2946 4567 5520 4897 (8.03) (76.51) (55.02) (20.87) -(11.29)
4 Bajra 1331 1454 2439 2890 3422 3857 (9.24) (67.74) (18.49) (18.41) (12.71)
5 Ragi 760 817 1456 1556 1850 2767 (7.50) (78.21) (6.87) (18.89) (49.57)
6 Turdal 2073 2164 4967 4586 4716 4939 (4.39) (129.53) -(7.67) (2.83) (4.73)
7 Gramdhal 1773 2064 2886 3156 4504 4858 (16.41) (39.83) (9.36) (42.71) (7.86)
8 Uraddhal 2139 1967 4806 4751 4526 4508 -(8.04) (144.33) -(1.14) -(4.74) -(0.40)
9 Mungdhal 1898 2058 5353 4961 4884 5168 (8.43) (160.11) -(7.32) -(1.55) (5.81)
10 Potato 688 958 1628 1621 1786 2262 (39.24) (69.94) -(0.43) (10.18) (26.65)
11 Onion 1520 2297 4685 5007 3736 8985 (51.12) (103.96) (6.87) -(25.38) (137.95)
12 Coconut 993 1359 1324 1885 1898 2030 (36.86) -(2.58) (42.37) (0.69) (6.95)
13 Drychillies 852 827 1743 2188 2096 2205 -(2.93) (110.76) (25.53) -(4.20) (5.20)
14 Groundnut Oil 874 1190 1510 1739 1956 2088 (36.16) (26.89) (15.17) (12.48) (6.75)
15 Coconut Oil 816 957 1060 1304 1469 1450 (17.28) (10.76) (23.02) (12.65) -(1.29)
16 Castor Oil 1137 1299 1926 2345 2520 2538 (14.25) (48.27) (21.75) (7.46) (0.71)
17 Milk 1015 1155 1727 2033 2416 2748 (13.79) (49.52) (17.72) (18.84) (13.74)
18 Sugar 884 1067 1851 1727 1911 2035 (20.70) (73.48) -(6.70) (10.65) (6.49)
19 Gur 1504 2251 3833 3703 4060 4639 (49.67) (70.28) -(3.39) (9.64) (14.26)
20 Salt 2547 3078 5786 7016 7736 8118 (20.85) (87.98) (21.26) (10.26) (4.94)
21 Mutton 1774 2089 2897 3355 3868 4385 (17.76) (38.68) (15.81) (15.29) (13.37)
22 Tea 1939 2037 3687 4478 5141 5580 (5.05) (81.00) (21.45) (14.81) (8.54)
23 Coffee 1990 2154 3505 4233 4810 5233 (8.24) (62.72) (20.77) (13.63) (8.79)
24 Tamarind 1118 1522 1846 2770 3218 3036 (36.14) (21.29) (50.05) (16.17) -(5.66)
25 Firewood 1923 2290 3756 4083 4793 5529 (19.08) (64.02) (8.71) (17.39) (15.36)
26 Kerosene Oil 1188 2467 4546 4924 4930 5150 (107.66) (84.27) (8.32) (0.12) (4.46)
27 Tobbaco 1298 1424 2152 2361 2406 2369 (9.71) (51.12) (9.71) (1.91) -(1.54)
28 Beedi 1711 2093 3192 3756 4610 5256 (22.33) (52.51) (17.67) (22.74) (14.01)
29 Washing Soap 648 704 764 866 890 898 (8.64) (8.52) (13.35) (2.77) (0.90)
All Commodities 1388 1649 2843 3173 3457 3896 (18.80) (72.41) (11.61) (8.95) (12.70)
Note : Figure in bracket indicate percentage variation over previous year. Source : Directorate of Economics & Statistics, Bangalore.
Page 30 Price Trends in Karnataka - 2013

Rural Retail Price Index Numbers in Karnataka from 2011 to 2013
Rural Retail Price Index Numbers in Karnataka from 2011 to 2013
500
1000
1500
2000
2500
3000
3500
2011
2012
2013
2000
3000
4000
5000
6000
7000
8000
9000
2011
2012
2013
Price Trends in Karnataka - 2013 Page 31

In 2012, the index decline was in respect of Uraddal(-4.74%), Mungdhal(-1.55%)
Onion(-24.59%) and Dry chillies (-4.20%).The price index of all other commodities increased
which ranges between the high in respect of Gramdal (42.71%) and the lowest in respect of
Kerosene (0.12%).
In 2013, the index of all commodities increased from 3457 in 2012 to 3896 in 2013, i.e.
by 12.70 percent. During the year 2013, the retail price indices of 24 commodities have
shown an increasing trend, while the indices of all other commodities declined .
When we look at the index of commodities in 2013 over 2012, the highest
percentage increase was noticed in respect of Onion (137.95)% (which has recorded a
maximum decrease in 2012), followed by Ragi (49.57%), Rice(27.30%), Potato (26.65%),
Firewood (15.36%), Gur(14.26%), Beedi(14.01%), Milk(13.74%), Mutton(13.37%),
Bajra(12.71%), Wheat(10.99%), Coffee(8.79%), Tea(8.54%), Gramdal(7.86%), Coconut(6.95%),
Groundnut oil(6.75%), Sugar(6.49%), Mungdhal(5.81%), Drychillies(5.20%), Salt(4.94%),
Turdal(4.73%), Kerosene (4.46%). The lowest increase was noticed in case of Washing soap
and Castor oil with only 0.90% and 0.71% respectively. The index of only five commodities
viz Jowar by (-11.29%), followed by Tamarind(-5.66%), Tobbaco(-1.54%), Coconut Oil
(-1.29%) and Uraddhal(-0.40%) has declined.
vii. Urban Retail Price Index Numbers
The wholesale and retail prices of 20 important commodities are being collected from
20 urban centres and in each centre from 3 selected shops as on Monday by District
Statistical Office. This data is made use for preparation of reviews, periodicals and for
computation of Urban Retail Price Index Numbers and to study the trends of retail prices in
urban areas. These index numbers are computed with the base year 1970=100. As in case of
RRPI Numbers the index numbers are based on unweighted diagram.
The formula used in computing this index is Simple Average of Price Relatives
= P / n, where =P=price relative= pn/ po*100
The Urban Retail Price Index Numbers of 17 commodities for the year 2000, 2005,
2010, 2011 to 2013 are presented in Table – 11.
As can be seen from the table out of 17 commodities in 2011, the index of only 5
commodities viz Rice, Turdal, Sugar, Jaggery, Potato, in 2012 the index of Onion and in
Page 32 Price Trends in Karnataka - 2013

Table No - 11 Urban Retail Price Index Numbers in Karnataka for the year 2000, 2005, 2010, 2011 to 2013
(Base year: 1970=100) Sl
No. Commodity 2000 2005 2010 2011 2012 2013
1 Rice 1274 1332 2246 2241 2569 3347
(2.63) (68.62) -(0.22) (14.64) (30.28)
2 Ragi 932 989 1765 1823 2175 3517
(3.74) (78.46) (24.44) (19.31) (61.70)
3 Wheat 1017 1930 1930 2001 2044 2353
-(32.28) (0.00) (3.68) (2.15) (15.12)
4 Jowar 1229 1404 2295 3575 3847 3740
-(1.42) (63.46) (55.77) (7.61) -(2.78)
5 Turdal 1468 1616 3647 3426 3576 3798
(5.57) (125.68) -(6.06) (4.38) (6.21)
6 Groundnut Oil 818 1095 1391 1629 1836 2053
(0.73) (27.03) (17.11) (12.71) (11.82)
7 Gingelly Oil 910 1070 1084 1201 1344 1404
-(1.31) (1.31) (10.79) (11.91) (4.46)
8 Coconut Oil 714 933 947 1115 1258 1319
-(5.04) (1.50) (17.74) (12.83) (4.85)
9 Sugar 802 986 1645 1550 1764 1805
(4.56) (66.84) -(5.78) (13.81) (2.32)
10 Jaggery 992 1579 2680 2519 2838 3378
-(0.95) (69.73) -(6.01) (12.66) (19.03)
11 Milk 895 1090 1538 1821 2171 2521
(2.48) (41.10) (18.40) (19.22) (16.12)
12 Dry chillies 587 543 1053 1237 1289 1380
(31.12) (93.92) (17.47) (4.20) (7.06)
13 Onion 945 1558 3157 3263 2311 5738
-(14.89) (102.63) (3.36) -(29.18) (148.29)
14 Potato 741 1126 1898 1850 2172 2696
(21.40) (68.56) -(2.53) (17.41) (24.13)
15 Coconut 1286 1880 1678 2395 2505 2717
-(11.97) -(10.74) (42.73) (4.59) (8.46)
16 Firewood 1486 1709 2797 3029 3798 4089
(9.01) (63.66) (8.29) (25.39) (7.66)
17 Charcoal 1352 1688 1114 1941 2331 1483
(15.05) -(34.00) (74.24) (20.09) -(36.38)
All Commodities 1027 1277 1933 2154 2343 2785
(3.21) (51.37) (11.43) (8.77) (18.86)
Note : Figure in bracket indicate percentage variation over previous year. Source : Directorate of Economics & Statistics, Bangalore.
Price Trends in Karnataka - 2013 Page 33

Urban Retail Price Index Numbers in Karnataka from 2011 to 2013
Urban Retail Price Index Numbers in Karnataka from 2011 to 2013
500
1000
1500
2000
2500
3000
3500
4000
2011
2012
2013
500
1500
2500
3500
4500
5500
6500
2011
2012
2013
Page 34 Price Trends in Karnataka - 2013

2013, the index of Jowar and Charcoal showed a declining trend. In respect of other
commodities the index showed a moving trend. Where all commodities put together the
index has shown an increase every year. All commodities index has shown a highest
increase of 18.86% in 2013 as compared to previous year.
During the year 2013, the average URPI which was 2343 in 2012 rose to 2785 in 2013
showing an increase of 442 points or 18.86%. The rise in index is attributed to the increase in
prices of Onion & Ragi.
In 2013, when compared to the index prevailed in 2012, the maximum fall in index
was noticed in respect of Charcoal (-36.38%) and marginally declined in case of Jowar
(-2.78%). The steep increase in case of Onion (148.29%), which had recorded a maximum
decrease in 2012 with -29.18%. The other commodities which has shown a higher rise in
index was Ragi (61.70%) followed by Rice (30.28%), Potato (24.13%), Jaggery (19.03%), Milk
(16.12%), Wheat (15.12%), Groundnut oil (11.82%), Coconut (8.46%), Firewood (7.66%),
Drychillies (7.06%), Turdal (6.21%), Coconut oil(4.85%), Gingelly oil(4.46%), whereas, the
lowest rise was noticed in case of Sugar(2.32%).
* * * * * *
Price Trends in Karnataka - 2013 Page 35


Annexures


AN
NEX
UR
E –
1 K
AR
NA
TAK
A S
TATE
AN
NU
AL
AV
ERA
GE
CO
NSU
MER
PR
ICE
IND
EX F
OR
IN
DU
STR
IAL
WO
RK
ERS
FOR
TH
E YE
AR
201
3 (
Base
yea
r : 1
987-
88=1
00)
Sl.
No
Cen
tres
Ja
n Fe
b M
ar
Apr
M
ay
Jun
Jul
Aug
Se
pt
Oct
N
ov
Dec
A
vera
ge
Wei
ghts
W
t X A
v
1 Ba
ngal
ore
68
0 68
9 69
5 71
9 72
2 73
7 73
7 74
0 74
0 75
0 75
3 74
0 72
5.17
44
.29
3211
7.78
2 Be
lgau
m
733
756
760
779
786
802
812
821
812
802
812
802
789.
75
2.50
19
74.3
8
3 H
ubli-
Dha
rwar
70
2 71
1 70
8 71
7 73
5 74
4 76
5 76
8 76
5 76
2 77
1 76
8 74
3.00
6.
74
5007
.82
4 M
erca
ra
687
697
709
728
737
749
749
755
761
755
774
765
738.
83
2.04
15
07.2
1
5 M
ysor
e 55
3 56
3 56
5 59
8 60
8 61
3 61
0 61
8 63
0 63
3 63
3 63
0 60
4.50
10
.34
6250
.53
6 Be
llary
56
1 56
6 57
0 57
8 58
6 59
5 60
4 61
0 61
5 62
1 62
4 62
6 59
6.33
2.
49
1484
.86
7 Bh
adra
vath
i 60
5 61
4 62
3 63
1 64
0 64
8 65
7 66
4 66
6 67
1 67
5 67
7 64
7.58
3.
91
2532
.04
8 D
avan
gere
65
4 66
2 66
9 67
7 68
6 69
5 70
4 71
2 72
0 72
7 73
3 73
7 69
8.00
2.
99
2087
.02
9 D
ande
li 58
9 59
6 60
3 61
1 62
0 63
0 63
8 64
5 65
2 65
9 66
8 67
5 63
2.17
3.
35
2117
.77
10
Gul
barg
a 53
6 53
6 53
9 54
5 55
3 56
3 57
3 58
3 59
1 59
5 59
9 60
8 56
8.42
2.
97
1688
.21
11
Har
ihar
a 55
7 56
5 57
3 58
2 59
1 60
0 60
9 61
5 61
7 62
3 62
7 63
0 59
9.08
2.
87
1719
.36
12
Has
san
590
590
598
603
612
621
629
638
647
655
664
671
626.
50
2.87
17
98.0
6
13
Man
dya
649
658
667
676
685
693
703
711
719
727
732
734
696.
17
3.05
21
23.3
2
14
Man
galo
re
516
520
528
536
544
552
558
564
574
583
589
594
554.
83
3.41
18
91.9
7
15
Rai
chur
64
3 65
2 66
0 66
8 67
6 68
6 69
6 70
2 71
2 71
9 72
4 72
6 68
8.67
2.
64
1818
.09
16
Tum
kur
479
488
497
505
514
524
533
537
546
552
556
558
524.
08
3.55
18
60.4
8
Stat
e av
erag
e *
10
0.00
67
978.
89
679.
79
A -
1Pr
ice
Tren
ds in
Kar
nata
ka -
2013

AN
NEX
UR
E –
2 C
ON
SUM
ER P
RIC
E IN
DEX
NU
MBE
RS
FOR
IND
UST
RIA
L W
OR
KER
S A
T D
IFFE
REN
T SE
LEC
TED
CEN
TRES
IN K
AR
NA
TAK
A
FOR
TH
E YE
AR
201
3Sl
. N
o C
entr
e N
ame
Jan
Feb
Mar
A
pr
May
Ju
n Ju
ly
Aug
Se
p O
ct
Nov
D
ec
Con
vers
ion
Fa
ctor
STA
TE S
ERIE
S (B
ase
Year
: 19
87-8
8=10
0)
1960
Ser
ies
1 Be
llary
56
1 56
6 57
0 57
8 58
6 59
5 60
4 61
0 61
5 62
1 62
4 62
6 7.
39
2 Bh
adra
vath
i 60
5 61
4 62
3 63
1 64
0 64
8 65
7 66
4 66
6 67
1 67
5 67
7 9.
19
3 D
avan
ager
e 65
4 66
2 66
9 67
7 68
6 69
5 70
4 71
2 72
0 72
7 73
3 73
7 8.
27
4 D
ande
li 58
9 59
6 60
3 61
1 62
0 63
0 63
8 64
5 65
2 65
9 66
8 67
5 -
5 G
ulba
rga
536
536
539
545
553
563
573
583
591
595
599
608
8.26
6 H
arih
ara
557
565
573
582
591
600
609
615
617
623
627
630
8.56
7 H
assa
n 59
0 59
0 59
8 60
3 61
2 62
1 62
9 63
8 64
7 65
5 66
4 67
1 9.
25
8 M
andy
a 64
9 65
8 66
7 67
6 68
5 69
3 70
3 71
1 71
9 72
7 73
2 73
4 7.
92
9 M
anga
lore
51
6 52
0 52
8 53
6 54
4 55
2 55
8 56
4 57
4 58
3 58
9 59
4 9.
31
10
Rai
chur
64
3 65
2 66
0 66
8 67
6 68
6 69
6 70
2 71
2 71
9 72
4 72
6 -
11
Tum
kur
479
488
497
505
514
524
533
537
546
552
556
558
-
CEN
TRA
L SE
RIE
S (B
ase
Year
: 20
01=1
00)
1982
Ser
ies
12
Bang
alor
e 22
3 23
2 23
3 23
9 24
1 24
2 24
2 24
3 24
3 24
6 24
9 24
6 4.
51
13
Belg
aum
22
5 22
6 22
8 23
6 23
7 24
6 24
9 25
2 24
9 24
6 24
7 24
3 5.
02
14
Hub
li-D
harw
ad
234
237
236
239
245
248
255
256
255
254
257
256
4.71
15
Mad
iker
i 22
3 22
6 23
0 23
6 23
9 24
3 24
3 24
5 24
7 24
5 25
1 24
8 4.
47
16
Mys
ore
221
225
226
239
243
245
244
247
252
253
253
252
-
All-
Indi
a 22
1 22
3 22
4 22
6 22
8 23
1 23
5 23
7 23
8 24
1 24
3 23
9 4.
63
Pric
e Tr
ends
in K
arna
taka
- 20
13A
- 2

AN
NEX
UR
E –
3 R
UR
AL
RET
AIL
PR
ICE
IND
EX N
UM
BER
S FO
R T
HE
YEA
R 2
013
(Bas
e ye
ar :
1970
=100
)
Sl.
No.
C
omm
odity
Ja
n Fe
b M
ar
Apr
M
ay
Jun
Jul
Aug
Se
p O
ct
Nov
D
ec
Ann
ual
aver
age
1 R
ice
2620
29
60
2985
30
54
3055
30
60
3112
30
90
3050
30
70
3063
30
22
3012
2
Whe
at
2278
24
26
2431
24
32
2441
24
65
2465
24
88
2395
24
46
2537
25
32
2445
3
Jow
ar
5104
51
08
5051
50
72
4937
48
52
4785
48
22
4763
47
15
4813
47
42
4897
4
Bajr
a 38
34
3657
36
52
3668
38
22
3952
39
53
4045
38
26
3961
38
90
4020
38
57
5 R
agi
2495
26
18
2686
28
21
2827
28
55
2812
28
30
2726
27
87
2904
28
46
2767
6
Turd
al
4942
48
96
4904
49
15
4938
49
65
4914
49
17
4899
49
59
5008
50
06
4939
7
Blac
kgra
m D
al
5086
50
50
4872
48
41
4846
48
75
4803
48
40
4811
47
69
4797
47
06
4858
8
Ura
d D
al
4591
46
04
4500
44
87
4453
44
80
4510
44
89
4452
44
92
4531
45
06
4508
9
Moo
ng D
al
5142
51
02
5027
51
54
5147
51
91
5211
52
16
5152
51
65
5215
52
90
5168
10
Po
tato
21
25
2174
21
62
2136
21
89
2227
22
72
2272
22
28
2174
25
54
2633
22
62
11
Oni
on
5258
63
39
6406
64
65
6519
65
04
7109
10
295
1510
6 15
069
1283
6 99
09
8985
12
C
ocon
ut
1899
19
51
1965
20
12
2022
20
16
2011
20
30
2033
20
32
2161
22
24
2030
13
D
ry C
hilli
es
2014
20
81
2104
21
50
2152
21
81
2241
22
64
2289
22
94
2316
23
72
2205
14
G
roun
dnut
Oil
21
19
2138
21
10
2060
20
71
2067
20
86
2088
20
76
2069
20
75
2093
20
88
15
Coc
onut
Oil
1512
15
16
1467
14
71
1470
14
69
1469
13
72
1361
13
98
1428
14
62
1450
16
C
asto
r Oil
2618
28
24
2761
26
11
2625
26
36
2524
25
62
2307
23
40
2420
22
27
2538
17
M
ilk
2476
25
80
2669
26
96
2714
27
45
2768
27
74
2817
28
40
2907
29
92
2748
18
Su
gar
2107
20
78
2067
20
40
2053
20
43
2030
20
31
2039
20
04
1981
19
44
2035
19
G
ur
4421
44
34
4543
45
72
4612
46
44
4726
47
40
4785
47
86
4748
46
57
4639
20
Sa
lt 80
52
8231
82
69
8277
82
34
8283
81
83
7870
79
42
7932
80
58
8083
81
18
21
Mut
ton
4088
42
77
4389
43
69
4370
43
80
4418
44
33
4469
44
12
4432
45
78
4385
22
Te
a 51
56
5422
55
61
5622
56
89
5622
57
33
5661
54
89
5283
57
78
5944
55
80
23
Cof
fee
4986
51
58
5270
52
69
5289
53
58
5308
51
81
5086
51
19
5300
54
75
5233
24
Ta
mar
ind
3175
30
85
3144
29
99
3044
30
22
2979
29
77
2941
29
70
3005
30
88
3036
25
Fi
rew
ood
5372
54
36
5382
54
62
5534
55
29
5585
55
47
5585
55
92
5652
56
76
5529
26
K
eros
ene
5065
50
66
5223
52
32
5228
51
36
5088
49
60
4878
51
99
5302
54
17
5150
27
To
bacc
o 24
13
2507
24
97
2502
23
78
2367
23
83
2350
22
26
2239
22
44
2327
23
69
28
Beed
i 53
16
5234
52
95
5301
53
08
5309
51
99
5064
49
79
5210
53
74
5483
52
56
29
Was
hing
Soa
p 90
1 91
7 91
2 90
1 90
4 91
1 90
9 89
4 82
6 84
1 92
0 94
1 89
8 A
ll C
omm
oditi
es
3695
37
89
3804
38
13
3823
38
33
3848
39
35
4053
40
75
4078
40
07
3896
A -
3Pr
ice
Tren
ds in
Kar
nata
ka -
2013

AN
NEX
UR
E –
4 U
RBA
N R
ETA
IL P
RIC
E IN
DEX
NU
MBE
RS
FOR
TH
E YE
AR
201
3 (B
ase
year
: 19
70=1
00)
Sl.
No.
C
omm
odity
Ja
n Fe
b M
ar
Apr
M
ay
Jun
Jul
Aug
Se
p O
ct
Nov
D
ec
Ann
ual
aver
age
1 R
ice
3005
32
81
3316
33
67
3367
34
04
3451
34
43
3438
34
08
3370
33
13
3347
2 R
agi
3258
32
77
3467
34
89
3547
35
38
3669
36
60
3610
36
39
3536
35
08
3517
3 W
heat
22
97
2333
23
70
2358
23
16
2299
23
22
2363
23
75
2390
24
06
2402
23
53
4 Jo
war
39
05
3867
37
29
3781
37
30
3664
36
39
3604
35
39
3639
38
69
3914
37
40
5 Tu
r 37
45
3752
37
36
3777
38
10
3815
38
21
3821
38
42
3836
38
25
3793
37
98
6 G
roun
dnut
Oil
20
08
2052
21
09
2110
21
91
2145
20
79
2012
19
73
1993
19
76
1990
20
53
7 G
inge
rly
Oil
1398
13
99
1407
14
09
1372
15
58
1362
13
59
1378
13
85
1406
14
09
1404
8 C
ocon
ut O
il 13
05
1333
13
45
1325
13
48
1338
12
52
1251
13
07
1311
13
35
1380
13
19
9 Su
gar
1887
18
51
1827
18
18
1812
17
72
1797
17
80
1815
17
83
1769
17
45
1805
10
V. J
agge
ry
3091
30
95
3054
32
47
3437
34
86
3513
34
99
3627
35
80
3489
34
22
3378
11
Vi.
Milk
23
09
2407
24
61
2485
25
96
2607
25
99
2513
24
75
2533
25
88
2681
25
21
12
Dry
Chi
llies
12
67
1300
13
23
1371
13
75
1601
15
49
1349
13
48
1359
13
50
1366
13
80
13
Oni
on
3623
41
30
3826
34
54
3367
38
18
4758
74
46
9776
97
64
8985
59
11
5738
14
Pota
to
2545
25
61
2511
25
85
2749
28
29
2857
27
91
2372
23
42
3075
31
31
2696
15
Coc
onut
24
35
2542
26
04
2691
27
13
2785
27
39
2750
28
40
2825
28
26
2855
27
17
16
Fire
Woo
d 37
71
3890
38
69
3926
39
17
4013
41
38
4144
42
05
4265
42
77
4657
40
89
17
Cha
rcoa
l 14
97
1472
14
66
1435
14
53
1453
14
63
1468
14
81
1488
15
20
1604
14
83
All
Com
mod
ities
25
50
2620
26
13
2625
26
53
2713
27
65
2897
30
24
3032
30
35
2887
27
85
Pric
e Tr
ends
in K
arna
taka
- 20
13A
- 4

AN
NEX
UR
E –
5 W
HO
LESA
LE P
RIC
E IN
DEX
NU
MBE
RS
OF
AG
RIC
ULT
UR
AL
CO
MM
OD
ITIE
S IN
KA
RN
ATA
KA
FO
R T
HE
YEA
R 2
013
(Bas
e Ye
ar :
1981
-82=
100)
Sl
. N
o G
roup
/Com
mod
ities
Ja
n Fe
b M
ar
Apr
M
ay
June
Ju
ly
Aug
Se
p O
ct
Nov
D
ec
Ave
rage
I C
EREA
LS
1120
11
68
1153
11
62
1170
11
54
1169
11
40
1181
11
48
1095
11
31
1149
1
Rice
11
70
1234
11
97
1209
12
14
1216
12
37
1203
12
59
1218
11
43
1202
12
09
2 Jo
war
99
4 10
11
1025
10
32
961
959
915
933
929
932
898
921
959
3 Ra
gi
1328
13
79
1399
13
20
1310
12
37
1252
12
29
1254
12
36
1208
11
59
1276
4
Whe
at
886
938
953
957
932
940
930
940
955
953
948
968
942
5 Ba
jra
1230
12
38
1295
13
62
1331
13
01
1249
11
99
1199
11
92
1162
11
72
1244
6
Mai
ze
917
908
933
933
1037
92
8 97
3 94
0 96
3 92
2 92
8 89
9 94
0 II
PU
LSES
11
53
1137
11
58
1142
11
99
1142
11
41
1247
12
32
1243
12
11
1114
11
77
7 Tu
r 11
24
1143
11
55
1106
12
43
1179
11
81
1323
13
31
1330
13
14
1118
12
12
8 Be
ngal
Gra
m
1013
92
3 92
7 93
6 90
0 84
3 82
3 85
7 85
1 81
8 76
6 73
2 86
6 9
Gre
engr
am
1344
12
82
1335
13
60
1325
12
46
1284
13
59
1290
13
88
1350
13
91
1330
10
Bl
ackg
ram
15
17
1559
16
70
1741
16
34
1713
16
45
1834
16
45
1663
15
87
1815
16
69
11
Hor
segr
am
1178
12
85
1271
13
54
1389
13
85
1370
13
76
1476
15
99
1491
14
87
1388
II
I O
ILSE
EDS
1149
11
43
1148
11
26
1109
10
56
1052
97
3 99
6 97
6 97
1 96
7 10
56
12
Gro
undn
ut
1215
12
00
1207
11
81
1162
10
88
1083
98
6 10
09
977
963
947
1085
13
Se
sam
um
1190
12
39
1268
12
32
1241
12
64
1319
13
13
1392
14
79
1679
17
49
1364
14
Sa
fflow
er
1099
11
17
1074
10
74
1063
10
87
1077
10
31
1038
10
32
1002
10
17
1059
15
Su
nflo
wer
49
1 50
2 49
3 49
0 48
9 49
9 50
8 49
8 50
3 47
4 47
6 50
0 49
4 16
C
asto
r 10
32
1074
10
49
1050
94
8 87
1 87
1 92
1 93
7 10
21
921
1065
98
0 17
Li
nsee
d 42
9 42
9 53
2 53
2 53
2 63
1 53
2 53
2 53
2 53
2 53
2 53
2 52
3 IV
G
UR
& S
UG
AR
67
9 66
8 66
9 67
4 68
4 68
7 67
1 67
0 66
5 66
7 66
3 64
4 67
0 18
G
ur
776
754
781
805
817
820
807
816
823
840
821
792
804
19
Leav
y.Su
gar
721
721
721
721
721
721
721
721
721
721
721
721
721
20
Free
.Sal
e.Su
gar
599
586
576
571
586
592
565
556
543
536
538
513
563
V
FIBR
E 71
0 70
2 75
5 75
1 73
9 72
4 72
4 71
0 71
0 65
6 72
3 76
1 72
2 21
C
otto
n K
apas
70
2 69
2 75
6 75
1 73
7 71
8 71
8 70
3 70
2 63
6 71
8 76
3 71
6 22
C
otto
n Li
nt
750
750
750
750
750
750
750
750
750
750
750
750
750
VI
CO
ND
IMEN
TS &
SPI
CES
77
5 78
9 77
6 79
9 75
3 79
9 80
6 84
3 82
9 82
8 83
3 96
6 81
6 23
D
ry C
hilli
es
880
896
921
920
896
955
919
979
957
933
914
1153
94
4 24
C
arda
mum
31
6 32
8 32
3 36
0 31
1 29
9 19
9 23
9 26
5 33
1 32
4 32
0 30
1 25
Pe
pper
21
53
2268
20
18
1821
17
05
1834
20
31
2035
22
87
2576
29
88
2927
22
20
26
Cor
rian
der
992
988
873
998
891
986
1310
12
70
1155
10
44
1071
11
34
1059
V
II
MIS
CEL
LAN
EOU
S 11
59
1155
12
68
1154
11
77
1251
13
13
1458
14
56
1432
13
82
1291
12
91
27
Oni
on
1920
21
84
1680
15
29
1509
19
16
3061
48
97
4850
41
56
4243
23
55
2858
28
Po
tato
85
8 79
5 69
2 77
3 78
7 80
9 85
6 69
5 58
6 64
3 10
53
1066
80
1 29
Ta
mar
ind
984
982
1107
10
06
908
860
836
798
774
730
697
797
873
30
Are
canu
t 85
2 83
1 76
5 78
9 85
5 94
2 91
5 10
16
1030
10
85
1022
10
52
930
31
Coc
onut
53
2 56
1 60
6 64
1 62
3 60
8 58
0 59
1 58
1 63
3 64
4 71
1 60
9 32
C
offe
e 14
52
1423
18
10
1531
15
42
1595
15
68
1600
15
99
1580
14
73
1466
15
53
33
Toba
cco
995
995
995
995
995
955
1243
12
43
1243
12
43
1243
12
43
1116
A
ll C
omm
oditi
es
1024
10
33
1060
10
34
1041
10
40
1054
10
68
1082
10
59
1036
10
26
1046
A -
5Pr
ice
Tren
ds in
Kar
nata
ka -
2013
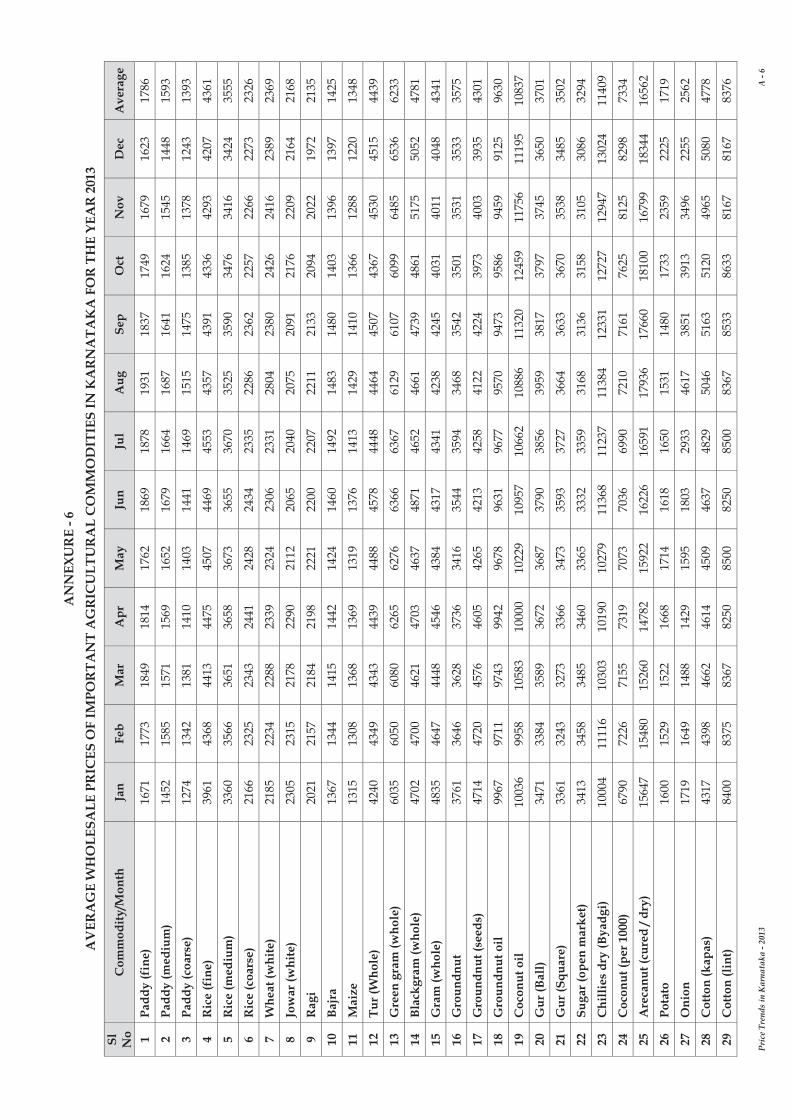
AN
NEX
UR
E - 6
A
VER
AG
E W
HO
LESA
LE P
RIC
ES O
F IM
POR
TAN
T A
GR
ICU
LTU
RA
L C
OM
MO
DIT
IES
IN K
AR
NA
TAK
A F
OR
TH
E YE
AR
201
3 Sl
N
o C
omm
odity
/Mon
th
Jan
Feb
Mar
A
pr
May
Ju
n Ju
l A
ug
Sep
Oct
N
ov
Dec
A
vera
ge
1 Pa
ddy
(fin
e)
1671
17
73
1849
18
14
1762
18
69
1878
19
31
1837
17
49
1679
16
23
1786
2 Pa
ddy
(med
ium
) 14
52
1585
15
71
1569
16
52
1679
16
64
1687
16
41
1624
15
45
1448
15
93
3 Pa
ddy
(coa
rse)
12
74
1342
13
81
1410
14
03
1441
14
69
1515
14
75
1385
13
78
1243
13
93
4 R
ice
(fin
e)
3961
43
68
4413
44
75
4507
44
69
4553
43
57
4391
43
36
4293
42
07
4361
5 R
ice
(med
ium
) 33
60
3566
36
51
3658
36
73
3655
36
70
3525
35
90
3476
34
16
3424
35
55
6 R
ice
(coa
rse)
21
66
2325
23
43
2441
24
28
2434
23
35
2286
23
62
2257
22
66
2273
23
26
7 W
heat
(whi
te)
2185
22
34
2288
23
39
2324
23
06
2331
28
04
2380
24
26
2416
23
89
2369
8 Jo
war
(whi
te)
2305
23
15
2178
22
90
2112
20
65
2040
20
75
2091
21
76
2209
21
64
2168
9 R
agi
2021
21
57
2184
21
98
2221
22
00
2207
22
11
2133
20
94
2022
19
72
2135
10
Bajr
a 13
67
1344
14
15
1442
14
24
1460
14
92
1483
14
80
1403
13
96
1397
14
25
11
Mai
ze
1315
13
08
1368
13
69
1319
13
76
1413
14
29
1410
13
66
1288
12
20
1348
12
Tur (
Who
le)
4240
43
49
4343
44
39
4488
45
78
4448
44
64
4507
43
67
4530
45
15
4439
13
Gre
en g
ram
(who
le)
6035
60
50
6080
62
65
6276
63
66
6367
61
29
6107
60
99
6485
65
36
6233
14
Blac
kgra
m (w
hole
) 47
02
4700
46
21
4703
46
37
4871
46
52
4661
47
39
4861
51
75
5052
47
81
15
Gra
m (w
hole
) 48
35
4647
44
48
4546
43
84
4317
43
41
4238
42
45
4031
40
11
4048
43
41
16
Gro
undn
ut
3761
36
46
3628
37
36
3416
35
44
3594
34
68
3542
35
01
3531
35
33
3575
17
Gro
undn
ut (s
eeds
) 47
14
4720
45
76
4605
42
65
4213
42
58
4122
42
24
3973
40
03
3935
43
01
18
Gro
undn
ut o
il 99
67
9711
97
43
9942
96
78
9631
96
77
9570
94
73
9586
94
59
9125
96
30
19
Coc
onut
oil
1003
6 99
58
1058
3 10
000
1022
9 10
957
1066
2 10
886
1132
0 12
459
1175
6 11
195
1083
7
20
Gur
(Bal
l) 34
71
3384
35
89
3672
36
87
3790
38
56
3959
38
17
3797
37
45
3650
37
01
21
Gur
(Squ
are)
33
61
3243
32
73
3366
34
73
3593
37
27
3664
36
33
3670
35
38
3485
35
02
22
Suga
r (op
en m
arke
t)
3413
34
58
3485
34
60
3365
33
32
3359
31
68
3136
31
58
3105
30
86
3294
23
Chi
llies
dry
(Bya
dgi)
1000
4 11
116
1030
3 10
190
1027
9 11
368
1123
7 11
384
1233
1 12
727
1294
7 13
024
1140
9
24
Coc
onut
(per
100
0)
6790
72
26
7155
73
19
7073
70
36
6990
72
10
7161
76
25
8125
82
98
7334
25
Are
canu
t (cu
red
/ dry
) 15
647
1548
0 15
260
1478
2 15
922
1622
6 16
591
1793
6 17
660
1810
0 16
799
1834
4 16
562
26
Pota
to
1600
15
29
1522
16
68
1714
16
18
1650
15
31
1480
17
33
2359
22
25
1719
27
Oni
on
1719
16
49
1488
14
29
1595
18
03
2933
46
17
3851
39
13
3496
22
55
2562
28
Cot
ton
(kap
as)
4317
43
98
4662
46
14
4509
46
37
4829
50
46
5163
51
20
4965
50
80
4778
29
Cot
ton
(lint
) 84
00
8375
83
67
8250
85
00
8250
85
00
8367
85
33
8633
81
67
8167
83
76
Pric
e Tr
ends
in K
arna
taka
- 20
13A
- 6

AN
NEX
UR
E - 7
A
VER
AG
E R
ETA
IL P
RIC
ES O
F IM
POR
TAN
T A
GR
ICU
LTU
RA
L C
OM
MO
DIT
IES
IN K
AR
NA
TAK
A F
OR
TH
E YE
AR
201
3 Sl
N
o C
omm
odity
/Mon
th
Jan
Feb
Mar
A
pr
May
Ju
n Ju
l A
ug
Sep
Oct
N
ov
Dec
A
vera
ge
1 R
ice
(fin
e)
42
47
46
47
47
47
48
47
48
46
46
44
46
2 R
ice
(med
ium
) 36
38
39
39
39
39
39
38
38
38
37
37
38
3
Ric
e (c
oars
e)
24
26
26
27
27
27
26
26
26
25
25
25
26
4 W
heat
(whi
te)
24
25
26
26
26
26
27
26
27
27
27
28
26
5 Jo
war
(whi
te)
26
26
25
26
24
24
24
24
25
24
25
24
25
6 Ba
jra
17
17
17
17
18
17
18
18
18
17
17
18
17
7 M
aize
15
15
16
16
15
16
17
16
16
16
15
14
16
8
Rag
i 23
24
24
25
25
25
25
25
25
24
23
23
24
9
Gra
m (s
plit)
63
59
57
57
57
55
56
54
55
54
53
53
56
10
Tu
r (sp
lit)
70
70
71
71
71
72
71
71
73
73
71
71
71
11
Gre
engr
am (s
plit)
75
76
76
77
77
79
78
77
78
77
80
80
78
12
Bl
ackg
ram
(spl
it)
69
68
69
69
69
69
69
68
68
70
72
73
69
13
Gur
(sor
t - I
Ball)
38
37
39
40
41
42
43
43
41
41
40
39
40
14
G
ur (s
ort -
II S
quar
e)
37
36
37
39
40
40
42
40
40
41
40
39
39
15
Suga
r (op
en m
arke
t) 38
37
37
36
36
35
35
34
34
34
33
33
35
16
G
roun
dnut
oil
103
103
104
106
106
108
106
107
105
105
102
99
105
17
Cas
tor o
il 91
93
89
90
91
95
93
93
93
95
91
93
92
18
C
ocon
ut o
il 10
5 10
8 10
7 10
8 11
0 11
3 11
2 11
4 11
3 11
5 11
7 11
6 11
2 19
Po
tato
20
19
20
21
21
21
21
20
20
21
26
26
21
20
O
nion
22
21
20
19
20
24
39
55
47
47
42
26
32
21
C
ashe
wnu
t 49
3 49
8 49
8 50
4 50
7 50
8 50
4 51
2 50
6 51
1 50
2 50
9 50
4 22
A
reca
nut (
dry
/ cur
dnut
) 18
5 18
8 19
2 18
8 19
0 19
3 19
7 19
7 19
5 20
1 19
8 20
5 19
4 23
G
hee
(AG
mar
k)
352
356
354
343
347
354
355
358
361
360
360
355
355
24
Tam
arin
d 65
64
63
62
64
66
68
67
68
65
68
66
66
25
C
hilli
es d
ry (B
yadg
i) 11
3 12
3 12
2 12
4 12
5 13
0 13
3 13
6 13
3 13
7 13
7 14
2 13
0 26
G
arlic
58
58
57
58
59
58
60
60
61
61
67
69
61
27
Pe
pper
42
8 42
8 41
6 40
3 40
7 40
5 40
6 41
3 43
9 44
8 46
6 49
2 42
9 28
C
arda
mum
81
0 83
8 90
8 89
7 90
9 88
8 85
5 89
7 89
3 85
5 78
4 67
6 85
1 29
M
utto
n 34
2 34
8 34
6 34
4 34
6 34
4 34
4 34
6 34
8 35
1 35
1 35
5 34
7 30
Eg
g 'A
' gra
de (p
er d
ozen
) 45
46
44
44
45
46
46
46
46
47
47
48
46
31
V
anas
path
i 72
71
73
73
74
73
75
73
73
72
71
70
73
32
K
eros
ine
(per
litr
e)
34
34
35
34
34
33
33
35
34
36
35
35
34
A -
7Pr
ice
Tren
ds in
Kar
nata
ka -
2013