Price Trends Are Similar for Fruits, Vegetables, and Snack ...
29
Economic Research Report Number 55 March 2008 United States Department of Agriculture Economic Research Service Fred Kuchler and Hayden Stewart Price Trends Are Similar for Fruits, Vegetables, and Snack Foods
Transcript of Price Trends Are Similar for Fruits, Vegetables, and Snack ...

Economic Research ReportNumber 55
March 2008
United States Department of Agriculture
Economic Research Service
Fred Kuchler and Hayden Stewart
Price Trends Are Similar for Fruits, Vegetables, and Snack Foods
ww
w.er
s.usda.gov
You can find additional information about ERS publications, databases, and other products at our website.
Visit Our Website To Learn More!
National Agricultural LibraryCataloging Record:
The U.S. Department of Agriculture (USDA) prohibits discrimination in all its programs and activities on the basis of race, color, national origin, age, disability, and, where applicable, sex, marital status, familial status, parental status, religion, sexual orientation, genetic information, political beliefs, reprisal, or because all or a part of an individual's income is derived from any public assistance program. (Not all prohibited bases apply to all programs.) Persons with disabilities who require alternative means for communication of program information (Braille, large print, audiotape, etc.) should contact USDA's TARGET Center at (202) 720-2600 (voice and TDD).
To file a complaint of discrimination write to USDA, Director, Office of Civil Rights, 1400 Independence Avenue, S.W., Washington, D.C. 20250-9410 or call (800) 795-3272 (voice) or (202) 720-6382 (TDD). USDA is an equal opportunity provider and employer.
Kuchler, Fred
Price trends are similar for fruits, vegetables, and snack foods.(Economic research report (United States. Dept. of Agriculture.Economic Research Service) ; no. 55)
1. Fruit—Prices—United States. 2. Vegetables—Prices—United States.3. Snack foods—Prices—United States. I. Stewart, Hayden.II. United States. Dept. of Agriculture. Economic Research Service. III. Title.
HD9220.U62
Photos: PhotoDisc and Comstock.
www.ers.usda.gov
United StatesDepartmentof Agriculture
www.ers.usda.gov
A Report from the Economic Research Service
Economic
Research
Report
Number 55
Price Trends Are Similar for Fruits, Vegetables, and Snack FoodsFred Kuchler and Hayden Stewart
March 2008
Abstract
An increase in the price of fruits and vegetables relative to less healthy foods couldreduce consumers’ incentives to purchase fruits and vegetables and result in less healthydiets. Whether such a change in relative prices and incentives has occurred in the UnitedStates is difficult to prove because of substantial quality improvements in many freshfruits and vegetables. For commonly consumed fresh fruits and vegetables for whichquality has remained fairly constant, analysis of price trends reveals a price declinesimilar to that of dessert and snack foods. This price trend evidence suggests that theprice of a healthy diet has not changed relative to an unhealthy one, although a healthydiet might not include every fresh fruit or vegetable currently available.
Keywords: fresh fruit and vegetable prices, price trends, quality change
Acknowledgments
The authors thank Linda Calvin, Elise Golan, Ephraim Leibtag, Gary Lucier, JamesMacDonald, Abe Tegene, and Jay Variyam (Economic Research Service, U.S. Depart-ment of Agriculture). Thanks also to Mark Bowman (U.S. Bureau of Labor Statistics)and to Parke Wilde (Tufts University). Thanks to Angela Anderson and Tom McDonaldfor their editorial contributions.

Contents
Summary . . . . . . . . . . . . . . . . . . . . . . . . . . . . . . . . . . . . . . . . . . . . . . . . . . iii
Introduction . . . . . . . . . . . . . . . . . . . . . . . . . . . . . . . . . . . . . . . . . . . . . . . . 1
Why Is It Difficult To Say Whether Relative Prices Have Changed? . . . . . . . . . . . . . . . . . . . . . . . . . . . . . . . . . . . . . . . . . . . . . . 3
Changing Produce Quality: Fruits and Vegetables Are More Convenient To Eat . . . . . . . . . . . . . . . . 3
Changing Produce Quality: Fruits and Vegetables Come in Greater Year-Round Variety . . . . . . . . . 4
Price Indices May Not Adequately Account for Quality Change . . . . . 7
Holding Quality Constant: What Can We Learn About How Relative Prices Have Changed? . . . . 9
Price Trends for Dessert and Snack Foods . . . . . . . . . . . . . . . . . . . . . . 10
Price Trends for Fresh Fruits and Vegetables . . . . . . . . . . . . . . . . . . . . 10
Conclusions . . . . . . . . . . . . . . . . . . . . . . . . . . . . . . . . . . . . . . . . . . . . . . . . 17
References . . . . . . . . . . . . . . . . . . . . . . . . . . . . . . . . . . . . . . . . . . . . . . . . . 19
Appendix: CPI Overstates the Rate of Increase in Food Prices, Especially for Fresh Fruits and Vegetables . . . . . . . . . 22
iiPrice Trends Are Similar for Fruits, Vegetables, and Snack Foods / ERR-55
Economic Research Service/USDA

Summary
An increase in the price of fruits and vegetables relative to less healthyfoods could reduce consumers’ incentives to purchase fruits and vegetablesand result in less healthy diets. Whether such a change in relative prices andincentives has occurred in the United States is difficult to prove because ofsubstantial quality improvements in many fresh fruits and vegetables. Forcommonly consumed fresh fruits and vegetables for which quality hasremained fairly constant, analysis of price trends reveals a price declinesimilar to that of dessert and snack foods. This price trend evidence suggeststhat the price of a healthy diet has not changed relative to an unhealthy one,although a healthy diet might not include every fresh fruit or vegetablecurrently available.
What Is the Issue?
In theory, it should be easy to compare food prices from a time when Amer-icans were thinner to current prices and demonstrate whether relative pricesof healthy and less healthy foods have changed. In practice, an increase inthe relative prices of fresh fruits and vegetables is difficult to prove. Stan-dard price comparisons using Consumer Price Index (CPI) numbers suggestthat prices of fresh fruits and vegetables have increased relative to prices ofother foods. However, these numbers have been shown to overstate the rateof price increase for many types of foods, and especially for fresh fruits andvegetables. A primary reason is the difficulty in accounting for qualitychanges, like year-round availability and convenient pre-washed packaging.The question remains whether prices of fresh fruits and vegetables haveincreased over time, holding quality constant.
What Did the Study Find?
Bureau of Labor Statistics’ (BLS) average food price data—not indexnumbers—reveal that, relative to dessert and snack foods, prices haveremained stable for a variety of fresh fruits and vegetables that have not hadsubstantial quality improvements and were commonly consumed in the1980s. Inflation-adjusted price trends for these largely unchanged fruits andvegetables show patterns similar to those of the less healthful foods: pricesfor healthy and unhealthy foods declined at about the same rate relative toall other goods.
Specifically, from 1980-2006, inflation-adjusted prices of chocolate chipcookies, cola, ice cream, and potato chips fell by an average of 0.5-1.7percent each year. During the same period, inflation-adjusted prices of RedDelicious apples, bananas, Iceberg lettuce, and dry beans fell by an averageof 0.8-1.6 percent each year. Inflation-adjusted prices of cabbage, carrots,celery, cucumbers, and peppers fell by an average of 0.5-1.5 percent eachyear, over a slightly shorter period of time. These latter time series aresomewhat shorter because BLS did not report prices for these foods for allyears.
Rising price trends were observed for broccoli and field-grown tomatoes.These trends are not counter-examples, but reveal that the selection process
iiiPrice Trends Are Similar for Fruits, Vegetables, and Snack Foods / ERR-55
Economic Research Service/USDA

was not exclusive enough to screen out all foods that have undergonequality change. Unlike in 1980, today’s consumer expenditures for broccoliare for partially or fully prepared products—washed and bagged florets andother cut products. Similarly, a technological improvement in the late 1980schanged the types of tomatoes grown and their sensory qualities.
The price trend evidence is specific to the foods examined. It neither indi-cates nor suggests that inflation-adjusted prices for all fresh fruits andvegetables are declining similarly. It does suggest that a wide class of unpre-pared fresh fruits and vegetables—those that have not been combined withlabor-saving attributes and those that have long been available year-round—display declining prices along with prices of commonly consumed dessertand snack foods. The price trend evidence suggests that the price of ahealthy diet has not changed relative to an unhealthy diet, although ahealthy diet might not include every fresh fruit or vegetable currently avail-able.
Many innovative fresh fruit and vegetable products have been introduced inrecent years. These newer products account for a growing share of producesold by retailers. The growing availability of such products suggests thatmany consumers value these innovations. A remaining question is whetherlow-income households also share in the benefits provided by foods that aremore convenient and more readily available.
How Was the Study Conducted?
The study used BLS U.S. city average food price data, deflating the monthlytime series price data (1980-2006) by the CPI to construct inflation-adjustedprice trends for 4 dessert and snack foods and 11 fresh fruits and vegetables.Identifying fresh fruits and vegetables that were largely the same product in1980 and 2006 was accomplished by selecting foods with long, mostlyuninterrupted, time series retail price data. Excluded from the study werefoods with seasonal periods each year with no reported prices. The freshfruits and vegetables included Iceberg lettuce, whole carrots, cabbage,celery, Red Delicious apples, bananas, dry beans, cucumbers, peppers, broc-coli, and tomatoes. The desserts and snack foods included chocolate chipcookies, cola, ice cream, and potato chips.
ivPrice Trends Are Similar for Fruits, Vegetables, and Snack Foods / ERR-55
Economic Research Service/USDA

Introduction
Dieticians routinely encourage consumers to eat more fruits, vegetables, andwhole-grain foods and less sugared desserts and salty snacks. Regardless,recent statistics on obesity and dietary intake show that most Americans arenot complying with this advice: the majority of Americans are overweightand approximately a third are obese (Hedley et al., 2004). To meet 2005Dietary Guidelines, typical Americans would need to more than double theircurrent intake of vegetables and whole-grain foods while reducing theirintake of solid fats and added sugars by half (U.S. Department of Healthand Human Services and U.S. Department of Agriculture, 2005).
Many variables influence diet choices. Individuals choose foods based ontaste, convenience, family structure and traditions, age, health status, knowl-edge, and lifestyle. As long as household income and wealth place limits onwhat people can afford, food prices will also shape food choices. Some healthresearchers and policy advocates argue that what really motivates consumersto choose “unhealthy” foods and reject healthy alternatives are relative prices(Brownell and Horgen, 2004; Drewnowski and Darmon, 2005). Healthyfoods, they say, are expensive, and unhealthy foods are cheap.
Americans, however, have not always been so overweight.1 The incidence ofoverweight and obesity has increased sharply since 1980. If relative pricesare responsible for Americans’ weight gain, past relative prices must havebeen different. Here, we examine how prices for select foods have changedover the years. These foods include fresh fruits and vegetables, as well asfoods that should be consumed in moderation, including snack foods.
There is a major hurdle to definitively answering whether relative prices andincentives to choose a healthy diet have changed. When products do notchange, but their prices do, relative price changes indicate that purchaseincentives changed. But when product qualities change, price comparisonscan be meaningless because the products being compared are different.Increases in food convenience and availability, as well as improvements insensory properties, are all elements of what is here described as “quality.”We first show evidence for the magnitude of quality changes in fresh fruitsand vegetables.
The Consumer Price Index (CPI) is the standard tool used for trackingchanges in relative prices. However, the CPI is widely believed to overstatethe rate of inflation when used to examine price trends since the 1980s. Thedegree to which it actually accounts for quality change is among the reasonsposited for this problem and remains an open research question.
Due in part to the ambiguity associated with CPI numbers, we examinelongrun trends in the inflation-adjusted prices of individual food products,selecting those commonly consumed and exhibiting less quality change. Welook for broad patterns across those foods. BLS provides price data on manyfoods every month of the year. To capture longrun trends, not just unique,shortrun events that might lead to temporarily high prices, we used cityaverage monthly prices collected from 1980-2006.
1Obesity was relatively stable from1960-1980, and has shown an upwardtrend since (Flegal et al., 2002). Themost recent studies confirm a longrunupward trend in obesity (Hedley et al.,2004).
1Price Trends Are Similar for Fruits, Vegetables, and Snack Foods / ERR-55
Economic Research Service/USDA

The study builds on work by Alston, Sumner, and Vosti (2006), who exam-ined trends in average prices paid for several foods and discussed the likeli-hood that quality improvements may confound any effort to compare howprices for different foods have changed. We examine the quality changesthat have affected the mix of fresh fruits and vegetables sold at retail overthe past several decades, consider problems associated with inferencesdrawn from the CPI, and then calculate and compare the annual average rateof price change for 15 foods.
2Price Trends Are Similar for Fruits, Vegetables, and Snack Foods / ERR-55
Economic Research Service/USDA

Why Is It Difficult To Say WhetherRelative Prices Have Changed?
Price comparisons for foods at different times would be meaningful and theissue of whether healthy and unhealthy food prices have diverged would beeasily resolved if the foods being priced remained the same. Significantchanges have occurred in the quality of foods sold (Davis and Stewart,2003; Variyam, 2005).2 New attributes are constantly being added to foodssold at retail, so many foods are not the same product from one year to thenext.
Consumers have more choices throughout the store. This is true for foodsfor which dieticians and nutritionists usually urge moderation, such ascalorie-dense desserts and snack foods, as well as for foods usually recog-nized as healthy, such as fresh fruits and vegetables. Kaufman and others(2000) note that through the 1980s and 1990s, produce departmentsexpanded in size. Produce departments took over larger shares of grocerystore space, even as supermarkets became larger to accommodate additionaldepartments such as service meat and seafood, prepared foods, and deliitems. From 1987-97, produce departments nearly doubled the number ofitems sold (stockkeeping units), “…primarily to meet consumers’ demandsfor added convenience, healthy diets, and gourmet and ethnic items.” (p. 3)
Fruit and vegetable products that have only recently been offered for salemay be more expensive because they contain more value-added services. Infact, value added through transportation, processing, wholesaling, andretailing has grown to account for about three-fourths of the retail price offruits and vegetables, on average, compared with about two-thirds in theearly 1980s (Stewart, 2006). These services serve two purposes: increasedconvenience and variety.
Changing Produce Quality: Fruits and Vegetables Are MoreConvenient To Eat
Grocery store freezer cases increasingly contain partially or nearly preparedfoods. Many grocery stores offer completely prepared foods to take awayand some have added restaurants. In effect, retailers are selling items betterdescribed as meals than as foods. They are bundling foods with kitchenwork the consumer would otherwise have to do.
Many newer fresh fruit and vegetable products have grown in popularity andnow account for a significant portion of what households spend on produce.Table 1 shows expenditure shares for three types of vegetables that arepartially or fully prepared. Partially or fully prepared spinach (such aswashed and bagged spinach products), for example, accounted for 65percent of what households spent at supermarkets and other retail foodstoresfor fresh spinach in 2003. Only 35 percent of consumers’ expenditures onfresh spinach went to traditional, bunch spinach in 2003. Similarly, florets,crowns, chips, and other cut products accounted for 52 percent of spendingon broccoli. And, finally, baby carrots, sticks, and other types of peeled andcut carrots accounted for 69 percent of households’ expenditures for fresh
2Annual new food product intro-ductions ranged from 9,000-17,000from 1990-2000 (Harris, 2002).
3Price Trends Are Similar for Fruits, Vegetables, and Snack Foods / ERR-55
Economic Research Service/USDA
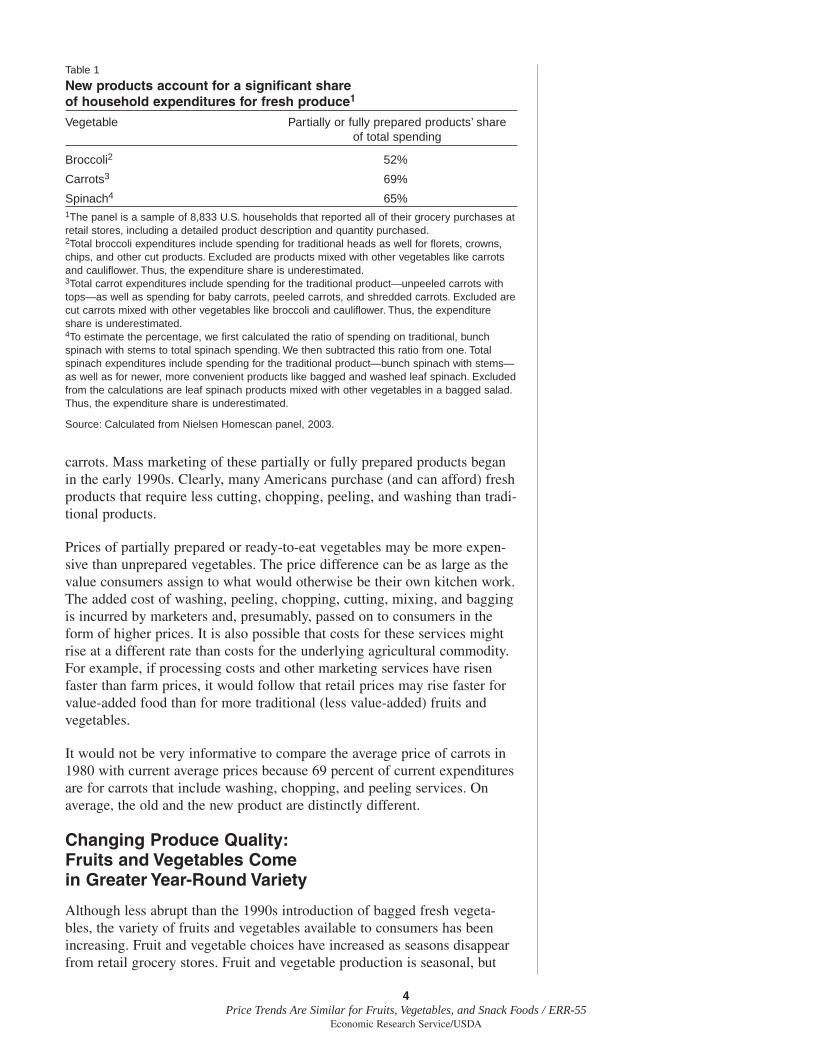
carrots. Mass marketing of these partially or fully prepared products beganin the early 1990s. Clearly, many Americans purchase (and can afford) freshproducts that require less cutting, chopping, peeling, and washing than tradi-tional products.
Prices of partially prepared or ready-to-eat vegetables may be more expen-sive than unprepared vegetables. The price difference can be as large as thevalue consumers assign to what would otherwise be their own kitchen work.The added cost of washing, peeling, chopping, cutting, mixing, and baggingis incurred by marketers and, presumably, passed on to consumers in theform of higher prices. It is also possible that costs for these services mightrise at a different rate than costs for the underlying agricultural commodity.For example, if processing costs and other marketing services have risenfaster than farm prices, it would follow that retail prices may rise faster forvalue-added food than for more traditional (less value-added) fruits andvegetables.
It would not be very informative to compare the average price of carrots in1980 with current average prices because 69 percent of current expendituresare for carrots that include washing, chopping, and peeling services. Onaverage, the old and the new product are distinctly different.
Changing Produce Quality: Fruits and Vegetables Come in Greater Year-Round Variety
Although less abrupt than the 1990s introduction of bagged fresh vegeta-bles, the variety of fruits and vegetables available to consumers has beenincreasing. Fruit and vegetable choices have increased as seasons disappearfrom retail grocery stores. Fruit and vegetable production is seasonal, but
4Price Trends Are Similar for Fruits, Vegetables, and Snack Foods / ERR-55
Economic Research Service/USDA
Table 1
New products account for a significant share of household expenditures for fresh produce1
Vegetable Partially or fully prepared products’ share of total spending
Broccoli2 52%
Carrots3 69%
Spinach4 65%1The panel is a sample of 8,833 U.S. households that reported all of their grocery purchases atretail stores, including a detailed product description and quantity purchased.2Total broccoli expenditures include spending for traditional heads as well for florets, crowns,chips, and other cut products. Excluded are products mixed with other vegetables like carrotsand cauliflower. Thus, the expenditure share is underestimated. 3Total carrot expenditures include spending for the traditional product—unpeeled carrots withtops—as well as spending for baby carrots, peeled carrots, and shredded carrots. Excluded arecut carrots mixed with other vegetables like broccoli and cauliflower. Thus, the expenditureshare is underestimated. 4To estimate the percentage, we first calculated the ratio of spending on traditional, bunchspinach with stems to total spinach spending. We then subtracted this ratio from one. Totalspinach expenditures include spending for the traditional product—bunch spinach with stems—as well as for newer, more convenient products like bagged and washed leaf spinach. Excludedfrom the calculations are leaf spinach products mixed with other vegetables in a bagged salad.Thus, the expenditure share is underestimated.
Source: Calculated from Nielsen Homescan panel, 2003.

plant breeders have long sought to breed varieties that yield crops that canbe marketed early when supplies are typically short and prices high. Theirsuccesses are incremental but numerous. Improvements in storage tech-nology have also made it possible to extend marketing seasons, as invento-ries can be carried longer. Improvements in transportation technology havemade it possible to move produce from where it is in season, domesticallyor overseas, to where it is not.
Table 2 shows monthly U.S. city average retail prices for strawberries(dollars per dry pint deflated by the Consumer Price Index for all urbanconsumers, CPI-U). As also noted by Alston, Sumner, and Vosti (2006), inthe early 1980s, BLS surveyors found strawberries often enough to reportprices for 3-5 months during the spring each year. Presumably, outsidespring months, sellers could supply strawberries only at prices above whatconsumers were willing and able to pay. In recent years, prices werereported all 12 months. Having strawberries available 12 months a yearrather than just 3 months is clearly a quality improvement. Expandingaccess to strawberries during seasons other than spring means nonspringprices have fallen from levels few could afford to prices that many willinglypay. Other fruits and vegetables have undergone the same transformation.Strawberries are one of the more recent to do so. Such increases in accessdiversify consumers’ diets.
5Price Trends Are Similar for Fruits, Vegetables, and Snack Foods / ERR-55
Economic Research Service/USDA
Table 2Average monthly retail prices for strawberries—U.S. city average ($1982-84)1
Year Jan Feb Mar Apr May Jun Jul Aug Sep Oct Nov Dec
1980 0.806 0.743 0.7981981 1.001 0.774 0.709 0.768 0.8411982 1.075 0.963 0.762 0.802 0.7951983 0.738 0.714 0.756 0.8641984 0.889 0.643 0.627 0.752 0.794 0.9021985 0.955 0.757 0.602 0.719 0.8471986 0.585 0.734 0.659 0.767 0.821 0.9851987 0.831 0.729 0.841 0.941 0.8991988 1.014 0.592 0.782 0.794 0.894 0.816 1.0151989 0.996 0.785 0.671 0.850 0.898 0.791 0.8701990 1.280 1.040 0.860 0.604 0.760 0.740 0.821 0.9121991 1.088 0.939 0.822 0.720 0.679 0.696 0.704 0.739 0.7531992 1.032 0.842 0.688 0.595 0.748 0.703 0.841 1.042 0.8391993 1.025 0.877 0.631 0.606 0.738 0.702 0.738 0.793 0.8651994 0.898 0.857 0.617 0.666 0.707 0.731 0.744 0.809 0.8601995 1.276 0.885 0.659 0.749 0.774 0.793 0.914 0.884 0.8561996 1.096 0.972 0.794 0.692 0.611 0.782 0.794 0.740 0.900 0.8901997 0.949 0.823 0.736 0.670 0.757 0.862 0.855 0.923 1.0241998 1.321 1.285 1.080 0.993 0.851 0.867 0.825 0.890 0.898 1.0851999 1.278 1.188 1.054 0.854 0.897 0.825 0.932 1.000 0.989 1.1572000 1.284 1.140 1.066 0.846 0.710 0.689 0.721 0.731 0.815 0.9302001 1.217 1.141 0.982 0.834 0.823 0.837 0.917 1.075 1.123 1.205 1.4302002 1.411 1.202 1.086 0.863 0.849 0.863 0.858 0.938 1.035 1.039 1.2272003 1.176 1.016 0.959 0.914 0.854 0.966 0.997 1.072 1.214 1.3062004 1.340 1.252 1.133 0.884 0.884 0.974 0.860 0.959 0.971 1.362 1.668 1.8932005 1.696 1.223 0.971 0.784 0.888 0.906 0.925 0.920 1.079 1.098 1.136 1.3552006 1.216 0.997 0.909 0.848 0.856 0.813 0.864 0.885 0.995 1.192 1.147 1.4371Prices (dollars per dry pint, per 12 oz.) have been adjusted for inflation using the CPI-U for all items. A blank cell indicates BLS did not providea price in that month.
Source: U.S. Department of Labor, Bureau of Labor Statistics, U.S. city average price data and CPI-U.

It is meaningless to compare prices at different times when an unhealthyfood with unchanging quality is compared to a fresh fruit or vegetable thathas become available in formerly out-of-season months. Changing relativeprices might indicate changing price incentives to choose a healthy diet ormight indicate that better quality produce is being marketed. It is impossibleto exclude either possibility.
Further, some price statistics mask the benefits consumers realize fromreduced seasonality and give the impression that fruits and vegetables arebecoming more expensive. For example, reducing seasonality could makethe average annual strawberry price higher than it would be in the absenceof quality increases. The pattern of prices in table 2 shows that, during thecourse of a year, the first and last reported strawberry prices are typicallyhigher than spring prices. That is, retail prices for strawberries are typicallyhigher at a season’s margin than at the height of the season. The differencemay reflect shorter supply at the margin as well as the increased cost oftransportation.3 Making strawberries available outside of spring monthsrequires more attention to packaging, transporting fruit longer distances, andestablishing new supply chains. All these changes add to the cost of makingstrawberries available at retail stores and raise retail prices.
Extending the marketing season means that tabulated average annual pricesare higher than they otherwise would be if strawberries were available onlyin the spring. The price, however, is higher because consumers are eatingfoods that used to be largely unavailable. Rates of annual price inflationmay also differ because strawberries at the season’s margin embody moremarketing inputs whose costs may rise independently of spring strawberryprices.
3For less fragile commodities, thedifference could also include the costof carrying inventories.
6Price Trends Are Similar for Fruits, Vegetables, and Snack Foods / ERR-55
Economic Research Service/USDA
Price Indices May Not AdequatelyAccount for Quality Change
The standard method for analyzing price trends examines movements inprice indices. BLS constructs price indices, the CPI, and indices of a widevariety of goods precisely so price trends can be examined and changes inrelative prices over time may be measured. One such index, the food andbeverage price index, is built from a variety of food-related indices. Theseinclude the index for fresh fruits and vegetables, among others.
BLS calculates the CPI from month-to-month movements in price changes for asample of goods and services. This sample reflects the consumption sector ofthe U.S. economy and includes tens of thousands of items bought for day-to-day living. The importance of any particular good or service is proportional tothe share of total consumer spending represented by that item. That is, monthlymovements in the CPI are derived from weighted averages of monthly pricechanges of the sampled items. For example, frequently purchased fresh fruit andvegetable products, such as baby carrots and bagged spinach, are likely to beamong items underlying the CPI. Over time, these products have accounted fora larger share of consumers’ expenditures on fresh fruits and vegetables (startingfrom zero in the early 1990s). Price changes in these items would now have agreater effect on the CPI for fresh fruits and vegetables than in early years.
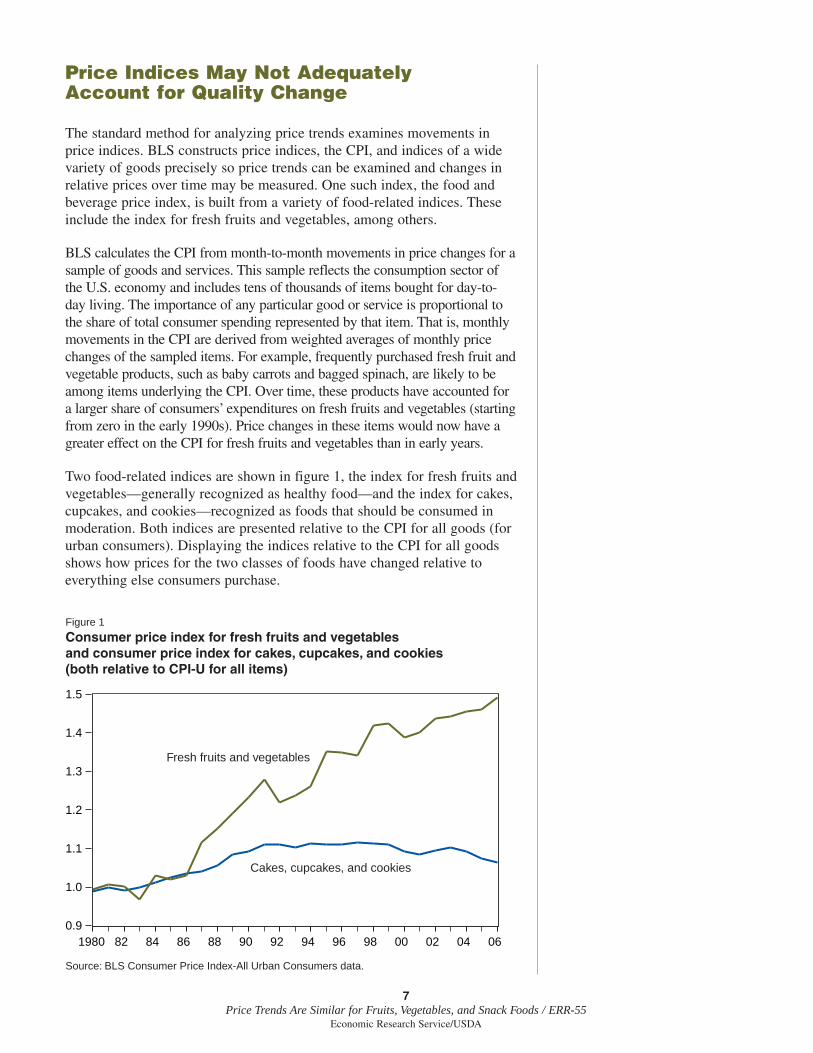
Two food-related indices are shown in figure 1, the index for fresh fruits andvegetables—generally recognized as healthy food—and the index for cakes,cupcakes, and cookies—recognized as foods that should be consumed inmoderation. Both indices are presented relative to the CPI for all goods (forurban consumers). Displaying the indices relative to the CPI for all goodsshows how prices for the two classes of foods have changed relative toeverything else consumers purchase.
7Price Trends Are Similar for Fruits, Vegetables, and Snack Foods / ERR-55
Economic Research Service/USDA
0.9
1.0
1.1
1.2
1.3
1.4
1.5
1980 82 84 86 88 90 92 94 96 98 00 02 04 06
Figure 1
Consumer price index for fresh fruits and vegetables and consumer price index for cakes, cupcakes, and cookies (both relative to CPI-U for all items)
Source: BLS Consumer Price Index-All Urban Consumers data.
Fresh fruits and vegetables
Cakes, cupcakes, and cookies

The line plots clearly show that, compared with all other goods purchased,Americans are paying relatively more for fresh fruits and vegetables nowthan they did 27 years ago. The indices were constructed so they wouldeach equal 100 during the 1982-84 base period. Over the course of 27 years,the fresh fruits and vegetables index rose 49 percent. By contrast, the priceindex for cakes, cupcakes, and cookies increased until the early 1990s, andthen decreased, leaving it 6 percent higher in 2006 than in 1980. In 2006,the fresh fruits and vegetables index stood 40 percent higher than the indexfor cakes, cupcakes, and cookies. The graph suggests that prices for healthyfresh fruits and vegetables are diverging from those for less healthy cakes,cupcakes, and cookies.
However, the CPI is widely believed to overstate the rate of inflation overmuch of the time period shown in figure 1. That is, prices have not risen asfast as the CPI suggests. The degree to which the CPI accounts for the valueconsumers place on quality improvements is among the reasons posited forthis problem. Quality changes could be problematic for many food-relatedindices, such as that for cakes, cupcakes, and cookies. But, among foods,the fresh fruits and vegetables index is believed to be the component mostlikely to overstate price increases (see “Appendix: CPI Overstates the Rateof Increase in Food Prices, Especially for Fresh Fruits and Vegetables”).
8Price Trends Are Similar for Fruits, Vegetables, and Snack Foods / ERR-55
Economic Research Service/USDA

Holding Quality Constant: What Can We Learn About HowRelative Prices Have Changed?
Consumers may place value on the increased variety of foods available aswell as on the convenience of many of these foods. If we could net out thevalue of the improved quality, we would hold quality constant and pricecomparisons would still be meaningful. To remove the value of qualityimprovements from price comparisons, the price of the improved productwould have to be adjusted downward by the value consumers place on thequality of the improvement. In practice, such a task is not trivial and, so far,most price statistics do not incorporate the notion.
Tracking changes in the prices of many different foods is an alternative toexamining price indices. Our approach is to look at price trends for foods thathave not undergone substantial quality change. Foods considered for selectionmust have been commonly consumed in the 1980s. A long time series on theprice of each food must also be available. Since we chose foods that we hopedid not change much, we cannot extrapolate our results to all food prices. Thefood prices we examine are not representative of all food prices. However,results will point to whether relative prices have changed.
BLS reports monthly retail prices going back to 1980 for many specificfoods, such as Red Delicious apples and broccoli. This report uses a subsetof the U.S. city average price series. An attractive feature of these data isthat BLS maintains each price series as long as its probability-basedsampling generates sufficient observations to report prices reliably. Withlong time series, researchers can also see how relative prices have changedover time and how consumers’ ability and incentive to choose a healthy dietmay have changed. Long time series reveal consumers’ changing ability andincentive to alter dietary quality without being confounded by unusual orunique, shortrun events (like a freeze in California’s Central Valley thatleads to a temporary short supply of oranges and unusually high prices).
There are many reasons why the price trends we examine might displaydifferent patterns than the price indices. First, even if we interpret trends inprice indices as conclusive evidence that Americans pay more annually forfresh fruits and vegetables, that the index for fresh fruits and vegetables hasbeen rising means only that many fresh fruit and vegetable prices have beenrising. The rising index does not necessarily mean that prices for all freshfruits and vegetables are rising equally. Like any average, the index iscomposed of a diverse set of movements.
Second, we will be examining average price trends for foods with relativelyless quality change than newer fresh fruit and vegetable products. Moretraditional foods embody a smaller quantity of marketing inputs than do thenewer foods, which are likely to comprise a growing share of the CPI.
Another factor may be that BLS accounts differently for changes in theeconomy, such as the mix of retail outlets at which consumers shop, whencalculating price indices and average price data. Many analysts have arguedthat the growth of “big box” retailers, like Wal-Mart, has dampened infla-
9Price Trends Are Similar for Fruits, Vegetables, and Snack Foods / ERR-55
Economic Research Service/USDA

tionary price increases, but that effect is not fully incorporated in the CPI (seeReinsdorf, 1993; Leibtag, 2006). Using household purchase data, Leibtag(2006) shows that for a wide class of dairy foods, eggs, and butter/margarine,the CPI yielded larger estimates of price inflation than did average price data.4
Price Trends for Dessert and Snack Foods
Among the dessert and snack foods tracked by BLS, four met the require-ments of a long time series (monthly prices from January 1980 throughDecember 2006): chocolate chip cookies, potato chips, ice cream, and cola.Figures 2-5 show time plots of prices deflated by the consumer price index(CPI-U) along with corresponding linear trend lines.
All the trend lines fall, left to right, indicating that inflation-adjusted priceshave declined. Relative to the entire bundle of all other goods consumers buy,desserts and snack foods have become less expensive. Table 3 shows how fastprices have fallen each year—average annual percentage changes in inflation-adjusted prices.5 For chocolate chip cookies, potato chips, ice cream, and cola,prices declined from 0.5-1.7 percent per year.6 Over the course of a year, a 1.5-percent decline in price might not have a major influence on potato chipconsumption. Over 27 years, an annual average decrease of 1.5 percent impliesthat prices would be almost a third lower than at the outset.
Several foods display periods in which prices deviated substantially fromlong-term trends. Ice cream prices fell for many years and then rose rapidlyduring the 1990s. While it is difficult to call a decade-long rise in prices ashortrun event, the longrun trend still gives the appearance of falling prices,just as it does for other dessert and snack foods.
Price Trends for Fresh Fruits and Vegetables
The BLS also provides average prices for an extensive list of fruits andvegetables. We selected items for which a long time series of data are avail-able and for which BLS has been reporting prices for each month of theyear. Satisfying this condition implies that we will be looking at foodsroutinely consumed year-round (they take up significant grocery store shelfspace and BLS easily finds them in grocery stores) and always compete forconsumers’ dollars. To that end, we eliminated from consideration priceseries so seasonal there were periods each year with no reported prices.
From among the fresh fruits and vegetables category for which this aspectof seasonality was long ago resolved, we further chose 11 items thatresearchers and health policy advocates might also consider “healthy.” Ourlist includes apples, bananas, broccoli, cabbage, carrots, celery, cucumbers,dry beans, lettuce, peppers, and tomatoes. While the list includes one deepgreen vegetable, broccoli, we wanted to include other foods widely recog-nized as “healthy,” such as romaine lettuce, also a deep green leafyvegetable. Unfortunately, the data on romaine lettuce were not sufficient.While our list might not include all the commodities dieticians and nutri-tionists point to first as being most “healthy,” they are all clearly less caloriedense than the snack foods and desserts we examined. The fruits andvegetables compare favorably on their content of salt, refined sugar, fat, andcholesterol.
4Many of the price observationsincorporated into BLS average pricedata are likely to come from nontradi-tional, “big box” outlets. It followsthat a decrease (increase) in averageprices over time does not necessarilymean that the same items are availableat traditional retail outlets for less(more) money. But our concern is withprices consumers face, not withwhether they have to switch the storesthey patronize.
10Price Trends Are Similar for Fruits, Vegetables, and Snack Foods / ERR-55
Economic Research Service/USDA
5The ordinary least squares regres-sion ln Pt = β0 + β1t + εt , εt~N(0, σ2), where ln Pt is the naturallogarithm of average monthly price(deflated by the CPI-U) at time t, wasused to calculate the annual averagepercentage rate of price change. Theaverage monthly rate of price changewas calculated from the estimated coef-ficients as exp(β1)-1 and the annualaverage percentage rate of price changewas approximated as 12(exp(β1)-1).
6The cola series is relatively short,beginning in July 1995 (138 observa-tions, compared to 324 for the seriesbeginning in 1980). However, Putnamand Allshouse (1999) provided annualprice data for a similar series back to1970 (carbonated soft drinks, exclud-ing diet cola). Although their data arenot monthly, they do allow us to exam-ine longrun price trends, and we canexamine the 1980-95 period, theperiod for which BLS providesmonthly price data on chocolate chipcookies, potato chips, and ice cream,but not for cola. Deflating the averageannual prices for carbonated softdrinks by the CPI-U (Base Period:1982-84=100) reveals that prices fellat an annual rate of 1.8 percent from1980 to 1995. That is, the calculatedrate of decrease for the 1980-1995period (derived from annual observa-tions) is about the same as the calcu-lated rate of decrease for the1995-2006 period (derived frommonthly observations).

11Price Trends Are Similar for Fruits, Vegetables, and Snack Foods / ERR-55
Economic Research Service/USDA
Table 3
Long-term changes in retail dessert and snack food prices
Food item Average annual percentage change in inflation-adjusted price
Chocolate chip cookies, 1980-2006 -1.3Potato chips, 1980-2006 -1.5Ice cream, 1980-2006 -0.5Cola, 1995-2006 -1.7
Source: ERS calculations using BLS U.S. city average price data and CPI-U.
Figure 2
Chocolate chip cookies: inflation-adjusted prices and trendline
Source: BLS U.S. city average price data and CPI-U.
Figure 3
Potato chips: inflation-adjusted prices and trendline
Source: BLS U.S. city average price data and CPI-U.
1.2
1.4
1.6
1.8
2.0
2.2
1980 82 84 86 88 90 92 94 96 98 00 02 04 06
Dollars per pound, $1982-84
1.6
1.8
2.0
2.2
2.4
2.6
1980 82 84 86 88 90 92 94 96 98 00 02 04 06
Dollars per 16 oz., $1982-84
Figure 4
Cola (nondiet): inflation-adjusted prices and trendline
Source: BLS U.S. city average price data and CPI-U. BLS beganreporting cola prices in 1995.
Figure 5
Ice cream (prepackaged, bulk, regular): inflation-adjusted prices and trendline
Source: BLS U.S. city average price data and CPI-U. Missing valuereflects a month that BLS did not report an ice cream price.
Dollars per 2 liters, $1982-84 Dollars per half-gallon, $1982-84
1.6
1.7
1.8
1.9
2.0
2.1
2.2
2.3
2.4
1980 82 84 86 88 90 92 94 96 98 00 02 04 06.52
.56
.60
.64
.68
.72
1996 97 98 99 00 01 02 03 04 05 06

Table 4 shows average annual rates at which fruit and vegetable prices havebeen changing. The table is divided into three parts to reflect the evidenceeach commodity yields.
There are four commodities with long, uninterrupted time series that showinflation-adjusted prices declining at average annual rates similar to what weobserved for snack foods and desserts. These include apples, bananas, lettuce,and dry beans (figs. 6-9). The price series for dry beans is, like the cola priceseries, somewhat shorter than others. The series gives the appearance of twodistinct regimes: sharply declining prices through 2001 and trendless after-ward. Nevertheless, when we compare prices from the 1990s with prices fromthe 2000s, it is obvious that recent prices are distinctly lower.
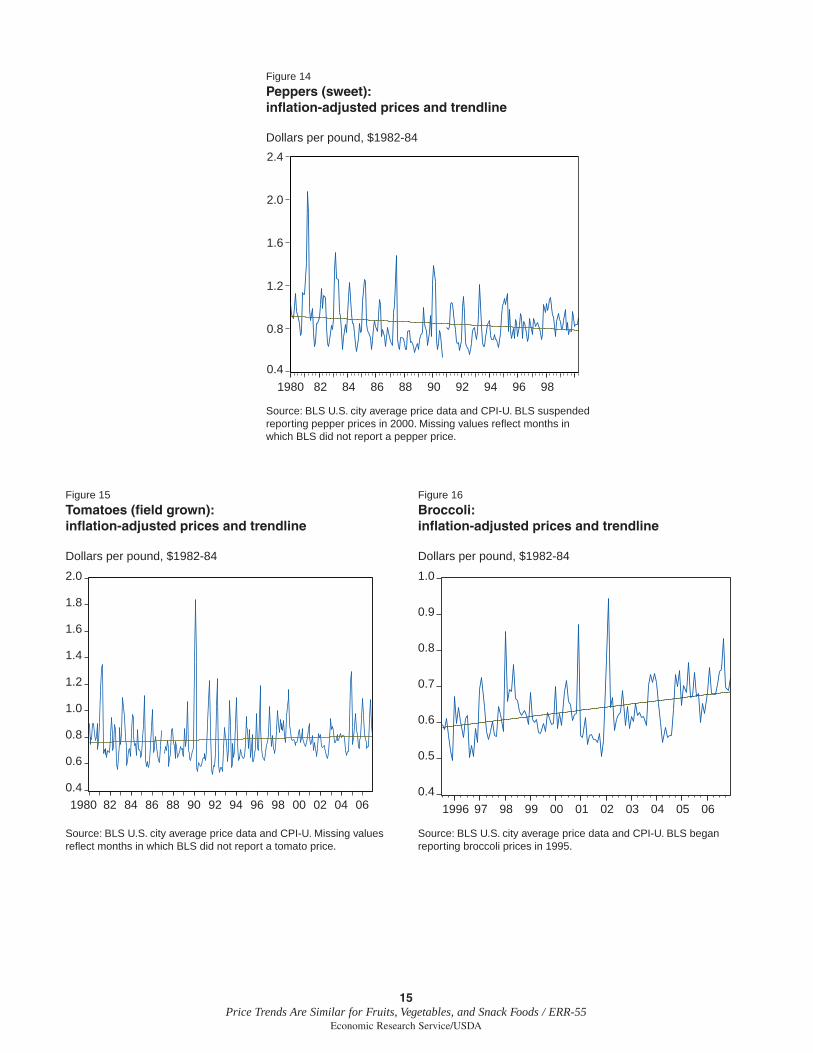
Other vegetable prices display the same pattern, although over a shortertime period. Inflation-adjusted prices for carrots, cabbage, celery, cucum-bers, and peppers all show declining trends (figs. 10-14). Average rates ofdecline are comparable with other fruits and vegetables, as well as withsnack foods and desserts. BLS, however, suspended reporting average pricesfor these five commodities in 2000.7 One likely explanation for this suspen-sion was that, by 2000, expenditures for bagged carrots, bagged spinach,and prepared salads accounted for a large share of produce sales. BLS datacollectors priced these newer products with greater frequency. Under BLS’ssampling method, with probability proportional to share of sales, the relia-bility of the older series was increasingly difficult to maintain. BLS wasshifting its survey resources to the most commonly consumed vegetables(and those taking more grocery store shelf space).8 The change in reportingreflects a large departure in consumer purchase patterns.
At first glance, broccoli and tomatoes appear to be counter-examples,displaying rising trends in inflation-adjusted prices (figs. 15-16).9 Risingprices appear to be systematic, not just high prices over a few months.However, the way in which commodities have been defined for governmentstatistical purposes leads to the conclusion that they may not really becounter-examples.
12Price Trends Are Similar for Fruits, Vegetables, and Snack Foods / ERR-55
Economic Research Service/USDA
Table 4
Long-term changes in retail produce prices
Average annual percentage change inFood item inflation-adjusted (CPI-U) price
Apples (Red Delicious), 1980-2006 -1.1Bananas, 1980-2006 -1.6Lettuce (Iceberg), 1980-2006 -0.9Dry beans (all types, sizes), 1995-2006 -0.8
Suspended price seriesCarrots (short trimmed and topped), 1980-2000 -0.9Cabbage, 1980-2000 -0.7Celery, 1980-2000 -1.5Cucumbers, 1980-2000 -0.8Peppers, 1980-2000 -0.5
Possible counter-examplesTomatoes (field-grown), 1980-2006 0.3Broccoli, 1995-2006 1.4Source: ERS calculations using BLS U.S. city average price data and CPI-U.
7BLS resumed publishing averageprices for almost all of these foods in2006.
8BLS’s primary goal is mainte-nance of the CPI and its major compo-nents, like the vegetable CPI, ratherthan individual food prices.
9BLS also reports a complete priceseries for grapefruit—monthly priceseach month since January 1980. Weexcluded grapefruit from considerationbecause conclusions drawn from esti-mating a longrun trend depend onwhether data from 2004-2006 areincluded. Including that period pointsto increasing prices, while excluding itpoints to falling prices. Perez andPollack (2007) indicated the 2004-2005 period was unusual. They attrib-ute a loss in citrus acreage in Floridaover those years to the spread of citruscanker and major hurricanes that hitthe State.

13Price Trends Are Similar for Fruits, Vegetables, and Snack Foods / ERR-55
Economic Research Service/USDA
Figure 6
Apples (Red Delicious): inflation-adjusted prices and trendline
Source: BLS U.S. city average price data and CPI-U. Missingvalues reflect months that BLS did not report an apple price.
Figure 7
Bananas: inflation-adjusted prices and trendline
Source: BLS U.S. city average price data and CPI-U. Missing valuesreflect months that BLS did not report a banana price.
Dollars per pound, $1982-84 Dollars per pound, $1982-84
0.4
0.5
0.6
0.7
0.8
0.9
1.0
1980 82 84 86 88 90 92 94 96 98 00 02 04 06.20
.24
.28
.32
.36
.40
.44
.48
1980 82 84 86 88 90 92 94 96 98 00 02 04 06
Figure 8
Lettuce (Iceberg): inflation-adjusted prices and trendline
Source: BLS U.S. city average price data and CPI-U. Missingvalues reflect months that BLS did not report a lettuce price.
Figure 9
Dry beans (all types and sizes): inflation-adjusted prices and trendline
Source: BLS U.S. city average price data and CPI-U. BLS began reporting dry bean prices in 1995.
Dollars per pound, $1982-84 Dollars per pound, $1982-84
.38
.39
.40
.41
.42
.43
.44
.45
.46
.47
1996 97 98 99 00 01 02 03 04 05 06
0.3
0.4
0.5
0.6
0.7
0.8
0.9
1.0
1.1
1980 82 84 86 88 90 92 94 96 98 00 02 04 06

14Price Trends Are Similar for Fruits, Vegetables, and Snack Foods / ERR-55
Economic Research Service/USDA
Figure 12
Celery: inflation-adjusted prices and trendline
Source: BLS U.S. city average price data and CPI-U. BLS suspendedreporting celery prices in 2000.
Figure 13
Cucumbers: inflation-adjusted prices and trendline
Source: BLS U.S. city average price data and CPI-U. BLS suspendedreporting celery prices in 2000. Missing values reflect months inwhich BLS did not report a cucumber price.
Dollars per pound, $1982-84 Dollars per pound, $1982-84
.2
.3
.4
.5
.6
.7
.8
1980 82 84 86 88 90 92 94 96 98
.3
.4
.5
.6
.7
.8
.9
1980 82 84 86 88 90 92 94 96 98
Figure 10
Carrots (short trimmed and topped): inflation-adjusted prices and trendline
Source: BLS U.S. city average price data and CPI-U. BLS suspendedreporting carrot prices in 2000.
Figure 11
Cabbage: inflation-adjusted prices and trendline
Source: BLS U.S. city average price data and CPI-U. BLS suspended reporting cabbage prices in 2000.
Dollars per pound, $1982-84 Dollars per pound, $1982-84
.2
.3
.4
.5
.6
.7
1980 82 84 86 88 90 92 94 96 98 00.25
.30
.35
.40
.45
.50
1980 82 84 86 88 90 92 94 96 98 00
15Price Trends Are Similar for Fruits, Vegetables, and Snack Foods / ERR-55
Economic Research Service/USDA
Figure 14
Peppers (sweet): inflation-adjusted prices and trendline
Source: BLS U.S. city average price data and CPI-U. BLS suspendedreporting pepper prices in 2000. Missing values reflect months in which BLS did not report a pepper price.
Dollars per pound, $1982-84
0.4
0.8
1.2
1.6
2.0
2.4
1980 82 84 86 88 90 92 94 96 98
Figure 15
Tomatoes (field grown): inflation-adjusted prices and trendline
Source: BLS U.S. city average price data and CPI-U. Missing valuesreflect months in which BLS did not report a tomato price.
Figure 16
Broccoli: inflation-adjusted prices and trendline
Source: BLS U.S. city average price data and CPI-U. BLS began reporting broccoli prices in 1995.
Dollars per pound, $1982-84 Dollars per pound, $1982-84
0.4
0.5
0.6
0.7
0.8
0.9
1.0
1996 97 98 99 00 01 02 03 04 05 06
0.4
0.6
0.8
1.0
1.2
1.4
1.6
1.8
2.0
1980 82 84 86 88 90 92 94 96 98 00 02 04 06
There are limits to BLS’s commodity definitions. Unlike the definitionsBLS uses for apples (Red Delicious) or lettuce (Iceberg), broccoli and toma-toes allow for a wide range of possibilities. For broccoli, prices reported byBLS include head broccoli (with stems), crowns, and bags of washedflorets. As shown in table 1, with increasing demands for prepared foods,the current mix of products has shifted away from just heads and towardcrowns and florets.
For tomatoes, Cook and Calvin (2005) found that vine ripe and maturegreen tomatoes shifted in importance, with vine ripe becoming the preferredround field tomato in retail channels and mature green being used in foodservice. They described the market history as follows:
Vine ripe tomatoes were not always strong competition for maturegreen tomatoes in the retail sector. Before the early 1990s, vine ripetomatoes had poor shelf-life characteristics, compared with maturegreen tomatoes. In the late 1980s, a California firm and a fewMexican firms in Sinaloa began growing extended shelf life (ESL)vine ripe tomatoes. These new vine ripe tomatoes had better colorthan mature green tomatoes and held up just as well, a majorimprovement over the softer, older varieties. (p. 53)
Over the entire 1980-2006 period, inflation-adjusted prices for tomatoesincreased, on average, at an annual rate of 0.3 percent. The shift may not bevisually obvious in the tomato price trendline. But, when we allow for achange in the late 1980s, statistics reveal the shift. Inflation-adjusted tomatoprices from January 1980 through December 1988 declined at an annual rateof 2.1 percent. From January 1989 through December 2006, pricesincreased at an annual rate of 0.8 percent. It is possible that tomato priceswere generally declining until consumers were offered a product with bettersensory qualities, and the quality change was responsible for the upwardprice trend.
16Price Trends Are Similar for Fruits, Vegetables, and Snack Foods / ERR-55
Economic Research Service/USDA

Conclusions
Food attributes change over time, making price comparisons at differenttimes difficult to interpret. Thus, to definitively answer whether changingrelative prices of healthy and unhealthy foods are responsible for Ameri-cans’ current weight problems is an impossible task. For commonlyconsumed fresh fruits and vegetables for which quality has remained fairlyconstant, analysis of price trends reveals price declines similar to those ofdessert and snack foods.
A healthy diet might include only a subset of fresh fruits and vegetables. Ahealthy diet could conceivably be composed of fresh fruits and vegetablesthat are not partially or fully prepared. Such a diet might include fruits andvegetables that have been on the market for many years, without changes inseasonal availability. In effect, a healthy diet might be exactly what wasavailable to consumers years ago, without changes in quality. Thus, theprice trend evidence suggests that the price of a healthy diet has notchanged relative to an unhealthy one, although a healthy diet might notinclude every fresh fruit or vegetable currently available.
Fresh fruits and vegetables that have undergone substantial quality changeaccount for a growing share of produce sold by retailers. That limits ourresults, but also points to the widespread benefits of quality change. Productinnovations have widespread benefits if the new products remain on themarket. Most product innovations fail the test of the market and disappearquietly. Bagged, washed, and cut broccoli florets have met the test of themarket: many consumers are willing to pay for the services embodied inthese products and do so routinely. Also, December strawberries havesurvived the test of the market: many consumers are willing to pay themarket price for strawberries in December even though the price must coverthe cost of a more complex supply chain in December than in May.
Innovative fresh fruit and vegetable products may improve Americans’health if those products increase fruit and vegetable consumption. Baggedand washed vegetables might be more expensive than traditional products,and December strawberries might be more expensive than May strawberries.As long as consumers purchase innovative products, they must be gettingmore benefit from their expenditures than they did in the past—that is theonly rational explanation for consumers’ voluntarily altering their grocerypurchases. Products that reduce time devoted to kitchen labor pay for them-selves, for some consumers. Many consumers value additional fresh fruitand vegetable choices in winter months. Offering consumers ever-largerbenefits above what they are willing to pay should induce them to add to thequantity of fresh fruits and vegetables in their diets. Despite rising inflation-adjusted prices for broccoli and strawberries, in recent years Americanshave been consuming more of both (U.S. Department of Agriculture,Economic Research Service, 2007).
Of course, some households may be unwilling to pay for additional conven-ience or for products to be available year round. Lower income householdsmight select foods primarily on the basis of price. If so, the benefits to thesehouseholds of quality change are less certain. We might expect lower
17Price Trends Are Similar for Fruits, Vegetables, and Snack Foods / ERR-55
Economic Research Service/USDA

income households to concentrate their purchases on more traditionalproduce, and therefore not realize any benefits from quality change.However, even if value-added produce, measured in pounds, is generallymore expensive to buy than traditional produce, value-added produce maystill be less expensive to eat on a per-serving basis. In the case of broccoli,some consumers may treat stems as a waste product. Florets may be cheaperto consume on a per serving basis if the consumer discards the stem (Reed,Frazao, and Istokowitz, 2004).
Future research and debate over the costliness of healthy foods needs tofocus on whether low-income households share in the benefits provided byfoods that are more convenient and more readily available. These foods canappear more expensive, but may not be so.
18Price Trends Are Similar for Fruits, Vegetables, and Snack Foods / ERR-55
Economic Research Service/USDA

References
Alston, Julian M., Daniel A. Sumner, and Stephen A. Vosti. “AreAgricultural Policies Making Us Fat? Likely Links between AgriculturalPolicies and Human Nutrition and Obesity, and Their PolicyImplications,” Review of Agricultural Economics, 28(2006):313-322.
Boskin, Michael J., E. Dulberger, R. Gordon, Z. Griliches, and D.Jorgenson. Toward a More Accurate Measure of the Cost of Living, Finalreport to the Senate Finance Committee, December 4, 1996. Available athttp://www.ssa.gov/history/reports/boskinrpt.html.
Brownell, Kelly D., and Katherine Battle Horgen. Food Fight: The InsideStory of the Food Industry, America’s Obesity Crisis, and What We CanDo About It, New York: The McGraw-Hill Companies, 2004.
Cook, Roberta, and Linda Calvin. Greenhouse Tomatoes Change theDynamics of the North American Fresh Tomato Industry, EconomicResearch Report Number 2, April 2005, U.S. Department of Agriculture,Economic Research Service. Available athttp://www.ers.usda.gov/Publications/ERR2/.
Davis, David E., and Hayden Stewart. “Changing Consumer DemandsCreate Opportunities for U.S. Food System,” FoodReview, Volume 25,Issue 1, Spring 2002, U.S. Department of Agriculture, EconomicResearch Service. Available athttp://www.ers.usda.gov/publications/FoodReview/May2002/frvol25i1d.pdf.
Drewnowski, Adam, and Nicole Darmon. “Food Choices and Diet Costs: AnEconomic Analysis,” Journal of Nutrition, 135(2005):900-04.
Flegal, Katherine M., et al. “Prevalence and Trends in Obesity Among USAdults, 1999-2000,” Journal of the American Medical Association,288(2002):1723-1727.
Gordon, Robert J. “The Boskin Commission Report: A Retrospective OneDecade Later,” International Productivity Monitor, Number 12, Spring(2006):7-22.
Gordon, Robert J., and Zvi Griliches. “Quality Change and New Products,”American Economic Review, 87(1997):84-88.
Harris, J. Michael. “New Food Product Introductions Continue to Decline,”FoodReview, Volume 25, Issue 1, Spring 2002, U.S. Department ofAgriculture, Economic Research Service.
Hausman, Jerry. “Sources of Bias and Solutions to Bias in the ConsumerPrice Index,” The Journal of Economic Perspectives, 17(Winter,2003):23-44.
Hedley, Allison A., et al. “Prevalence of Overweight and Obesity AmongU.S. Children, Adolescents, and Adults, 1999-2002,” Journal of theAmerican Medical Association, 291(2004):2847-2850.
19Price Trends Are Similar for Fruits, Vegetables, and Snack Foods / ERR-55
Economic Research Service/USDA

Kaufman, Phil R., et al. Understanding the Dynamics of Produce Markets:Consumption and Consolidation Grow, Agriculture Information BulletinNumber 758, August 2000, U.S. Department of Agriculture, EconomicResearch Service. Available athttp://www.ers.usda.gov/publications/aib758/.
Leibtag, Ephraim. The Impact of Big-Box Stores on Retail Food Prices andthe Consumer Price Index, Economic Research Report Number 33,December 2006, U.S. Department of Agriculture, Economic ResearchService. Available at http://www.ers.usda.gov/Publications/ERR33/.
Moulton, Brent R., and Karin E. Moses. “Addressing the Quality ChangeIssue in the Consumer Price Index,” Brookings Papers on EconomicActivity, 28, Number 1, (1997):305-49.
Perez, Agnes, and Susan Pollack. Fruit and Tree Nuts Outlook, FTS-329,Sept. 26, 2007, U.S. Department of Agriculture, Economic ResearchService. Available athttp://www.ers.usda.gov/Publications/FTS/2007/09Sep/FTS329.pdf.
Putnam, Judith Jones, and Jane E. Allshouse. Food Consumption, Prices,and Expenditures, 1970-97, Statistical Bulletin Number 965, April 1999,U.S. Department of Agriculture, Economic Research Service. Available athttp://www.ers.usda.gov/publications/sb965/.
Reed, Jane, Elizabeth Frazão, and Rachel Itskowitz. How Much DoAmericans Pay for Fruits and Vegetables? Agriculture InformationBulletin Number 790, July 2004, U.S. Department of Agriculture,Economic Research Service. Available at http://www.ers.usda.gov/publications/aib790/.
Reinsdorf, Marshall. “The Effect of Outlet Price Differentials on the U.S.Consumer Price Index,” Price Measurements and Their Uses (Murray F.Foss, Marilyn E. Manser, and Allan H. Young, eds.), Chicago, Universityof Chicago Press, 1993.
Reinsdorf, Marshall B., and Brent R. Moulton. “The Construction of BasicComponents of Cost-of-Living Indexes,” The Economics of New Goods(Timothy F. Bresnahan and Robert J. Gordon, eds.) Chicago, Universityof Chicago Press, 1997.
Stewart, Hayden. How Low Has the Farm Share of Retail Food PricesReally Fallen? Economic Research Report Number 24, August 2006,U.S. Department of Agriculture, Economic Research Service. Available athttp://www.ers.usda.gov/publications/err24/.
Stewart, Kenneth J., and Stephen B. Reed. “CPI Research Series UsingCurrent Methods, 1978-98,” Monthly Labor Review, 122, Number 6,(June 1999):29-38.
U.S. Department of Agriculture, Economic Research Service. Tomatoes—Briefing Room, updated February 27, 2007. Available athttp://www.ers.usda.gov/briefing/tomatoes/.
20Price Trends Are Similar for Fruits, Vegetables, and Snack Foods / ERR-55
Economic Research Service/USDA

U.S. Department of Agriculture, Economic Research Service. FoodConsumption (Per Capita) Data System, updated February 15, 2007.Available at http://www.ers.usda.gov/data/FoodConsumption/.
U.S. Department of Health and Human Service and U.S. Department ofAgriculture. Dietary Guidelines for Americans, 2005, 6th Edition.
U.S. Department of Labor, Bureau of Labor Statistics (2007). BLSHandbook of Methods, Chapter 17. Available athttp://www.bls.gov/opub/hom/pdf/homch17.pdf.
Variyam, Jayachandran N. “The Price is Right: Economics and the Rise ofObesity,” Amber Waves, Volume 3, Issue 1, February 2005, U.S.Department of Agriculture, Economic Research Service. Available athttp://www.ers.usda.gov/AmberWaves/February05/Features/ThePriceIsRight.htm.
21Price Trends Are Similar for Fruits, Vegetables, and Snack Foods / ERR-55
Economic Research Service/USDA

Appendix: CPI Overstates the Rateof Increase in Food Prices,Especially for Fresh Fruits and Vegetables
The CPI may not definitively answer how food prices trended over the pastseveral decades. The CPI overstates the rate of price inflation as comparedwith what a true cost-of-living index would have reported.10 In the mid-1990s, the Boskin Commission, an advisory commission, was appointed bythe Senate Finance Committee to study the role of the CPI in governmentbenefit programs and recommend needed changes to the CPI. The Commis-sion’s December 1996 report estimated the CPI overstated the annual rate ofinflation by 1.1 percent. Moreover, not all food groups appear to have beenequally affected.
Economic research points to several reasons why the CPI was biased overthis time period.11 One source of CPI bias was the formula used by the BLSto calculate the rate of price change for commodities.12 Following anexample in the Boskin Commission Report (Boskin et al., 1996), supposethat the price of beef was $1.00 in January, but increased to $1.60 inFebruary. We would have observed a 60-percent price increase for February.If the price fell back to $1.00 in March, we would observe only a 37.5-percent price decline. By the formula it previously used, BLS would havedetermined the average rate of price change from February to March to havebeen 11.25 percent (i.e., 60 percent minus 37.5 percent divided by 2months), even though prices were the same at the beginning and end of theperiod. This particular problem was resolved when BLS changed its formulain January 1999.
Though the rate of price change formula has since been corrected, Reinsdorfand Moulton (1997) show that problems with the formula previously usedby BLS did not affect all food indices equally. They re-estimated rates ofinflation using two different formulas. The first formula reflected BLSmethodology at the time. The second corrected for oscillating prices, aswell as for other types of bias associated with the first formula. Reinsdorfand Moulton (1997) found that formula bias impacted the index for freshfruits and vegetables more than price indices for other types of food. Theybelieved that prices for fresh fruits and vegetables tend to be more volatilethan those for other foods.
A more controversial question is whether quality changes have alsocontributed to the upward bias in the CPI. The Boskin Commission arguedthat quality and new product bias accounted for about half of the overallbias in the CPI (Boskin et al., 1996; Gordon and Griliches, 1997; Gordon,2006).13
Moulton and Moses (1997) argued that the Boskin Commission’s estimateof the rate of quality bias was too high. Consider that BLS prices tens ofthousands of products. The goods and services comprising its sample arenot constant. BLS rotates products in and out of the sample according to apre-planned schedule. Also, items being priced may be unexpectedly discon-
10The objective of the CPI is toapproximate a cost-of-living index.For example, if we compare the costof living this year against that of a pastyear, the CPI should measure howmuch more (or less) households needto spend in order to achieve the samelevel of utility (well-being) as they didin the previous year (e.g., Bureau ofLabor Statistics, 2007).
11The BLS defines bias as differ-ences between the CPI and what a truecost-of-living index would report(Bureau of Labor Statistics, 2007).
12This occurred at the lower levelof index construction, meaning thatBLS would later aggregate these pricechanges to calculate changes in theoverall CPI.
22Price Trends Are Similar for Fruits, Vegetables, and Snack Foods / ERR-55
Economic Research Service/USDA
13The CPI was estimated to haveoverstated the rate of inflation by 0.60percent due to quality and new productbias alone.

tinued or become permanently unavailable and need to be replaced. Rotatingand replacing products is problematic if the products entering the sample aredifferent in quality from the goods they replace. For example, imagine that abag of ready-to-eat baby carrots replaces a bag of traditional, unpeeled anduncut carrots. The former is typically more expensive per pound. Moultonand Moses (1997) argued that BLS would take appropriate steps to separateout how much of the price increase is due to quality change rather thanactual price inflation. The BLS could assume the difference in pricebetween the two goods to be explained by a difference in quality. If theprice of baby carrots in a prior month were available, for example, it mightthen compare the price of baby carrots in the current month against thehistorical price, not against the price of traditional, unpeeled, uncut carrots.
Despite the best efforts of BLS analysts, however, when an older product isreplaced by an entirely new product, the potential for bias remains. Gordonand Griliches (1997) argued that the CPI will be biased if the new product issuperior in quality to the older product by more than the differential in pricebetween the two. Applying this same logic to our carrot example, we wouldexpect the benefit provided to households by ready-to-eat baby carrots toexceed the cost differential between them and the traditional product. If thiswere not true, it would be hard to explain why the more expensive, value-added product has grown in popularity.14 When entirely new products areintroduced and gain market share, households typically enjoy large increasesin welfare above the higher prices they pay for those new products(Hausman, 2003). Hausman argued BLS needs to incorporate these largewelfare changes into its calculations for the CPI to more closely approxi-mate a true cost-of-living index.15
New product and quality bias might also have affected the CPI for freshfruits and vegetables more than indices for other foods. The BoskinCommission Report and Gordon and Griliches (1997) put the annual rate ofnew product and quality bias for fruits and vegetables at twice that for otherfoods.
Since the late 1990s, the BLS has worked to improve the CPI (Stewart andReed, 1999; U.S. Department of Labor, Bureau of Labor Statistics, 2007).Aside from the ongoing debate over quality change, the CPI may provide abetter estimate of future relative price changes. Our focus, however, is retro-spective. We want to examine how relative prices have changed since 1980.
14Otherwise, there would be noincrease in consumer surplus andhouseholds would be indifferentbetween buying traditional carrots andthe newer ready-to-eat product.
15If households are obtaininggreater utility from newer goods thanBLS analysts assume, the CPI couldbe measuring how a household’sexpenditures need to change for thathousehold to buy baskets of goods andservices providing greater-and-greaterutility. The CPI would not thenapproximate a cost-of-living index.
23Price Trends Are Similar for Fruits, Vegetables, and Snack Foods / ERR-55
Economic Research Service/USDA