
Price & Time Symmetry - ActiveTrendTrading · Price & Time Symmetry DENNIS W. WILBORN, SR....
18
Transcript of Price & Time Symmetry - ActiveTrendTrading · Price & Time Symmetry DENNIS W. WILBORN, SR....
Price & Time Symmetry
WWW.ACTIVETRENDTRADING.COM
DENNIS W. WILBORN, SR.
DisclaimerU.S. GOVERNMENT REQUIRED DISCLAIMER – COMMODITY FUTURES TRADING COMMISSION FUTURES AND OPTIONS TRADING HAS LARGE POTENTIAL REWARDS, BUT ALSO LARGE POTENTIAL RISK. YOU MUST BE AWARE OF THE RISKS AND BE WILLING TO ACCEPT THEM IN ORDER TO INVEST IN THE FUTURES AND OPTIONS MARKETS.
DON’T TRADE WITH MONEY YOU CAN’T AFFORD TO LOSE. THIS IS NEITHER A SOLICITATION NOR AN OFFER TO BUY/SELL FUTURES OR OPTIONS. NO REPRESENTATION I S BEING MADE THAT ANY ACCOUNT WILL OR IS LIKELY TO ACHIEVE PROFITS OR LOSSES SIMILAR TO THOSE DISCUSSED IN THIS TRAINING. THE PAST PERFORMANCE OF ANY TRADING SYSTEM OR METHODOLOGY IS NOT NECESSARILY INDICATIVE OF FUTURE RESULTS.
CFTC RULE 4.41 – HYPOTHETICAL OR SIMULATED PERFORMANCE RESULTS HAVE CERTAINLIMITATIONS. UNLIKE AN ACTUAL PERFORMANCE RECORD, SIMULATED RESULTS DO NOTREPRESENT ACTUAL TRADING. ALSO, SINCE THE TRADES HAVE NOT BEEN EXECUTED, THERESULTS MAY HAVE UNDER-OR-OVER COMPENSATED FOR THE IMPACT, IF ANY, OF CERTAINMARKET FACTORS, SUCH AS LACK OF LIQUIDITY. SIMULATED TRADING PROGRAMS INGENERAL ARE ALSO SUBJECT TO THE FACT THAT THEY ARE DESIGNED WITH THE BENEFIT OFHINDSIGHT. NO REPRESENTATION IS BEING MADE THAT ANY ACCOUNT WILL OR IS LIKELYTO ACHIEVE PROFIT OR LOSSES SIMILAR TO THOSE SHOWN.
ALL MATERIALS PRESENTED ARE FOR TRAINING PURPOSES ONLY . TRADERS SHOULD PAPER TRADE ANY NEW METHOD PRIOR TO RISK OF PERSONAL CAPITAL.
Fibonacci Numbers: From Bunnies to Wall Street
1202ish: Leonardo Fibonacci studied mathematical formula and discovered a series of numbers that acts like a natural harmonic function.
One of the early uses was an attempt to solve for the propagation ability of rabbits which gave birth to the system of numbers that Fibonacci is known for today. This became known as the Golden Ratio around the irrational number Phi: 1.618
It seemed that humans subconsciously react around the multiples of the Fibonacci.
Charles Dow first observed that stocks tend to retrace 1/3 to 2/3’s of trending moves. Turns out that what Dow observed was price reacting around the Fibonacci retracement numbers of 0.382, 0.50, 0.618
Copyright 2007-2015 Active Trend Trading
Fibonacci Numbers: Types of Indicators
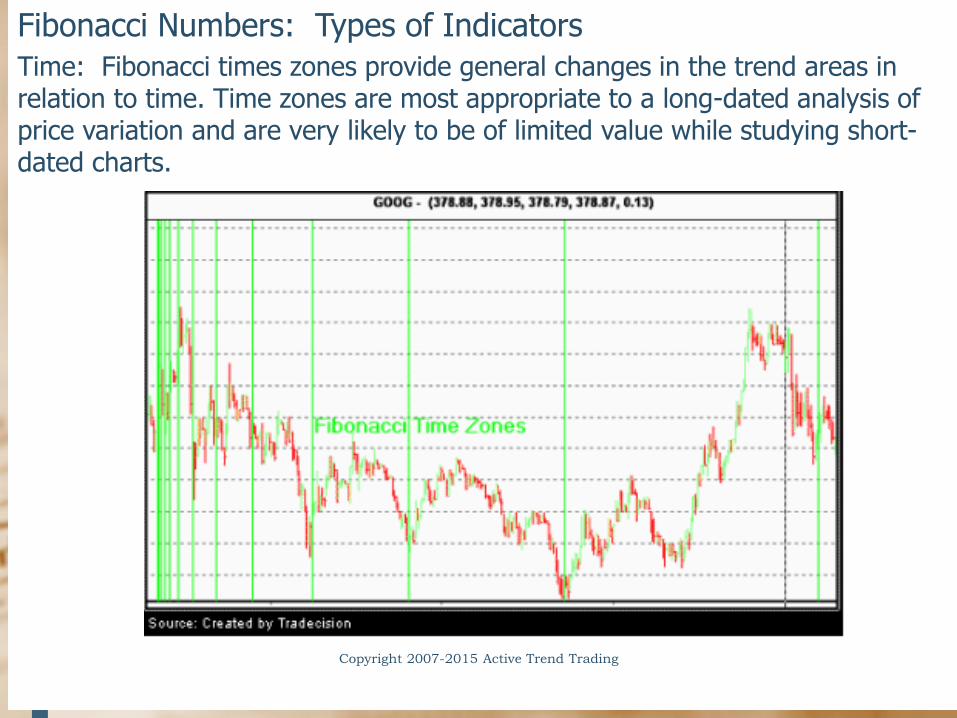
Time: Fibonacci times zones provide general changes in the trend areas in relation to time. Time zones are most appropriate to a long-dated analysis of price variation and are very likely to be of limited value while studying short-dated charts.
Retracement: The Fibonacci retracement is the potential retracement of a financial asset's original move in price. Fibonacci retracements use horizontal lines to indicate areas of support or resistance at the key Fibonacci levels before it continues in the original direction.
Extensions: Levels used in Fibonacci retracement to forecast areas of support or resistance. Extensions consist of all levels drawn beyond the standard 100% level and are used by many traders to determine areas where they will wish to take profits.
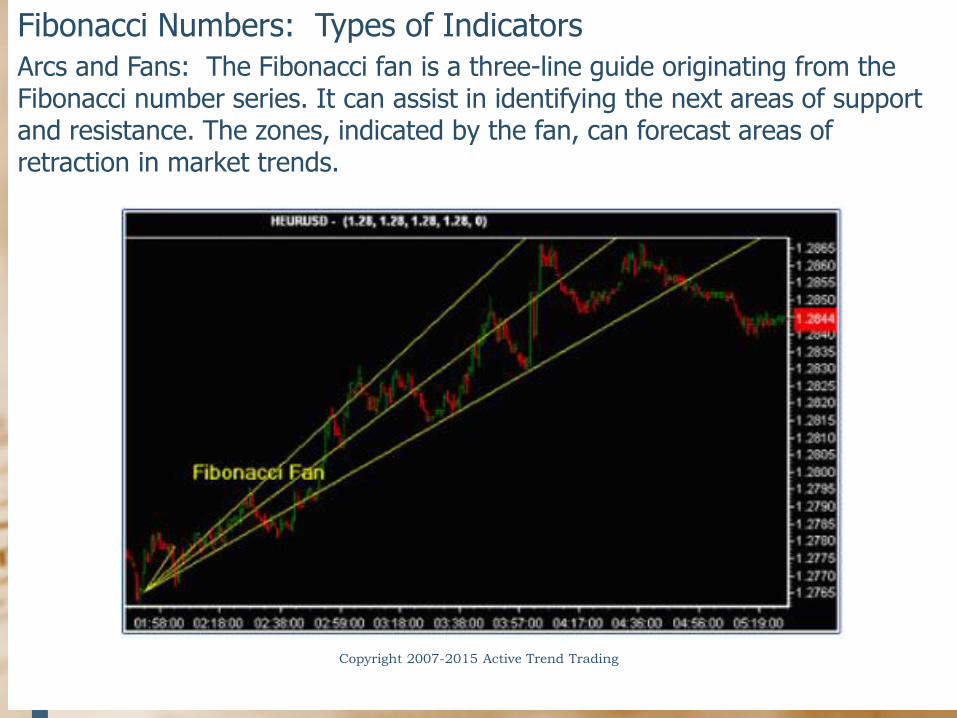
Arcs and Fans: The Fibonacci fan is a three-line guide originating from the Fibonacci number series. It can assist in identifying the next areas of support and resistance. The zones, indicated by the fan, can forecast areas of retraction in market trends.
Copyright 2007-2015 Active Trend Trading
Fibonacci Numbers: How to Use Them
Swing Highs/Lows: Any timeframe. Longer term charts lend themselves to stronger levels and timeframes
Look for Groupings: When applying Fibonacci’s across multiple timeframes and at different swing high/low combination will result in groupings that may identify more significant levels of support/resistance
Do they always work? No, but Fibonacci’s do provide clues and ideas on where price action may either slow or reverse.
Copyright 2007-2015 Active Trend Trading
Fibonacci Numbers: Types of Indicators
Arcs and Fans: The Fibonacci fan is a three-line guide originating from the Fibonacci number series. It can assist in identifying the next areas of support and resistance. The zones, indicated by the fan, can forecast areas of retraction in market trends.
Copyright 2007-2015 Active Trend Trading
Fibonacci Numbers: Types of Indicators
Time: Fibonacci times zones provide general changes in the trend areas in relation to time. Time zones are most appropriate to a long-dated analysis of price variation and are very likely to be of limited value while studying short-dated charts.
Copyright 2007-2015 Active Trend Trading
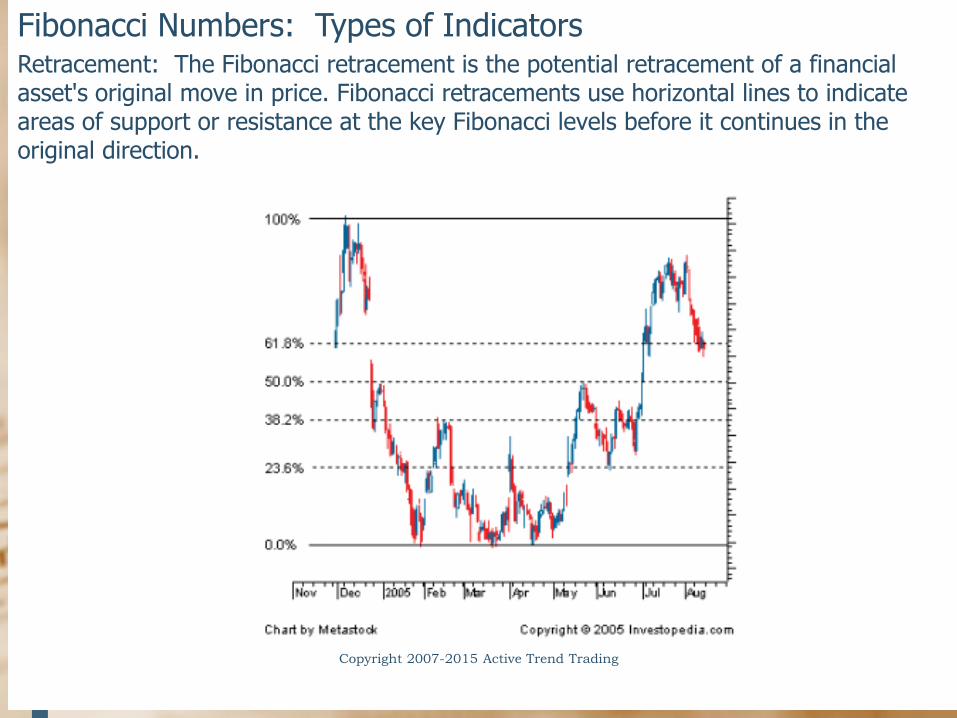
Fibonacci Numbers: Types of IndicatorsRetracement: The Fibonacci retracement is the potential retracement of a financial asset's original move in price. Fibonacci retracements use horizontal lines to indicate areas of support or resistance at the key Fibonacci levels before it continues in the original direction.
Copyright 2007-2015 Active Trend Trading
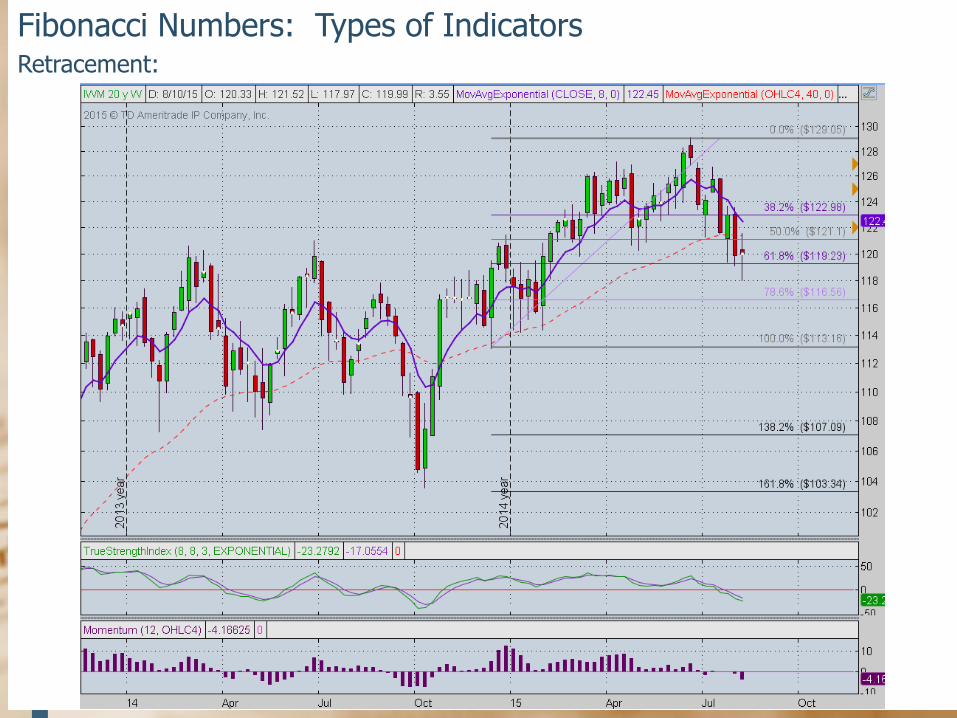
Fibonacci Numbers: Types of IndicatorsRetracement:
Copyright 2007-2015 Active Trend Trading
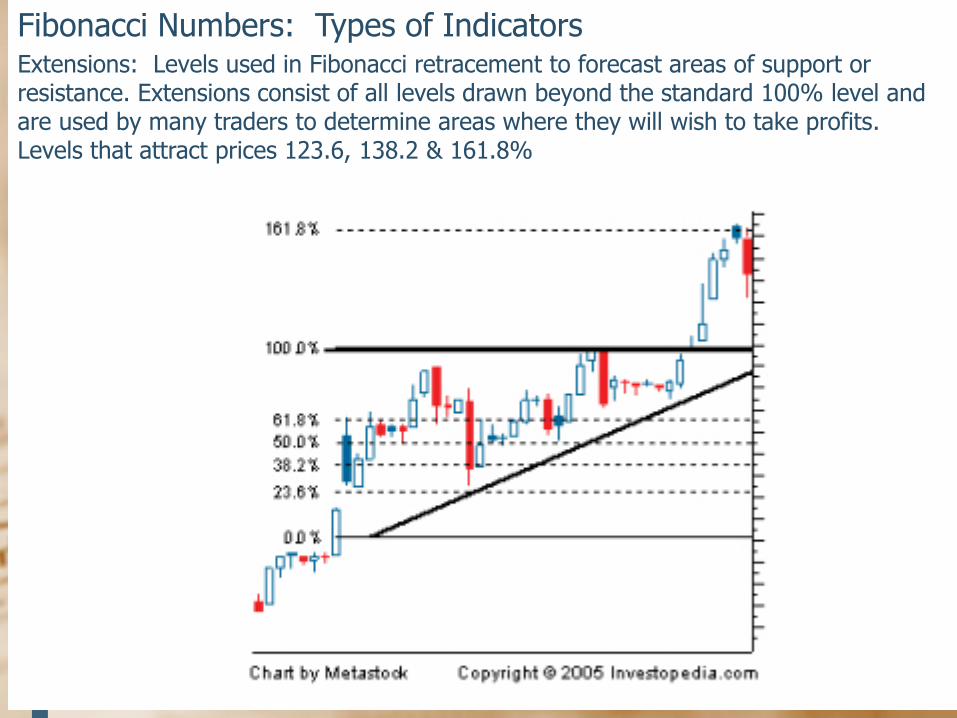
Fibonacci Numbers: Types of IndicatorsExtensions: Levels used in Fibonacci retracement to forecast areas of support or resistance. Extensions consist of all levels drawn beyond the standard 100% level and are used by many traders to determine areas where they will wish to take profits. Levels that attract prices 123.6, 138.2 & 161.8%
Copyright 2007-2015 Active Trend Trading
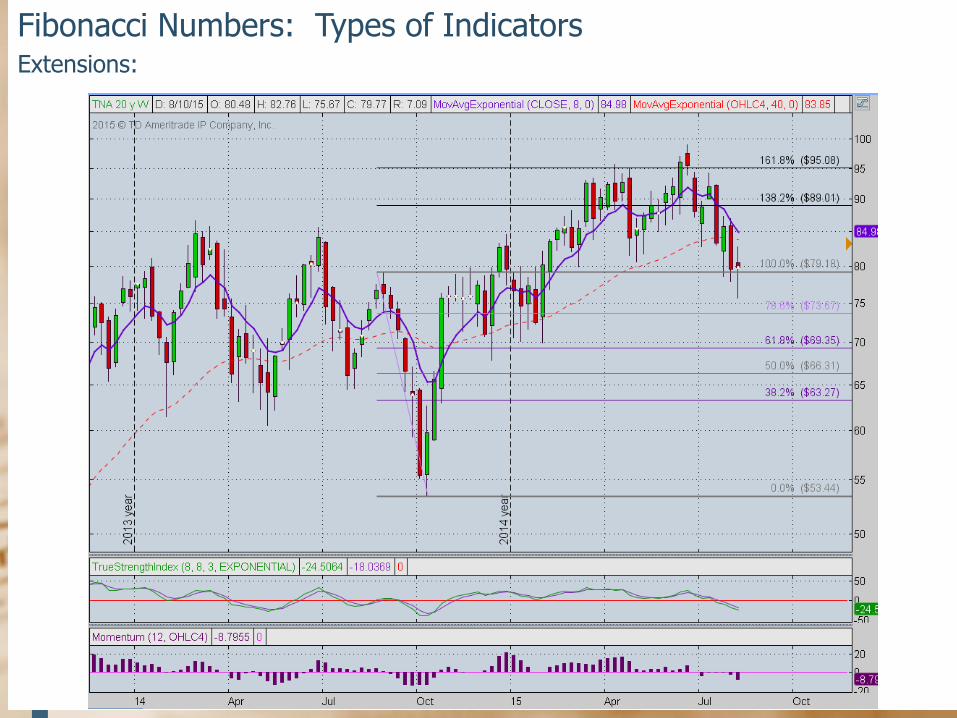
Fibonacci Numbers: Types of IndicatorsExtensions:
Copyright 2007-2015 Active Trend Trading
Fibonacci Numbers: Using Retracements, Extensions & Time
1. Provides unseen levels of support or resistance
2. Tends to identify where traders react (time & price)
3. Should be used with other clues (TSI, Momentum, Candles)
4. Failure of a level increases the probability that price will reach the next level
5. Definable targets and stops
Live Examples: WOR
Copyright 2007-2015 Active Trend Trading
Fibonacci Numbers: Using Retracements, Extensions & Time
Copyright 2007-2015 Active Trend Trading
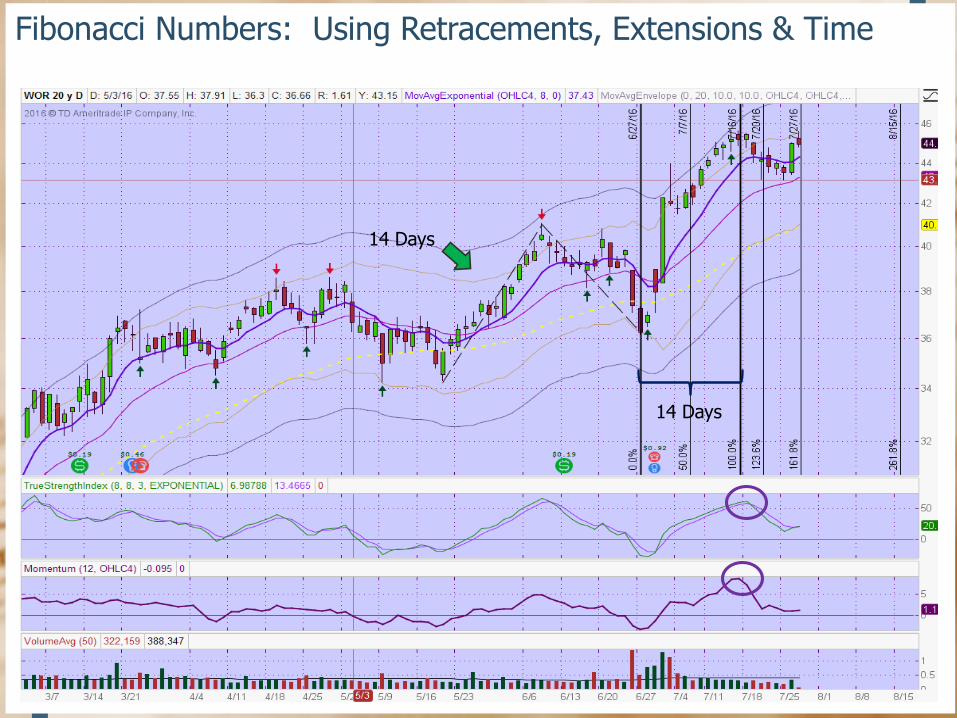
14 Days
14 Days
Fibonacci Numbers: Using Retracements, Extensions & Time
Copyright 2007-2015 Active Trend Trading
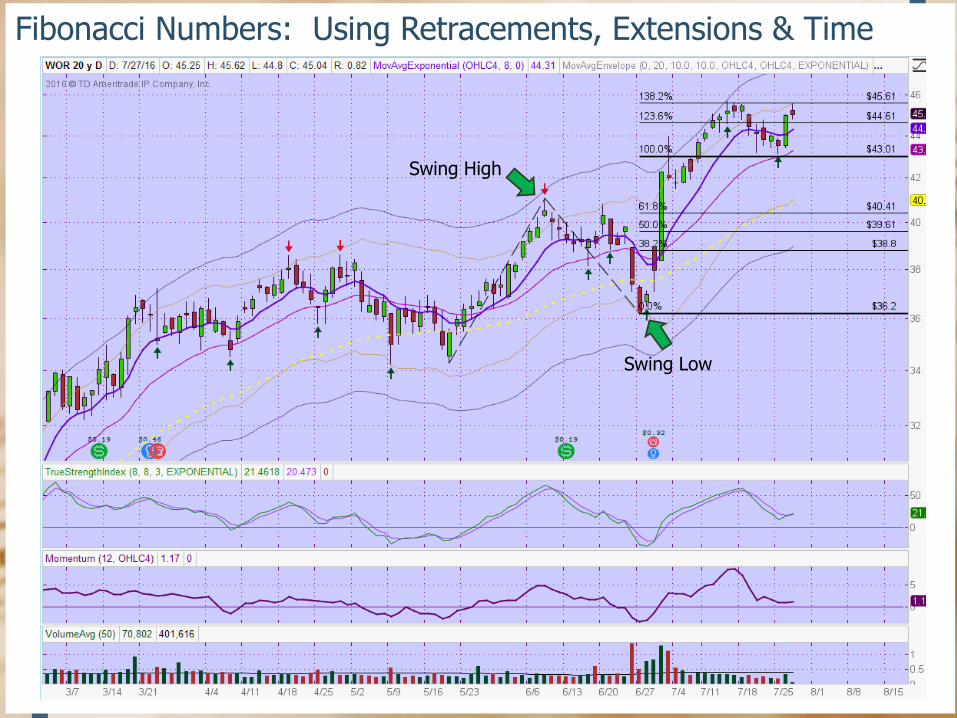
Swing High
Swing Low
Fibonacci Numbers: Using Retracements, Extensions & Time
Copyright 2007-2015 Active Trend Trading
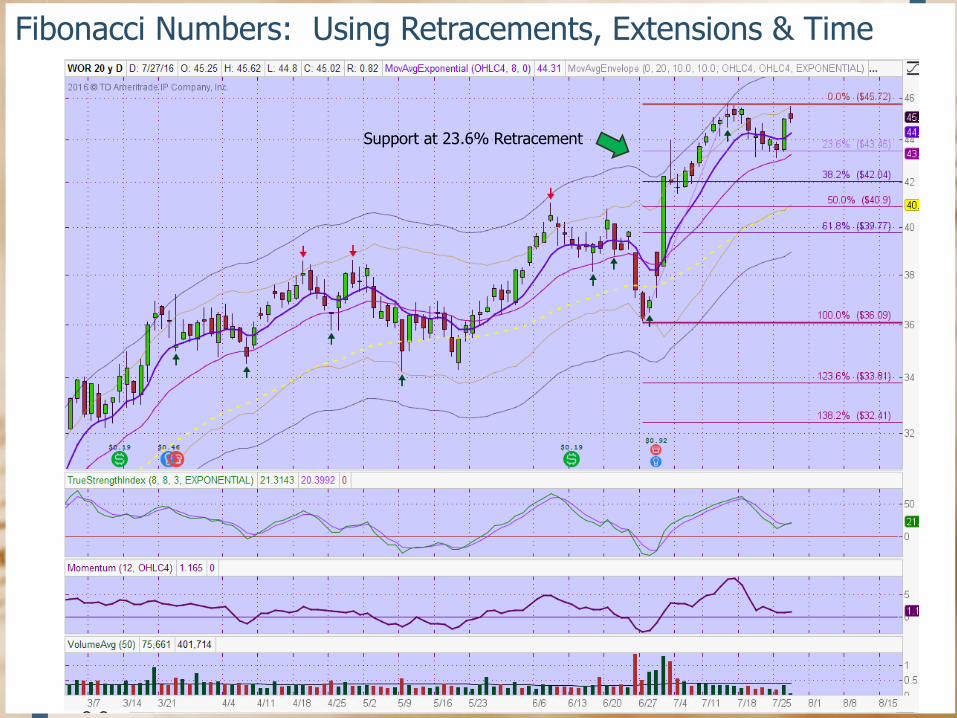
Support at 23.6% Retracement
Copyright 2007-2015 Active Trend Trading
Fibonacci Numbers: Using Retracements & Extensions
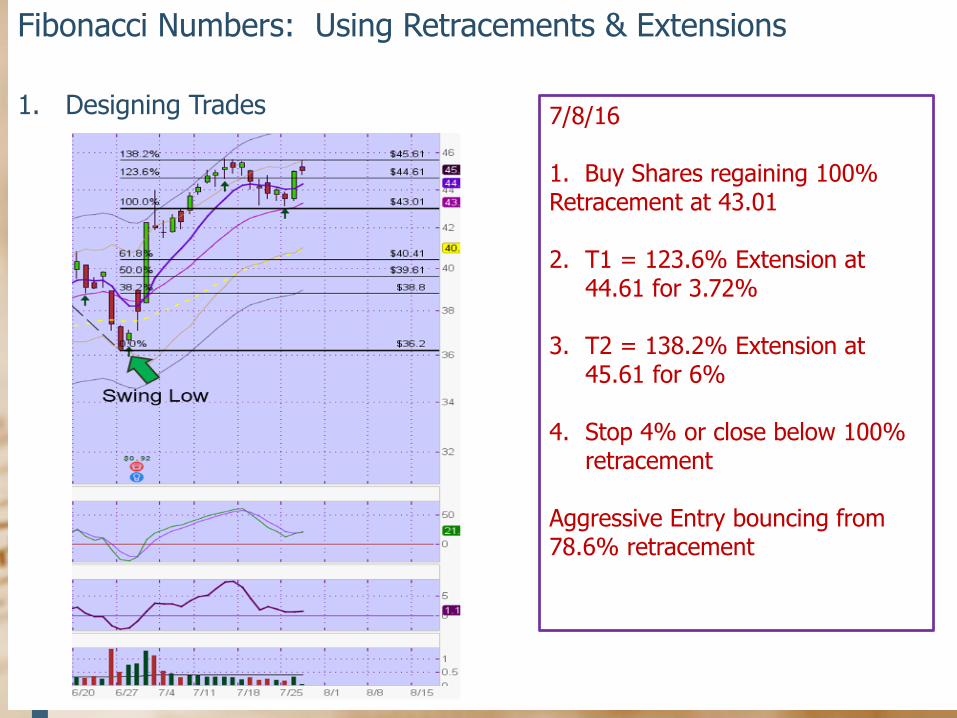
1. Designing Trades 7/8/16
1. Buy Shares regaining 100% Retracement at 43.01
2. T1 = 123.6% Extension at 44.61 for 3.72%
3. T2 = 138.2% Extension at 45.61 for 6%
4. Stop 4% or close below 100% retracement
Aggressive Entry bouncing from 78.6% retracement
The End
Copyright 2007-2015 Active Trend Trading
Clarify, Simplify & Multiply
This has been the Motto of Active Trend Trading from the beginning!
We continuously work to Clarify & Simplify through refinements to the system to make it objective and easy to both learn and use.
The purpose of all presentations is to provide our fellow Active Trend Trader Members a jump start to accelerate progress up the Learning Curve.
We welcome suggestions on how to improve the learning process!
Trade Wisely & Profitably,
Dennis W. Wilborn
Founder & Lead Technical Analyst


![4XDOOH TXDOOHLQYHVWPHQWV#DWW QHW4xdooh ,qyhvwphqwv txdoohlqyhvwphqwv#dww qhw *du\ 4xdooh txdoohlqyhvwphqwv#dww qhw -rq 3dxo 5rguljxh] msurg#vefjoredo qhw](https://static.fdocuments.us/doc/165x107/5ed52f5fb643027abb484162/4xdooh-txdoohlqyhvwphqwvdww-4xdooh-qyhvwphqwv-txdoohlqyhvwphqwvdww-qhw-du-4xdooh.jpg)