Price List IHL Syndicated Research Price List...Syndicated Research: Price List IHL Syndicated...
38
Syndicated Research: Price List IHL Syndicated Research Price List Analysts Greg Buzek, Lee Holman, Jerry Sheldon, Sean Alexander Publication Date: October 2014
Transcript of Price List IHL Syndicated Research Price List...Syndicated Research: Price List IHL Syndicated...

Syndicated Research:
Price ListIHL Syndicated Research Price ListAnalystsGreg Buzek, Lee Holman, Jerry Sheldon, Sean Alexander
Publication Date: October 2014
IHL Group License and Fair Use Agreement
All of IHL Group’s generally available research products and databases are electronic licenses andcan be shared freely within the purchasing organization and wholly owned subsidiaries. We only askthat this information not be shared with partners or others outside the purchasing company withoutauthorization from IHL Group. The license does not extend to joint ventures or other partnerships.If the relationship is not a wholly owned subsidiary, then both parties would need a license.
Practically, this implies the following:1. The purchasing company can use the reports worldwide internally as long as the international
organizations are wholly owned subsidiaries of the purchasing company.2. The research reports and databases cannot be distributed in whole or in part to partners or
customers without express written approval from IHL Group.3. The purchasing company may quote components of the data (limited use) in presentations to
customers such as specific charts. This is limited to percentage components, not individual unit information. Unit data cannot be shared externally without express written approval from IHL Group.All references to the data in presentations should include credit to IHL Group for the data.
4. The purchasing company can reference qualitative quotes in printed material with written approvalfrom IHL Group.
5. All requests requiring written approval should be submitted to [email protected] and will be reviewed within one business day.
For any questions regarding this policy, please contact us at 615-591-2955 or email us at [email protected]
1064 Cedarview Lane | Franklin, TN 37067 | Phone +1 615-591-2955 | www.ihlservices.com
About IHL Group
Who We AreIHL Group is a global research and advisory firm specializing in technologies for the retailand hospitality industries. The company, based in Franklin, Tenn., generates timely datareports, offers advisory services and serves as the leading retail technology spokespersonfor industry and vendor events.
What We DoIHL provides customized business intelligence for retailers and retail technology vendors,with particular expertise in supply chain and store level systems. Our customers are retailersand retail technology providers who want to better understand what is going on in the overalltechnology market, or wish to identify specific equipment needs for the retail market.
When We StartedGreg Buzek served as Product Development Manager for two Fortune 500 retail technologysuppliers for 6 years. Faced with making recommendations to senior management withspotty reports stuffed with technical jargon and unsubstantiated data, in 1996 he left toform IHL Group as an arms length consulting firm that delivers exacting research to corporatemanagers.
How We WorkReliable market analysis is essential for corporations to accelerate revenue and expand theirmarket share. Most research providers do not disclose data sources or statistically defend thevalidity of their assumptions. We do. We disclose in precise detail exactly how and why wereached our conclusions so that our customers can be comfortable with the data they are using.
What We KnowOur associates and advisors have over 100 years combined years of retail technology experience.Our associates have worked as product managers, sales representatives and executives in theretail market. We have the relationships, tools, and experience to meet your research andconsulting needs.
1064 Cedarview Lane | Franklin, TN 37067 | Phone +1 615-591-2955 | www.ihlservices.com
5
IHL Research at a Glance
Syndicated Research Studies 6
Mobile and Cloud Research 6
POS Software 8
POS Hardware 10
Small and Medium Business Research 16
Marketing and Operations 17
Market Share for Vendors by Technology 20
Mobile POS 20
POS 22
IT Sizing and Spend 23
WorldView 23
Insight IT Spend 24
Sophia Lead Generation/Customer Intelligence 25
Sophia - Wisdom for IT 25
Key Retail Decision Makers 27
Sophia Knows Your Trade Show 28
RAPID RFP Toolkits 29
RAPID POS 29
RAPID Fresh Item Management 30
RAPID Workforce Management 31
RAPID Hardware Maintenance 32
RAPID Technology Roadmap 33
Custom Research 34
Analyst on Call/Ask the Analyst 35
Speaker's Bureau 36
Platinum Sponsorship 37
The Fine Print 38
IHL Order Page 39
Syndicated Research Studies
6
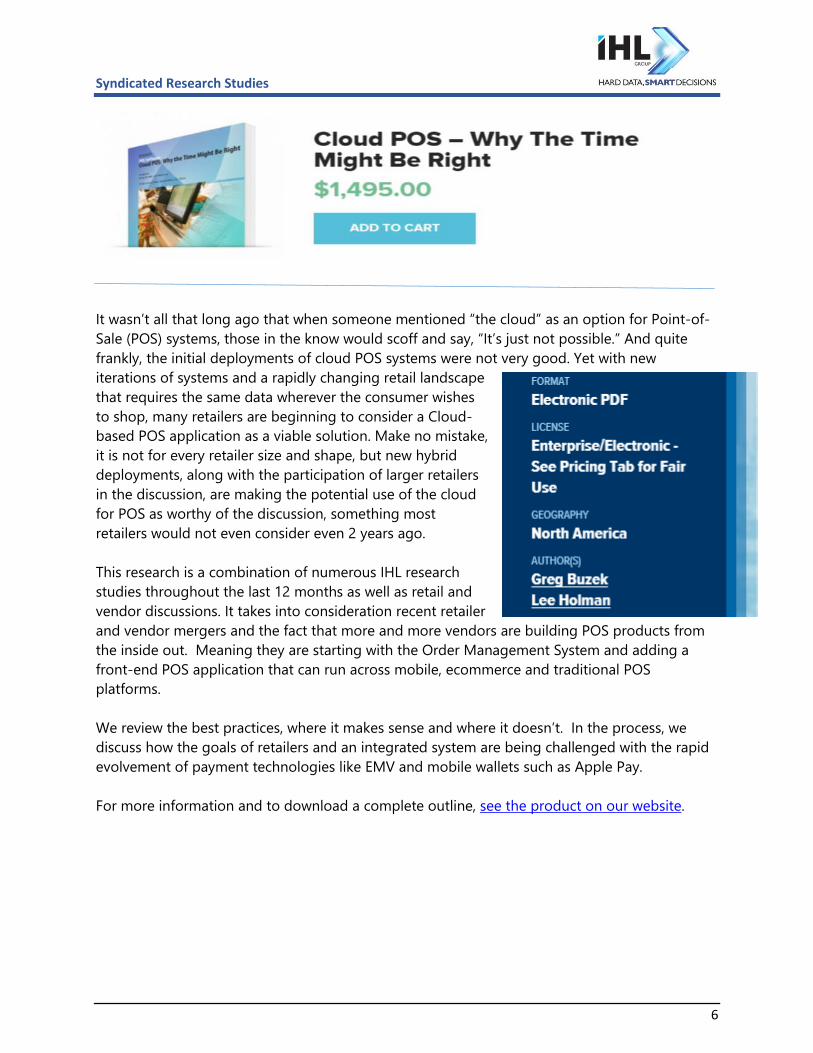
It wasn’t all that long ago that when someone mentioned “the cloud” as an option for Point-of-
Sale (POS) systems, those in the know would scoff and say, “It’s just not possible.” And quite
frankly, the initial deployments of cloud POS systems were not very good. Yet with new
iterations of systems and a rapidly changing retail landscape
that requires the same data wherever the consumer wishes
to shop, many retailers are beginning to consider a Cloud-
based POS application as a viable solution. Make no mistake,
it is not for every retailer size and shape, but new hybrid
deployments, along with the participation of larger retailers
in the discussion, are making the potential use of the cloud
for POS as worthy of the discussion, something most
retailers would not even consider even 2 years ago.
This research is a combination of numerous IHL research
studies throughout the last 12 months as well as retail and
vendor discussions. It takes into consideration recent retailer
and vendor mergers and the fact that more and more vendors are building POS products from
the inside out. Meaning they are starting with the Order Management System and adding a
front-end POS application that can run across mobile, ecommerce and traditional POS
platforms.
We review the best practices, where it makes sense and where it doesn’t. In the process, we
discuss how the goals of retailers and an integrated system are being challenged with the rapid
evolvement of payment technologies like EMV and mobile wallets such as Apple Pay.
For more information and to download a complete outline, see the product on our website.
Syndicated Research Studies
7
Mobile in retail is now a $7.8 Billion business worldwide and one that continues to grow rapidly.
In fact, it is the single fastest moving trend in retail since Internet was added to the stores.
Mobile and the buzz about Mobile in Retail has been increasing ever since Apple began using it
in their stores. Of the various store functions that can be
performed using Mobile technology, one of the most
interesting is that of Mobile POS.
This report looks at the current state of Mobile POS in North
America, the adoption rates of the various retail verticals,
and the shipment and installed base details by type of
device (Rugged Handheld, Non-Rugged Handheld, and
Tablets).
We also provide forecasts for shipments and installed base
of these devices, as well as an estimate of the impact that
these devices will have on the use of traditional POS
hardware. From the C-Level on down, the buzz about
Mobile in Retail has been increasing ever since Apple began
using it in their stores. Retailers desire the same experience and the same throughput, and one
of the most attractive functions they see is the use of handheld devices for Mobile POS. The use
of Tablets (such as the iPad) is especially pertinent, since double-digit growth in shipments of
these devices for Mobile POS use will be the norm for the foreseeable future.
For more information and to download a complete outline, see the product on our website.
Syndicated Research Studies
8
The North American Specialty Hardgoods retail vertical includes some of the largest and most
diverse retailers on the planet, who have the most complex POS transactions in all of retail. This
40 page market study delves deep into the POS Software market for these retailers. We identify
which software providers are leading the pack, what their
market share is, and which complementary systems their
software has been installed within the industry.
This study provides a quick independent snapshot of the
industry so that DIY, Books, Electronics, Furniture, Pets, and
other Hardgoods retailers can quickly get to a short list of
tested and proven POS solutions.
It includes not only vendor reviews but also the following:
Market Share and Profiles of Top 5 Software Providers.
The report goes into detail on the market share of the top 5
providers by number of accounts, installed base, and the
retail sales represented in the top 200 Hardgoods accounts in North America. For each of the
top 5 software providers we provide a solution overview, key partnerships and architecture as
well as the items outlined below.
Key Customers where the package is installed. This is a list of key customers (from public
information and store audits) for this application by vendor. This provides an objective basis for
reference accounts for retailers, not just those that will rave about them.
The legacy systems to which each of these vendors’ systems have been interfaced. (ie. To
which Merchandising, Inventory, Workforce Management and other key complementary systems
has this POS system been interfaced?)
Key contacts at similar retailers. (For retail customers only, we will provide up to 5 peer
contacts at retailers with similar application architectures to your own.)
For more information and to download a complete outline, see the product on our website.

Syndicated Research Studies
9
The North American Specialty Softgoods retail vertical enjoys one of the most diverse and
dynamic technical environments in all of retail. This study provides a quick independent
snapshot of the industry so that Apparel, Shoes, and Department Store retailers can quickly get
to a short list of tested and proven POS solutions.
These retailers must not only serve their customers well, but
must do so while appearing to be on the cutting edge
technically. This 42 page market study delves deep into the
POS Software market for these retailers. We identify which
software providers are leading the pack, what their market
share is, and which complementary systems their software
has been installed within the industry
It includes not only vendor reviews but also the following:
Market Share and Profiles of Top 5 Software Providers.
The report goes into detail on the market share of the top 5
providers by number of accounts, installed base, and the retail sales represented in the top 200
Hardgoods accounts in North America. For each of the top 5 software providers we provide a
solution overview, key partnerships and architecture as well as the items outlined below.
Key Customers where the package is installed. This is a list of key customers (from public
information and store audits) for this application by vendor. This provides an objective basis for
reference accounts for retailers, not just those that will rave about them.
The legacy systems to which each of these vendors’ systems have been interfaced. (ie. To
which Merchandising, Inventory, Workforce Management and other key complementary systems
has this POS system been interfaced?)
Key contacts at similar retailers. (For retail customers only, we will provide up to 5 peer
contacts at retailers with similar application architectures to your own.)
For more information and to download a complete outline, see the product on our website.
Syndicated Research Studies
10
This study focuses on the North American Retail POS Terminals market for 2013-2018. It
includes shipment, installed base and trends analyses of POS devices. The report is designed for
use by POS Hardware and Software Providers, Maintenance Providers, Printer Manufacturers,
EFT device vendors, Retailers and others who might have a vested interest in the North
American Point-of-Sale Market.
Additionally, the report covers emerging trends and
influences that affected the market in 2013 and those that
will help form market decisions in the future. It also includes
estimated market value for shipments and installed base and
a forecast for shipments and installed base through 2018.
We provide detailed analysis in 13 retail market segments:
Food/Supermarkets
Drug Stores
Superstores/Warehouse Clubs (Costco, Sam's, etc.
Includes Wal-Mart and KMart Super Centers)
Department Stores (Traditional anchor stores and
discount department chains)
Category Killers (Home Centers, Electronics, Pet Superstores, Bookstores, Sporting
Goods, Furniture, etc.)
Specialty Other (mall and strip-mall based Specialty Stores, predominantly apparel,
shoes and gifts).
Mass Merchandisers (includes Discount Stores)
Convenience Stores/Gas Stations
Table Service Restaurants (Including hotel bar/restaurant)
Quick Service Restaurants/Fast Food
Lodging
Casino/Cruise
Entertainment: Theaters, Theme Parks, Stadiums, Museums, Parks
For more information and to download a complete outline, see the product on our website.
Syndicated Research Studies
11
Our 13th annual EMEA EPOS report explores the market climate for EPOS terminals in the
Europe/Middle East/Africa region. After years of struggle, this market is seeing dramatic growth.
More than just numbers without explanation, this report
goes deep into discussion of retailing in the countries and
segments to reveal the forces that are shaping EPOS
purchase decisions. We believe it is important for our
customers to not only see numbers, but understand the
market behind the data so as to make more informed
decisions for the future. The report includes country by
country shipments, installed base, forecasts and trends for
the electronic point-of-sale terminal market in EMEA.
Additionally, the report covers emerging trends and
influences that affected the market in 2013 and those that
will help form market decisions in the future. It also includes
forecasts for shipments through 2018.
Along with the general retail environment for each country/region, we discuss the country by
country shipments, installed base, and forecasts for the following retail market segments:
Food/Supermarket
Drug Store
Hypermarkets/Supercenters
Department Stores
Mass Merchants
Specialty Stores
Convenience/Gas
Hospitality
For more information and to download a complete outline, see the product on our website.
Syndicated Research Studies
12
Our Asia/Pacific POS Market Study has 24 figures in 52
pages in which we explore the market climate for POS
terminals in the Asia/Pacific region. It includes shipment,
installed base and trends analyses for POS in Japan, China,
India, Australia/New Zealand, South Korea, Vietnam, Taiwan,
Hong Kong, and Other Asia/Pacific countries.
More than just numbers without explanation, this report
goes deep into discussion of retailing in the segments in
these countries to reveal the forces that are shaping POS
purchase decisions. Additionally, the report covers emerging trends and influences that affected
the market in 2013, and it includes estimates for shipments and installed base through 2018.
Note that this is not a vendor market share report (other than operating systems and processor
types), but rather a fresh look at the state of POS technology in the world’s fastest growing
market.
Along with the general retail environment for each country/region, we discuss the country by
country shipments, installed base, and forecasts for the following retail market segments:
Food/Supermarket
Drug Store
Hypermarkets/Supercenters
Department Stores
Mass Merchants
Specialty Stores
Convenience/Gas
Hospitality
For more information and to download a complete outline, see the product on our website.
Syndicated Research Studies
13
Walmart and the World Cup are helping to drive POS adoption throughout Latin/South America.
The market for POS grew at faster rate in 2013 than in recent years. Large western retailers
continue to grow in the market, bringing new POS terminals with them. Yet not all the news is
good news. Natural disasters, political unrest and economic
issues threaten pockets of future growth. These trends and
more are in our latest study.
Our Latin/South America POS terminal market study
explores the market climate for POS terminals throughout
the Latin/Central and South American region. More than
just numbers without explanation, this report goes deep
into discussion of retailing in the countries and segments to
reveal the forces that are shaping POS purchase decisions.
We believe it is important for our customers to not only see
numbers, but understand the market behind the data so as
to make more informed decisions for the future. The report
includes country-by-country shipments, installed base,
forecasts and trends for the electronic point-of-sale terminal
market in LATAM. Note that this is not a vendor market share report (other than operating
systems and processor types), but rather a fresh look at the state of POS technology in the
world’s fastest growing market.
Along with the general retail environment for each country/region, we discuss the country by
country shipments, installed base, and forecasts for the following retail market segments:
Food/Supermarket
Drug Store
Hypermarkets/Supercenters
Department Stores
Mass Merchants
Specialty Stores
Convenience/Gas
Hospitality
For more information and to download a complete outline, see the product on our website.
Syndicated Research Studies
14
Packed with 98 figures, this study details the market share, distribution channels and installed
base for the top POS printer vendors doing business in the region and provides for market
projections based on changing technologies and changing distribution philosophies through
the year 2017.
Vendors reviewed include Epson, IBM, NCR, TPG, Star
Micronics, TransAct, Citizen, Bixolon, and others.
This report is designed for use by POS Printer Vendors, POS
System Providers, Maintenance Providers, Paper Suppliers,
EFT device vendors, Consulting Organizations, Retailers and
others who might have a vested interest in the POS Printer
Market.
For more information and to download a complete outline,
see the product on our website.
Syndicated Research Studies
15
Transactions at Self-Service Kiosks are growing better than 7% per year in North America with
transactions expected to grow past $1.0 Trillion per year through the devices by 2014.
Transactions at Self-Service Kiosks are growing better than 7% per year in North America with
transactions expected to grow past $1.0 Trillion per year
through the devices by 2014. This study looks at arguably one
of the more dynamic yet most difficult areas to define in the
IT sector – namely Self-Service Kiosks. Key to any review of
Kiosks is a definition of what types of kiosks that are included.
In this study we ventured beyond retail in the breadth of our
discussion, but focused only on those devices where payment
is currently or soon to be taken. As a result, we came up with
the following 6 categories:
Self-Checkout Systems – Computerized systems that
allow shoppers to purchase tangible products unassisted
in a retail setting.
Ticketing Kiosks – Those found at airports, amusement
parks, bus terminals, parking, movie theaters and
subway/train stations that enable a customer to purchase
a ticket for a ride or attraction. These are different from
the third category “Check-In” kiosks in that they are the
first-contact in the transaction.
Check-In Kiosks – These are kiosks that confirm previous payment. These are quite common
in lodging and travel settings.
Food Ordering Kiosks – These are devices that allow either fast food or casual dining
customers to place their orders and make payment without input from employees who are
then redeployed to order fulfillment.
Postal Kiosks – These are the new kiosks installed in the US Postal Locations to handle the
mailing of letters/packages.
Other Retail Kiosks – This group consists of a wide variety of transaction kiosks that may be
found in retail and hospitality settings.
Syndicated Research Studies
16
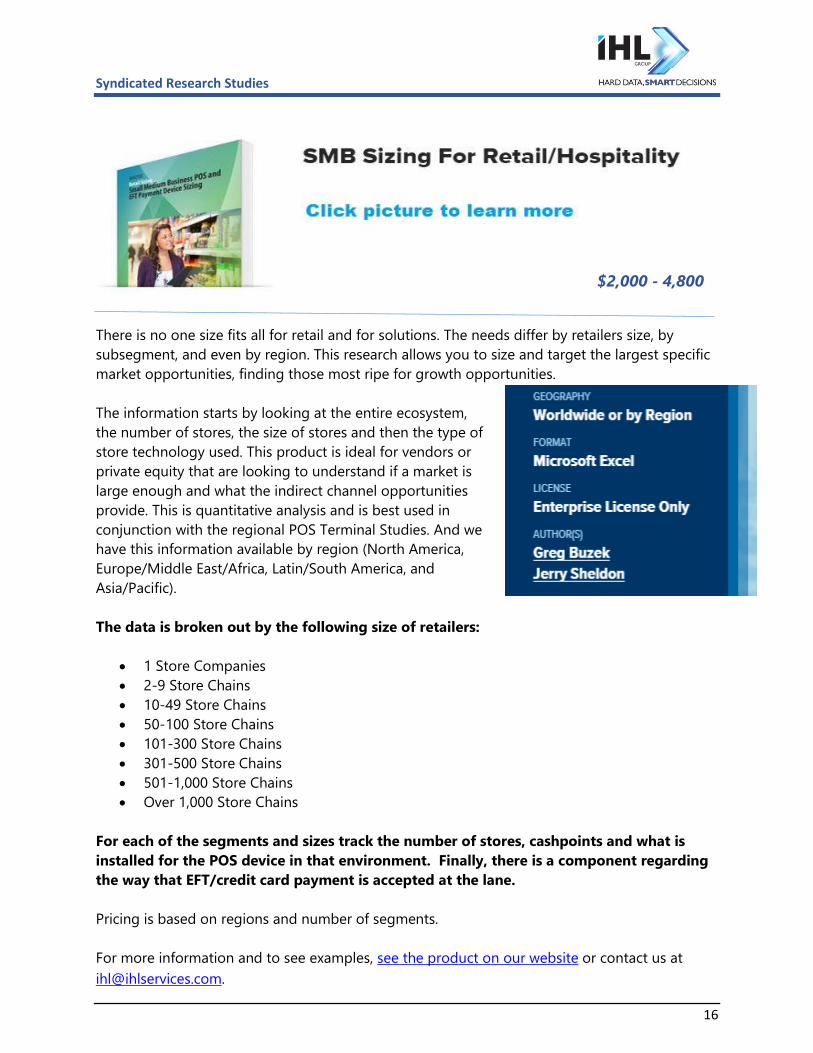
There is no one size fits all for retail and for solutions. The needs differ by retailers size, by
subsegment, and even by region. This research allows you to size and target the largest specific
market opportunities, finding those most ripe for growth opportunities.
The information starts by looking at the entire ecosystem,
the number of stores, the size of stores and then the type of
store technology used. This product is ideal for vendors or
private equity that are looking to understand if a market is
large enough and what the indirect channel opportunities
provide. This is quantitative analysis and is best used in
conjunction with the regional POS Terminal Studies. And we
have this information available by region (North America,
Europe/Middle East/Africa, Latin/South America, and
Asia/Pacific).
The data is broken out by the following size of retailers:
1 Store Companies
2-9 Store Chains
10-49 Store Chains
50-100 Store Chains
101-300 Store Chains
301-500 Store Chains
501-1,000 Store Chains
Over 1,000 Store Chains
For each of the segments and sizes track the number of stores, cashpoints and what is
installed for the POS device in that environment. Finally, there is a component regarding
the way that EFT/credit card payment is accepted at the lane.
Pricing is based on regions and number of segments.
For more information and to see examples, see the product on our website or contact us at
$2,000 - 4,800
Syndicated Research Studies
17
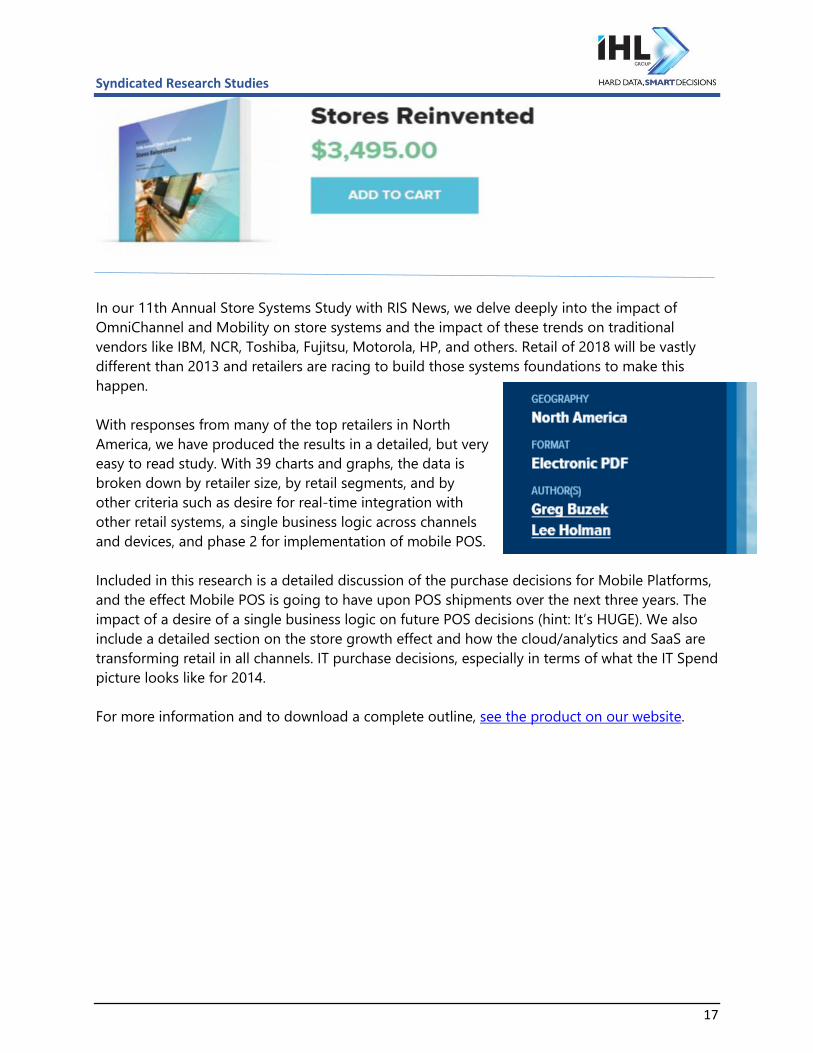
In our 11th Annual Store Systems Study with RIS News, we delve deeply into the impact of
OmniChannel and Mobility on store systems and the impact of these trends on traditional
vendors like IBM, NCR, Toshiba, Fujitsu, Motorola, HP, and others. Retail of 2018 will be vastly
different than 2013 and retailers are racing to build those systems foundations to make this
happen.
With responses from many of the top retailers in North
America, we have produced the results in a detailed, but very
easy to read study. With 39 charts and graphs, the data is
broken down by retailer size, by retail segments, and by
other criteria such as desire for real-time integration with
other retail systems, a single business logic across channels
and devices, and phase 2 for implementation of mobile POS.
Included in this research is a detailed discussion of the purchase decisions for Mobile Platforms,
and the effect Mobile POS is going to have upon POS shipments over the next three years. The
impact of a desire of a single business logic on future POS decisions (hint: It’s HUGE). We also
include a detailed section on the store growth effect and how the cloud/analytics and SaaS are
transforming retail in all channels. IT purchase decisions, especially in terms of what the IT Spend
picture looks like for 2014.
For more information and to download a complete outline, see the product on our website.
Syndicated Research Studies
18
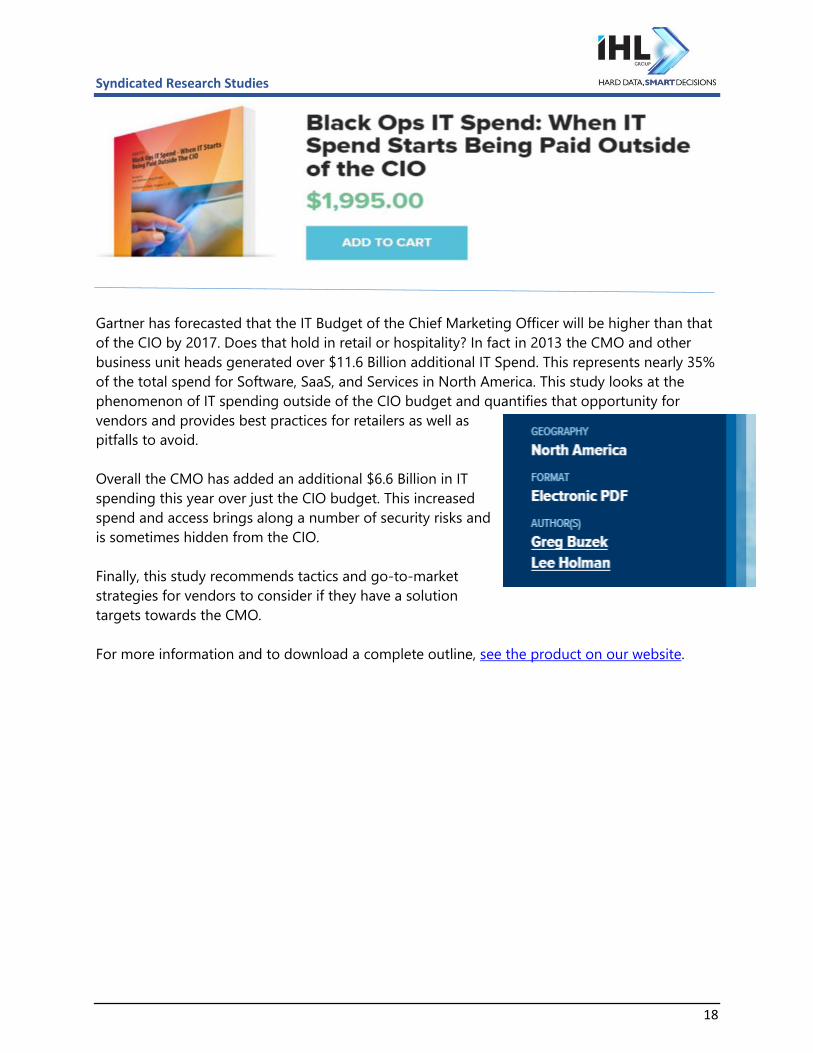
Gartner has forecasted that the IT Budget of the Chief Marketing Officer will be higher than that
of the CIO by 2017. Does that hold in retail or hospitality? In fact in 2013 the CMO and other
business unit heads generated over $11.6 Billion additional IT Spend. This represents nearly 35%
of the total spend for Software, SaaS, and Services in North America. This study looks at the
phenomenon of IT spending outside of the CIO budget and quantifies that opportunity for
vendors and provides best practices for retailers as well as
pitfalls to avoid.
Overall the CMO has added an additional $6.6 Billion in IT
spending this year over just the CIO budget. This increased
spend and access brings along a number of security risks and
is sometimes hidden from the CIO.
Finally, this study recommends tactics and go-to-market
strategies for vendors to consider if they have a solution
targets towards the CMO.
For more information and to download a complete outline, see the product on our website.
Syndicated Research Studies
19
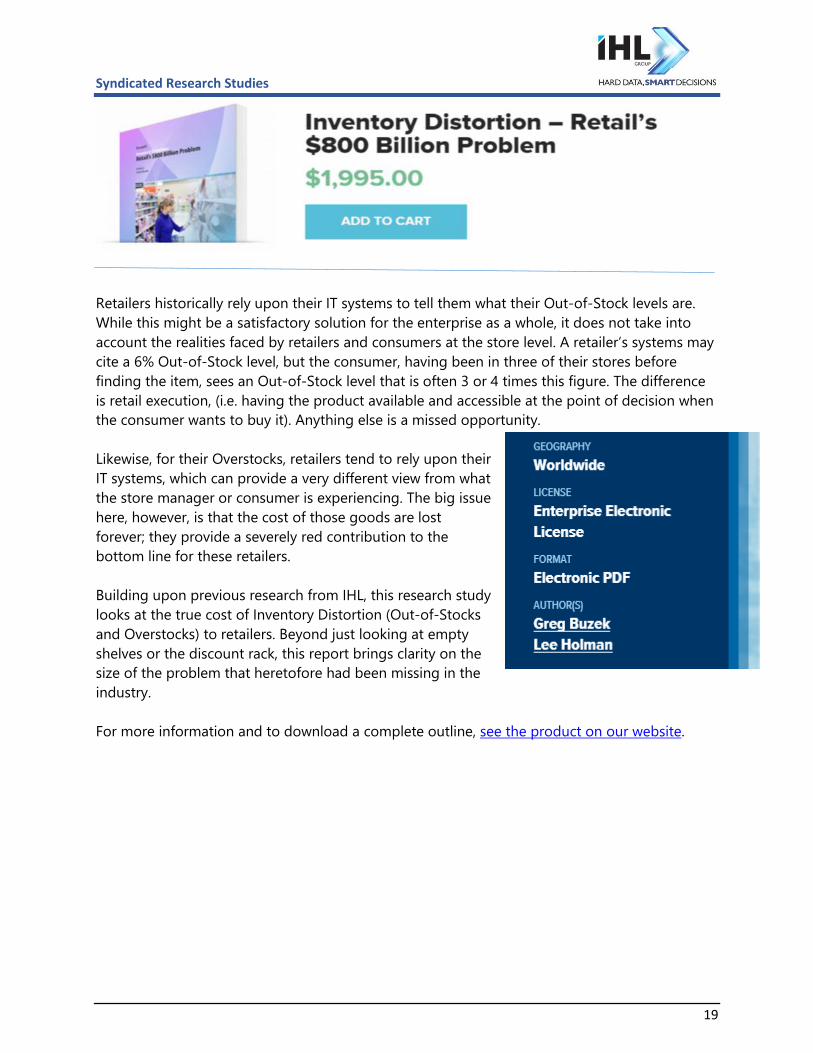
Retailers historically rely upon their IT systems to tell them what their Out-of-Stock levels are.
While this might be a satisfactory solution for the enterprise as a whole, it does not take into
account the realities faced by retailers and consumers at the store level. A retailer’s systems may
cite a 6% Out-of-Stock level, but the consumer, having been in three of their stores before
finding the item, sees an Out-of-Stock level that is often 3 or 4 times this figure. The difference
is retail execution, (i.e. having the product available and accessible at the point of decision when
the consumer wants to buy it). Anything else is a missed opportunity.
Likewise, for their Overstocks, retailers tend to rely upon their
IT systems, which can provide a very different view from what
the store manager or consumer is experiencing. The big issue
here, however, is that the cost of those goods are lost
forever; they provide a severely red contribution to the
bottom line for these retailers.
Building upon previous research from IHL, this research study
looks at the true cost of Inventory Distortion (Out-of-Stocks
and Overstocks) to retailers. Beyond just looking at empty
shelves or the discount rack, this report brings clarity on the
size of the problem that heretofore had been missing in the
industry.
For more information and to download a complete outline, see the product on our website.
Market Share for Vendors by Technology
20
The move to mobile for associates is the single fastest adopting trend we have seen since the
rush to get stores Internet-enabled. This research looks specifically at those mobile devices
being used for POS functions. How big is this market? How fast is it growing? Which vendors are
winning? What screen format should you write the software for? This research will tell you.
This product provides market share information for
shipments and installed base on a quarterly and annual basis
for vendors such as Apple, Google, Motorola Solutions,
Samsung, HP, Lenovo, Dell, Motion Computing, NEC and
many others.
The data can also be purchased simply in aggregate by
vendor worldwide or by individual region. Included are
historical data back 2 years and projections forward for the
next 6 quarters by vendor.
Data is available for 4 regions:
North America (US and Canada)
LATAM (Mexico, Brazil, Latin/South America and Caribbean)
Europe/Middle East/Africa (includes Eastern Europe and Russia)
Asia/Pacific (includes China and India)
We provide data for the top 5-7 vendors per the following retail segments:
Food/Supermarkets
Drug Stores
Hypermarkets/Superstores/Warehouse Clubs
Department Stores
Mass Merchants
Specialty Stores
Convenience/Gas
Hospitality (Pubs, Table Service/Family Restaurants, Fast Food)
Pricing is based on regions, number of segments and other factors. For more information and
samples, see the product on our website or contact us at [email protected].
$4,000 - $24,000

Market Share for Vendors by Technology
21
Mobile POS Software is one of the fastest growing areas in retail technology, but it is not
growing at the same speed in all retail segments or even by the size of retailers.
This research tracks the market share in installs and
shipments of software licenses in Mobile POS instances. It
reviews the smaller retailers “mom and pop’s” that began the
mobile POS trend and that are seeing tremendous
technology disruption for traditional POS terminals. It also
covers the forecast for the fast rise in adoption of Mobile
POS in the enterprise retailers.
This product provides shipments and installed base on a
quarterly and annual basis for vendors such as Square, Intuit,
Shopkeep, Level Up, Paypal, Revel, NCR and Pay Anywhere
at the SMB level, then Global Bay, Oracle, Starmount, Epicor,
Toshiba, and many others for use of mobile devices for POS.
We look at shipments and installed base by segment and
tier. Currently this data is available for North America only.
We provide data for vendors per the following retail segments:
Food/Supermarkets
Drug Stores
Hypermarkets/Superstores/Warehouse Clubs
Department Stores
Mass Merchants
Specialty Stores
Convenience/Gas
Fast Food/Quick Service Restaurants
Bar and Table Service Restaurants
Lodging
Casinos and Cruise Ships
Entertainment (Theme Parks, Museums, Theaters, Stadiums)
Pricing is based on regions, number of segments and other factors. For more information and
samples, see the product on our website or contact us at [email protected].
$1,500 -$6,000
Market Share for Vendors by Technology
22
This product provides market share detail in shipments and installed base for POS terminals on a
quarterly and annual basis for vendors such as Toshiba Global Commerce (IBM), NCR, HP,
Wincor-Nixdorf, Fujitsu, Dell, MICROS, Radiant, Digipos, and many others. It includes data on
processors and operating systems historically and provides a forecast going forward. It is the
only review of the POS market that includes the PC on Cash
Drawer (PCOCD) market.
This is a very data intensive product and can go as deep as
shipments by segment by region by operating system or
processor-type. The data can also be purchased simply in
aggregate by vendor worldwide or by individual region.
Included are historical data back 2 years and projections
forward for the next 6 quarters by vendor.
Data is available for 4 regions:
North America (US and Canada)
LATAM (Mexico, Brazil, Latin/South America and
Caribbean)
Europe/Middle East/Africa (includes Eastern Europe and Russia)
Asia/Pacific (includes China and India)
We provide data for the top 5-7 vendors per the following retail segments:
Food/Supermarkets
Drug Stores
Hypermarkets/Superstores/Warehouse Clubs
Department Stores
Mass Merchants
Specialty Stores
Convenience/Gas
Hospitality (Pubs, Table Service/Family Restaurants, Fast Food)
Pricing is based on regions, number of segments and other factors. For more information and
samples, see the product on our website or contact us at [email protected].
$4,000-29,000
IT Sizing and Spend
23
The retail and hospitality industries have suffered from a lack of viable and actionable
information regarding IT Spending. Although there are studies that track certain components or
“hot” technologies that are released each year, there has yet to be a comprehensive model that
tracks IT Spending by line of business category, by segment, and by region of the world until
now.
WorldView forecasts on over 300 categories of hardware,
software, SaaS, services, and labor/overhead, IHL has
developed the most comprehensive IT sizing model in the
retail industry.
It includes forecasts and growth rate for cloud solutions as
well as sizing for mobile, EMV, Omnichannel and Big Data
tools as well as traditional retail technology components.
Information is available per region, per segment and can be
completely customized to meet your specific data needs.
Don’t base your forecasts only on internal projections! Get outside objective numbers.
Pricing begins at $1,500 and is dependent on the number of segments, number of categories,
and number of years in the forecast.
This is a product that is best shown in a demo.
For more information, see the product on our website or contact us at [email protected]
$1,500 & Up
IT Sizing and Spend
24
Whether it is trying to understand your true addressable market for a product launch or simply
to benchmark your IT Spend against other retailers, the new Insight IT Spend for Retail product
provides the level of detail necessary to truly understand the market.
One of the greatest challenges in business development is
being able to take the forecasts from the analyst firms that
are at a high level and try to understand how the market
might change when your product enters.
Or for retailers, in a fast moving world where technologies
such as mobile, social media, and business intelligence are
radically transforming retailers, how can you benchmark your
spending verses your competition. Insight IT Spend for Retail
does just that, providing you the data you need to make the
right decisions the first time with the backup you need for
your management.
Insight IT Spend for Retail allows you to pick the size of retailer you are interested in as well as
region and segment. So if you have a product that is best for Tier 2 Specialty Soft Goods
retailers for North America and Europe, you can easily see the size of your potential market even
down to the retailer level. No other third party analyst firm can provide this level of accuracy
because the system is driven not only from our WorldView IT Model but to the detail of our data
service Sophia.
For more information see the product on our website or contact us at [email protected].
$2,000 - 8,000
Sophia Lead Generation and Customer Intelligence
25
Sophia is by far the most comprehensive source of not just validated leads, but key wisdom for
smart decisions in the retail industry. It is the only lead generation system that links IT spend, to
specific technology, to specific personnel, to specific financial results, tied together and backed
by our advisory staff. Sophia provides insight into nearly 300 types of Hardware – Software –
SaaS - Services and key personnel for over 7,500 retailers, restaurants and manufacturers.
With Predictive Analytics, the system allows for benchmarking against competitors, identifying
which retailers are leaders in specific technologies, their projected IT spending plans in key
categories(like Business Intelligence/Analytics, Merchandising/Supply Chain, ERP, and Store
Systems), and which technologies they are likely to purchase in the next 24 months.
Sophia Core Benefits
Sophia Core Benefits Company Profiles – Complete profiles of companies on 300 different
technologies they have deployed. Lead Generation – Over 250,000 validated contacts with
emails.
Graphical Financial Benchmarks – Compare key financial metrics of retailers by segment and
subsegment. Zoom in to review the financial metrics for the entire retail segment.
IT Spending Breakouts – Each SPA profile includes projected IT budget information for
hardware, software, services in the following categories (Infrastructure, Store Systems, Core ERP,
Application Development, Collaboration, Merchandising/Supply Chain, Commerce, BI/Analytics,
Sales & Mktg, Legal/Real Estate).
Key Technology Leadership – Is the retailer a leader in particular technologies? We look at key
financial metrics and the strength of the retailer and leadership in key technologies in each
company SPA profile.
What’s in Play - One of the key benefits of Sophia is the ability to see into the future for each
retailer and see which systems are due for replacement and which game changing technologies
they are likely to invest in within the next 24 months.
Key Vendor Influence – Every account has key vendors that have significant influence to
enhance your opportunity or block your opportunity. The SPA profiles show you which vendors
in the account are your friend or foe.
$195 monthly - $2,000 annually per segment
Sophia Lead Generation and Customer Intelligence
26
Data is available for the following industry segments:
Retail/Hospitality in North America and Europe/Middle East/Africa
Food/Grocery Stores
Drug Stores and Pharmacies
Supercenters/Hypermarkets/Warehouse Clubs
Mass Merchants
Convenience/Gas/Forecourt Operations
Department Stores
Specialty Hard Goods
Specialty Soft Goods
Fast Food/Quick Service Restaurants
Bar/Restaurant/Table Service Restaurants
Lodging, Entertainment, Gaming, Travel
Manufacturing/CPG Segments that include the following:
Food/Beverage/Tobacco
Apparel, Shoes, Jewelry
Electronics, Recreation
Hard Goods
Pharmaceuticals
Automotive
Pricing is $195 per month per segment.
Total price is based on the duration of the contract and number of segments. Discounts
provided with more segments and duration. This is an enterprise-level access for you company.
For more information and samples, see the product on our website.

Sophia Lead Generation and Customer Intelligence
27
Need a Mailing List of Key Retail Technology Decision Makers? People like CIOs, VPs of MIS,
Store Operations, CEOs, etc.?
For this exercise we leverage the Sophia system but for a single instance.
We can provide targeted lists using a variety of criteria such as:
Specific Titles – CIO, Merchandising, Store Operations, etc.
Specific Technologies – POS, Inventory Control, Supply Chain, etc.
Specific Vendors Installed – IBM, NCR, Oracle, JDA, etc.
Within a Sales Range – from $0 – $1Trillion Any Combination of the Above
We charge .40 per record for a custom query or mailing list. Our minimum query is $750.
For more information contact us at [email protected].
$750 & Up
Sophia Lead Generation and Customer Intelligence
28
Need a Mailing List of Key Retail Technology Decision Makers? People like CIOs, VPs of MIS,
Store Operations, CEOs, etc.?
For this exercise we leverage the Sophia system but for a single instance. The NRF show will be
the next big show where we will provide names.
We can provide targeted lists using a variety of criteria such as:
Specific Titles – CIO, Merchandising, Store Operations, etc.
Specific Technologies – POS, Inventory Control, Supply Chain, etc.
Specific Vendors Installed – IBM, NCR, Oracle, JDA, etc.
Within a Sales Range – from $0 – $1Trillion Any Combination of the Above
We charge .40 per record for a custom query or mailing list. Our minimum query is $750.
For more information contact us at [email protected].
$995

RAPID RFP Toolkits
29
Developed in partnership with C-CORE Consulting Group, Inc., the RAPID POS Project Toolkit is a
methodology to facilitate POS hardware and/or software replacement for retailers. As most
retailers keep their POS systems 5-15 years, the people that were involved in the last POS planning
exercise are usually no longer available for this next
generation project. In addition there are undocumented
features that have crept into the current system that need to
be included and a new vision for what the latest technology
can provide is required.
The RAPID POS Project Toolkit is comprised of templates and
tools for RAPID scope definition of a project, development of
an RFP using the standard NRF-ARTS framework, vendor
selection and project execution. In addition each license of
the toolkit comes with 5 days of training and consulting from
our team of POS experts. The combined offering of the
toolkits and our team of experts will result in a typical 12 week
reduction in the RFP process while ensuring all functional
requirements and vendor selection occurs via a
comprehensive and thorough process.
Typically, a POS engagement consists of two separate and
distinct phases:
1. POS RAPID Project Toolkit – Scope and Objectives, requirements definition, RFP and
vendor evaluation.
2. Deployment Rapid Project Toolkit – Project Launch, including project planning, phasing,
pilot and deployment management.
You may choose to use us for either or both phases, to accelerate your project timelines and drive
the POS application selection process from vendor evaluation to project planning to full deploy.
For more information contact us at [email protected].
$TBD
RAPID RFP Toolkits
30
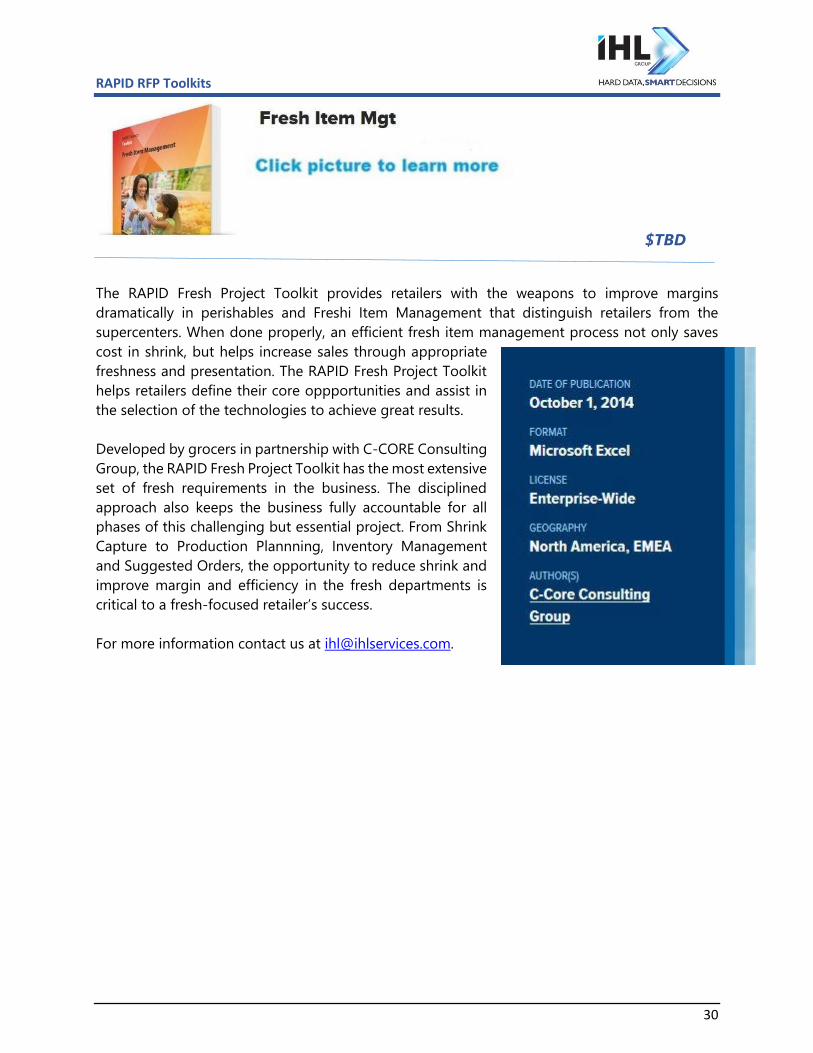
The RAPID Fresh Project Toolkit provides retailers with the weapons to improve margins
dramatically in perishables and Freshi Item Management that distinguish retailers from the
supercenters. When done properly, an efficient fresh item management process not only saves
cost in shrink, but helps increase sales through appropriate
freshness and presentation. The RAPID Fresh Project Toolkit
helps retailers define their core oppportunities and assist in
the selection of the technologies to achieve great results.
Developed by grocers in partnership with C-CORE Consulting
Group, the RAPID Fresh Project Toolkit has the most extensive
set of fresh requirements in the business. The disciplined
approach also keeps the business fully accountable for all
phases of this challenging but essential project. From Shrink
Capture to Production Plannning, Inventory Management
and Suggested Orders, the opportunity to reduce shrink and
improve margin and efficiency in the fresh departments is
critical to a fresh-focused retailer’s success.
For more information contact us at [email protected].
$TBD
RAPID RFP Toolkits
31
The RAPID Workforce Management Toolkit gets at the heart of the store employee to retailer
relationship, providing a comprehensive set of worksheets to quickly and effectively help you
make a decision on the most appropriate management system for your largest variable cost –
your labor at the stores.
For more information contact us at [email protected].
$TBD
RAPID RFP Toolkits
32
Designed in partnership with C-CORE Consulting Group, the RAPID Maintenance Project Toolkit
provides a systematic approach to managing your technology hardware assets. It is designed to
reduce your maintenance costs, simply your contracts and process for vendor negotiations, and
improve service levels.
Here are just a few of the metrics that customers have realized:
Reduced internal labor per Help Desk incident, resulting
in a savings of $1.50 per help desk call.
Up to a 20% savings in overall maintenance costs through
improved negotiations and recognition by both sides on
what is driving costs.
A 5% reduction in discounts through contract expansion
and extensions by identifying core vendors.
Overall savings of $4 Million in maintenance costs for one
customer.
For more information contact us at [email protected].
$TBD
RAPID RFP Toolkits
33
While most organizations typically perform annual planning sessions, they usually fall short in
building a well-designed and effective three year plan. This lack of long-term planning prevents
the correct sequencing and prioritization of multiple strategic initiatives into a cohesive structure
that delivers the following:
Focus on key initiatives
Understanding of cross functional impact on your
organization
Flexibility to adjust and re-prioritize as your strategy
changes
Balancing of business and IT resources and budgets
Typical retail plans are a list of potential initiatives submitted
by various business units. They are not prioritized across the
enterprise so they lack a cohesive order. Worse, they are
PowerPoint slides loaded with Industry buzzwords related to
executive hot buttons that provides only a high level end state
picture, not the journey to get there.
The roadmap is the properly sequenced set of initiatives that
gets you to the desired end state efficiently, on time and
within acceptable risk levels. It is the guide used to prioritize
WHAT should be done, WHEN (initiative schedule and phases) and, by WHOM (Initiative Owners),
and WHERE countries, regions, banners).
For more information contact us at [email protected].
$TBD
Custom Research
34
Custom Research
IHL offers a wide range of custom research and consulting services to fit your organization’s
specific needs. Key areas of expertise include the following areas:
• Market Analysis (Global or Domestic markets)
• Due Diligence/Acquisition Analysis
• RFP and Vendor Negotiations
• Services Marketing and Development
• Custom Research and Analysis
Projects are bid on a per project basis or time and materials as required. For more information,
please contact us at [email protected].
Speaker's Bureau
35
Speaker's Bureau
Do you need a keynote speaker who can address retail and technology trends? Are you looking
for insight into new technologies and growth strategies? Are you looking for better understanding
of who is competing well with Wal-Mart?
If so, let us introduce you to the IHL Consulting Group Speaker's Bureau.
IHL's leadership team addresses audiences of senior level industry executives at corporate events
and trade association conferences throughout the year. Our team has presented at some of the
largest trade shows in the industry.
Attendees come to hear what IHL consultants have to say about the latest research in retail trends
and technologies. We present hard data from solid primary research so that our clients can make
smarter decisions. We have a wealth of research data to pull from for the development of
customized presentations for your company. We can also provide competitive reviews of the
market and serve as a sounding board for your company's strategies in the market.
Contact us for more detail at +1.615-591-2955 or at [email protected].
Analyst on Call
36
Analyst on Call
Sometimes you just need an outside voice/head to run your plans through. With the Analyst on
Call function, it can work as an ad hoc event or on a monthly retainer (charged quarterly in
advance).
Two options are available:
Ask the Analyst – Up to two hours (one time) for $500 (paid by credit card).
Analyst on Call – In blocks of 15 hours with one of our senior analysts. $3,000 for each block of
15 hours.
Platinum Subscription
37
Platinum Subscription
The Platinum level subscription foregoes all the individual pricing and you get it all. Every
syndicated research report and Sophia for North America and Europe (does not include
WorldView, RAPID Project Toolkits or Analyst on Call.) Whenever IHL releases one of these reports,
we send it directly to your organization. All reports and databases are enterprise-wide electronic
licenses. Platinum Level subscribers also help us prioritize which segments and which
technologies to evaluate and report on going forward. As with the other subscriptions, there is
password access to all reports on our web site and the databases updated monthly
The Fine Print
38
The Fine Print
All of IHL Group’s generally available research products and databases are electronic licenses and
can be shared freely within the purchasing organization and wholly owned subsidiaries. We only
ask that this information not be shared with partners or others outside the purchasing company
without authorization from IHL Group. The license does not extend to joint ventures or other
partnerships. If the relationship is not a wholly-owned subsidiary, then both parties would need a
license. Practically, this implies the following:
1. The purchasing company can use the reports worldwide internally as long as the
international organizations are wholly owned subsidiaries of the purchasing company.
2. The research reports and databases cannot be distributed in whole or in part to partners
or customers without express written approval from IHL Group. The exception to this is for a
mailing list generated from the database that is being used for the exclusive use of fulfillment by
an outside third party. In this case, the mailing list can be used by the third-party to fulfill the
needs of the purchasing organization only.
3. The purchasing company may quote components of the data (limited use) in presentations
to customers such as specific charts. This is limited to percentage components, not individual unit
information. Unit data cannot be shared externally without express written approval from IHL
Group. All references to the data in presentations should include credit to IHL Group for the data.
4. The purchasing company can reference qualitative quotes in printed material with written
approval from IHL Group.
5. All requests requiring written approval should be submitted to [email protected] and will
be reviewed within one business day.
For any questions regarding this policy, please contact us at 888-IHL-6777 or email us at
We accept Credit Card Payments on Visa, MasterCard and American Express. For international
orders we offer wire transfer options. For domestic orders above $1,000 we will accept Purchase
Orders from approved companies.
All pricing contained herein is valid as of the publication date and supersedes any pricing from
previous price lists.

Order Form
39
IHL Group Research Order Form Cloud POS - Why the Time Might Be Right ...........…………………………………………............................ $1,495
Mobile POS : Reaching Escape Velocity - All Systems Go ....……………..…............................................. $3,495
POS Software for Hard Goods Retailers – A Retailer’s Guide ……..………………………………………….. $795
POS Software for Soft Goods Retailers – A Retailer’s Guide………………….............................................. $795
North American Retail POS Terminal Study ……………………………………………................................... $3,495
Europe/Middle East/Africa POS Terminal Study ……………………………………………............................. $3,495
Asia/Pacific Electronic POS Terminal Study …………………………...……………….................................... $3,495
Latin/South America POS Terminal Study …………………………...………………....................................... $3,495
North American Retail POS Printer Study ……………………………………………....................................... $3,495
North American Self Service Kiosks Study ……………………….…………………........................................ $995
SMB Sizing for Retail & Hospitality .............................................…………………………............................ $2,000 - 4,800
RIS News/IHL Group Store Systems Study “Stores Reinvented”…..................………………….………...... $3,495
Black Ops IT – Rise of the CMO and HR in IT Spending?…………….……………………........................... $1,995
Inventory Distortion - Retail's $800 Billion Problem .......……………………………………........................... $1,995
Mobile POS Hardware Vendor Market Share ................……………………………………........................... $4,000 - 24,000
Mobile POS Software Vendor Market Share ................……………………………………............................ $1,500 - 6,000
POS Terminal Hardware Vendor Market Share ……………………………………...................................... $29,000
WorldView - IT Sizing Worldwide ……………………………………............................................................ $1,500 & up
Insight IT Spend - Powered by Sophia ……………………………………................................................... $2,000-8,000
Sophia – Wisdom for IT ………………............................................................................………................ $195 - 2,000
Key Retail Decision Makers …………………………………….......................................……………..…...... $750 & up
Sophia Knows Your Trade Show …………….................................................................………................ $995
RAPID RFP Toolkit - POS ………………………………..........................................…………………..…..... $TBD
RAPID RFP Toolkit - Fresh Item Management ………….....................................…………………..…..... $TBD
RAPID RFP Toolkit - Workforce Management ……………………………..............…………………..…..... $TBD
RAPID RFP Toolkit - Hardware Maintenance …………..........................................…………………..…... $TBD
RAPID RFP Toolkit - Retail Technology Roadmap …..........................................…………………..…..... $TBD
Ask the Analyst or Analyst on Call ……………….....…..........................................…………………..…..... $500-3,000
Other ______________________________________ Subtotal: _________________
Total : _________________
Ordering Information – Billing Address of Card
Name
Organization
Address 1
Address 2
City
State/Prov. Country Postal Code Phone Fax Email
Payment Credit Card Type: MasterCard Visa American Express Bill Me/PO
Name on Card
Card Number
Exp. Date (mm/yy) Security Code
For easy ordering call 888-IHL-6777 or +1 615.591.2955 or email [email protected] or fax this
form to 888-445-6777.