
Price Expectations and the Australian Price Level: 1901–30
11
Price Expectations and the Australian Price Level: 1901-30* DAVID POPE University of New South Wales, Kensington, NS W 2033 This paper examines the sources of change in Australian prices in the jrst three decades of this century. It probes the information content of simple ‘money is dominant ’ models of inflation and of the expectations-augmented Phillips curve and shows that price expectations played a drumatically diferent role then than in the 1970s. I‘ Between Federation in 1901 and the Great Depression Australian prices doubled. This advance was by no means smooth. Prices generally fell before 1907-08, thereafter they broke into a rough sometimes faltering canter which was to turn to a full gallop just after the war. Then in 192&21 inflation suddenly stopped. Prices actually fell sharply in 1921-22 after which they moved little on balance. The purpose of this paper is to examine the causes of the rate of inflation in these years. Striking though these changes were, this period in Australia’s monetary history has received scant attention. Moreover, pieces to the puzzle of price changes glint with a certain relevance for more recent discussions. The period witnessed a war more damaging and disruptive than Vietnam was to Australia and the West, a war largely financed by belligerents inflating their money supplies. The years also encompassed periods of strong ‘wage push’ in Australia, wide variation in Australia’s real output about its trend, and sharp changes in indirect tax rates and overseas prices. There is also an important dissimilarity. Though Australia’s *I am grateful to Len Perry, John Nevile, Robin Pope, Steve Nicholas, Jonathon Pincus, members of a Monash economic history seminar and two referees for assistance, and to Bill Rao and David Merrett for earlier discussions on aspects of the subject of this paper. inflation rate at its peak was higher than in recent times, inflation was decidedly less persistent then. This points to a weaker or different role of inflationary expectations in price formation in the past. I Price Movements and Contemporary Comment The empirical work of this paper examines the rate of change in the GNE deflator. The high correlations between this and other price series (Table I), suggest, however, that our results should be germane to an explanation of price movements in general. This view is strengthened when we compare the average inflation rates shown by the GNE deflator and three alternative product and consumer price series for several ‘epochs’ of our period (Table 2). This is not to suggest, of course. that movements in the series were in accord in every year. Contemporary discussion of price movements focused, not surprisingly, upon the very high inflation which immediately followed the war. Newspapers at this time must have seemed to their readers to be full of two things: Bolshevism and profiteering. Indeed, the Bulletin (1919) went SO far as to link soaring prices and Bolshevism together: Bolshevism is essentially a stomach disease: its irrationality is due, as Cat0 noted, to the fact that 328
-
Upload
david-pope -
Category
Documents
-
view
213 -
download
0
Transcript of Price Expectations and the Australian Price Level: 1901–30

Price Expectations and the Australian Price Level: 1901-30*
DAVID POPE University of New South Wales,
Kensington, N S W 2033
This paper examines the sources of change in Australian prices in the j r s t three decades of this century. I t probes the information content of simple ‘money is dominant ’ models of inflation and of the expectations-augmented Phillips curve and shows that price expectations played a drumatically diferent role then than in the 1970s. I ‘
Between Federation in 1901 and the Great Depression Australian prices doubled. This advance was by no means smooth. Prices generally fell before 1907-08, thereafter they broke into a rough sometimes faltering canter which was to turn to a full gallop just after the war. Then in 192&21 inflation suddenly stopped. Prices actually fell sharply in 1921-22 after which they moved little on balance. The purpose of this paper is to examine the causes of the rate of inflation in these years. Striking though these changes were, this period in Australia’s monetary history has received scant attention. Moreover, pieces to the puzzle of price changes glint with a certain relevance for more recent discussions. The period witnessed a war more damaging and disruptive than Vietnam was to Australia and the West, a war largely financed by belligerents inflating their money supplies. The years also encompassed periods of strong ‘wage push’ in Australia, wide variation in Australia’s real output about its trend, and sharp changes in indirect tax rates and overseas prices. There is also an important dissimilarity. Though Australia’s
* I am grateful to Len Perry, John Nevile, Robin Pope, Steve Nicholas, Jonathon Pincus, members of a Monash economic history seminar and two referees for assistance, and to Bill Rao and David Merrett for earlier discussions on aspects of the subject of this paper.
inflation rate at its peak was higher than in recent times, inflation was decidedly less persistent then. This points to a weaker or different role of inflationary expectations in price formation in the past.
I Price Movements and Contemporary Comment The empirical work of this paper examines the
rate of change in the GNE deflator. The high correlations between this and other price series (Table I ) , suggest, however, that our results should be germane to an explanation of price movements in general. This view is strengthened when we compare the average inflation rates shown by the GNE deflator and three alternative product and consumer price series for several ‘epochs’ of our period (Table 2). This is not to suggest, of course. that movements in the series were in accord in every year.
Contemporary discussion of price movements focused, not surprisingly, upon the very high inflation which immediately followed the war. Newspapers at this time must have seemed to their readers to be full of two things: Bolshevism and profiteering. Indeed, the Bulletin (1919) went SO far as to link soaring prices and Bolshevism together:
Bolshevism is essentially a stomach disease: its irrationality is due, as Cat0 noted, to the fact that
328

1982 PRICE EXPECTATIONS 329
TABLE I
Correlation between Price Series
~~
' A'and'C Private non- GNE GDP series 'A' rural product
deflator deflator linked series deflator
Implicit G N E deflator I .oo Implicit GDP deflator .99 I .oo Consumer prices ('A' and ' C series linked) .99 .9n I .oo Consumer prices ('A' series) .98 .99 .97 I .oo Private non-rural product deflator .99 .9n .9n .99 I .oo
Sourcei and nail%'
'A ' and 'c' coiismcr pricm Irehiling to capilal cilics wilh four hcdroorn rcnt cornponenil from Comrnonwwltll of Australri. L.uhiir Riy,rt.s; GDP. GNE. export and import deflators from. or cornputd with ddia appurinr in. Buthn. M. W. (1977). 'A Pwlirninary Annual Daiabux.. 11)00/01-1V73'74'. RLxrvc Bank o i A u w d i a . Rnrirrch 0i.wii.v.vion P u p . 77Nl. May: Privaic non-rural prducl dcfliitor derived from Butlin. N. G I 19621. .Att.wuIim Dtmirwc Prdticr, h inwmrr l NIIJ Forc,i.vn B i~r ruwi r i~ . lX61-I03&39. Carnbridsc Univcoity Prcrh. Cambridge. The latter 15
hiud on Table 267. ornitling nublic and rural divisions with reducd weight given to conrtruction. this and ihc remaining divirions being apgrcgiled u m g output \harejar weigh!,.
TABLE 2
1901-07 1907-20 1918-20 1920-22 1922-30 IY20-30
Implicit GNE dcflator - 1.7 6.6 11.7 - 2.3 - 0.6 -0.9 Implicit GDP dcflator - 0.8 6.1 10.6 -4.2 -0 . I - 0.9 Private non-rural product dellator -0.3 5.6 I 1.8 - 3.9 0.5 -0.3 Consumer prices
( 'A' and 'C' scrics linkcd) Purely traded goods:
( a ) Export prices (b) Import prices
0.4 5.5 14.5 - 7.0 0.3 - 1 . 2
4.3 4.7 4.3 - 1 1 . 8 0.4 - 2.0 0.9 7.4 13.5 - 1.7 -4.7 -4. I
Sourccs: .I) iw Table I
the belly having no ease cannot listen to reason. So that all Australia's potential saviour (Prime Minister Hughes) has to do is to check the exploitation of its citizens by profiteers and provide the community with the means of doing remunerative work . . . I f this paper were Hughes or any other repatriated Caesar, it would make unconscionable profiteering a criminal offence.
Profiteering implied a system of non-constant profit mark-up on rising wage and other input costs. The Sydney Morning Herald took a different and cooler headed tack. An editorial in the Herald (1920) put the cause down to '. . . a falling off in supplies, an increase in the cost of labour, the inflation of money in circulation' and with this, especially the last point, most observers of the day agreed.

330 THE ECONOMIC RECORD DEC.
Professor Douglas Copland (1920, p. 509), the most prominent of Australia’s economists to study money and prices, concluded in his ‘Currency Inflation and Price Movements in Australia’ that the increase in prices could be explained by ‘. . . (a) increasing prices in foreign trade, (b) diminishing trade and production, and (c) the expansion of the currency’. With regard to profiteering, he said nothing. However, the Reports of the (Commonwealth) Inter-State Commission, whose brief it was to examine the cause of price rises, including rises due to the ‘exploitation of the public through the operation of rings, combines, and manipulation of the market’, provided little evidence of profiteering during the war, nor did the Victorian Royal Commission on High Prices find evidence of it during the days of high inflation just after it. The main cause, in the minds of Victoria’s commissioners, was ‘. . . the great expansion of the currency’ (1919, p. 435). .Some years later Sir Ernest ScoJt (1936, p. 657), in his monumental work, Australia During The War, arrived at the
same answer. Below, we take monetary growth as our point of entry into analysis of price changes during the years, 1901-30.
I I Monetary Growth and the Rate of Inflation We might begin by asking the sources of change
in Australia’s money stock. Much of the story of monetary growth can in fact be told in terms of high-powered money, it being the prime determinant of the monetary expansion in the first two decades and the source of slower growth in the 1920s (Table 3). During the war, and just after it, high-powered money was dominated by two influences. The first was the 300 per cent increase in the note issue between June 1914 and June 1919, the Federal government using notes to finance State government works which kept the latter off the domestic loan market, and also to lend to the banks who in turn lent to the public for purposes of purchasing war bonds. The second was the Australian banks’ London funds, the immediate
TABLE 3
Sources of the Rate of Change in the Australian Money Stock ( A verage per cent per Annwn for Financial Years)
1901-07 1907-20 1918-20 1920-22 1922-30 192C30
Rate of change in money stock 3.7 6.9 8.3 3.7 2.6 2.9 Change due to: t
High-powered money(’) 2.0 7.3 6.9 - 3.0 - .4 - .9 Public’s ratio(b) .3 .2 .3 .2 .6 .5 Banks’ ratio(d .. 9 - .5 1.3 7.0 2.7 3.5 Interaction of ratios .3 - - - . I - . I -
S o U r c a and of Australia. Sydney, 1971. n o w
Dataforthcalculntionssrcf~mS. J. But1in.A. R. Holland R.C. White. A u r i r ~ ~ ~ i r g ~ d M o n r i o r y S i u i b i i u . 1817-1945. RcomeBsnk
This is the change in the money stock that would have been p r o d d by the indiitcd dccenninnnt, if it alone had changed. The basif formulae for these cplcuhtionruc p’ven in Milton Friedman and Anna SchwPnz. A Moncuvy Huroryojihr LlniredSiotes. 1857-1960. National BUMU of Economic Raeueh. P r i m o n University Pma, Princeton, 1971. p. 795. Ohr cakulitionr diRn in that instead of calculating the rapcaive contributions of the dccwmimts uing limply the Lnt and lut points. our Bgures am the mcw of the contributions in the individvll y a n between the two data; the runin8 point ia t k contribution of money ucct growth 0 1902 o m 1901. Slight statistical error due to r o d n g means that the sum of the change due to Ihe proximate dnerminanu does not prrc*cly add to the rate of change in Ihe money stock. Consisting of ash held by Ihe prMi plw wading bnk rcy~va (vault rash Trr~~ury Bilk deposits with the Commonwealth Bank and liquid ESSSU including stcrlin8 bahnas held in London, known u London funds), plus savinpr banlrr’ rc~crvc~. Public’s ratio of dcposiu with commercial vd iog and savings bnks to their holdings of rash. Commercial banks’ ntio of dcpoaits to their -8.
’
(a)
(b) (c)

1982 PRICE EXPECTATIONS 33 1
500
400
C 300 0
E
.- - - .- 200
500
400
3oa
- .9 200 C
- .- E
w
100
1
Implicit GNE deflator (logarithmic scale -m) Rea I GN E
(-logarithmic scale)
Veloc i t . .orninal ENEIW
l - ' ~ ' ~ ' . T " 7 * q 1 " . . 1 " ' .
11 )l 1905 1910 1915 1920 1925
FIGURE I Money Stock. Real Ourput, Prices and Velocity
Financial Years 1901-30 Sources and notes: Data for the calculations are from Butlin, M. W. (1973, '.9 Preliminary Annual Database, 1900/01-1973/74', Reserve Bank of Australia, Research Discussion Paper, 7701. May; GDPT is Gross Domestic Product adjusted for movements in the terms of trade.
Index 200
150 "
0 c
c c 0 c
,100
Rat 0 1-60
,1*70 1-40 1.50
3 0

332 THE ECONOMIC RECORD DEC.
post-war period witnessing an intense but abrupt boom in export receipts.
The financial years 1920-22 saw the collapse of that export boom, which coincided with a world-wide slump marked by contractionary monetary policy in both the United Kingdom and the United States. In Australia, the Commonwealth Bank took over the control of the note issue from Treasury and adopted a hard line on further increases in the note issue. Furthermore, in 1920-21 London funds were not only eroded by the collapse of exports but by long-standing import orders which were unexpectedly filled. The year 1923-24 saw something of a reversal with the rapid accumulation of London funds, owing largely this time to capital inflow, but in the years to 1930 high- powered money, if it had been the only determinant of the money stock, would have caused, on average, that stock not only to stop growing but to shrink. The effect of such shrinkage was cushioned by the rise in the banks' ratio of deposits to reserves, especially in 1920-21. With London funds falling, the banks contracted credit in Australia, but there were limits to the contraction given the long-standing import orders. Nonetheless, the rate of growth in the money supply considerably slowed.
Just how close was the relationship between monetary growth, just described, and prices? The top rows of Tables 2 and 3 attest to some loose correlation between the two. However, were short- term (annual) movements in the rate of change in prices reliably and substantially related to prior movements in the rate of change of the money stock?
Table 4 provides some evidence in this regard. Equation 1.1 simply posits the annual growth rate of the money stock, lagged one year, as the explanator of the annual growth rate of the GNE deflator. Equation 1.3 differs from this in taking as the determinant of the growth rate of prices, monetary growth per unit of the real quantity of goods and services available (RGNE). Equations 1.2 and 1.4 experiment with the lag structure (studies of other periods and countries revealing, typically, lags of the order of one to two years). As the results show, only the estimate embodying the first hypothesis, equation 1.1, is at all reliable. And in this case the proportion of the variance of the inflation rate explained by monetary growth is slight, R2 = .29. Substituting MI for M3 as the measure of the money stock
drops the explanation to .14.' Overall then, it is difficult to escape the conclusion that the degree of direct association between prices and prior movements in the monetary growth rate was really quite weak. Davis and Lewis (1978) have also expressed similar sentiments about the ability of simple 'money is dominant' models to explain Australia's more recent price experience.
III Proximate Determinants of' Prices That the direct association was weak does not
necessarily mean that monetary growth was irrelevant. For changes in the money stock could have affected other variables which were the more immediate orproximatedeterminants of the rate of inflation, for instance, excess demand. Certainly, it must be conceded that monetary forces work through multifarious channels which are not directly observable to those setting or marking up prices. It is to these immediate factors underlying price formation, some of which appeared on the lists of contemporaries of the day shopping for the causes of inflation, that we now turn.
Both Copland and some of the Reports of the Interstate Commission on High Prices acknowledged that the Australian price level was influenced by external as well as internal factors. While the former might not be dominant '. . . an increase', wrote Copland (1919, p. 508), 'in the import and export price level would necessitate an increase in the general level of prices in Australia'. One of the earliest econometric enquiries into wages and prices in Australia by Pitchford (l968), also showed such a recognition, movements in domestic prices (1947-68) being explored as a function of variations in the excess demand for labour (i.e. the initial Phillips curve relation), the rate of change of import and export prices and various wage pressure variables. A number of further single-equation studies have examined the importance of both domestic and overseas influences on inflation in Australia in the 1970s with particular emphasis being placed on a previously neglected factor in Phillips curve analysis, the role of inflationary expectations.z It is
'The regression coefficient was significant at the 5 per cent level. Substituting MI in the other formulations of Table 3 produced less satisfactory results; regression coefficients were not significant, dw's unsatisfactorily low. and R2, in each case, was not significantly different from zero.
* See Carmichael (1974). Jonson, Maher and

1982 PRICE EXPECTATIONS 333
TABLE 4
OLS Regression Results: Growth in Money Supply and the Rate of Change in Airsrralian Prices
Rate of Rate of Rate of Rate of change in change in change in change in
M3 in M3in M3IRGNE M3IRGNE Constant R' dw rho SE ( 1 - 1) ( I - 2) in ( I - I ) in ( I - 2)
1.1 .97 (3.32)***
-.O2 .29 1.89 -.01 .o I (1.35)
I .2 .88 .I0 - .03 .30 (2.75)*** ( . W ( - 1.33)
1.3 - ,003 .02 .01 ( - .w (2.42)
I .4 - .003 .oo I .02 .02 (-.a) (.I81 (2.33)
(- .06)
.89 - .02 .04 ( - . l l )
.32 .32 .05 ( I W t
.21 3 2 .06 ( I .82)t
Nola: Dcpendcni variable IS the rite of change in Ihc ONE dcflitor I villucs are in parentheses. There is one (annul) obscrvntion for ench financial F i r . rho nlimaled by ordinary kisi s q ~ a r n from the residuals. '** Significnni ill I per ccrit level-one-tail test.
t Significini ill 10 pcr ccnt level-two-tail lest.
in their genre, most closely Nevile's (1976). that our estimating equations belong.
( i ) The Model
that is.
In ( I ) p stands for the rate of growth in the price level, pd is the rate of growth in prices proximately determined by domestic influences, and p 'the rate of growth in prices proximately determined by foreign influences, that is, we have assumed that the price level is a log linear weighted sum of domestic and foreign price influences, which in turn we assume are log linear weighted sums of their components.'
Foreign influences on the inflation rate are represented by the rate of increase in import prices. p M, and export prices, px, hence
We begin by dissecting the inflation rate in two,
p , = $ P , d + ( I - J / ) B , ' . ( 1 )
Thompson (1974). Nieuwenhuysen and Norman (I97 I), Parkin (1973). Nevile (1976, 1977b). and Rao (1977).
'The log linear form captures the reinforcing effects that may occur when separate price influences put joint
p,.' = np,M + ( 1 - n) p,! (2) Of course, B reflects not only changes in product prices overseas but also changes in freight and insurance costs, and importantly for Australia during our period. changes in the tariff. Domestic influences on the inflation rate are represented by
(3) where A W is award wages, q is medium term productivity (fa designating I three-year moving average centred in year I - 1). kd is the rate of excess demand in the product market, T is the rate of growth in pass-on indirect taxes exclusive of the tarifP, and p is the expected rate of inflation.
The reasoning behind this last equation is as follows. To begin with it is hypothesized that prices were marked up in accord with the historic rate of growth in local input costs and rate of excess
pr" = Pr" [ A @ , - , / 4 , 0 . k t l , T,, pl'1
pressure on prices. For example price setters may resist cost push pressure from domestic sources rather less when the price of import substitutes or imported inputs are also rising.
4To include the tariffin indirect taxes is to double count its effect on prices, which we measure through p "'.

3 34 THE ECONOMIC RECORD DEC .
demand, with the current rate of growth in pass-on indirect taxes-since the information lag is shorters-and with current inflationary expectations. Now at the aggregate level costs largely comprised the wages paid to workers. These in turn depended upon two things, award wages and ‘earnings-drift’. The first appears in equation (3), while the latter can be viewed as a function of two factors already included in (3, namely excess demand pressures and inflationary expectations (employers offered and employees bid for above award rates on the basis of prevailing excess demand and expected prices). It is also proposed in (3) that those marking up prices appraised award wage costs in the light of the trend in labour productivity, weighting the former by the latter; productivity could have been entered as a separate determinant though subsequent empirical estimation supported our specification over this alternative. I
Our ‘wage push’ variable might be expanded by elaborating in turn the determinants of A W I - I in (3).
where p is the rate of growth in prices, C denotes exogenous factors in wage determinations, and i, j are the lags in the award fixing response behind changes in its determinants. The courts and tribunals are thus seen to have varied award wages in accord with changes in the cost of living (their purpose being to catch up to past changes rather than anticipatingfurure ones), with changes in the capacity of industry to pay, represented by ad, and lastly with an exogenous element, namely, social goals, as for example expressed in the 1907 Harvester Judgement ofa ‘living wage’. We do not, however, propose to substitute equation (4) into (3) largely because of consideration of degrees of freedom. The substitution involves three extra explanatory variables, p , - ~ - i , t f - I - j and the difficult-to-measure policy term, t I , all of whose weights in the wage-fixing process changed during the period. It would therefore be necessary to estimate our award wage-fixing equation as a separate equation and while this is of intrinsic interest it is outside the scope of this present study.
A W t - I = A W t - , b , - l - i . 2 f - i - j . 51-11 (4)
51nformation on indirect tax changes was and is instantly (and to the producer costlessly) disseminated by governments. Further, they are not subject to interpretation difiiculties of cost and demand data where changes must persist for a period before price setters react to them.
Nor will we investigate the determinants of changes in the indirect tax rate or those of local excess demand. The tax rate in (3) is treated as a government-determined variable exogenous top,“, and Xdas a predetermined variable (thought of as some function of monetary factors-real balances, interest rates, credit rationing-and non-monetary supply and demand shift factors). As to the last variable in equation (3), we take price expectations to have been a function of past movements in p, that is,
k
h-I pi‘ = 2 b h p i - h ( 5 )
where k is the most distant year of relevance. Substituting equation ( 5 ) into (3) then (3) and (2)
into (1) yields our equation to be estimated. In the context ofAustralia’s ‘small country’ status (and as the tariff was not set in accord withp,), the prices of traded goods can be treated as exogenous. Our estimating equation is thus a reduced form comprising predetermined variables, for which unbiased, efficient and consistent estimates should be obtained by OLS.
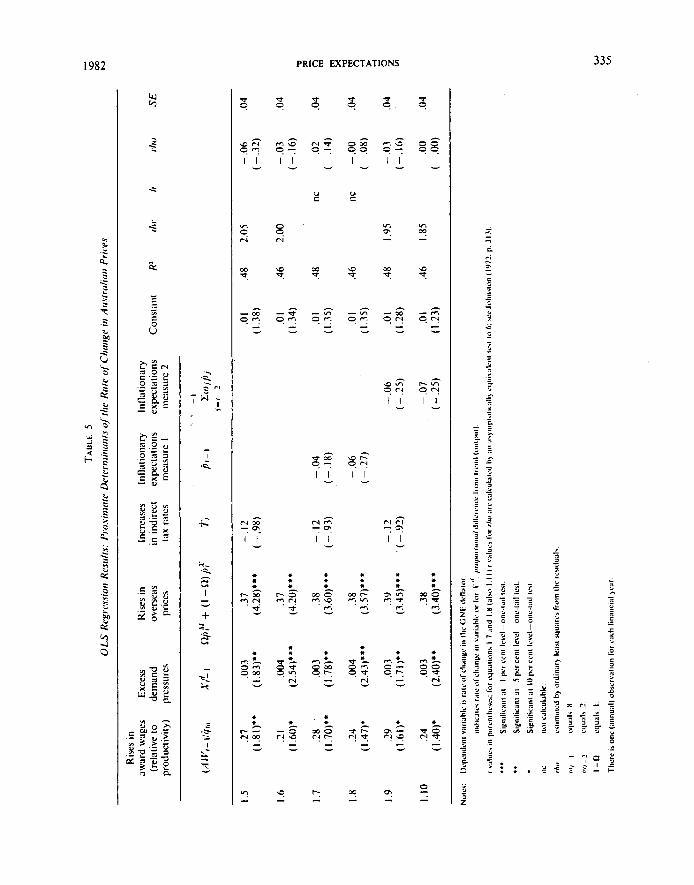
(ii) Regression Results In the OLS regression results reported in
Table 5, excess demand pressures are measured by the proportional gap between actual and normal (i.e. trend) market sector real output. The productivity term in our ‘wage push’ variable is a three-year moving average (centred on 1-1) of market sector real output per market sector worker, adjusted for changes in the normal number of hours in the working week; the moving average proxies ‘medium term’ productivity growth in the minds of those marking up prices. Indirect tax rates, column 4 of the same table, relate to indirect tax receipts, netted of customs revenue, and expressed as a proportion of private consumption. With regard to the anticipated rate of price change, this has been measured in two ways: first by j l - I and, second, by a simple weighted average of the rate of price change in the two preceding years. Lastly, the fractions used in our index of foreign influences on the inflation rate were estimated by regression analysis of the (GNE) inflation rate entering the rate of change in import and export prices separately alongside the other explanators. The regression coefficients of the rates of change in the two foreign prices give (as a proportion of their sum) the respective weights for combining these
TA
BL
E 5
0 LS
Rcg
irw
ioii
Res
irlrs
: P
rosi
iiif
itc
Div
eri1
iiii
iiii
r.s
qfrl
ii, R
ore
of C
liriir
ge i
ii A
irsr
rcili
uii
Pric
es
Rise
s in
aw
ard
wag
es
Exce
ss
Ris
es in
In
crea
ses
Infl;
ition
ary
Infl;
ilion
ary
prod
uctiv
ity)
pres
sure
s pr
ices
ta
x ra
tes
mea
sure
1
mra
sure
2
(rel
ativ
e to
de
man
d ov
erse
as
in i
ndire
ct
expe
ctat
ions
ex
pect
atio
ns
Con
stan
t R
L rlw
h
rlio
S
E
I .5
.27
,003
.3
7 -.
I2
(l.8
1)**
(1
.83)
**
(4.2
8)**
* (-
.98)
I .6
.?I
,004
.3
7 (I
.60)
* (2
.54)
***
(4.?
0)**
*
I .7
.28
,003
.3
8 -.
I2
(1.7
0)**
(l
.78)
**
(3.6
0)**
* (-
.93)
I .8
24
,0
04
.38
(I .4
7)*
(2.4
3)**
* (3
.57)
*'*
1.9
.2Y
,003
.3Y
(I
.6l)
* (1
.71 )
**
(3.45)* * *
1.10
.2
4 ,0
03
.38
(I .4
0)*
(2.4
0)**
(3
.40)
***
-.I2
- .9
2)
- .0
4 (-.
IX)
- .0
6 ( - .2
7)
- .0
6 ( -
25)
- .0
7 ( -
.25)
.o I
.48
1.38
)
.o I
.46
I .34
)
.01
.48
1.35)
.o I
.46
1.35
)
.0 I
.48
I .28
)
.o I
.46
I .23)
2.0s
2.00
I .YS
I .85
nc
11c
- .0
6 .0
4 (-
.32
)
- .0
3 .0
4
i - .0
3 .0
4 0
(-.1
6)
zj
.oo
.04
( .00)
w
W
v,

3 36 THE ECONOMIC RECORD DEC.
influences. Needless to say aggregating foreign influences in this way conserves precious degrees of freedom.
Turning to the results, three influences consistently proved statistically significant, 'wage push', excess demand pressures and overseas prices. the last of these being our index of imported inflation. Nor is there evidence of the reported significance levels being biased. In equations (1.9, (l.6), (1.9) and (1.10) the hypothesis of first-order serial correlation can be expressly rejected at the 5 per cent level of significance, and in equations ( I .7) and (1.8) while Durbin's 'h statistic' could not be calculated, the t values of rho lead us to believe that serial correlation, in any marked degree, is not present. Our conclusion of the significance of these three sources of change in prices is retained when instead of measuring excess demand in the product market, i t is measured in the labour market by the inverse of the unemployment rate lagged one period, as shown below. p i = - .04 + .25 A W / - l / t j / u
(-1.44) (1.50)* + .29 Ul:'~+' .38 nPY+(i-n)pf
(2.14)** (3.50)** * -.I2 T , - .43 i ) , - l
( - .93) ( - 1.47)
. R2 = .52 h : nc rho = .09 S E = .04 (1 .11) (.07)
where U is the unemployment rate. Our two 'preferred equations', (1.7) and (1.1 I). also confirm the s h o r h n trade-off between excess demand pressures and the rate of inflation during the first three decades of this century.
The estimates of the remaining determinants posited, the growth of indirect taxes and the past growth of prices, were both negatively signed and unreliable, judged by conventional levels of significance employing two-tail tests. Though not reported, neither lagging the growth of the tax rate nor changing the functional form in which the variable was entered (simply entering the rate, rather than the rate of change of the indirect tax rate) altered the attached negative sign or changed the t value.
That our estimates of the effect of past changes in prices on the inflation rate are negatively signed differs radically from recent evidence of the formation of inflationary expectations. These studies show that price rises cause people to expect further price rises which fuels inflation; by contrast
our results can be interpreted as suggesting that price rises led to the expectation of future price decreuses. Such a result is, we believe, explicable in terms of the history of price changes and of the greater degree of economic instability that prevailed then than now. Taking 1901-30, the majority of these years witnessed price rises followed by price falls, or price falls being followed by price rises. Moreover, Australians who lived through the first three decades of the century were no strangers to economic fluctuations. The 1890s depression would have been in the living memory of most. There was no wide-scale counter-cyclical government-demand management, nor White Paper preaching the objectives of full employment and price stability. Unemployment was deplored, but the unemployed wore more easily then than now. And to Australians of these earlier decades rising prices one year would not automatically convey rising prices in the next. Indeed, more common may have been the belief in some normal level of prices. In this case the anticipation following price r ises would be for some lowering of prices, a hypothesis tentatively supported by our findings of a negatively signed expectations coefficient. In this regard it is perhaps not without importance that the Deputy Director of the Commonwealth Arbitration Court, Justice Powers, whose job it was to delve into the timing and equity effects of price movements, viewed the continuing rise in prices during 1920 as '. . . unexpected and abnormal' (1921, p. 716). Inflation one year did not seem to automatically connote continuing inflation.
The absence of any positive expectations 'push' following price rises aids in explaining the unexpected negative sign attached to the coefficient of indirect taxes. Increases in indirect taxes have two obvious effects. As costs they are passed on to the consumer, putting immediate upward pressure on prices. In time, however, the rise operates to cut back aggregate demand, hence militates against future price increases? Now with positive expectations fo/lowing price rises, the immediate period of the cost effect ofan increasein the indirect tax rate is lengthened. In the absence of such inflationary expectations the period of the cost effect is more temporary and likely to be
In simulations of the Australian economy commencing 1970-7 I , Nevile found that the effect on the inflation rate of indirect taxes changed from positive to negurive after two years; see (1977a) especially pp. 20-1.
1982 PRICE FXPECTATIONS 331
overshadowed by the beginnings of the aggregate demand effect. The weak negative sign attached to our estimate of f, can be interpreted in this light.'
O u r finding concerning negative price expectations Jollowing price rises also helps to explain the likely existence of a trade-off between the rate of inflation and excess demand in the long run. Long-run equilibrium attains where the rate of growth in the GNE deflator, foreign prices and price expectations are equal, that is, wherepl' = p / = p, . And the smaller the coefficient of p' the less likely i t is that the combined coefficients o f j e a n d p J will sum to unity, hence the less likely that the complement of their sum will be zero-the condition for no long-run trade-off. Even if we take two standard deviations from the coefficient estimates of p' and jd in the direction most favourable to the hypothesis that there was no long- run trade-off, these coefficients sum to well below unity. We take this as support for the view that i f during our period e q u i l i b h m had in fact prevailed, then there would have still been a trade- off between the rate ofprice increase and the rate of excess demand.
(iii) Neglected Factors? While the expectations-augmented Phillips curve
casts considerable new light on pricing behaviour in our period, the power of our estimating equations to explain the variance of the growth of prices is nonetheless limited. Our preferred equations leave roughly half the variance unexplained which is in marked contrast to the power of equations in the same general family to explain inflation in the 1960s and 1970s, Nevile (1977b, p. 223) for instance reporting R2s of .96. At least part of the explanation is perhaps to be lound in the high correlation in these studies between expected ( p ' ) and actual (j,) inflation rates- which was not present in our period. In this case much of variance left 'unexplained' in our study might be due to random elements. The other possibility is that our study neglects one or more important determinants of price movements during the period.
' I t is to be remembered that t is netted of the tariff (which is included inpM). Though also an indirect tax, we view the effect of tariff rises as singularly inflationary in that tariffs distorted resource use more than other indirect taxes-as the other indirect taxes were levied on goods for which the demand was typically highly inelastic.
At the aggregate level the costs of domestic raw materials are unlikely to have been a major f x t o r (imported ones are already included) nor capital costs, and interest rates and movements in foreign reserves have been indirectly included via the excess demand measures of our study. A more promising avenue for future research, however, might lie in an examination of monopoly and administrative elements in pricing. The question is not the absolute degree of monopoly present but rather whether that degree, or the awareness and use by economic agents of it, voried significantly. Although investigations of two commissions failed to find much evidence of the burst of profiteering that the Bulletin took for granted, historian Humphrey McQueen (1978) and sceptics at the time have implied that the commissions were not designed to discover the truth. Moreover, there was an increasing level of government and quasi- government regulation of prices during the period. Most war-time controls of prices may not have been terribly successful but the post-war period saw the growth of domestic as well as overseas marketing schemes, the effects of which on the price level have yet to be fully explored.
APPENDIX
Notes and Sources of Data used in Regressions GNE deflator ( p ) : As for Figure I , Excess demand ( X ) : Proportional deviation from trend
( T x ) where T x = zo + a1 Time + (Time)2. Market sector product is G D P minus public consumption and investment plus public imports. The government share in imports is based on an estimate of their share of imported construction materials. Data from Butlin, M. W. (1977). 'Preliminary Annual Database. 1900/01-1973/74'. Reserve Bank of Australia, Research Discussion Paper, No. 7701. May; imported construction materials from Butlin, N. G. (1962). Australian Domestic. Product, Investment and Foreign Borrowing. 1861-1938/39, Cambridge University Press, Cambridge.
Productivity (9) : The proportion employed in rural and mining activities was derived from Butlin, N. G. and Dowie, J . A. (1969). 'Estimates of Australian Workforce and Employment, 1861-1961'. Australian Economic History Review.* September. The complement of this proportion times total private employment yielded an estimate of non-farm market employment. Private employment is from Barnard, A., Butlin, N. G., and Pincus, J . J . (1971), 'Public and Private Sector Employment in Australia, 1901-1974' in Australian Economic Review, first quarter (Table I).

338 THE ECONOMIC RECORD DEC.
Hours in the normal working week from Commonwealth of Australia. Labour Reports. Data sources for the numerator of the productivity index are given for X above.
As for Figure 1 t Import, export prices U M, p x, Award wages ( W 1 Indirect taxes (T)
REFERENCES Bulletin (1919). September 18. Copland, Douglas (1920). 'Currency Inflation and Price
Movements in Australia', Economic Journal, XXX, December, 484409.
Carmichael, J. (1974). 'Modelling Infiation in Australia', Fourth Conjerence of Economists, Canberra.
Commonwealth Parliamentary Papers ( I 91 7-1 9) I
'Reports of the Inter-State Commission', V, 77-502. Davis, K. and Lewis. Mervyn (1978), 'Money and
Income: Evidence from Simple Models' in Porter, Michael, G. (ed.), The Au.tralian Monetary System in the 1970s. Faculty of Economics and Politics, Monash University, 127-40.
Johnston, J. (l972), Econometric Methods, McGraw-Hill, London.
Jonson, P. D., Maher, K. K., Thompson, G. J. (1974). 'Earnings and Award Wages in Australia', Australian Economic Papers, 13, June, 80-90.
McQueen, Humphrey (1978). 'Shoot the Bolshevik! Hang the Profiteer! Reconstructing Australian Capitalism, 1918-21' in E. L. Wheelwright and Ken Buckley. Essays in the Political Economy of Australian
Capitalism, Australia and New Zealand Book Company, Sydney, 186-206.
Nevile. John W. (1976), 'Australian Inflation: Made at Home or Imported' in Kasper, Wolfgang (ed.). Internafional Money--Experiments and Experience. Department of Economics, Australian National University, Canberra, 1976,219-32. - (1977a), 'Tax Cuts as an Anti-Inflationary
Weapon', CAER paper no. 3, Sydney. - (197%). 'Domestic and Overseas Influences on
Inflation in Australia', Australian Economic Popers. 16. June. 121-9.
Nieuwenhuysen, J. P. and Norman, N. R. (1971). 'Wage Policy in Australia: Issues and Tests', British Journalof Industrial Relations, 9, 353-70.
Parkin, M. (1973). 'The Short-Run and Long-Run Trade- Offs Between Inflation and Unemployment in Australia', Australian Economic Papers, 12, December, 127-44.
Pitchford, J. D. (l968), 'An Analysis of Price Movements in Australia, 1947-68'. Australian Economic Papers, 7, December, 11 1-35.
Powers, Mr Justice (1 92 I), Commonwealfh Arbitration Reports, IS, 716.
Rao, B. B. (1977). 'An Analysis of the Short and Long- Run Trade-offs Between Unemployment and Inflation and Estimates of the Equilibrium Steady State Unemployment Rate in Australia', Auslralian Economic Papers, 16, December, 273-84.
Scott, E. (1936). Australia During the War. Angus and Robertson, Sydney.
Sydney Morning Herald (1920). August 13. Victorian Parliamenfary Papers (1919). 'State Royal
Commission on High Prices', 11, 373-437.


![[XLS] Web view1/1/1901. 1/1/1901. 1/1/1901. 1/1/1901. 1/1/1901. 1/1/1901. 1/1/1901 10001. 1/1/1901. 1/1/1901 10101. 1/1/1901. 1/1/1901 10201. 1/1/1901 …](https://static.fdocuments.us/doc/165x107/5aaa1d557f8b9a86188db0af/xls-view111901-111901-111901-111901-111901-111901-111901-10001.jpg)

![MARCH, 1901. PRICE ONE PENNY, - Missiology.org.uk · 2021. 1. 4. · [MARCH, 1901, NORTH AFRICA. ,he ]Jey's! Courf of Jusfice, ,uqis. ~obt s )Provibence. "Who knoweth whether thou](https://static.fdocuments.us/doc/165x107/61076c1c9c6d9f17582f51f4/march-1901-price-one-penny-2021-1-4-march-1901-north-africa-he-jeys.jpg)
![[XLS] Web view1/1/1901 1/1/1901 1/1/1901 1/1/1901 1/1/1901 1/1/1901 1/1/1901 10001 1/1/1901 1/1/1901 10101 1/1/1901 1/1/1901 10201 1/1/1901 10203 1/1/1901 10205 1/1/1901 10207 1/1/1901](https://static.fdocuments.us/doc/165x107/5ad752677f8b9a6b668cc8fb/xls-view111901-111901-111901-111901-111901-111901-111901-10001-111901.jpg)
