Price Envelopes for European Gas - Gazprom Export · Price Envelopes for European Gas Flame,...
21
Price Envelopes for European Gas Flame, Amsterdam , May 8, 2017 Sergei Komlev Head Contract Structuring and Price Formation Directorate Gazprom Export* *Views expressed in this presentation are the author’s sole responsibility and do not necessarily represent that of Gazprom Export
Transcript of Price Envelopes for European Gas - Gazprom Export · Price Envelopes for European Gas Flame,...

Price Envelopes for European Gas
Flame,
Amsterdam , May 8, 2017
Sergei Komlev Head Contract Structuring and Price Formation Directorate
Gazprom Export*
*Views expressed in this presentation are the author’s sole responsibility
and do not necessarily represent that of Gazprom Export

© ZMB 2
Market Tightness is Inadequate Criteria for Division of European Gas History into Periods
1) ‘Global gas glut’ (Jun ‘08 – Dec ‘10) only strengthened European gas prices despite the LNG flood. European gas prices just followed oil price recovery prior to Fukushima.
2) ‘Fukushima tightness’ (Mar ‘11 – Dec ‘14) gave no special momentum to gas price developments: erratic fluctuations of gas prices completely ignored outflow of large LNG volumes from Europe.
3) ‘Oversupply and price convergence’ (Dec ’14 – current): although gas prices start to weaken prior to September 2014 due to abnormally warm Q1 2013, their collapse coincided with oil price drop on the market which has already rebalanced itself.
Use of market tightness indicator for periodization of European gas history creates parallel reality. It drives to an absurd conclusion that oversupply leads to higher prices.
Source: Adapted from Timera Energy

© ZMB 3
Inter-Fuel Competition Defines Upper and Lower Price Range Levels for Natural Gas
Ceiling
Floor
Oil/Oil products parity
Coal parity
Source: Gazprom Export

© ZMB 4
Gas Price Corridor Width is Determined Mainly by Oil Price Volatility
and Stretched from 0.8 MMBTU in 1998 to 15 MMBTU in 2012
4
Source: BP
Source: BP, Gazprom Export Source: BP, Gazprom Export

© ZMB 5
Oil Price Sets a Resistance Level for Natural Gas Prices
•
Source: BP, Gazprom Export

© ZMB 6
Coal Price Sets a Support Level for Natural Gas Prices
•
Source: BP, Gazprom Export

© ZMB 7
Depressed NA Natural Gas Prices are Competitive with ‘Expensive’ Grades of Coal Only
* Coal and natural gas prices compared on an equivalent energy content and efficiency basis

© ZMB 8
Competition with Other Hydrocarbons Locks Natural Gas in Price Envelope
8 Source: Shell Source: Shell
© ZMB 9
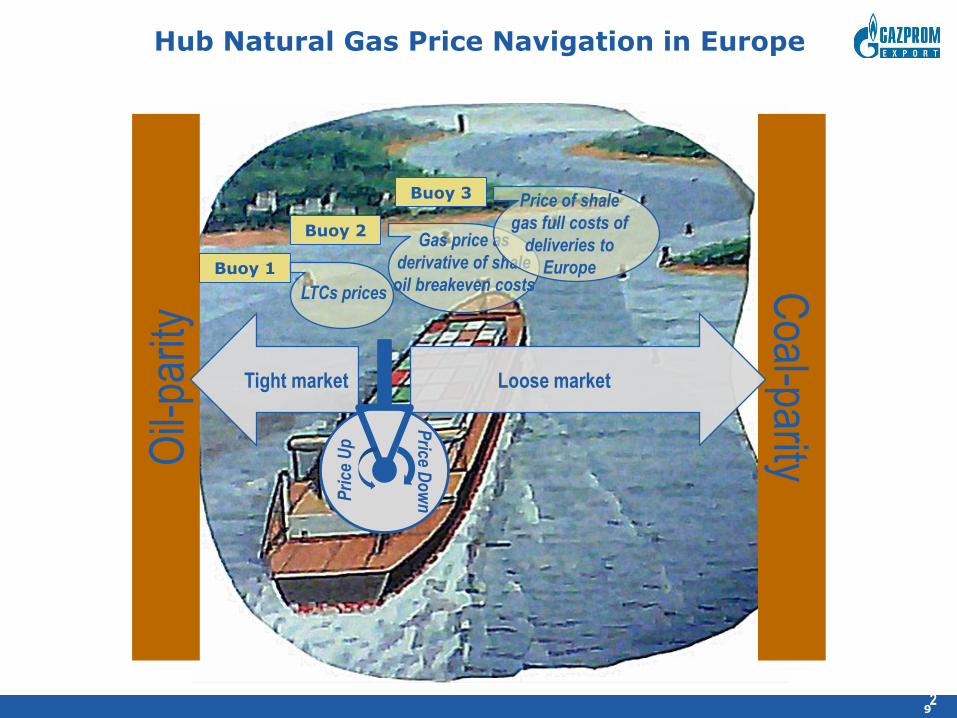
Hub Natural Gas Price Navigation in Europe
2
Oil-
parit
y C
oal-parity
Loose market Tight market
Buoy 1
Buoy 2
Buoy 3
LTCs prices
Gas price as
derivative of shale
oil breakeven costs
Price of shale
gas full costs of
deliveries to
Europe
Pri
ce U
p
Price D
ow
n

© ZMB 10
Bouy#1. Prices of Long-Term Supply Contracts set a Strong Resistance Level for Hub Prices in Europe

© ZMB 11
Bouy #1. Hub-Based Gas Prices in Europe Move in Tandem with Oil/Quasi Oil-Indexed Contract Prices
Even if oil-indexation elements are being substituted by hub ones, prices of LTCs exercise strong influence over hub prices and are setting up a trajectory for their movement by acting as “price anchor”. Hub prices are therefore not independent: they are derivatives of the contract prices that set a baseline trend for their behavior. Supply and demand only mutate their changes
Source: BAFA, Bloomberg, World Bank

© ZMB 12
Bouy #1. Extreme Weather Conditioned Pushed TTF Prices above BAFA for Nearly Two Months
Source: BAFA, Bloomberg

© ZMB 13
Bouy#2. ACER 2016 Report: Correlation between Oil and Gas Prices is High

© ZMB 14
Bouy #2. Correlation and Regression Analysis Indicates that TTF Price Dependence on Oil Prices is Increasing
Correlation
(TTF MA,
USD/mcm)
Time period Brent,
USD/barrel
Oil Price:
Six month
moving
average
Oil Price:
Nine month
moving
average
2008-2016 76.6% 85.5% 83.3%
2008-2013 69.9% 84.7% 81.9%
2014-2016 79.5% 87.3% 88.7%
R Squared
(TTF MA,
USD/mcm)
2008-2016 58.6% 73.1% 69.4%
2008-2013 48.9% 71.8% 67.1%
2014-2016 63.2% 76.3% 78.6%
This effectively means that NA shale breakeven costs which emerged as the major determinant for global oil prices are setting price rage for European hub prices

© ZMB 15 15
Bouy#3. Full Costs of NA LNG Deliveries to Europe
Sources: Bloomberg, Wood McKenzie * P = HH forwards * 115% + liquefaction + shipping to Europe + regasification
Full costs of US LNG delivered to Europe are higher than prices on the European hubs (NBP). NA LNG deliveries are profitable on short-run marginal costs.
Henry
Hub
115%
plant
losses
Ship-
ping to
Europe
Regas Toll Fee
Short-
run Mar-
ginal
Costs
Total
costs NBP MA
Feb-17 2,82 3,24 0,67 0,40 2,37 4,31 6,68 6,36
Jan-17 3,26 3,75 0,67 0,40 2,37 4,82 7,19 6,58
Dec-16 3,58 4,12 0,67 0,40 2,37 5,18 7,55 5,83
Nov-16 2,50 2,88 0,67 0,40 2,37 3,94 6,31 6,19
$/MMBTU

© ZMB 16 16
Bouy#3. Outlook for NA LNG Export to Europe
Sources: Bloomberg, Wood McKenzie
* P = HH forwards * 115% + liquefaction + shipping to Europe + regasification
Full costs of US LNG delivered to Europe are higher than European hub prices on a forward curve, although are profitable when tolling fees are excluded.

© ZMB 17
Growing Importance of Forward Market Compared to Prompt Market:
Trading Volumes by Utilities/Midstreamers are Higher than Gas Consumption
Source: IEA, Companies’ Annual Reports
78.0
46.0
35.7
113.6
63.3 58.4
36.2
167.1
40.9
8.0
80.6 80.6
43.7
8.6
84.7 84.7
0
20
40
60
80
100
120
140
160
180
Engie OMV VNG Uniper Engie OMV VNG Uniper
2014 2015
Total Sales Indigenous Consumption
Bcm

© ZMB 18
*Demand Includes import contracts and indigenous production
Source: Cedigaz, Eurostat, IEA, Gazprom Export LLC Database
Overcontraction as Factor of Hub Price Degradation
560
578 577 589
604 601 583 579 575
562
587
609
559 553 546 557
522
561
506 494
486
431 449
486
400
450
500
550
600
650
700
2005 2006 2007 2008 2009 2010 2011 2012 2013 2014 2015 2016
bcm
Contracted volume Consumption
Under-contracted
market
Balanced market Over-contracted market
1
25 31 32
82
39
77 85 89
131 138 123
0
50
100
150
2005 2006 2007 2008 2009 2010 2011 2012 2013 2014 2015 2016
Delta,
bcm

© ZMB 19
Illusion of Oversupply Created by Monetization of Contract Commitments on the European Forward Market

© ZMB 20
There is Need to Rebalance Market by Eliminating Paper and Physical Gas Disconnect
Source: Gazprom Export
Midstreamers LTC Contracts
End-users
Hub
Year-ahead contract
Portfolio
optimization
Sell Q1 volume on
hubs under a
forward contract
that equals MAQ+
Buy back Q2
volume of paper
gas that equals
physical demand
by end-users
Under current market conditions:
Q1 > Q2

THANK YOU FOR YOUR ATTENTION!


![INDEX [indianembassyreykjavik.gov.in]indianembassyreykjavik.gov.in/.../Tender-Document... · scribed “Price Bid”.Both these envelopes shall be enclosed in a single sealed envelope](https://static.fdocuments.us/doc/165x107/5f0d59617e708231d439e8e0/index-in-in-scribed-aoeprice-bidaboth-these-envelopes-shall-be-enclosed-in.jpg)