Price Discovery and Causality in Selected Agricultural Commodities - An Empirical Study
10
Price Discovery and Causality in Selected Agricultural Commodities - An Empirical Study Author: Dr. Tanushree Sharma Assistant Professor NIILM- Centre for Management Studies Greater Noida Email : [email protected]
description
Objectives -To study the co-integration between Guargum Spot and Future Price.To plot impulse response function to depict how Spot or Future price respond to shock to itself and to the other variable for the given time period.To innovate the extent to which a variable helps in explaining the other variable through variance decomposition
Transcript of Price Discovery and Causality in Selected Agricultural Commodities - An Empirical Study
Price Discovery and Causality inSelected Agricultural Commodities - An
Empirical Study
Author:Dr. Tanushree Sharma
Assistant Professor NIILM- Centre for Management Studies
Greater NoidaEmail : [email protected]
IntroductionVolatility in six commodities-The Ministry
has already received a report on the price movements of six agriculture commodities. These include pepper, potato, soya oil, soya bean chana and guargum.
India is leading exporter of guar and contributes about 80% to the world guar production.
Guargum price has increased 420 times in 2012 in seven months.
We found that there is no correlation between spot and future prices of Guar.
Objectives - To study the co-integration between
Guargum Spot and Future Price.To plot impulse response function to depict
how Spot or Future price respond to shock to itself and to the other variable for the given time period.
To innovate the extent to which a variable helps in explaining the other variable through variance decomposition.

Methodology and Data
DATA Source:Secondary data from Books, Journals & websites NCDEX. Software used:E-views 5 Tools used:Unit Root Tests (Augmented Dickey–Fuller)Co-integration Test (Johansen-Juselius Maximum Likelihood Co-integration Test)Impulse Response FunctionForecast error variance decomposition Time Period: Nov. 2006 - March 2012 – DailyObservations included -1579
Data and Preliminary Analysis
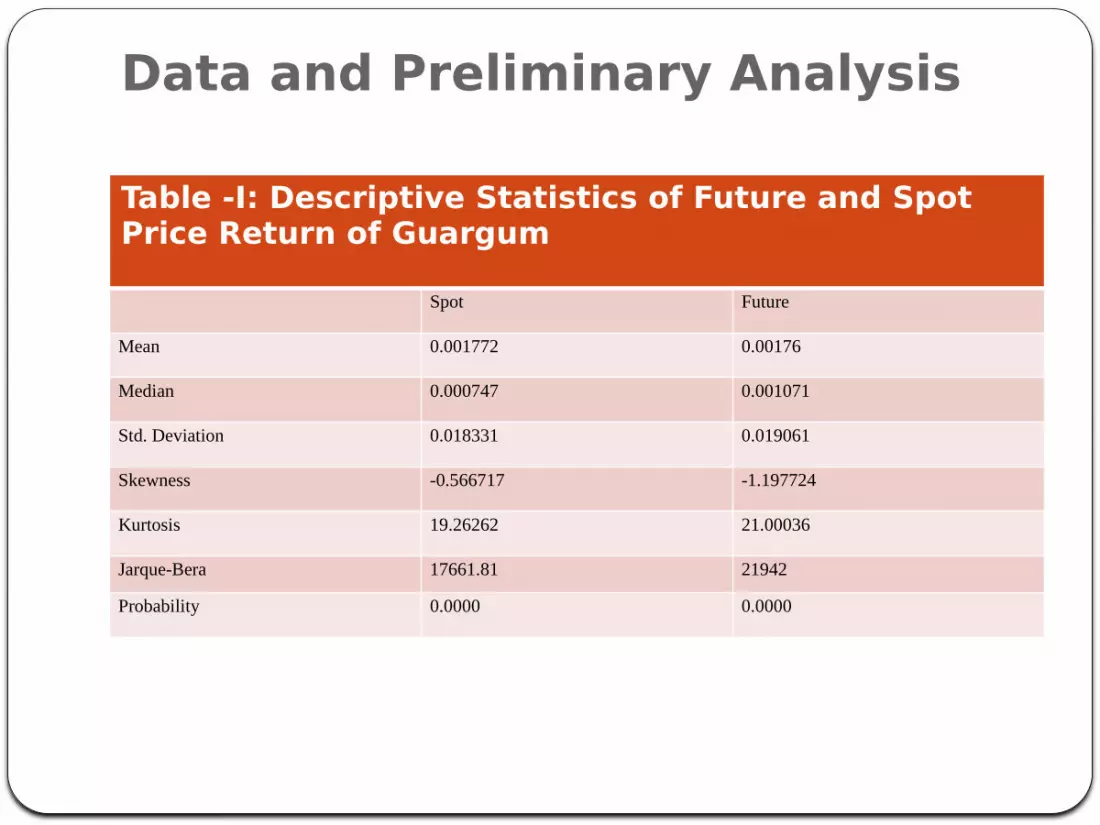
Table -I: Descriptive Statistics of Future and Spot Price Return of Guargum
Spot Future
Mean 0.001772 0.00176
Median 0.000747 0.001071
Std. Deviation 0.018331 0.019061
Skewness -0.566717 -1.197724
Kurtosis 19.26262 21.00036
Jarque-Bera 17661.81 21942
Probability 0.0000 0.0000
0
20000
40000
60000
80000
100000
120000
250 500 750 1000 1250 1500
FUTURE SPOT
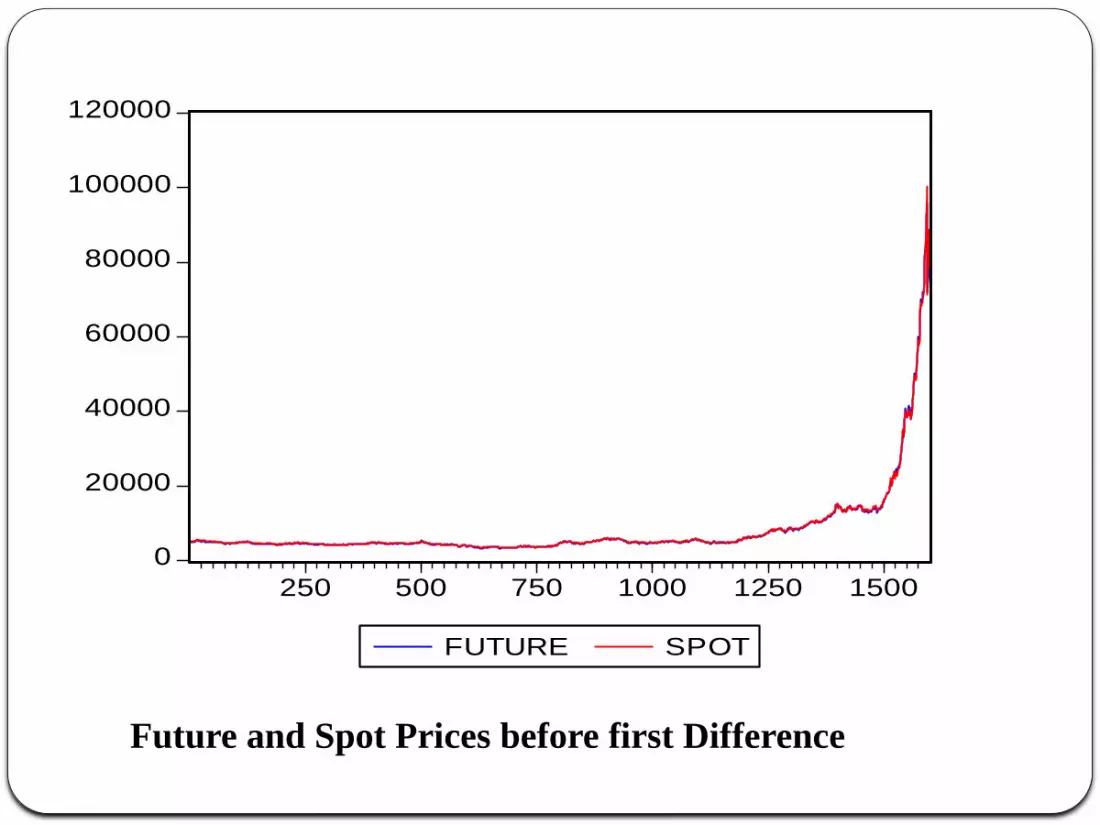
Future and Spot Prices before first Difference
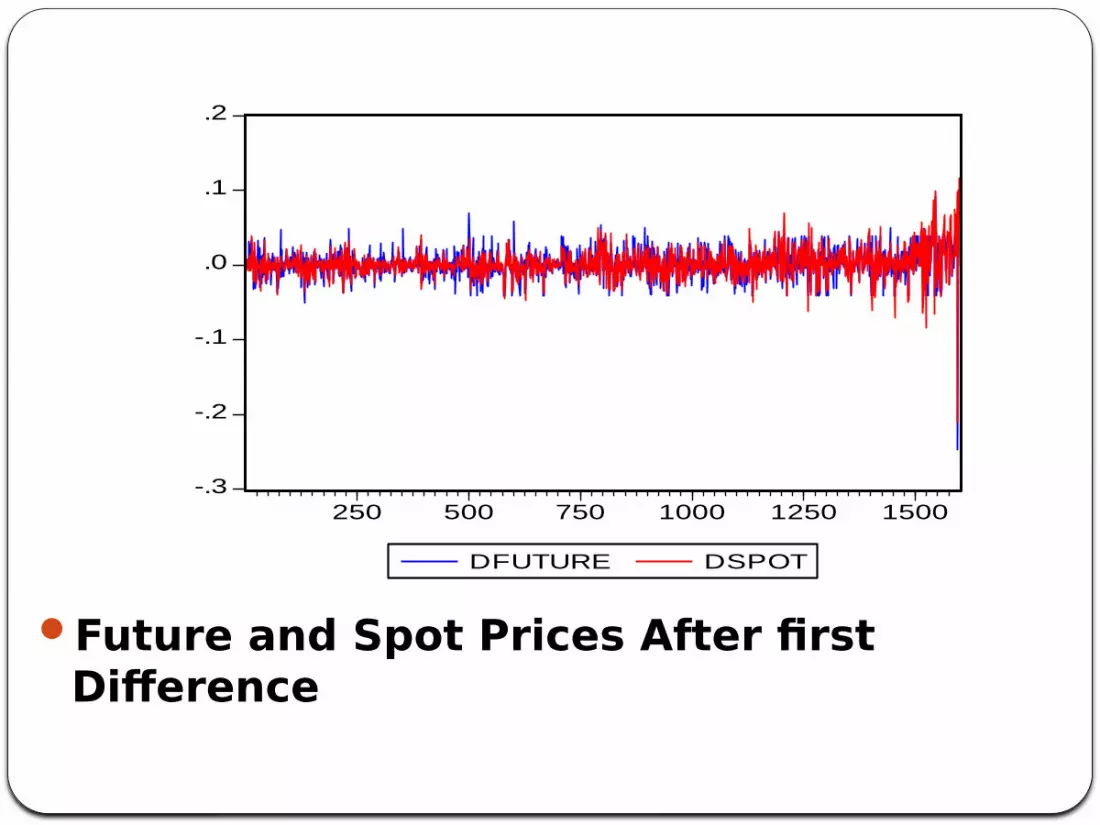
Future and Spot Prices After first Difference
-.3
-.2
-.1
.0
.1
.2
250 500 750 1000 1250 1500
DFUTURE DSPOT
Empirical Results and Discussions
As a preliminary investigation, Augmented Dickey Fuller tests was employed to test the stationarity of spot and future price series of Guar gum.
The result reveals that both the data series of future and spot price of Guargum are stationary after first difference. Table I.docx
Johansen’s Cointegration test is performed to examine the long-run relationship between spot and future markets of Guar gum.
We could not found presence of cointegrating vector between Future and spot prices of Guar gum.Table II.docx
We measured Granger causality between future and spot price of guargum.Table III.docx
To find more detailed study of VAR model , impulse response function and variance decomposition are estimated. Figure III illustrates the estimated impulse response functions for ten days ahead time horizons.Table IV.docx
The forecast error variance decomposition provides an alternative way to look at the finding of the impulse response analysis. It enables in innovating the extent to which a variable helps in explaining the other variables. Table V.docx
Findings -No Cointegration – Guar gum spot and future price
Impulse Response function- The shape of the impulse response graph shows that future market has a larger response to one standard deviation shocks to the spot price than the spot responses to future innovations .
Variance Decomposition- The results of variance decomposition indicate that the spot market shocks dominate over future market. A high percentage changes in forecast error of futures market is explained by the spot market(57.28%).