Price Competition in Canadian Bought Deal Equity Offerings · Price Competition in Canadian Bought...
32
Price Competition in Canadian Bought Deal Equity Offerings Nancy D. Ursel Erdal Gunay Odette School of Business University of Windsor Windsor, ON N9B 3P4 e-mail: [email protected] tel: 519 253-3000 ext. 3102 JEL classification: G24, G28 Acknowledgements I thank Harjeet Bhabra, N. Bhattacharyya, Bernard Black, Nauman Farooqi, Edward Iacobucci, Edward Rosenbaum, Rajeeva Sinha, George Tannous, Barbara Ursel, Michael Van Eesbeek and participants at the 2002 Administrative Sciences Association of Canada Conference, the 2005 Canadian Law and Economics Association Conference, the 2005 University of Windsor Law School “Business Law at the Border Conference”, and the 2005 Odette School of Business Accounting and Finance Symposium for helpful comments
Transcript of Price Competition in Canadian Bought Deal Equity Offerings · Price Competition in Canadian Bought...

Price Competition in Canadian Bought Deal Equity Offerings
Nancy D. Ursel
Erdal Gunay
Odette School of Business
University of Windsor
Windsor, ON N9B 3P4
e-mail: [email protected]
tel: 519 253-3000 ext. 3102
JEL classification: G24, G28
Acknowledgements I thank Harjeet Bhabra, N. Bhattacharyya, Bernard Black, Nauman Farooqi, Edward Iacobucci, Edward Rosenbaum, Rajeeva Sinha, George Tannous, Barbara Ursel, Michael Van Eesbeek and participants at the 2002 Administrative Sciences Association of Canada Conference, the 2005 Canadian Law and Economics Association Conference, the 2005 University of Windsor Law School “Business Law at the Border Conference”, and the 2005 Odette School of Business Accounting and Finance Symposium for helpful comments

2
I wish to gratefully acknowledge the generous financial contribution made by CGA-Canada that supported the research and presentation of this paper.
Competition in Canadian Seasoned Equity Underwriting
Abstract: This study examines the competitiveness of underwriting fees for bought deal seasoned
equity offerings in Canada. Competitive fees are important because they minimize the cost of
raising capital, thereby promoting corporate investment and economic growth. I study the
clustering of fees, the structure of the underwriting industry (concentration, barriers to entry and
profitability) and changes in fee-setting behaviour over the 1987-2004 period. I find structural
factors conducive to reduced competition and some behaviour consistent with a lack of
competition. I discuss changes that would have to be made to improve competition, and highlight
linkages with US and UK markets.
JEL classification: G24, G28 1. Introduction
There have been several US studies of the degree of competition in setting underwriting fees
for both seasoned and unseasoned common stock issues. Though the findings are not unanimous,
on balance the results suggest that, at least in some circumstances, US underwriting fees are non-
competitive, leading to higher than necessary issue costs. One estimate sets this cost at $400
million per year for initial public offerings (IPOs) alone (Smith and Dwyer, p. 163).
In Canada, the competitiveness of underwriting fees has only been studied for initial public
offerings, though there is anecdotal evidence consistent with non-competitive fees in seasoned
issues. The purpose of this paper is to investigate the competitiveness of underwriting fees for
seasoned equity offerings (SEOs) in Canada in the 1987-2004 period. I focus on bought deals
since they dominate the Canadian SEO market. The research will be of particular interest to
firms issuing seasoned equity in Canada, as non-competitive fees will increase their issue costs.
3
Regulators charged with the fair and efficient operation of stock markets should also be interested
in the findings. Non-competitive fees affect anyone with a direct or indirect stake in the growth
of Canadian firms, as inflated fees raise the corporate cost of capital, decreasing the attractiveness
of corporate investment and dampening growth. Thus stockholders, employees and job seekers
are impacted. Finally, the findings could have important implications for Canadian investment
dealers, as their US and UK counterparts have faced government investigations and US firms
have faced lawsuits over potentially non-competitive fees.
To gauge competition, I investigate the structure of the Canadian bought deal industry and
trends which may affect the use of bought deals. Finding moderate concentration and evidence of
high entry barriers (which are conducive to reduced competition), I proceed to investigate
changes in fee setting behaviour in Canada around the time of the UK and US investigations, and
the profitability of issues conducted at the standard fee relative to those conducted at other fee
levels. Because competition may also take place on features of the underwriting contract other
than fees, I incorporate non-price factors such as underwriter prestige and alternative forms of
underwriter compensation into the analysis. The findings are consistent with non-competitive fees
in the 1987-1999 period. I discuss changes that would have to be made to improve
competitiveness, and draw comparisons between the US and Canadian markets.
The remainder of the paper is organized into the following sections. Section 2 reviews the
relevant literature. Section 3 describes the Canadian bought deal market and the data. Section 4
presents the empirical tests and findings, and Section 5 contains concluding remarks.
2. Literature Review
2.1 US and International IPOs
4
Chen and Ritter (2000) note that the underwriting fees for US IPOs cluster at 7% of gross
proceeds, with more than 90% of mid-sized US IPOs conducted between 1995-98 having fees of
exactly 7%. The clustering at an integer level recalls Christie and Schultz’s (1994) exposure of
collusion in spreads on the NASDAQ exchange, and Chen and Ritter similarly conclude that IPO
underwriters engage in “strategic pricing” (implicit collusion), maintaining prices above
competitive levels to ensure investment bank profit and individual brokers’ year-end bonuses.
Torstila (2003) looks at IPO fees in many countries and finds that US fees are
comparatively high: Many Asian countries have fees in the 2-2.5% range. Torstila and
Ljungqvist et al. (2003) explain variation in median fee levels across countries in terms of the
different types of deals that are common in those countries. In the US, bookbuilding is the
standard deal type. Bookbuilding has higher median fees but generally lower underpricing than
the fixed price offerings that predominate in other countries. This tradeoff between fees and
underpricing suggests that clustering need not imply collusion as competition may take place on
non-price factors.
There are other explanations of clustering that do not imply collusion. In markets where
prices are set by negotiation, clustering is a mechanism that reduces bargaining costs Harris
(1991). Hansen (2001) proposes an “efficient contracting hypothesis” that explains IPO
underwriting fee clustering as an efficient pricing mechanism in a market where competition
exists along the dimensions of underwriter reputation and underpricing. He conducts a detailed
analysis of the competitiveness of US IPO underwriting fees. First, he examines those market
characteristics (industry concentration, barriers to entry, profitability and behaviour) that have
long been linked to lack of competition in the industrial organization literature. Second, he tests a
model of fee clustering as an efficient contracting mechanism. Third, he searches for profits from
non-competitive underwriting fees hidden in investment banks’ other revenue sources.

5
Ultimately, Hansen’s findings are consistent with competitive pricing behaviour in US IPO
underwriting.
In summary, there is support for (e.g., Hansen) and against (e.g., Chen and Ritter) the
competitiveness of US IPO fees.
2.2 US and UK SEOs
In seasoned issues, there is also evidence both for and against competition. Mola and
Loughren (2004) find substantial underpricing and clustering of offer prices at integers for SEOs,
suggestive of collusion. Although these authors find tradeoffs between underpricing and
underwriter prestige (which is consistent with competition), the trend of rising underpricing that
they observe is consistent with reduced competition in the US SEO underwriting market. Ellis,
Michaely and O’Hara (2006) find that US investment banks compete vigorously for some SEO
clients, but that issuing firms that attempt to trade up to more prestigious underwriters face a
relatively non-competitive market.
In the UK, the Competition Commission found in 1999 that UK underwriters had created
a monopoly by the use of a long-standing policy of using standard fees for underwriting services
(Competition Commission, 1999). The ruling concluded that the limited benefits of standard fees
(such as speed in writing contracts) were not sufficient to outweigh adverse effects, and
encouraged companies to avoid underwriters by using deep-discount rights offerings. There is
some evidence this is occurring (“Underwriting structures”, 1998.)
2.3 Canadian Evidence

6
In Canada, Kryzanowski and Rakita (1999) study clustering of fees in the IPO market.
They find that 36% of medium sized issues cluster at the 6% fee level, with no substantial
difference in fees for over- and underpriced issues, and no trend in clustering over time.
Kryzanowski and Rakita (1999, p. 34) conclude that “any lawsuit directed at Canadian
underwriters concerning collusion to set prices in the new issue market would be largely
unsuccessful.”
No empirical test of competition in the Canadian SEO market has been published, but Ursel
(2000) notes unusual clustering of Canadian SEO fees at 4%. Given the lack of analysis of the
SEO market and the fact that it is roughly equal in size to the IPO market, additional investigation
is clearly warranted and should focus on competition in Canadian SEO underwriting.
3. The Canadian Setting and Data
Several significant developments have impacted SEOs in Canada over the past 25 years, and
must be taken into account in the analysis of competition. These developments include: the
introduction of the bought deal, the entry of commercial banks into equity underwriting; and the
hot issue market in oil stocks.
The major development is the introduction and rise to dominance of the bought deal. In
contrast to traditional “fully marketed” deals where syndicates of underwriters canvas potential
clients about the price and attractiveness of an issue following the filing of a preliminary
prospectus and prior to the signing of an underwriting agreement, in a bought deal the
underwriting agreement and preliminary prospectus are virtually contemporaneous, with little
time for formal gauging of interest of potential investors. The bought deal method was suited to

7
the market turbulence that began in the 1980s, when markets could move substantially in the
weeks necessary to complete fully marketed deals. As DuVal (1996, p. 359) notes:
The technique was developed in 1982 by the Toronto brokerage firm Gordon Capital Corporation, as an aggressive underwriting practice designed to give it a competitive advantage over other investment bankers in primary security offerings by large corporate issuers. The success of the bought deal led to its increasing use by all major Canadian underwriters during the 1980s, to the point where it is now the predominant means by which large Canadian issuers go to the capital markets for financing.
To further speed issues, many bought deals are conducted by a single underwriter, with no co-
managers. Fewer co-managers mean that fees can be lower, as they do not have to be shared
between underwriting firms. Bought deals are conducted under the Prompt Offering Prospectus
(POP) system, and are thus limited to SEOs.
Another important development affecting all Canadian issues (both seasoned and
unseasoned) is the entry of commercial banks into equity underwriting in 1987. Kryzanowski
and Ursel (1993) note that in the year following the legislative change allowing Canadian
chartered banks to enter securities underwriting, all of the major banks had an underwriting
division, often achieved by buying one or more formerly independent underwriters. Thus
significant market concentration occurred, which could affect competition and fees.
A final important development in Canadian SEOs concerns the rise in oil prices in recent
years. Recently, Canadian SEOs have been dominated by issues in the oil and gas sector. These
issues are relatively high risk and have traditionally paid higher than average underwriting fees.
Thus the composition of the set of issuing firms has changed over time and any empirical tests of
the competitiveness of fees must take this change in composition into account.
3.1 Data

8
Though the popularity of bought deals has fluctuated with market conditions, over the
period of this study bought deals have been the dominant form of SEO in Canada. Given the
dominance of bought deals among Canadian SEOs over the period of this study, and the necessity
of focussing on a single market when studying competition, this paper focuses on Canadian SEO
bought deals.
The Financial Post Record of New Issues provides limited data on Canadian security
issues for 1982 (when bought deals began) to 1991. As it does not distinguish between bought
deals and fully marketed issues, this information is obtained from a brokerage firm’s database.
Fees for these issues are graphed in Figure 1. Though it is not clear that the aforementioned
sources report all bought deal issues over this period, the graph has several interesting features.
First, there is a notable lack of clustering in fees in early years, and the fees are generally below
4%. Following a lean period around the 1987 market crash (the same year as bank entry into
underwriting), issues pick up in the 1990s and clustering at the 4% level begins.
Financial Post Infomart provides more complete information on Canadian equity issues
beginning in 1993. Using this source, this study examines all bought deal seasoned common
equity issues on the Toronto stock exchange over the period January 1993-May 2004, excluding
issues made by funds and trusts. This study’s information on issue dates, issue prices,
underwriting fees, gross proceeds, overallotment options, and underwriter identity is taken from
Financial Post Infomart. Financial Post Infomart data is also used to calculate the measures of
underwriter prestige, repeat dealings, and market concentration used in this paper and described
below. Historical stock price information data comes from Datastream Advance. All dollar
amounts used in this paper are expressed in 1992 Canadian dollars using the consumer price
index from Statistics Canada.

9
Figure 2 shows fees over the 1993-2004 period. Clustering at 4% is evident in the 1993-
98 period, but appears to have decreased in later years, when more issues had fees greater than
4%.
Table 1 presents statistics for the 1993-2004 period. Two interesting features of the data are
the initially very high (>80%) but declining level of issues at exactly 4%, and the spike in the
number of issues in 2002 and 2003, due largely to oil and gas issues.
3.2 Concentration
Stigler (1968) notes that high concentration among sellers of a good or service is conducive
to non-competitive prices. One common measure of the level of concentration in an industry is
the four firm concentration ratio. In this study the four firm concentration ratio measures the
percentage of underwriting conducted by the top four underwriters. Bradburd and Over (1982)
and Sant (1978) consider concentration ratios greater than 46-47% to be conducive to collusion,
whereas the Canadian Competition Bureau uses 65% as the threshold above which it would be
likely to challenge a merger on the basis of coordinated exercise of market power (Competition
Bureau, 2004). Over the entire 1993-2004 period the four firm concentration ratio for the
Canadian bought deal SEO market was 55.8% - i.e. in excess of the level where Bradburd and
Over and Sant note there is an increased likelihood of non-competitive behaviour, but below the
Competition Bureau’s safe harbour. In the 1993-99 subperiod, the four firm concentration ratio
was 73%, exceeding both benchmarks.
A second common measure of industry concentration is the Herfindahl-Hirschman index
(HHI) which is calculated by summing all underwriters’ squared percentage shares of the market.
HHI’s over 1800 are considered highly concentrated, those in the range 1000-1800 are considered
moderately concentrated and those below 1000 are considered unconcentrated by the US

10
Department of Justice (2004). In Canada, the Competition Bureau “may examine … the
Herfindahl-Hirschmann Index (“HHI”) [but] the Bureau does not use HHI levels as a safe harbour
threshold” (Competition Bureau, 2004). The HHI Index for the Canadian bought deal SEO
market is 1019.24 over the 1993-2004 period. This falls into the moderately concentrated
category according to the US Justice Department classification.
Though the earliest bought deals often had only one underwriter, it soon became common for
multiple underwriters to become involved. The number of underwriters involved in the average
bought deal has not changed significantly over the 1993-2004 period, so there has been no impact
on concentration from this source. In short, the Canadian SEO market displays moderate
concentration, which may be conducive to collusion.
3.3 Barriers to Entry
The contestable markets approach to industrial organization argues that markets can be
competitive even when they are highly concentrated as long as potential new competitors are able
to enter the market. Thus the issue of entry barriers becomes key. In his study of competition in
the US IPO market, Hansen (2001, p. 313) notes: “ease of entry characterize[s] the IPO market”.
There is good reason to suspect the bought deal SEO market is different. With smaller or no
syndicates, investment banks managing bought deals must have large amounts of capital.
Additionally, investment banks managing SEOs are typically more prestigious than those
specializing in IPOs. The substantial investments required in capital and prestige for SEO
markets likely imply the barriers to entry are higher than in the IPO underwriting market.
Although the level of barriers to entry cannot be directly measured, the number of new
entrants can, and this may provide an indication of the barriers to entry. Table 2 shows the actual

11
number of new lead underwriters per year in the Canadian SEO market from 1987-2003. For the
first nine years there were no new entrants. Then, beginning in 1996, there was at least one new
entrant and as many as three new entrants per year. Although the lack of entry in the early years
may be due to the small number of issues following the 1987 market crash, it is also consistent
with high barriers to entry in this period following bank entry into equity underwriting. (New
underwriters formed by bank takeovers of existing firms are not counted as new entrants in Table
2). Such high barriers are conducive to collusion.
Though high levels of concentration and high entry barriers facilitate collusion, further tests are
needed to determine if collusion actually took place.
4 Tests of Competition – Behaviour and Profitability
As a first step in examining competition, I model the underwriting fee for bought deal
SEOs as a function of variables which have been found to impact fees in the studies listed below.
This allows non-price competition to be taken into account by allowing trade-offs between fees
and the other variables.1
1. Issue size: Consistent with economies of scale, Bhagat and Frost, (1986), Denis
(1991), Megginson and Weiss (1991), Dunbar (1995), and Hansen, (2001) find issue
size significantly negatively related to fees. In this study, issue size is measured as
the natural log of the gross proceeds of the issue (excluding overallotment options).
2. Issue Risk: Booth and Smith (2000) and Denis (1991) find issue risk significantly
increases underwriting fees. In this study, issue risk is measured as the standard
deviation of daily stock returns for 3 months before issue.

12
3. Underwriter Prestige: Chen and Ritter (2000); Butler, Grullon and Weston, (2002),
Dunbar (1995), James (1992) and Megginson and Weiss (1991) find underwriter
prestige significantly related to fees. In this study this variable is measured by a
dummy variable set equal to one if the underwriter is bank-owned and zero
otherwise. Ursel and Ljucovic (1998) show that this dichotomous definition is
applicable in the post-1987 period when banks were permitted to own investment
dealers. Since the bank-owned underwriters dominate the market, the measure
closely parallels measures used in U.S. studies which measure prestige in terms of
dollar volume of underwriting (e.g., Beatty and Welch (1996), Megginson and Weiss
(1991);
4. Alternative forms of underwriter compensation: Chen and Ritter (2000), Ljungqvist
et al. (2003) and Daniel (2002) find that alternative forms of underwriter
compensation are negatively related to fees. In this study this variable is measured by
a variable representing the alternative form of underwriter compensation of
overallotment options; and
5. Previous dealings: Due to economies of scale in information gathering in repeat
dealings, James (1992) finds this variable significantly related to fees. In this study,
previous dealings are represented by a dummy variable indicating the presence of
previous dealings between the underwriter and the issuer.
Thus the model is:

13
fee = b0 + b1 (issue size) + b2 (issue risk) + b3 (underwriter prestige) + b4 (alternative
compensation) + b5 (previous dealings) + e (1)
Descriptive statistics for the variables are given in Table 3.
Estimating the model would appear to present a challenge, since the large number of observations
at the standard fee level of 4% implies that the data are not normally distributed, rendering
Ordinary Least Squares (OLS) estimation unsuitable. In practice, however, OLS estimates
calculated for two different samples – one including all Canadian bought deal SEOs between
January 1993 and May 2004, and one containing only those not charged 4% - yield nearly
identical results, as shown in columns 1 and 2 of Table 4. Because the results do not differ
greatly, to avoid violating OLS assumptions, most of the inferences drawn in this paper are based
on the sample excluding issues made at 4%. Limited dependent variable logit and probit estimates
(not shown) with 4% and non 4% fees represented by a 0/1 dummy variable also yield similar
results.
Multicollinearity is not a problem in the OLS estimates as correlations between the
variables are quite low (see Table 5). This is confirmed by re-estimating equation 1 (not shown)
after omitting, at random, 10% of the observations, as per Maddala (1992).
All estimates of Equation 1 are highly significant, as shown in Table 4. Issue size and
issue risk are consistently highly significantly related to fees in the manner expected. Other
significant predictors of fees in some estimates include underwriter prestige, which has a sign
consistent with the hypothesis that high prestige underwriters need less marketing effort and can
thus charge lower fees, and alternative forms of underwriter compensation, which has marginal
significance and an unexpected sign. The previous dealings variable has the expected sign but is
not significant.

14
4.1 Behaviour
In examining competition, Hansen (2001) places considerable weight on whether
underwriters reduce their use of the “standard” fee when the public becomes aware of allegations
of collusion. Hansen investigates this question about US IPO underwriters when the US
Department of Justice probe of IPO fee collusion was announced in the Wall Street Journal on
May 4, 1999. If underwriters had been colluding, Hansen expects a sudden and dramatic
abandonment of collusive behaviour similar to that found by Christie and Schultz (1994) with
respect to NASDAQ trading spreads. As Hansen finds that the frequency of the standard US IPO
fee increases following the announcement of the investigation, he concludes underwriters were
not colluding.
There are several reasons why Hansen may have found no reaction around May 1999,
even if collusive behaviour existed. First, NASD reminded members in October 1998 (National
Association of Securities Dealers, 1998) that collusion on fees is prohibited. Thus reaction may
have occurred in October 1998 rather than May 1999. Second, underwriters may have learned
from the NASDAQ odd-eighths quote scandal that sudden changes in behaviour signal guilt.
I investigate Canadian SEO fee setting behaviour around the time of the announcements
of the UK decision and the US investigation. The first approach that I use is to add an event
dummy to Equation 1 to capture the effect of the announcements. The event dummy is set equal
to one for issues made after May 4, 1999 (the day of the Wall Street Journal report on the US
investigation and 7 days after the UK decision) and zero otherwise. This variable is highly
significant, as shown in column 3 of Table 4.
15
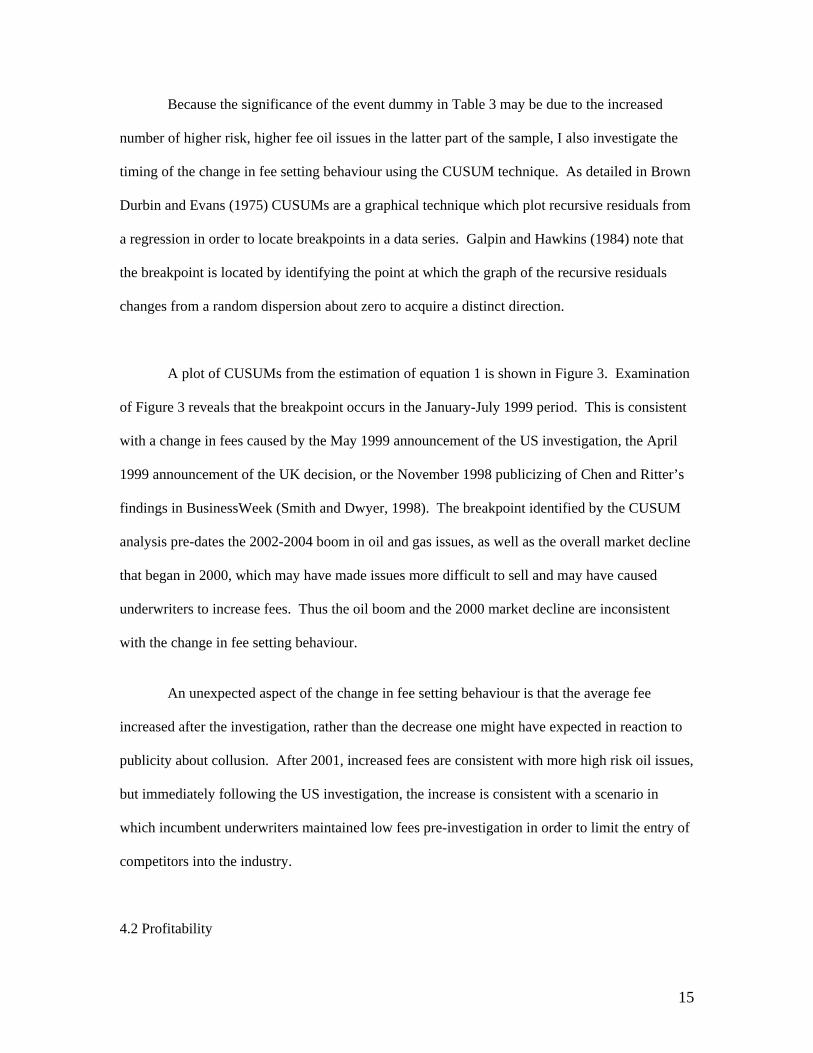
Because the significance of the event dummy in Table 3 may be due to the increased
number of higher risk, higher fee oil issues in the latter part of the sample, I also investigate the
timing of the change in fee setting behaviour using the CUSUM technique. As detailed in Brown
Durbin and Evans (1975) CUSUMs are a graphical technique which plot recursive residuals from
a regression in order to locate breakpoints in a data series. Galpin and Hawkins (1984) note that
the breakpoint is located by identifying the point at which the graph of the recursive residuals
changes from a random dispersion about zero to acquire a distinct direction.
A plot of CUSUMs from the estimation of equation 1 is shown in Figure 3. Examination
of Figure 3 reveals that the breakpoint occurs in the January-July 1999 period. This is consistent
with a change in fees caused by the May 1999 announcement of the US investigation, the April
1999 announcement of the UK decision, or the November 1998 publicizing of Chen and Ritter’s
findings in BusinessWeek (Smith and Dwyer, 1998). The breakpoint identified by the CUSUM
analysis pre-dates the 2002-2004 boom in oil and gas issues, as well as the overall market decline
that began in 2000, which may have made issues more difficult to sell and may have caused
underwriters to increase fees. Thus the oil boom and the 2000 market decline are inconsistent
with the change in fee setting behaviour.
An unexpected aspect of the change in fee setting behaviour is that the average fee
increased after the investigation, rather than the decrease one might have expected in reaction to
publicity about collusion. After 2001, increased fees are consistent with more high risk oil issues,
but immediately following the US investigation, the increase is consistent with a scenario in
which incumbent underwriters maintained low fees pre-investigation in order to limit the entry of
competitors into the industry.
4.2 Profitability

16
A second method of checking for collusion is to determine if the standard 4% fee contains
monopoly profit. If the 4% fee were collusive, one would expect it to contain monopoly profit.
Alternatively, if fees cluster at 4% simply as an efficient contracting mechanism, the 4% fee
would not contain monopoly profit. The economic profit from underwriting cannot be measured
directly, so, as in Hansen (2001), I investigate whether deals conducted at the standard fee contain
a “surplus” relative to non 4% deals, using the 5 step approach employed in Hansen (2001):
1.) model fees as a function of explanatory variables using data on non 4% deals;
2.) use the estimated parameters from step 1 to calculate expected fees for 4% deals;
3.) calculate the “surplus” for each 4% deal as 4% minus the value found in step 2;
4.) calculate a dollar surplus by multiplying each 4% deal’s gross proceeds by the percentage
surplus found in step 3; and
5.) calculate the total dollar surplus on 4% deals for a given period by summing the dollar
surpluses found in step 4 over the desired period.
Step 1 has already been accomplished by the estimates of Equation (1) shown in Table 4.
Because of the significant differences pre- and post- the US investigation, I use the estimates for
those 2 subperiods, in columns 4 and 5 of Table 4.
Column 1 of Table 6 shows the average percentage surplus for sample 4% deals in the
pre- and post- US investigation periods. Though the average percentage surplus (step 3 above) is
negative in both periods, when each deal’s percentage surplus is weighted by the gross proceeds
of the deal (step 4) and summed over all deals (step 5), the total dollar surplus in each period is
positive, consistent with larger 4% deals being over-charged relative to non-4% deals with similar
risk. The final column to Table 6 shows that the surplus or monopoly profit is 52.92% of 1993-

17
99 SEO gross proceeds, but only 7.69% of 1999-04 SEO gross proceeds. Not only is the
presence of a positive total surplus consistent with the collusion, as opposed to the efficient
contracting, hypothesis; the striking difference in the relative size of the surplus pre- and post- the
US investigation adds additional weight to this conclusion.
5. Concluding Remarks
To investigate the competitiveness of the Canadian bought deal SEO market, this paper
examines concentration, barriers to entry, profitability and fee-setting behaviour in the market
over the 1987-2004 period. When bought deals began in 1983 their fees varied but were
generally below 4%. Between 1987-1999 (the time after which banks became involved in equity
underwriting and before the US investigation of collusion in fees) underwriting fees began to
cluster at 4%. Between 1993-2004 the market was moderately concentrated and barriers to entry
appear to be high. CUSUM time series analysis shows a change in fee setting behaviour in
Canada coincident with the announcement of the US investigation in 1999. Investigation of the
profitability of deals made at the common 4% fee shows that they earn a surplus relative to non-
4% deals, and this surplus (as a percentage of gross SEO proceeds) decreases dramatically
following the announcement of an investigation into underwriter collusion in the US. These
findings are consistent with non-competitive behaviour in the Canadian bought deal SEO
underwriting market.
The clustering of bought deal fees at 4% is discussed in a surprisingly open manner in
Canada. For example, Willis (2000, p. B18) writes: “Bought deals are done with 4%
commissions …” and “In the past, Goldman Sachs [a US firm] has raised hackles in the Canadian
market by undercutting the rest of the Street on bought deal commissions.”

18
The reason for such open discussion of collusive behaviour may be that such behaviour is
arguably legal in Canada. Section 5 of Canada’s Competition Act grants underwriters a partial
exemption from the Act:
Sections 45 and 61 [the sections dealing with price fixing, and price maintenance] do not apply in respect of an agreement or arrangement between or among persons who are members of a class of persons who ordinarily engage in the business of dealing in securities … where the agreement or arrangement has a reasonable relationship to the underwriting of a specific security.
The stated purpose of the exemption is to “permit the continuance of the practice of forming syndicates
to underwrite a securities issue” (Quinlan, 1974, p. 22), but the wording of the exemption is open
enough that it conceivably could be interpreted to also permit the adoption of a common underwriting
fee across different underwriting syndicates.
Flavell and Kent (1997, p. 21) describe the exemptions for underwriters and other groups as
follows:
There is no particular logic for these exemptions which seem to have developed over years
of judicial, legislative and political history for reasons ranging from equity and fairness to
pure lobbying power.
Why would issuers tolerate non-competitive fees? As noted by Chen and Ritter (2000) and
Krigman, Shaw and Womack (2001), issuers pay little attention to fees. Furthermore,
challenging such fees would be difficult. Trebilcock et al (2002, p. 89) note that “tacit collusion
is … outside the law” in Canada. Trebilcock et al. make the same claim for the US, which may
explain why the US investigation closed with no charges being laid (Smith, 2001).
An amendment to section 5 of the Competition Act to explicitly establish that
underwriting fees are not within the scope of the exemption would make it clear that collusive
19
behaviour in fee setting was illegal. However, it is likely that even such statutory change could
not prevent tacit collusion so long as enforcement action against tacit collusion is not pursued
except, as Trebilcock et al. (p. 90) say, in “the presence of sufficient facilitating practices that
would lead to the overwhelming inference of an agreement”.
This study’s findings on competition in the bought deal market may be of interest in the
US, where shelf registration is becoming increasingly popular for issuing equity (Autore, Kumar
and Shome, 2004) and shelf takedowns are often accomplished via bought, rather than marketed,
deals (Kramer, 2004). It is possible that bought deals, which can only be undertaken by a subset
of large, well-capitalized underwriters, increase the probability of non-competitive behaviour.

20
References Autore, D., R. Kumar and D. Shome, 2004. The revival of shelf-registered corporate equity
offerings. Working paper, Virginia Tech, Blacksburg, VA. Beatty, R.P. and I. Welch, 1996. Issuer expenses and legal liability in initial public offerings.
Journal of Financial Economics 39, 545-602. Bhagat, S. and P.A. Frost, 1986. Issuing costs to existing shareholders in competitive and
negotiated underwritten public utility equity offerings. Journal of Financial Economics 15, 232-259.
Booth, J.R. and R.L. Smith, 1986. Capital raising, underwriting, and the certification hypothesis.
Journal of Financial Economics 15, 261-281. Bradburd, R.M. and A.M. Over, Jr., 1982. Organizational costs, ‘Sticky Equilibria’ and critical
levels of concentration. Review of Economics and Statistics 64, 50-58. Brown, R.L., J. Durbin and J.M.Evans, 1975. Techniques for testing the constancy of regression
relationships over time. Journal of the Royal Statistical Society 37, 149-163. Butler, A.W., G. Grullon and J.P. Weston, 2002. Stock Market Liquidity and the Cost of Raising
Capital, Working paper. Chen, H-C and J.R. Ritter, 2000. The seven percent solution. Journal of Finance 55, 1105-1132. Christie, W.G. and P.H. Schultz, 1994. Why do NASDAQ market makers avoid odd-eighth
quotes? Journal of Finance 49, 1813-1840. Competition Act, 1985. R S, 1985, c. C-34 lois.justice.gc.ca/C-34/index.html accessed July 17,
2006. Competition Bureau of Canada, Merger Enforcement Guidelines – Market Share and
Concentration Thresholds, Section 4.14, retrieved from: http://strategis.ic.gc.ca/epic/internet/incb-bc.nsf/en/ct02822e.html October 5, 2004. Competition Commission, 1999. Underwriting services for share offers: A report on the Supply in
the UK of underwriting services for share offers. Retrieved from: http://www.competition-commission.org.uk/rep_pub/reports/1999/424under.htm July 20, 2006. Daniel, K., 2002. Discussion of ‘Why don’t issuers get upset about leaving money on the table in
IPOs?’. Review of Financial Studies 15, 445-454. Denis, D.J., 1991. Shelf registration and the market for seasoned equity offerings. Journal of
Business 64, 189-212. Dunbar, C.G., 1995. The use of warrants as underwriter compensation in initial public offerings.
Journal of Financial Economics 38, 59-78.

21
DuVal, G., 1996. The bought deal in Canada. Canadian Business Law Journal 26, 358-390. Ellis, K., R. Michaely and M. O’Hara, 2006. Competition in investment banking, working paper. Flavell, C.J.M. and C.J. Kent, 1997. The Canadian Competition Law Handbook. (Carswell,
Scarborough, Ontario) Galpin, J.S. and D.M. Hawkins, 1984. The use of recursive residuals in checking model fit in
linear regression. The American Statistician 38, 94-105. Hansen, R.S., 2001. Do investment banks compete in IPOs? The advent of the 7% plus contract.
Journal of Financial Economics 59, 313-346. Harris, L., 1991. Stock price clustering and discreteness. Review of Financial Studies 4, 389-415. James, C. 1992. Relationship specific assets and the pricing of underwriter services. Journal of
Finance 47, 1865-1885. Kramer, G.R., 2004, Comments of Securities Industry Association on S7-23-03,
www.sec.gov/rules/proposed/s72303/sia013004.htm accessed Jan. 7, 2006. Krigman, L., W.H. Shaw and K.L. Womack, 2001. Why do firms switch underwriters? Journal
of Financial Economics 60, 245-284. Kryzanowski, L. and I. Rakita, 1999. Is the U.S. 7% solution equivalent to the Canadian 6%
solution? Canadian Investment Review, 27-34. Kryzanowski, L. and N. Ursel, 1993. Market reaction to announcements of legislative changes
and Canadian bank takeovers of Canadian investment dealers. Journal of Financial Services Research 7, 171-185.
Ljungqvist, A.P., T. Jenkinson, and W.J. Wilhlem Jr., 2003. Global integration in primary equity
markets: The role of U.S. banks and U.S. investors. Review of Financial Studies 16, 63-99.
Maddala, G.S., 1992. Introduction to Econometrics, 2nd Ed. (Prentice Hall, Englewood Cliffs,
N.J.) Megginson, W.L. and K.A. Weiss, 1991. Venture capital certification in initial public offerings.
Journal of Finance 46, 879-903. Mola, S. and T. Loughren, 2004. Discounting and clustering in seasoned equity offering prices,
Journal of Financial and Quantitative Analysis 39, 1-23. National Association of Securities Dealers, 1998. Notice to members: 98-88. Quinlan, J., 1974. Testimony on behalf of the Department of Consumer and Corporate Affairs.
Minutes of Proceedings and Evidence of the Standing Committee of Finance, Trade and Economic Affairs, House of Commons of Canada, Issue 8, p. 22.
Sant, D.T., 1978. Polynomial Approximations for Switching Regressions with Applications to
Market Structure-Performance Studies, Federal Trade Commission Staff Working Paper.

22
Smith, G. and P. Dwyer, 1998. Coincidence or collusion? Two academics question the standard
7% IPO fee. BusinessWeek Nov. 9, p. 163. Smith, R., 2001. U.S. ends probe into underwriting fees charged by securities firms for IPOs.
Wall Street Journal April 9, C 11. Stigler, G.J. 1968. The Organization of Industry. Richard D. Irwin, Inc. Homewood, IL. Torstila, S., 2003. The clustering of IPO gross spreads: international evidence. Journal of
Financial and Quantitative Analysis 38, 673-694. Trebilcock, M.J., R.A. Winter, P. Collins and E.M. Iacobucci, 2000, The Law and Economics of
Canadian Competition Policy. University of Toronto Press, Toronto. Underwriting structures: A monumental savings. 1998. Practical Law Company.
http://www.practicallaw.com. Retrieved July 20, 2006. United States Department of Justice, Antitrust Division. The Herfindahl-Hirschman Index,
retrieved October 5, 2004 from http://www.usdoj.gov/atr.hhi.htm Ursel, N.D., 2000. Bank acquisitions of investment dealers: Canadian evidence and implications
for Glass-Steagall reform, Empirical Economics 25, 507- 518. Ursel, N. D. and P. Ljucovic, 1998.The impact of bank ownership of underwriters on the
underpricing of initial public offerings. Canadian Journal of Administrative Sciences 15, 17-27.
Willis, A., 2000. Cdn. Hunter another bought deal gone bad, Globe and Mail (March 30), p. B18.

23
Notes 1 Underpricing is not included as a variable because, unlike in IPOs, there is little underpricing in
SEOs against which to trade off fees. Surprisingly, Hansen (2001) does not include underpricing
in his model of IPO fees.

24
Table 1 Annual Distribution of Bought Deal SEOs
The sample consists of bought deal SEOs on the TSX between 1993 and May 2004. Gross
proceeds is measured in millions of 1992 dollars. % oil and gas is the percentage of the number
of issues occurring in the oil and gas sector. % at 4% is the percentage of issues with an
underwriting fee of exactly 4%.
Year No of Issues Gross Proceeds % oil & gas % at 4% 1993 18 1.822 22 82.4 1994 16 1.201 6 75.0 1995 15 2.947 27 60.0 1996 25 1.574 16 56.0 1997 36 2.887 8 65.9 1998 35 3.654 17 57.1 1999 27 1.710 15 37.0 2000 38 2.185 5 44.7 2001 28 2.454 29 75.0 2002 75 4.069 31 42.7 2003 121 4.513 54 15.7
2004 (to May) 28 3.92 32 42.9

25
Table 2 Annual Distribution of New Lead Underwriters
The sample consists of bought deal SEOs conducted on the TSX between 1987 and 2003.
Number of New Lead Underwriters is the number of lead underwriters in a given year that had
not previously been lead underwriter on a SEO during the sample period. New underwriting
firms created by bank takeovers are not counted as new underwriters. Year Number of New Lead Underwriters 1987 0 1988 0 1989 0 1990 0 1991 0 1992 0 1993 0 1994 0 1995 0 1996 2 1997 1 1998 1 1999 1 2000 2 2001 2 2002 2 2003 3

26
Table 3 Descriptive Statistics for Variables in Equation 1
The sample consists of TSX listed bought deal SEOs from 1993-May 2004 for which full
information is available. Fee is the underwriting fee in percent. Issue size is the natural log of
gross proceeds in millions of 1992 dollars. Issue risk is the standard deviation of daily returns for
the 3 months before issue. UW prestige is a measure of underwriter prestige represented by a
dummy variable set equal to 1 if the lead underwriter is bank owned, zero otherwise. Prev deal is
a dummy variable set equal to 1 if the lead underwriter and issuer had a previous common equity
deal together within the sample period. Alt compens is a variable measuring the overallotment
options that form an alternative means of compensating underwriters.
Mean median minimum maximum Standard
deviation Panel A: All Issues (N= 354) Fee 4.7285 4.5000 1.6800 8.0000 0.8984 Issue Size 2.7406 3.5946 0.4918 7.2295 1.1873 Issue Risk 0.0417 0.0285 0.0000 0.1379 0.0190 UW prestige 0.3113 1.0000 0.0000 1.0000 0.4969 Alt Compens 0.1613 0.0000 0.0000 3.7200 0.4924 Prev deal 0.2649 0.0000 0.0000 1.0000 0.4085 Panel B: Non 4% Issues (N=196) Fee 5.3249 5.0000 1.6800 8.0000 0.8229 Issue Size 2.8499 2.9085 0.4918 5.6856 0.9028 Issue Risk 0.0405 0.0367 0.0000 0.1300 0.0194 UW prestige 0.3368 0.0000 0.0000 1.0000 0.4738 Alt Compens 0.2021 0.0000 0.0000 1.0000 0.4026 Prev deal 0.1663 0.0000 0.0000 2.0000 0.3940

27
Table 4 OLS Estimates of Equation 1
The sample consists of TSX listed bought deal SEOs from 1993-May 2004 for which full
information is available. The dependent variable is the underwriting fee in percent. Issue size is
the natural log of gross proceeds in millions of 1992 dollars. Issue risk is the standard deviation
of daily returns for the 3 months before issue. UW pres is a measure of underwriter prestige re-
presented by a dummy variable set equal to 1 if the lead underwriter is bank owned, zero other-
wise. Prev deal is a dummy variable set equal to 1 if the lead underwriter and issuer had a prev-
ious common equity deal together within the sample period. Alt comp is a variable measuring the
overallotment options that form an alternative means of compensating underwriters. Event
dummy is a dummy variable set equal to one following May 4, 1999, the day of the Wall Street
Journal announcement of the US investigation, zero otherwise. P values are in parentheses.
All issues Only issues with fee ≠ 4% pre-event post-event
intercept 5.7047 (0.0000)
5.8387 (0.0000)
5.5029 (0.0000)
6.1163 (0.0000)
5.6402 (0.0000)
issue size -0.3683 (0.0000)
-0.3874 (0.0000)
-0.3428 (0.0000)
-0.4979 (0.0000)
-0.2963 (0.0000)
issue risk 14.9381 (0.0000)
15.7536 (0.0000)
15.33 (0.0000)
8.20 (0.0710)
16.47 (0.0000)
UW pres -0.2780 (0.0002)
-0.1513 (0.1578)
-0.1236 (0.1194)
0.1960 (0.2920)
-0.2289 (0.0770)
prev deal -0.0578 (0.4497)
-0.0829 (0.4736)
alt comp 0.1109 (0.0844)
0.1353 (0.2647)
event dummy
0.2798 (0.0437)
N 354 196 196 45 151
adj R2 .57 .38 .40 .53 .30
overall F 97.75 25.05 32.24 15.37 22.68
F signif 0.0000 0.0000 0.0000 0.0000 0.0000

28
Table 5
Correlation Matrix
The sample consists of TSX listed bought deal SEOs from 1993-May 2004 for which full
information is available. Fee is the underwriting fee in percent. Size is the natural log of gross
proceeds in millions of 1992 dollars. Risk is the standard deviation of daily returns for the 3
months before issue. UW pr is a measure of underwriter prestige represented by a dummy
variable set equal to 1 if the lead underwriter is bank owned, zero otherwise. Prdeal is a dummy
variable set equal to 1 if the lead underwriter and issuer had a previous common equity deal
together within the sample period. Alt comp is a variable measuring the overallotment options
that form an alternative means of compensating underwriters.
Panel A: All issues (N=354) Fee Size Risk UW pr SucDeal Altcomp
Fee 1.0000 Size -0.6889 1.0000 Risk 0.5483 -0.3963 1.0000
UW pr -0.4769 0.5370 -0.2185 1.0000 Prdeal -0.0308 -0.0389 -0.1181 -0.0763 1.0000
Alt comp -0.0143 0.1295 0.0269 0.1242 0.0362 1.0000
Panel B: Non 4% Issues (N= 196) Fee Size Risk UW pr SucDeal Altcomp
Fee 1.0000 Size -0.4919 1.0000 Risk 0.4386 -0.1480 1.0000
UW pr -0.2302 0.3823 0.0019 1.0000 Sucdeal -0.0396 -0.0937 -0.1272 -0.1010 1.0000
Alt comp 0.0012 0.1674 0.0495 0.1766 -0.0584 1.0000

29
Table 6 Surplus on 4% Deals
The sample consists of TSX listed bought deal SEOs from 1993-May 2004. Average % surplus is
the average of 4% minus the expected fee for each issue, as generated by Equation 1. Value
weighted surplus is the sum of the percentage surplus for each issue weighted by the gross
proceeds of the issue, in millions of 1992 dollars. Total bought deal SEO proceeds is the sum of
all TSX listed bought deal SEO gross proceeds over the period indicated, in millions of 1992
dollars. Surplus as a % of total gross proceeds is a ratio of the numbers in the two preceding
columns.
Period Average %
surplus Value weighted
surplus Total bought deal SEO proceeds during period
Surplus as % of total gross proceeds
93- May 99 -4.11% 5262.788 9944.949 52.92 May 99-04 -11.31% 822.5754 10691.45 7.69

30
Figure 1: Fees for Early Bought Deals
01234567
Jan-86 May-87 Sep-88 Feb-90 Jun-91
Date
Fee
(%)

31
Figure 2: Underwriting Fees, 1993-2004
0
2
4
6
8
10
12
14
16
18
19-Sep-91
31-Jan-93
15-Jun-94
28-Oct-95
11-Mar-97
24-Jul-98 06-Dec-99
19-Apr-01
01-Sep-02
14-Jan-04
28-May-05
Date
Fee

32
F ig u r e 3 : C U S U M s
-1 0
0
1 0
2 0
3 0
4 0
5 0
6 0
7 0
J a n -9 6 J u l-9 6 J a n -9 7 J u l-9 7 J a n -9 8 J u l-9 8 J a n -9 9 J u l-9 9 J a n -0 0 J u l-0 0 J a n -0 1 J u l-0 1 J a n -0 2 J u l-0 2 J a n -0 3 J u l-0 3 J a n -0 4
T im e