Preview - Texas A&M University
24
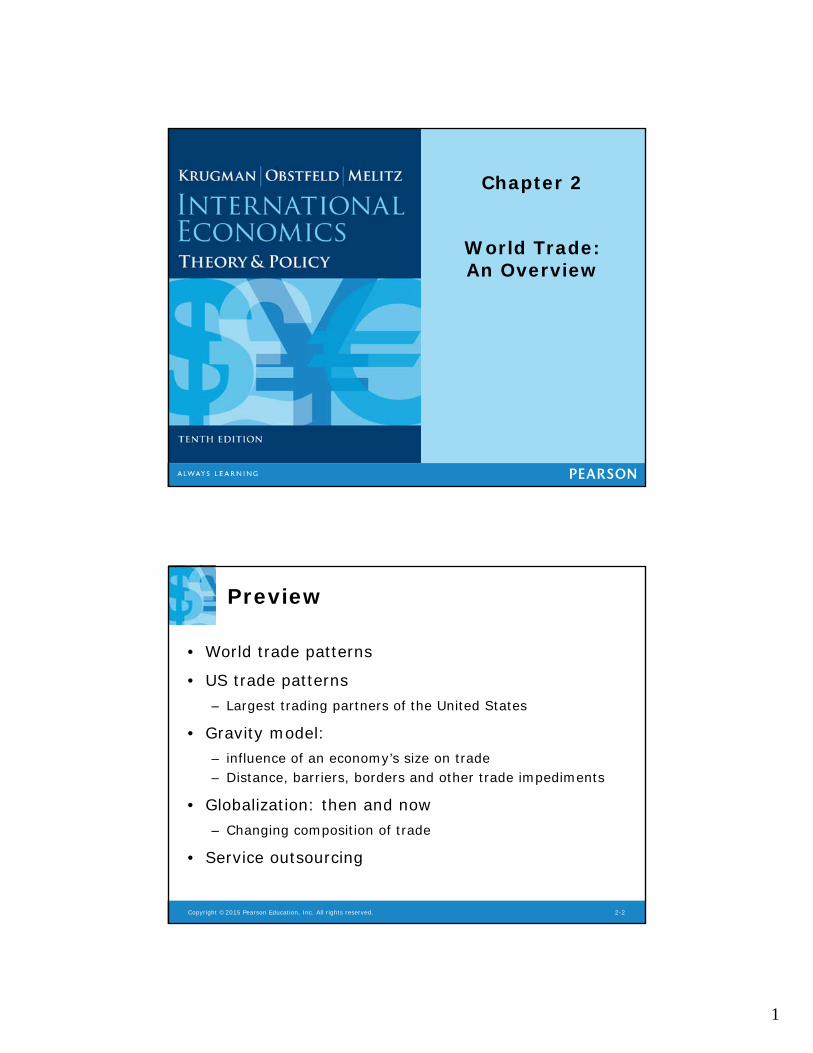
1 Chapter 2 World Trade: An Overview Copyright ©2015 Pearson Education, Inc. All rights reserved. 2-2 Preview • World trade patterns • US trade patterns – Largest trading partners of the United States • Gravity model: – influence of an economy’s size on trade – Distance, barriers, borders and other trade impediments • Globalization: then and now – Changing composition of trade • Service outsourcing
Transcript of Preview - Texas A&M University
1
Chapter 2
World Trade: An Overview
Copyright ©2015 Pearson Education, Inc. All rights reserved. 2-2
Preview
• World trade patterns
• US trade patterns– Largest trading partners of the United States
• Gravity model: – influence of an economy’s size on trade– Distance, barriers, borders and other trade impediments
• Globalization: then and now– Changing composition of trade
• Service outsourcing

2
Copyright ©2015 Pearson Education, Inc. All rights reserved. 2-3
World Trade Patterns
• Prior to the Great Recession of 2008-9, world GDP growth tended around 3-4% and growth in world merchandise trade tended around 6-8%.
• Both world GDP and trade contracted sharply in 2009, then rebounded in 2010.
• 2012-2016, growth in world GDP and growth in trade have been slow relative to historical averages.
Copyright ©2015 Pearson Education, Inc. All rights reserved. 2-4
World Trade Patterns

3
Copyright ©2015 Pearson Education, Inc. All rights reserved. 2-5
Who Trades with Whom?
• More than 30% of world output is sold across national borders.
• The 5 largest trading partners with the U.S. in 2012 were Canada, China, Mexico, Japan, and Germany. China edged out Canada in 2015.
• The largest 15 trading partners with the U.S. accounted for 69% of the value of U.S. trade in 2012.
Copyright ©2015 Pearson Education, Inc. All rights reserved. 2-6
Fig. 2-1: Total U.S. Trade with Major Partners, 2012

4
Copyright ©2015 Pearson Education, Inc. All rights reserved. 2-7
Total U.S. Trade with Major Partners, 2012-2015
Copyright ©2015 Pearson Education, Inc. All rights reserved. 2-8
Who Trades with Whom? US 2008
Partner Country
Imports Exports Trade Balance
Trade Volume
Canada 335 222 -112 557B
China 338 67 -270 405B
Mexico 216 132 -85 348B
Japan 139 61 -78 200B
Germany 96 50 -46 146B
5
Copyright ©2015 Pearson Education, Inc. All rights reserved. 2-9
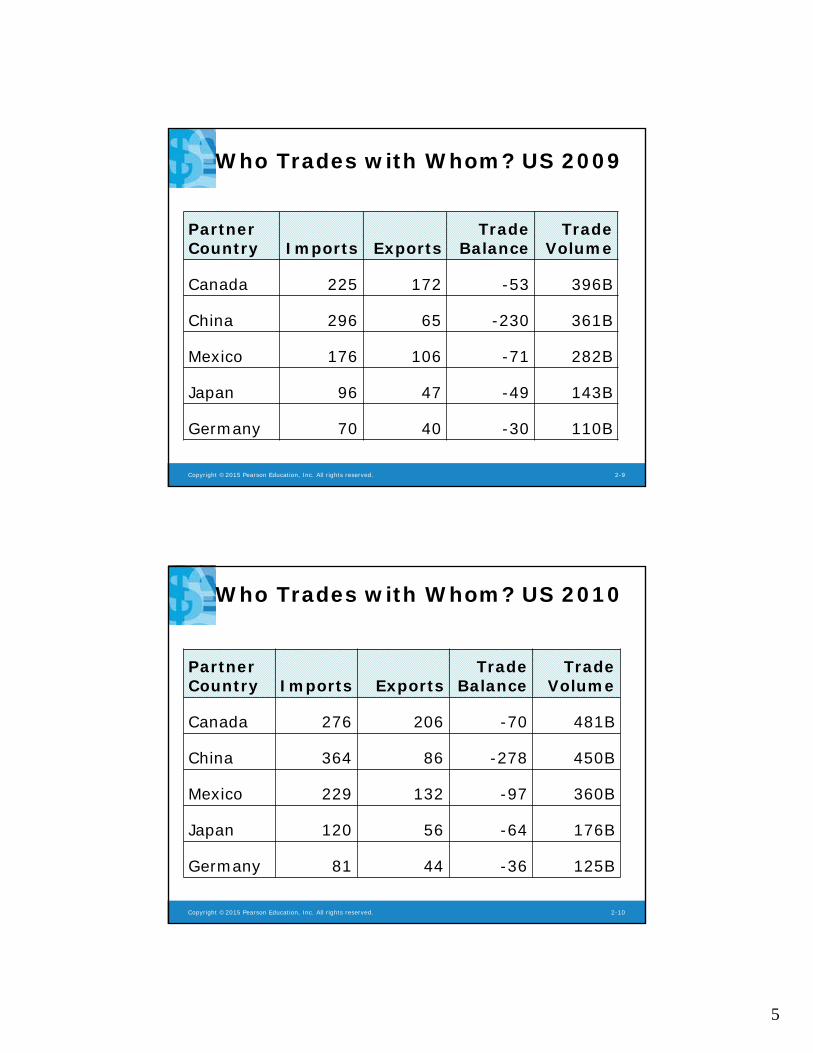
Who Trades with Whom? US 2009
Partner Country Imports Exports
Trade Balance
Trade Volume
Canada 225 172 -53 396B
China 296 65 -230 361B
Mexico 176 106 -71 282B
Japan 96 47 -49 143B
Germany 70 40 -30 110B
Copyright ©2015 Pearson Education, Inc. All rights reserved. 2-10
Who Trades with Whom? US 2010
Partner Country Imports Exports
Trade Balance
Trade Volume
Canada 276 206 -70 481B
China 364 86 -278 450B
Mexico 229 132 -97 360B
Japan 120 56 -64 176B
Germany 81 44 -36 125B

6
Copyright ©2015 Pearson Education, Inc. All rights reserved. 2-11
Who Trades with Whom? US 2011
Partner Country Imports Exports
Trade Balance
Trade Volume
Canada 316 234 -83 540B
China 398 97 -302 495B
Mexico 263 160 -103 423B
Japan 128 61 -66 189B
Germany 97 44 -52 141B
Copyright ©2015 Pearson Education, Inc. All rights reserved. 2-12
Who Trades with Whom? US 2012
Partner Country Imports Exports
Trade Balance
Trade Volume
Canada 324 244 -80 568B
China 425 106 -321 531B
Mexico 276 175 -101 451B
Japan 145 65 -80 210B
Germany 105 44 -61 149B
7
Copyright ©2015 Pearson Education, Inc. All rights reserved. 2-13
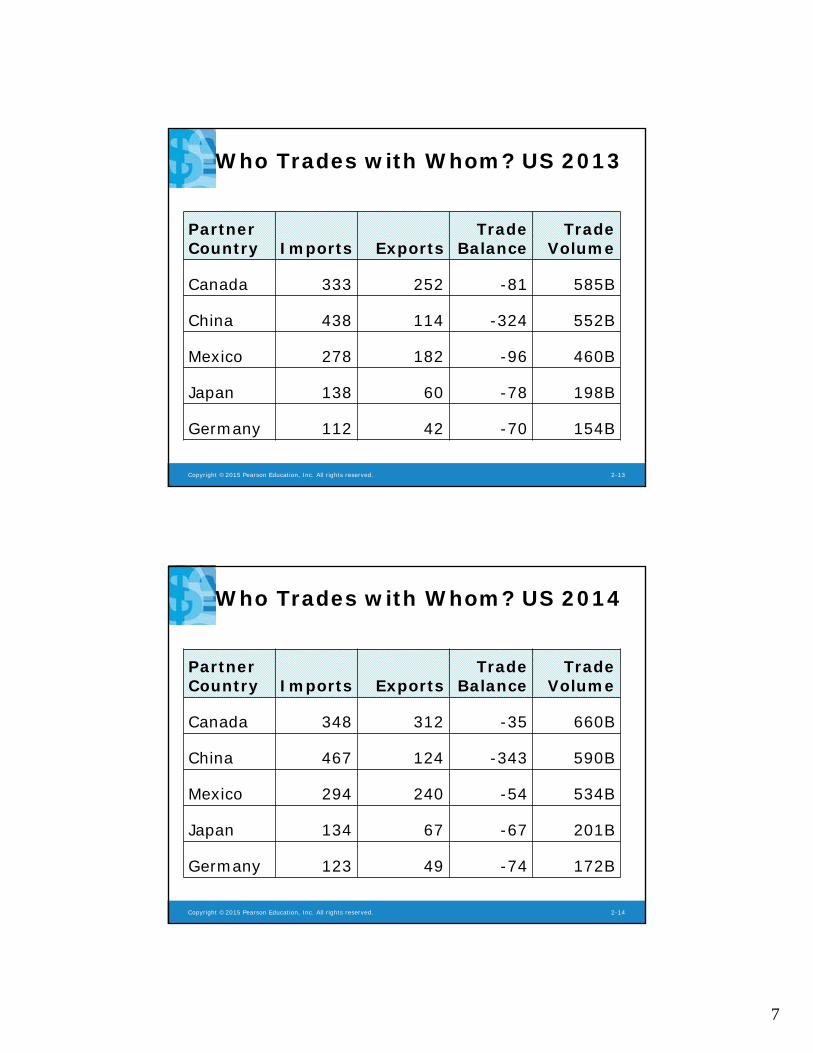
Who Trades with Whom? US 2013
Partner Country Imports Exports
Trade Balance
Trade Volume
Canada 333 252 -81 585B
China 438 114 -324 552B
Mexico 278 182 -96 460B
Japan 138 60 -78 198B
Germany 112 42 -70 154B
Copyright ©2015 Pearson Education, Inc. All rights reserved. 2-14
Who Trades with Whom? US 2014
Partner Country Imports Exports
Trade Balance
Trade Volume
Canada 348 312 -35 660B
China 467 124 -343 590B
Mexico 294 240 -54 534B
Japan 134 67 -67 201B
Germany 123 49 -74 172B

8
Copyright ©2015 Pearson Education, Inc. All rights reserved. 2-15
Who Trades with Whom? US 2015
Partner Country Imports Exports
Trade Balance
Trade Volume
China 483 116 -367 599B
Canada 296 281 -16 577B
Mexico 296 236 -61 532B
Japan 131 62 -69 194B
Germany 125 50 -75 175B
Copyright ©2015 Pearson Education, Inc. All rights reserved. 2-16
US Trade Patterns
‐800,000
‐600,000
‐400,000
‐200,000
0
200,000
1960 1965 1970 1975 1980 1985 1990 1995 2000 2005 2010 2015
US Trade Balance in Goods and Services
9
Copyright ©2015 Pearson Education, Inc. All rights reserved. 2-17
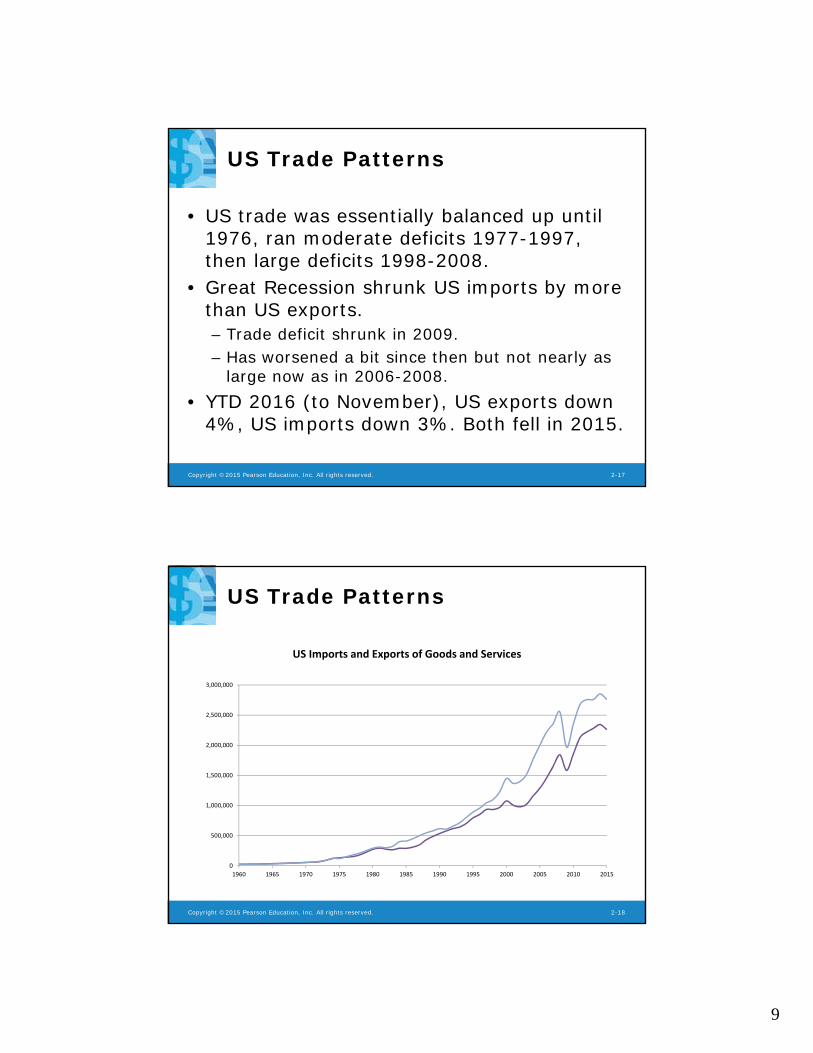
US Trade Patterns
• US trade was essentially balanced up until 1976, ran moderate deficits 1977-1997, then large deficits 1998-2008.
• Great Recession shrunk US imports by more than US exports.– Trade deficit shrunk in 2009.– Has worsened a bit since then but not nearly as
large now as in 2006-2008.• YTD 2016 (to November), US exports down
4%, US imports down 3%. Both fell in 2015.
Copyright ©2015 Pearson Education, Inc. All rights reserved. 2-18
US Trade Patterns
0
500,000
1,000,000
1,500,000
2,000,000
2,500,000
3,000,000
1960 1965 1970 1975 1980 1985 1990 1995 2000 2005 2010 2015
US Imports and Exports of Goods and Services
10
Copyright ©2015 Pearson Education, Inc. All rights reserved. 2-19
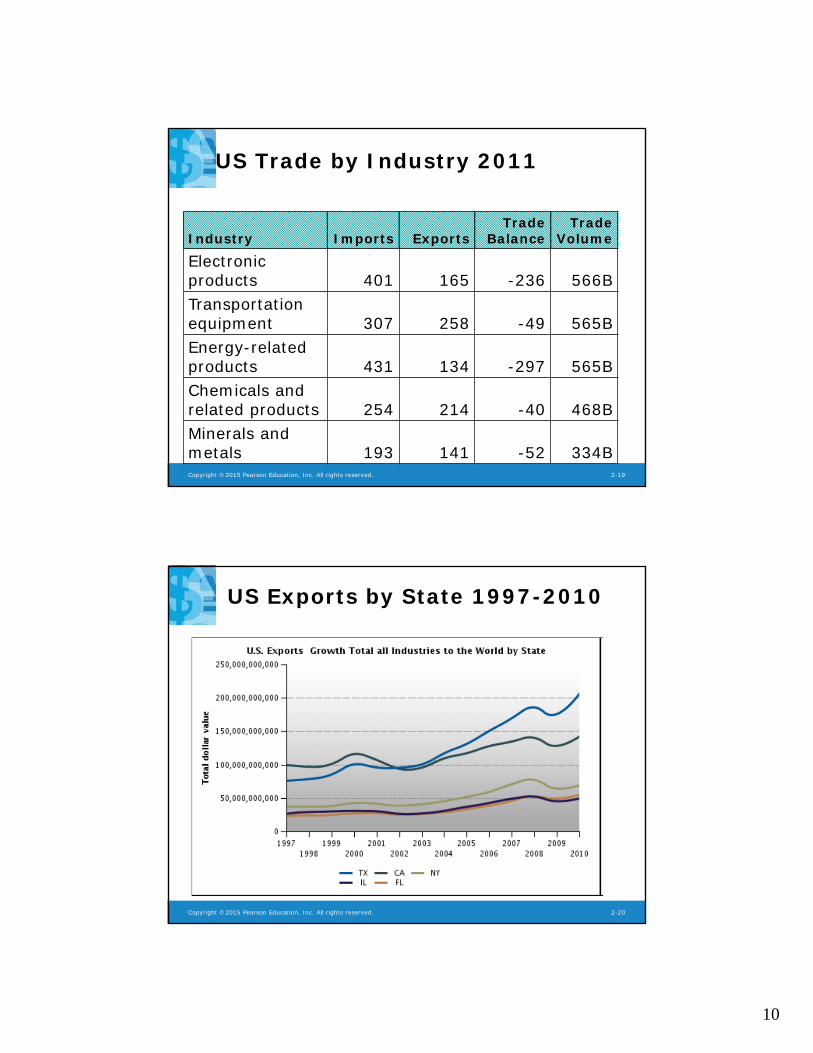
US Trade by Industry 2011
Industry Imports ExportsTrade
BalanceTrade
Volume
Electronic products 401 165 -236 566BTransportation equipment 307 258 -49 565BEnergy-related products 431 134 -297 565BChemicals and related products 254 214 -40 468BMinerals and metals 193 141 -52 334B
Copyright ©2015 Pearson Education, Inc. All rights reserved. 2-20
US Exports by State 1997-2010
11
Copyright ©2015 Pearson Education, Inc. All rights reserved. 2-21
Who Trades with Whom? TX Exports
• Total Texas exports $248B (16.5% of all US exports), highest of all states (California 165B, New York 83B) in 2015 (has been the biggest exporter ever since 2002).
• Texas exports fell at a slower rate than the US as a whole in 2009 and recovered faster in 2010.
• If Texas were a nation, would rank among top 20 exporting countries (FRBD 2007).
• Top destinations for Texas exports: Mexico (93B), Canada (26B) and China (12B).
Copyright ©2015 Pearson Education, Inc. All rights reserved. 2-22
Who Trades with Whom? TX Exports
• Compared to US, Texas exports a larger share of its output, depends on exports for more of its jobs, sends more sophisticated products overseas and employs higher-skilled workers in export-related jobs (FRBD 2007).
• Texas lags California and US in diversification across countries (FRBD 2007).
12
Copyright ©2015 Pearson Education, Inc. All rights reserved. 2-23
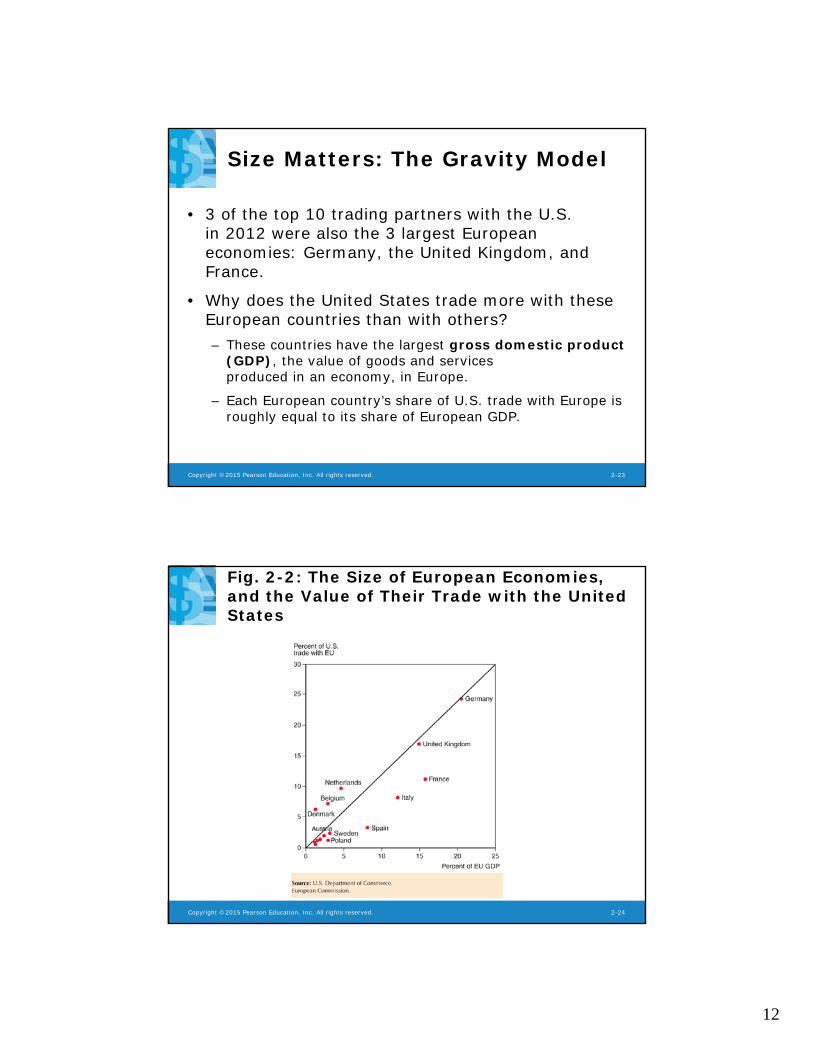
Size Matters: The Gravity Model
• 3 of the top 10 trading partners with the U.S. in 2012 were also the 3 largest European economies: Germany, the United Kingdom, and France.
• Why does the United States trade more with these European countries than with others?– These countries have the largest gross domestic product
(GDP), the value of goods and services produced in an economy, in Europe.
– Each European country’s share of U.S. trade with Europe is roughly equal to its share of European GDP.
Copyright ©2015 Pearson Education, Inc. All rights reserved. 2-24
Fig. 2-2: The Size of European Economies, and the Value of Their Trade with the United States

13
Copyright ©2015 Pearson Education, Inc. All rights reserved. 2-25
Size Matters: The Gravity Model (cont.)
• The size of an economy is directly related to the volume of imports and exports.– Larger economies produce more goods and
services, so they have more to sell in the export market.
– Larger economies generate more income from the goods and services sold, so they are able to buy more imports.
• Trade between any two countries is larger, the larger is either country.
Copyright ©2015 Pearson Education, Inc. All rights reserved. 2-26
Size Matters: The Gravity Model (cont.)
• The gravity model assumes that size and distance are important for trade in the following way:
Tij = A x Yi x Yj /Dijwhere Tij is the value of trade between country i and country jA is a constantYi the GDP of country I, Yj is the GDP of country jDij is the distance between country i and country j
• Or more generallyTij = A x Yi
a x Yjb /Dij
c
where a, b, and c are allowed to differ from 1.
14
Copyright ©2015 Pearson Education, Inc. All rights reserved. 2-27
Using the Gravity Model: Looking for Anomalies
• A gravity model fits the data on U.S. trade with European countries well but not perfectly.
• The Netherlands, Belgium and Ireland trade much more with the United States than predicted by a gravity model.– Ireland has strong cultural affinity due to
common language and history of migration.– The Netherlands and Belgium have transport cost
advantages due to their location.
Copyright ©2015 Pearson Education, Inc. All rights reserved. 2-28
Impediments to Trade: Distance, Barriers, and Borders
Other things besides size matter for trade: 1. Distance between markets influences transportation costs
and therefore the cost of imports and exports.2. Cultural affinity: close cultural ties, such as a common
language, usually lead to strong economic ties.3. Geography: ocean harbors and a lack of mountain barriers
make transportation and trade easier.
4. Multinational corporations: corporations spread across different nations import and export many goods between their divisions.
5. Borders: crossing borders involves formalities that take time, often different currencies need to be exchanged, and perhaps monetary costs like tariffs reduce trade.
15
Copyright ©2015 Pearson Education, Inc. All rights reserved. 2-29
Impediments to Trade: Distance, Barriers, and Borders (cont.)
• Estimates of the effect of distance from the gravity model predict that a 1% increase in the distance between countries is associated with a decrease in the volume of trade of 0.7% to 1%.
• Besides distance, borders increase the cost and time needed to trade.
• Trade agreements between countries are intended to reduce the formalities and tariffs needed to cross borders, and therefore to increase trade.
Copyright ©2015 Pearson Education, Inc. All rights reserved. 2-30
Impediments to Trade: Distance, Barriers, and Borders (cont.)
• The U.S. signed a free trade agreement with Mexico and Canada in 1994, the North American Free Trade Agreement (NAFTA).
• Because of NAFTA and because Mexico and Canada are close to the U.S., the amount of trade between the U.S. and its northern and southern neighbors as a fraction of GDP is larger than between the U.S. and European countries.– Canada’s economy is roughly the same size as Spain’s
(around 10% of EU GDP) but Canada trades as much with the United States as does all of Europe.

16
Copyright ©2015 Pearson Education, Inc. All rights reserved. 2-31
Fig. 2-3: Economic Size and Tradewith the United States
Copyright ©2015 Pearson Education, Inc. All rights reserved. 2-32
Impediments to Trade: Distance, Barriers, and Borders (cont.)
• Yet even with a free trade agreement between the U.S. and Canada, which use a common language, the border between these countries still seems to be associated with a reduction in trade.
• Data shows that there is much more trade between pairs of Canadian provinces than between Canadian provinces and U.S. states, even when holding distance constant.
• Estimates indicate that the U.S.-Canadian border deters trade as much as if the countries were 1,500-2,500 miles apart.

17
Copyright ©2015 Pearson Education, Inc. All rights reserved. 2-33
Fig. 2-4: Canadian Provinces and U.S. States that Trade with British Columbia
Copyright ©2015 Pearson Education, Inc. All rights reserved. 2-34
Table 2-1: Trade with British Columbia, as Percent of GDP, 2009

18
Copyright ©2015 Pearson Education, Inc. All rights reserved. 2-35
The Changing Pattern of World Trade: Has the World Gotten Smaller?
• The negative effect of distance on trade according to the gravity models is significant, but has grown smaller over time due to modern transportation and communication.
• Technologies that have increased trade:– Wheels, sails, compasses, railroads, telegraph, steam
power, automobiles, telephones, airplanes, computers, fax machines, Internet, fiber optics, personal digital assistants, GPS satellites…
Copyright ©2015 Pearson Education, Inc. All rights reserved. 2-36
The Changing Pattern of World Trade: Has the World Gotten Smaller? (cont.)
• Political factors, such as wars, can change trade patterns much more than innovations in transportation and communication.
• World trade grew rapidly from 1870 to 1913.– Then it suffered a sharp decline due to the two world wars and
the Great Depression.
– It started to recover around 1945 but did not recover fully until around 1970.
• Since 1970, world trade as a fraction of world GDP has achieved unprecedented heights.– Vertical disintegration of production has contributed to the rise in
the value of world trade through extensive cross-shipping of components.

19
Copyright ©2015 Pearson Education, Inc. All rights reserved. 2-37
Fig. 2-5: The Fall and Rise of World Trade
Copyright ©2015 Pearson Education, Inc. All rights reserved. 2-38
What Do We Trade?
• What kinds of products do nations trade now, and how does this composition compare to trade in the past?
• Today, most (about 53%) of the volume of trade is in manufactured products such as automobiles, computers, and clothing.– Services such as shipping, insurance, legal fees, and
spending by tourists account for about 20% of the volume of trade.
– Mineral products (ex., petroleum, coal, copper) remain an important part of world trade at 19%
– Agricultural products are a relatively small (8%) part of trade.

20
Copyright ©2015 Pearson Education, Inc. All rights reserved. 2-39
Fig. 2-6: The Composition of World Trade, 2011
Copyright ©2015 Pearson Education, Inc. All rights reserved. 2-40
What Do We Trade? (cont.)
• In the past, a large fraction of the volume of trade came from agricultural and mineral products.– In 1910, Britain mainly imported agricultural and mineral
products, although manufactured products still represented most of the volume of exports.
– In 1910, the U.S. mainly imported and exported agricultural products and mineral products.
– In 2002, manufactured products made up most of the volume of imports and exports for both countries.

21
Copyright ©2015 Pearson Education, Inc. All rights reserved. 2-41
Table 2-2: Manufactured Goods as a Percent of Merchandise Trade
Copyright ©2015 Pearson Education, Inc. All rights reserved. 2-42
What Do We Trade? (cont.)
• Low- and middle-income countries have also changed the composition of their trade.– In 2001, about 65% of exports from low- and middle-
income countries were manufactured products, and only 10% of exports were agricultural products.
– In 1960, about 58% of exports from low- and middle-income countries were agricultural products and only 12% of exports were manufactured products.
• More than 90 percent of the exports of China, the largest developing country and a rapidly growing force in world trade, consist of manufactured goods.

22
Copyright ©2015 Pearson Education, Inc. All rights reserved. 2-43
Fig. 2-7: The Changing Composition of Developing-Country Exports
Copyright ©2015 Pearson Education, Inc. All rights reserved. 2-44
Service Outsourcing
• Service outsourcing (or offshoring) occurs when a firm that provides services moves its operations to a foreign location.– Service outsourcing can occur for services that
can be transmitted electronically.• A firm may move its customer service centers whose
telephone calls can be transmitted electronically to a foreign location.
– Other services may not lend themselves to being performed remotely.
23
Copyright ©2015 Pearson Education, Inc. All rights reserved. 2-45
Service Outsourcing (cont.)
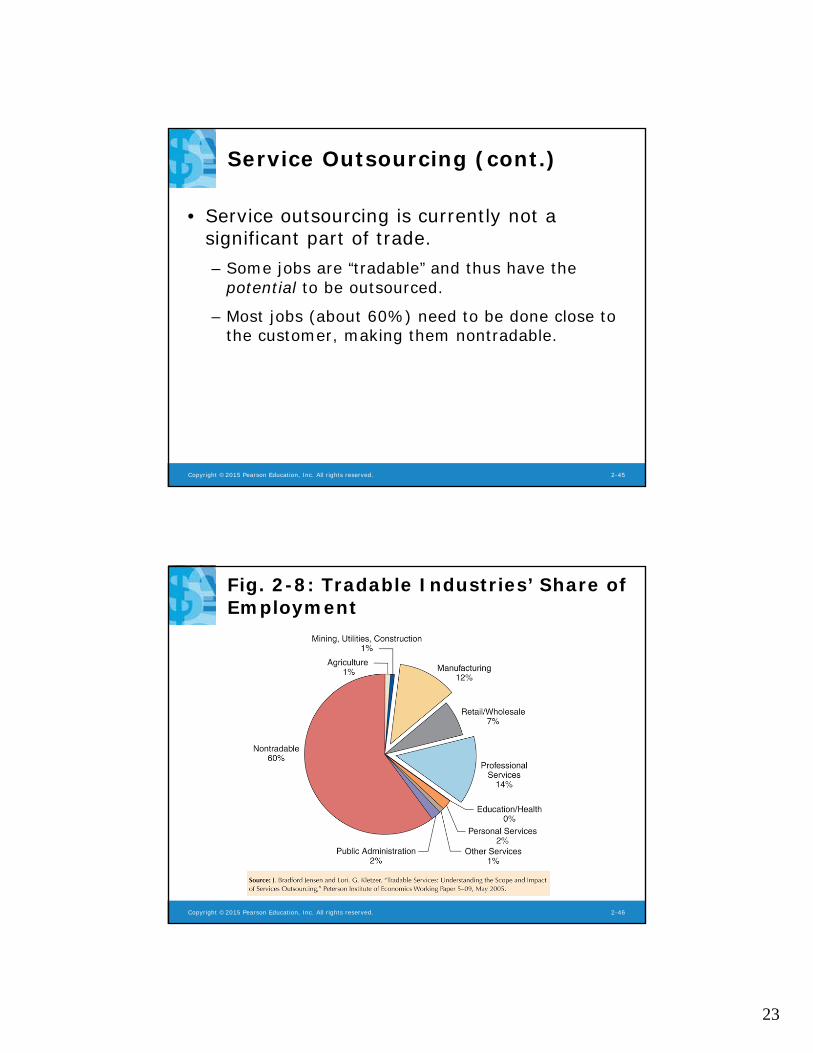
• Service outsourcing is currently not a significant part of trade.– Some jobs are “tradable” and thus have the
potential to be outsourced.
– Most jobs (about 60%) need to be done close to the customer, making them nontradable.
Copyright ©2015 Pearson Education, Inc. All rights reserved. 2-46
Fig. 2-8: Tradable Industries’ Share of Employment
24
Copyright ©2015 Pearson Education, Inc. All rights reserved. 2-47
Summary
1. The 5 largest trading partners with the U.S. are Canada, China, Mexico, Japan, and Germany.
2. The largest economies in the EU undertake the largest fraction of the total trade between the EU and the U.S.
3. The gravity model predicts that the volume of trade is directly related to the GDP of each trading partner and is inversely related to the distance between them.
Copyright ©2015 Pearson Education, Inc. All rights reserved. 2-48
Summary (cont.)
4. Besides size and distance, culture, geography, multinational corporations, and the existence of borders influence trade.
5. Modern transportation and communication have increased trade, but political factors have influenced trade more in history.
6. Today, most trade is in manufactured goods, while historically agricultural and mineral products made up most of trade.