Prevent Abuse of Children Text and Chat Hotline (PACTECH ...
25
Wendy Wolfersteig, PhD, Director Diane Moreland, MS, Research Analyst Marisol Diaz, JD, Senior Research Analyst Esther Gotlieb, MPH, Research Analyst SIRC Office of Evaluation and Partner Contracts Arizona State University, Phoenix, Arizona Sponsor Award: CHSC-H-001 Prime Award Number: 90CA1855-01-00 ASU Reference Number: FP00017101 ASU Account Number: GR35628 This project is supported by a grant from the Administration on Children, Youth and Families, Children’s Bureau, U.S. Department of Health and Human Services. The opinions, findings, conclusions and recommendations expressed in this publication are those of the author(s) and do not necessarily reflect the views of the Administration on Children, Youth and Families, Children’s Bureau, U.S. Department of Health and Human Services. Prevent Abuse of Children Text and Chat Hotline (PACTECH) Project: Quarterly Data Report April 15, 2021
Transcript of Prevent Abuse of Children Text and Chat Hotline (PACTECH ...
Wendy Wolfersteig, PhD, Director
Diane Moreland, MS, Research Analyst
Marisol Diaz, JD, Senior Research Analyst
Esther Gotlieb, MPH, Research Analyst
SIRC Office of Evaluation and Partner Contracts
Arizona State University, Phoenix, Arizona
Sponsor Award: CHSC-H-001
Prime Award Number: 90CA1855-01-00 ASU Reference Number: FP00017101
ASU Account Number: GR35628
This project is supported by a grant from the Administration on Children, Youth and Families, Children’s Bureau, U.S. Department of Health and Human Services. The opinions, findings, conclusions and recommendations expressed in
this publication are those of the author(s) and do not necessarily reflect the views of the Administration on Children, Youth and Families, Children’s Bureau, U.S. Department of Health and Human Services.
Prevent Abuse of Children Text and Chat Hotline (PACTECH) Project:
Quarterly Data Report
April 15, 2021
PACTECH Quarterly Data Report – April 2021
ii
TABLE OF CONTENTS
Table of Contents ........................................................................................................................................................... ii
Introduction ................................................................................................................................................................... 1
Sources of Data and Methods ........................................................................................................................................ 2
Text and Chat Data Collection ....................................................................................................................................................... 2
Call Data Collection ....................................................................................................................................................................... 2
Prior Modifications to Data Collection Instruments....................................................................................................................... 2
Data Cleaning and Analyses .......................................................................................................................................................... 3
Summary of All Contacts ............................................................................................................................................................... 3
Results ........................................................................................................................................................................... 5
Research Question 2: How effective is PACTECH at communicating with youth, who may be victims of maltreatment and protecting their privacy? ............................................................................................................................................................... 5
Help Seeker Ratings of Contact Preference ....................................................................................................................................... 5 Help Seeker Ratings of Mode of Contact ........................................................................................................................................... 6 Help Seeker Reports of Previous Utilization of the Childhelp Hotline ............................................................................................... 7
Research Question 3: How effective is PACTECH at engaging with youth to build skills, provide resources and information to meet the need for which they sought help? .................................................................................................................................. 8
Stress ................................................................................................................................................................................................. 8 Hopeful .............................................................................................................................................................................................. 9 Better Prepared ............................................................................................................................................................................... 10 Information Received....................................................................................................................................................................... 11
Research Question 4: What are the demographic characteristics and presenting issues of help seekers that use a text and chat feature of a child maltreatment hotline? .................................................................................................................................... 12
Demographics .................................................................................................................................................................................. 12 Contact Time ............................................................................................................................................................................... 12 Age ............................................................................................................................................................................................... 13 Gender ......................................................................................................................................................................................... 13 Race and Ethnicity ....................................................................................................................................................................... 14 State ............................................................................................................................................................................................ 15 Category of Help Seeker .............................................................................................................................................................. 17 Learned about the Hotline .......................................................................................................................................................... 18 Post-survey Response Percentage ............................................................................................................................................... 20
Presenting Issue ............................................................................................................................................................................... 20
CONCLUSION AND NEXT STEPS .................................................................................................................................... 22
PACTECH Quarterly Data Report – April 2021
iii
List of Tables and Figures
Table 1: All Contacts by Month by Mode.................................................................................................................................................... 4
Table 2: Race and Ethnicity by Mode ........................................................................................................................................................ 14
Table 3: State by Mode ............................................................................................................................................................................. 15
Table 4: Category of Help Seeker by Mode .............................................................................................................................................. 17
Table 5: Learned About the Hotline Source by Mode ............................................................................................................................... 19
Table 6: Presenting Issues Reported by Help Seekers by Mode ............................................................................................................... 21
Figure 1: Help Seeker Ratings of Contact Preference ................................................................................................................................. 5
Figure 2: Help Seeker Ratings of Mode of Contact ..................................................................................................................................... 6
Figure 3: Help Seeker Reports of Previous Utilization of the Childhelp Hotline ......................................................................................... 7
Figure 4: Stress ........................................................................................................................................................................................... 8
Figure 5: Hopeful ........................................................................................................................................................................................ 9
Figure 6: Better Prepared ......................................................................................................................................................................... 10
Figure 7: Information ................................................................................................................................................................................ 11
Figure 8: Average Length of Contact in Minutes ...................................................................................................................................... 12
Figure 9: Age by Mode .............................................................................................................................................................................. 13
Figure 10: Gender by Mode ...................................................................................................................................................................... 14

PACTECH Quarterly Data Report – April 2021
1
INTRODUCTION
This report examines the Childhelp Prevent Abuse of Children Text and Chat Hotline (PACTECH) Project supported by Grant No. 90CA1855 from the Administration on Children, Youth and Families, Children's Bureau, U.S. Department of Health and Human Services. The PACTECH intervention offers text and live chat services for help seekers looking for information, support, and resources related to child abuse. Childhelp provides oversight of the PACTECH project to help determine best practices and protocols regarding the use of text and chat in the child abuse and neglect helpline environment. This project focuses on serving help seekers in the target population of youth ages 13-24.
Childhelp partnered with Arizona State University's Southwest Interdisciplinary Research Center (ASU-SIRC) for the quantitative research and evaluation components of PACTECH. The research design uses both a formative evaluation to report and improve implementation and a summative evaluation strategy to report outcomes. Text services became available nationally 24 hours, 7 days a week, on February 1, 2019, with live chat quickly following in April 2019. The addition of call post-surveys for a comparison group was initiated in February 2020.
Evaluation of the effectiveness of PACTECH is measured with data collected through surveys comparing chat, text, and call contacts. This report is the third quarterly data report, which summarizes the first nine months of help-seeker data collected during Phase 2 of the PACTECH project. This report's data were collected during June 2020 through February 2021. Analyses were conducted to determine if chat and text help seekers had similar outcomes to call help seekers.
There are five Research Questions (RQ) for the PACTECH project:
RQ 1: What are the best practices and protocols in implementing text or chat-based technology for a hotline?
RQ 2: How effective is PACTECH at communicating with youth who may be victims of maltreatment and protecting their privacy?
RQ 3: How effective is PACTECH at engaging with youth to build skills, provide resources and information to meet the need for which they sought help?
RQ 4: What are the demographic characteristics and presenting issues of help seekers that use a text and chat feature of a child maltreatment hotline?
RQ 5: What are the best practices for counselors that will engage help seekers in text and chat-based interactions?
Data were also examined by level of intervention and contact mode (call, chat, and text). Level 1 intervention contacts are informational exchanges and brief, which is the reasoning behind not needing the counselor to answer the survey questions for these inquiries. Level 2 contacts are educational and supportive-based contacts, identifying presenting issues, assessing resources available, and action planning. Level 3 contacts are crisis-oriented and utilize the interventions employed in Level 2 and apply more acute crisis intervention responses.
This quarterly data report examines RQ2, RQ3, and RQ4. The first research question pertains to programmatic implementation gleaned from call, chat, and text software used by counselors. The fifth research question examines qualitative data and will be examined by a qualitative researcher contracted by Childhelp.
PACTECH Quarterly Data Report – April 2021
2
SOURCES OF DATA AND METHODS
TEXT AND CHAT DATA COLLECTION
All text and chat users are offered surveys before and after their exchange with a counselor. With the initiation of a text or chat, the help seeker immediately receives a message that includes information about the user agreement and information about the number of demographic survey questions. The help seeker is then presented with the opening survey for text and chat, a demographic survey before the interaction with a counselor. After a text or chat, the counselor sends a pre-populated message letting the help seeker know that they have access to a post-survey, collecting information on knowledge, attitude, and behavior outcomes. Messaging also includes that the survey is voluntary and can be completed at a later date. Survey information populates into the associated call report data form through iCarol.
The iCarol system is used to collect help seeker data. Upon initiating each session for all contacts, counselors record demographic answers about the help seeker and continue collecting several data items throughout the session. These data items include: date of contact, time/length of contact, gender, age-range, caller relation to issue (parent, self, teacher, etc.), call content, interaction with the caller, action plan developed, level of intervention provided, how they heard about the hotline, and reaction to service.
CALL DATA COLLECTION
The sampling method used for selecting call post-survey participants is a non-probability, voluntary sample of all youth callers, ages 13-24. In February 2020, a phone-based automated survey was created, and a pilot study tested the survey measures designed for callers. PACTECH data were collected using two systems: iCarol and NICE inContact. iCarol is a subscription-based helpline software management system that automates all of the processes associated with managing a hotline. iCarol collects data that are used to assess and measure critical aspects of the PACTECH project. Data were entered into the iCarol contact report form in a timely and accurate manner. NICE inContact provides the phone survey and is a cloud customer platform that allowed for the iCarol report number to be connected to the phone survey when the caller opted to take the survey.
PRIOR MODIFICATIONS TO DATA COLLECTION INSTRUMENTS
A call comparison pilot data report was completed on April 15, 2020, and examined outcomes for help seekers that called the hotline compared to help seekers who contacted the hotline through text or online chat. After reviewing the call comparison pilot data report findings, adjustments to data collection items were conducted. Survey items and response categories for all modes were finalized, and changes in the iCarol and NICE inContact system were implemented before June 1, 2020. Phase 2 of the project includes data collected for 12 months (June 2020-May 2021), with quarterly data reports being prepared and submitted in October, January, and April. A final comprehensive data report will be submitted at the end of the project.
PACTECH Quarterly Data Report – April 2021
3
DATA CLEANING AND ANALYSES
For this third quarterly data report of Phase 2, iCarol data were securely transferred following collection to ASU from Childhelp in an Excel spreadsheet. Monthly Excel files were cleaned, new variables were created, and data were analyzed before merging with the previous month's data. A data dashboard using Excel, previously created by Julie Murphy, Senior Research Associate, was utilized for data visualizations of tables and graphs. Statistical analyses (in SPSS and SAS) were conducted to check calculations and counts with the newly created data visualization tables and graphs. The data visualizations present results graphically regarding PACTECH objectives and outcomes. This report summarizes the information for the first nine months (June 2020 through February 2021) of Phase 2 of the PACTECH project for those help seekers in the target population. Demographic and outcome data were analyzed and reported for only those help seekers in the PACTECH target population (ages 13-24), designated as a Level 2 or 3 intervention, and started a post-survey that collected data to measure outcomes for this project. The following sections of this report present data collected and analyzed for Research Questions 2-4. Demographic data are presented under Research Question 4. Data were collected utilizing a pre-survey, counselor reported responses from interactions between counselors and help seekers for all modes of contact (call, chat, and text), and a post-survey. The analysis plan also proposed examining a sub-target population of help seekers who reported being a young parent and contacting the hotline for help specific to parenting (i.e., determined based on responses for the presenting issue of parenting concerns-own child). However, due to the low numbers (n=20) of help seekers in the target population, ages 13-24, reporting parenting concerns - own child (text n=3, chat n=5, and call n=12), data were unable to be analyzed for this sub-target population of young parents.
SUMMARY OF ALL CONTACTS
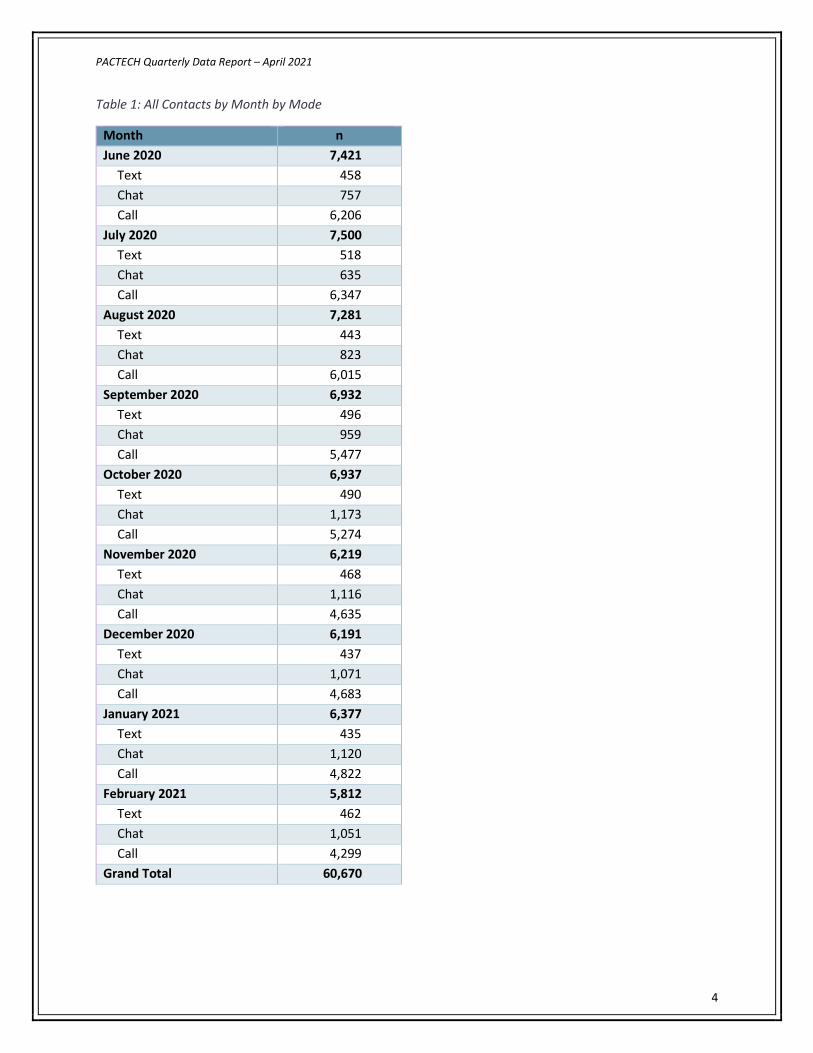
Although this report focuses on help seekers in the target age of 13-24, Level 2 and Level 3 contact, and a post-survey, the following section provides counts for all contacts made to the hotline through February 2021. During the first nine months of Phase 2, 60,670 total contact sessions were initiated with the Childhelp National Child Abuse Hotline (see Table 1). Reporting was higher in the summer months (high of 7,500 contacts in July 2020) and decreased in the winter (low of 5,812 contacts in February 2021).
There were 4,207 text sessions with 594 Level 1 text contacts, 3,095 Level 2 text contacts, and 185 Level 3 text contacts. Also, 333 text contacts were not specified due to no response (n=264), prank (n=27), wrong number (n=19), hang-up (n=15), and obscene (n=6). (Two text contacts did not have a reason.)
There were 8,705 chat sessions with 859 Level 1 chat contacts, 5,797 Level 2 chat contacts, and 481 Level 3 chat contacts. In addition, 1,568 chat contacts did not have a level of intervention specified due to no response (n=1,447), hang-up (n=75), prank (n=27), wrong number (n=8), obscene (n=4), and donation-volunteer (n=1). (Six chat contacts did not have a reason.)
There were 47,758 call contacts, of which 14,795 were intervention Level 1 calls, 24,148 call contacts were Level 2, and 1,077 call contacts were Level 3. Also, 7,738 call contacts did not have a level of intervention specified due to hang-up (n=4,395), no response (n=2,505), wrong number (n=482), prank (n=175), obscene (n=111), and donation-volunteer (n=70).
PACTECH Quarterly Data Report – April 2021
4
Table 1: All Contacts by Month by Mode
Month n June 2020 7,421
Text 458 Chat 757 Call 6,206
July 2020 7,500 Text 518 Chat 635 Call 6,347
August 2020 7,281 Text 443 Chat 823 Call 6,015
September 2020 6,932 Text 496 Chat 959 Call 5,477
October 2020 6,937 Text 490 Chat 1,173 Call 5,274
November 2020 6,219 Text 468 Chat 1,116 Call 4,635
December 2020 6,191 Text 437 Chat 1,071 Call 4,683
January 2021 6,377 Text 435 Chat 1,120 Call 4,822
February 2021 5,812 Text 462 Chat 1,051 Call 4,299
Grand Total 60,670
PACTECH Quarterly Data Report – April 2021
5
RESULTS
RESEARCH QUESTION 2: HOW EFFECTIVE IS PACTECH AT COMMUNICATING WITH YOUTH, WHO MAY BE VICTIMS OF MALTREATMENT AND PROTECTING THEIR PRIVACY?
Research Question 2 is related to communication. The data were collected from help seeker self-reported post-surveys for each of the three modes of contact (text, chat, and call) in addition to counselor observations. Data were examined and reported for help seekers designated as Level 2 or Level 3. Post-survey items included: mode of contact preference, mode of contact usefulness, and whether they had previously contacted the hotline.
HELP SEEKER RATINGS OF CONTACT PREFERENCE
Help seekers were asked to report their willingness to use an alternate mode to contact the hotline. An item to assess willingness to utilize an alternate mode of contact was included in the post-survey. The response categories included Yes, Maybe, No, and Prefer not to answer. Results reported by help seekers, ages 13-24, are included herein.
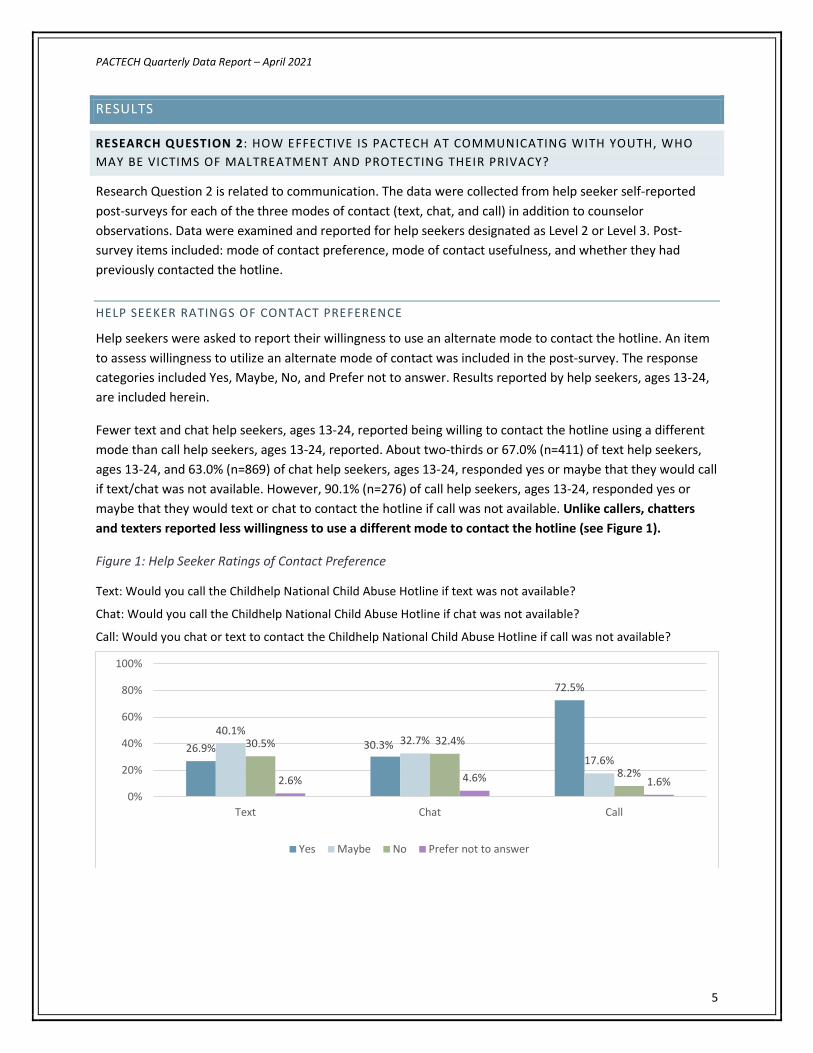
Fewer text and chat help seekers, ages 13-24, reported being willing to contact the hotline using a different mode than call help seekers, ages 13-24, reported. About two-thirds or 67.0% (n=411) of text help seekers, ages 13-24, and 63.0% (n=869) of chat help seekers, ages 13-24, responded yes or maybe that they would call if text/chat was not available. However, 90.1% (n=276) of call help seekers, ages 13-24, responded yes or maybe that they would text or chat to contact the hotline if call was not available. Unlike callers, chatters and texters reported less willingness to use a different mode to contact the hotline (see Figure 1).
Figure 1: Help Seeker Ratings of Contact Preference
Text: Would you call the Childhelp National Child Abuse Hotline if text was not available?
Chat: Would you call the Childhelp National Child Abuse Hotline if chat was not available?
Call: Would you chat or text to contact the Childhelp National Child Abuse Hotline if call was not available?
26.9% 30.3%
72.5%
40.1%32.7%
17.6%30.5% 32.4%
8.2%2.6% 4.6% 1.6%0%
20%
40%
60%
80%
100%
Text Chat Call
Yes Maybe No Prefer not to answer

PACTECH Quarterly Data Report – April 2021
6
HELP SEEKER RATINGS OF MODE OF CONTACT
Help seekers were asked to evaluate if how they contacted the hotline was a good way to get help. An item to evaluate the mode of contact was included in the post-survey with response categories of Yes, Maybe, No, and Prefer not to answer. Results as reported by help seekers, ages 13-24, are included herein.
Overall, text (94.6%, n=571) and chat (90.1%, n=1,241) help seekers, ages 13-24, reported that using text (for texters) or chat (for chatters) was a good way to get help (Yes or Maybe response; see Figure 2). Similarly, almost all callers reported that calling was a good way to get help (98.0%, n=307, Yes or Maybe response). Text, chat, and call help seekers reported that their respective way of reaching out to the hotline was a good way to get help.
Figure 2: Help Seeker Ratings of Mode of Contact
Text: Was using text a good way for you to get help?
Chat: Was using chat a good way for you to get help?
Call: Was calling a good way for you to get help?
83.3%77.0%
86.3%
11.3% 13.1% 11.7%4.0%
8.2%2.0%1.5% 1.7% 0.0%
0%
20%
40%
60%
80%
100%
Text Chat Call
Yes Maybe No Prefer not to answer
PACTECH Quarterly Data Report – April 2021
7
HELP SEEKER REPORTS OF PREVIOUS UTILIZATION OF THE CHILDHELP HOTLINE
An item was included in the post-survey to assess whether help seekers had previously reached out to the hotline. The response options differed between text and chat versus call. For text and chat the response categories included Yes (1-3 times or 4 or more times) or No. For call the response categories included Yes, No, and Prefer not to answer. Results as reported by help seekers, ages 13-24, are included herein.
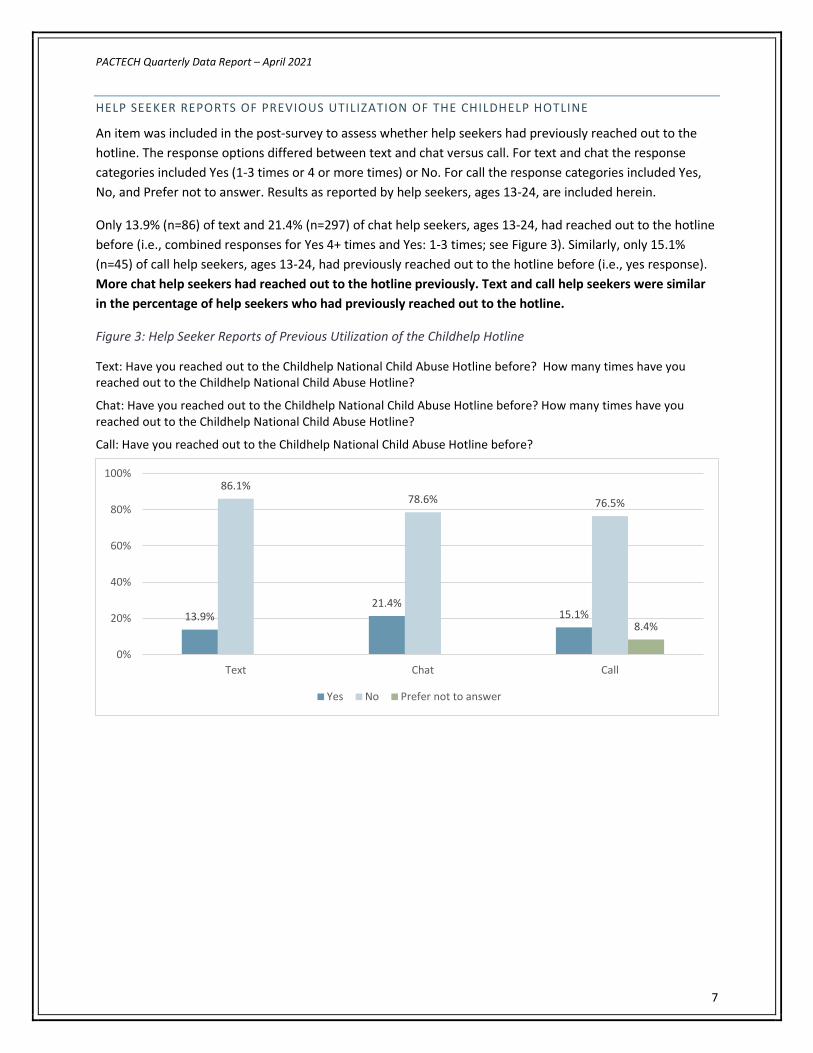
Only 13.9% (n=86) of text and 21.4% (n=297) of chat help seekers, ages 13-24, had reached out to the hotline before (i.e., combined responses for Yes 4+ times and Yes: 1-3 times; see Figure 3). Similarly, only 15.1% (n=45) of call help seekers, ages 13-24, had previously reached out to the hotline before (i.e., yes response). More chat help seekers had reached out to the hotline previously. Text and call help seekers were similar in the percentage of help seekers who had previously reached out to the hotline.
Figure 3: Help Seeker Reports of Previous Utilization of the Childhelp Hotline
Text: Have you reached out to the Childhelp National Child Abuse Hotline before? How many times have you reached out to the Childhelp National Child Abuse Hotline?
Chat: Have you reached out to the Childhelp National Child Abuse Hotline before? How many times have you reached out to the Childhelp National Child Abuse Hotline?
Call: Have you reached out to the Childhelp National Child Abuse Hotline before?
13.9%21.4%
15.1%
86.1%78.6% 76.5%
8.4%
0%
20%
40%
60%
80%
100%
Text Chat Call
Yes No Prefer not to answer
PACTECH Quarterly Data Report – April 2021
8
RESEARCH QUESTION 3: HOW EFFECTIVE IS PACTECH AT ENGAGING WITH YOUTH TO BUILD SKILLS, PROVIDE RESOURCES AND INFORMATION TO MEET THE NEED FOR WHICH THEY SOUGHT HELP?
Research Question 3 pertained to whether PACTECH is engaging youth to build skills and whether PACTECH provides resources needed. The data were collected from help seeker self-reported post-surveys for each of the three modes of contact (text, chat, and call). Data were examined and reported for only those help seekers designated as Level 2 or Level 3. Post-survey items included assessing decreased stress, increased hopefulness, increased preparedness, and gained information.
STRESS
Stress reduction following contact with PACTECH was evaluated. An item regarding stress was included in the post-survey with response categories of Yes, Maybe, No, and Prefer not to answer. Results as reported by help seekers, ages 13-24, are included herein. Additionally, under Research Question 3, there was an outcome objective for PACTECH regarding decreasing stress, which stated that 65% of text/chat/call users who complete a post-survey reported that their stress level decreased after the session.
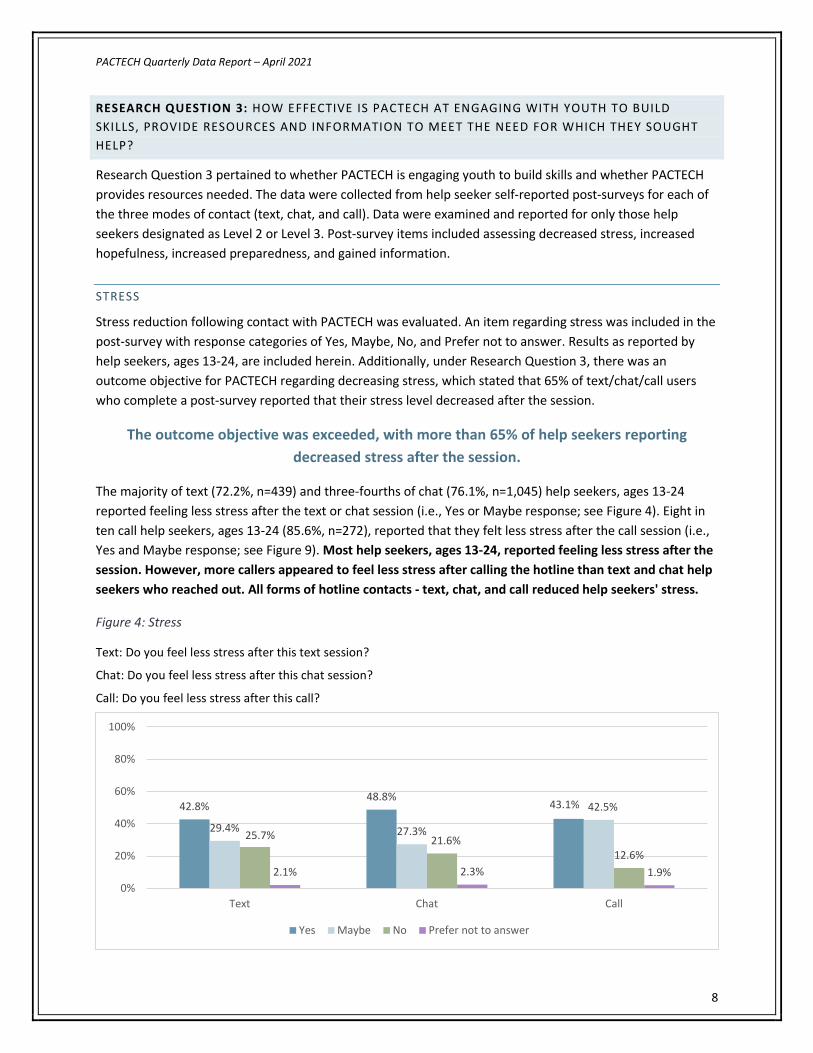
The outcome objective was exceeded, with more than 65% of help seekers reporting decreased stress after the session.
The majority of text (72.2%, n=439) and three-fourths of chat (76.1%, n=1,045) help seekers, ages 13-24 reported feeling less stress after the text or chat session (i.e., Yes or Maybe response; see Figure 4). Eight in ten call help seekers, ages 13-24 (85.6%, n=272), reported that they felt less stress after the call session (i.e., Yes and Maybe response; see Figure 9). Most help seekers, ages 13-24, reported feeling less stress after the session. However, more callers appeared to feel less stress after calling the hotline than text and chat help seekers who reached out. All forms of hotline contacts - text, chat, and call reduced help seekers' stress.
Figure 4: Stress
Text: Do you feel less stress after this text session?
Chat: Do you feel less stress after this chat session?
Call: Do you feel less stress after this call?
42.8%48.8%
43.1%
29.4% 27.3%
42.5%
25.7% 21.6%12.6%
2.1% 2.3% 1.9%0%
20%
40%
60%
80%
100%
Text Chat Call
Yes Maybe No Prefer not to answer
PACTECH Quarterly Data Report – April 2021
9
HOPEFUL Help seeker hopefulness following contact with PACTECH was evaluated. An item measuring hopefulness was included in the post-survey with response categories of A lot, A little, Not at all, and Prefer not to answer. Results as reported by help seekers, ages 13-24, are included herein. Additionally, under Research Question 3, an outcome objective for PACTECH regarding increasing hopefulness stated that 65% of text/chat/call users who complete a post-survey would report their hopefulness increased after the session.
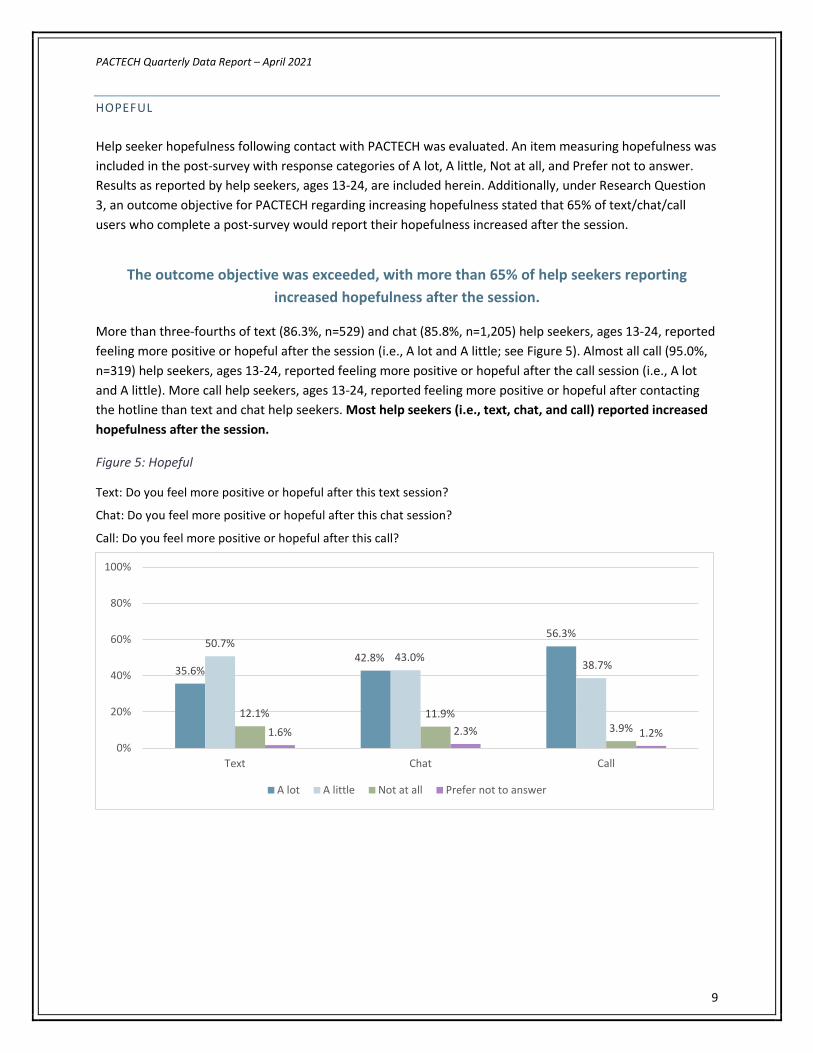
The outcome objective was exceeded, with more than 65% of help seekers reporting increased hopefulness after the session.
More than three-fourths of text (86.3%, n=529) and chat (85.8%, n=1,205) help seekers, ages 13-24, reported feeling more positive or hopeful after the session (i.e., A lot and A little; see Figure 5). Almost all call (95.0%, n=319) help seekers, ages 13-24, reported feeling more positive or hopeful after the call session (i.e., A lot and A little). More call help seekers, ages 13-24, reported feeling more positive or hopeful after contacting the hotline than text and chat help seekers. Most help seekers (i.e., text, chat, and call) reported increased hopefulness after the session.
Figure 5: Hopeful
Text: Do you feel more positive or hopeful after this text session?
Chat: Do you feel more positive or hopeful after this chat session?
Call: Do you feel more positive or hopeful after this call?
35.6%42.8%
56.3%50.7%
43.0%38.7%
12.1% 11.9%3.9%1.6% 2.3% 1.2%
0%
20%
40%
60%
80%
100%
Text Chat Call
A lot A little Not at all Prefer not to answer
PACTECH Quarterly Data Report – April 2021
10
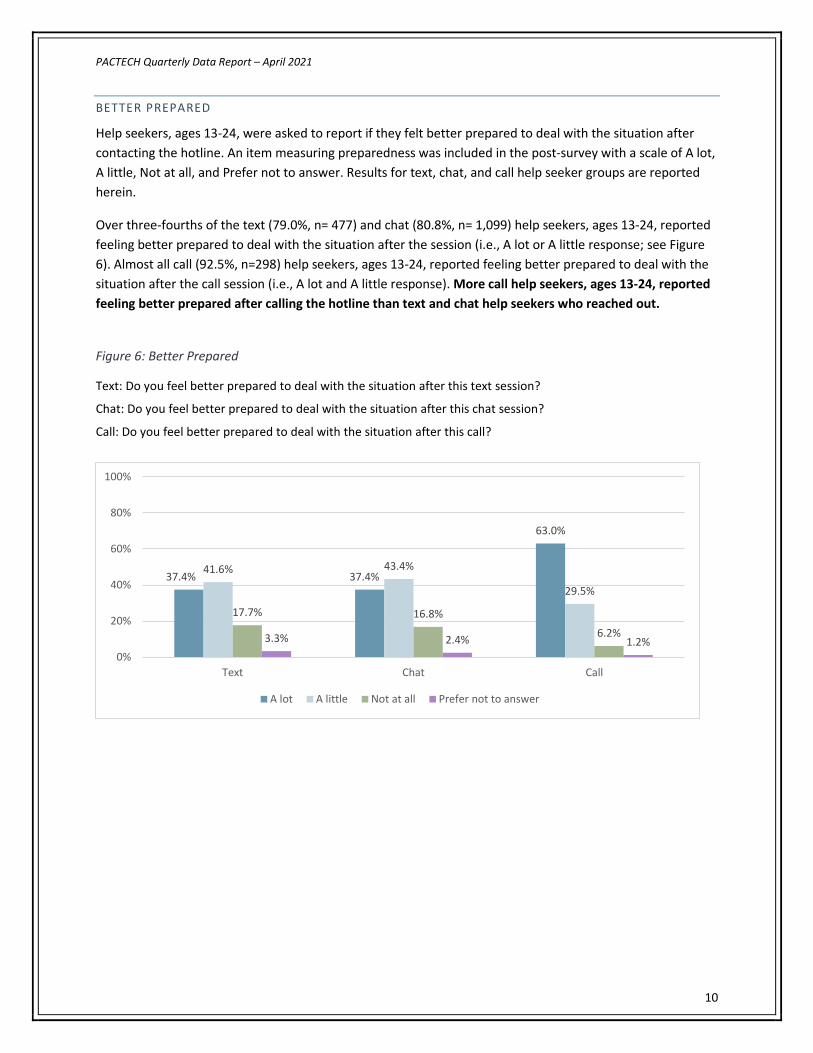
BETTER PREPARED
Help seekers, ages 13-24, were asked to report if they felt better prepared to deal with the situation after contacting the hotline. An item measuring preparedness was included in the post-survey with a scale of A lot, A little, Not at all, and Prefer not to answer. Results for text, chat, and call help seeker groups are reported herein.
Over three-fourths of the text (79.0%, n= 477) and chat (80.8%, n= 1,099) help seekers, ages 13-24, reported feeling better prepared to deal with the situation after the session (i.e., A lot or A little response; see Figure 6). Almost all call (92.5%, n=298) help seekers, ages 13-24, reported feeling better prepared to deal with the situation after the call session (i.e., A lot and A little response). More call help seekers, ages 13-24, reported feeling better prepared after calling the hotline than text and chat help seekers who reached out.
Figure 6: Better Prepared
Text: Do you feel better prepared to deal with the situation after this text session?
Chat: Do you feel better prepared to deal with the situation after this chat session?
Call: Do you feel better prepared to deal with the situation after this call?
37.4% 37.4%
63.0%
41.6% 43.4%
29.5%
17.7% 16.8%
6.2%3.3% 2.4% 1.2%0%
20%
40%
60%
80%
100%
Text Chat Call
A lot A little Not at all Prefer not to answer
PACTECH Quarterly Data Report – April 2021
11
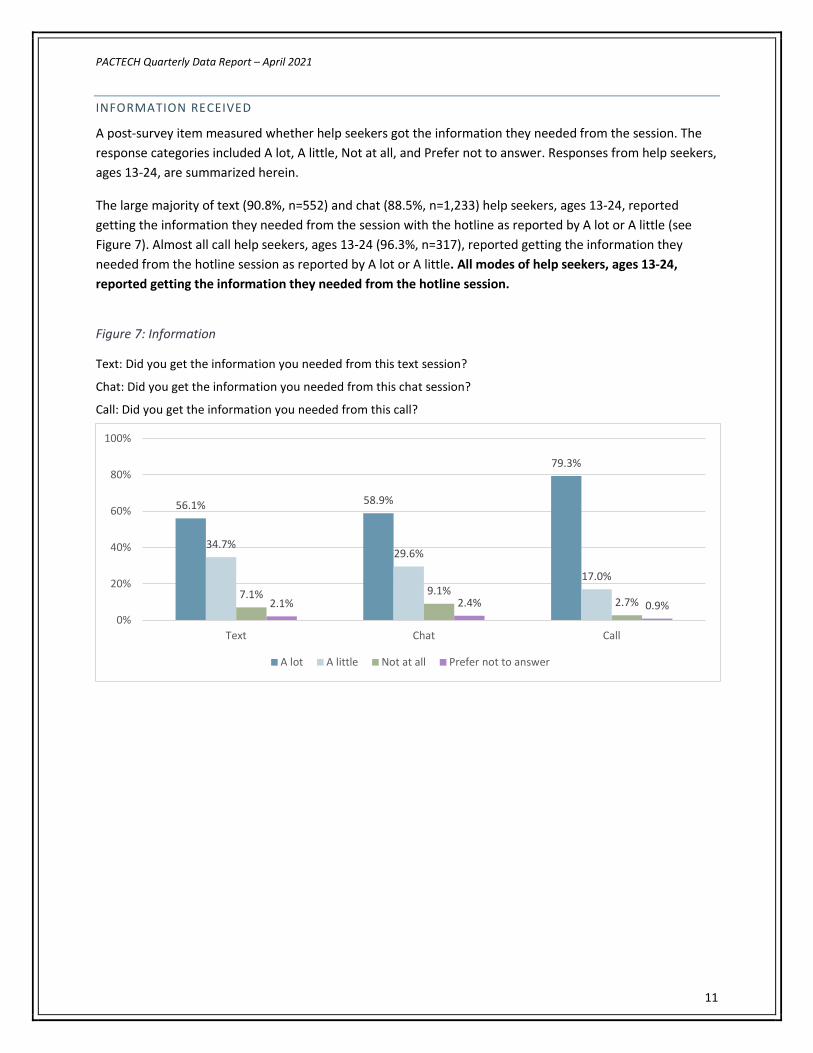
INFORMATION RECEIVED
A post-survey item measured whether help seekers got the information they needed from the session. The response categories included A lot, A little, Not at all, and Prefer not to answer. Responses from help seekers, ages 13-24, are summarized herein.
The large majority of text (90.8%, n=552) and chat (88.5%, n=1,233) help seekers, ages 13-24, reported getting the information they needed from the session with the hotline as reported by A lot or A little (see Figure 7). Almost all call help seekers, ages 13-24 (96.3%, n=317), reported getting the information they needed from the hotline session as reported by A lot or A little. All modes of help seekers, ages 13-24, reported getting the information they needed from the hotline session.
Figure 7: Information
Text: Did you get the information you needed from this text session?
Chat: Did you get the information you needed from this chat session?
Call: Did you get the information you needed from this call?
56.1% 58.9%
79.3%
34.7%29.6%
17.0%7.1% 9.1%
2.7%2.1% 2.4% 0.9%0%
20%
40%
60%
80%
100%
Text Chat Call
A lot A little Not at all Prefer not to answer
PACTECH Quarterly Data Report – April 2021
12
RESEARCH QUESTION 4: WHAT ARE THE DEMOGRAPHIC CHARACTERISTICS AND PRESENTING ISSUES OF HELP SEEKERS THAT USE A TEXT AND CHAT FEATURE OF A CHILD MALTREATMENT HOTLINE?
Research Question 4 pertained to gaining an understanding of help seekers' demographics and primary needs. The data were collected from help seeker self-reported pre and post-surveys for each of the three modes of contact (text, chat, and call). Data were examined and reported for only those help seekers designated as Level 2 or Level 3. Data included items such as mode of contact, contact time, age, gender, race and ethnicity, state, category of help seeker, how help seekers learned about the hotline, post-survey response percentage, and presenting issues.
DEMOGRAPHICS
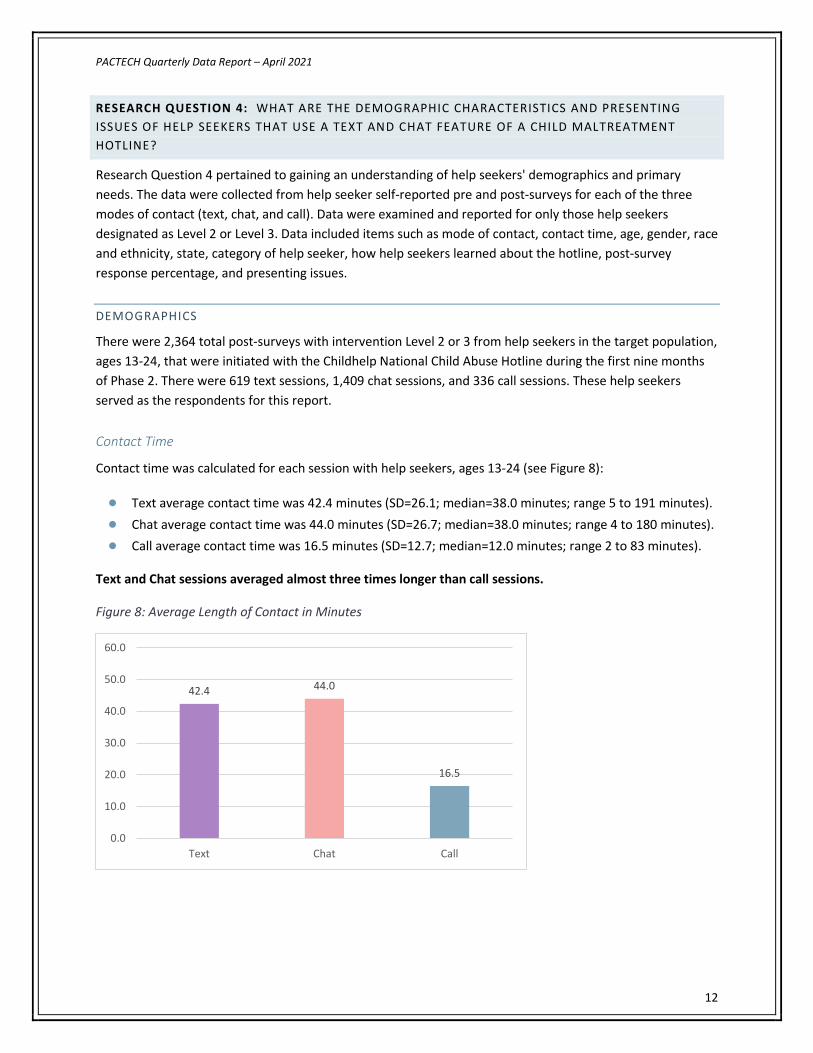
There were 2,364 total post-surveys with intervention Level 2 or 3 from help seekers in the target population, ages 13-24, that were initiated with the Childhelp National Child Abuse Hotline during the first nine months of Phase 2. There were 619 text sessions, 1,409 chat sessions, and 336 call sessions. These help seekers served as the respondents for this report. Contact Time
Contact time was calculated for each session with help seekers, ages 13-24 (see Figure 8):
● Text average contact time was 42.4 minutes (SD=26.1; median=38.0 minutes; range 5 to 191 minutes). ● Chat average contact time was 44.0 minutes (SD=26.7; median=38.0 minutes; range 4 to 180 minutes). ● Call average contact time was 16.5 minutes (SD=12.7; median=12.0 minutes; range 2 to 83 minutes).
Text and Chat sessions averaged almost three times longer than call sessions.
Figure 8: Average Length of Contact in Minutes
42.4 44.0
16.5
0.0
10.0
20.0
30.0
40.0
50.0
60.0
Text Chat Call
PACTECH Quarterly Data Report – April 2021
13
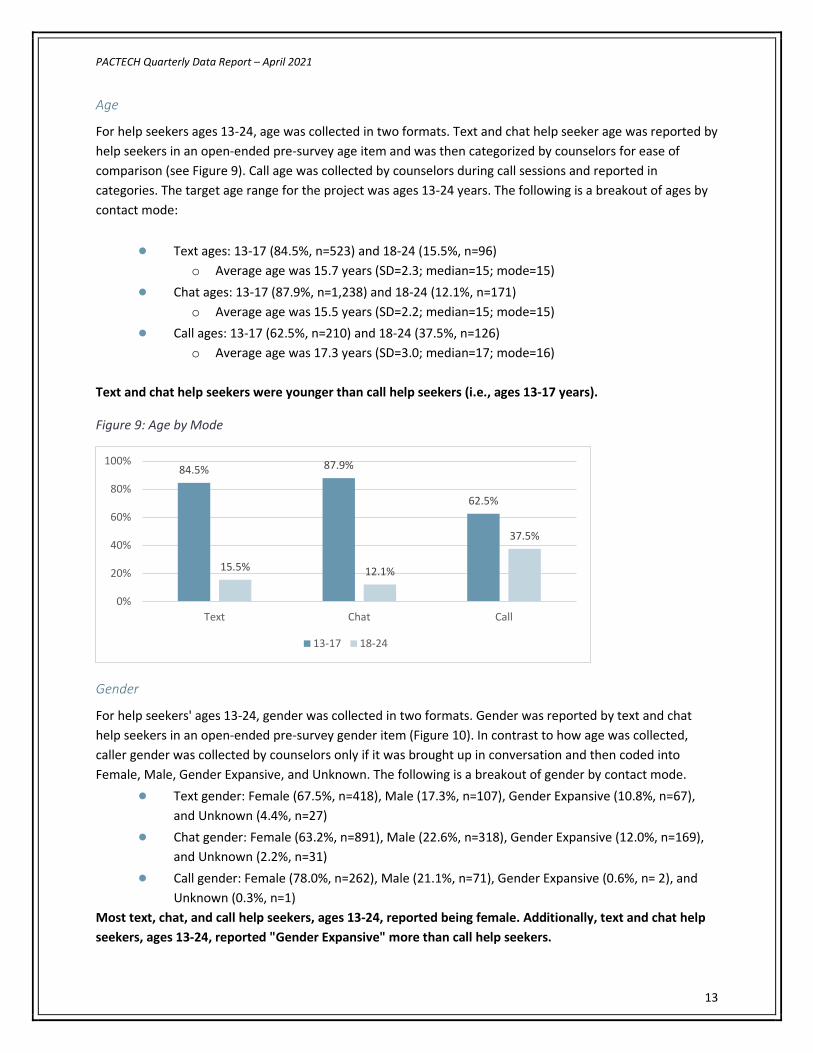
Age
For help seekers ages 13-24, age was collected in two formats. Text and chat help seeker age was reported by help seekers in an open-ended pre-survey age item and was then categorized by counselors for ease of comparison (see Figure 9). Call age was collected by counselors during call sessions and reported in categories. The target age range for the project was ages 13-24 years. The following is a breakout of ages by contact mode:
● Text ages: 13-17 (84.5%, n=523) and 18-24 (15.5%, n=96) o Average age was 15.7 years (SD=2.3; median=15; mode=15)
● Chat ages: 13-17 (87.9%, n=1,238) and 18-24 (12.1%, n=171) o Average age was 15.5 years (SD=2.2; median=15; mode=15)
● Call ages: 13-17 (62.5%, n=210) and 18-24 (37.5%, n=126) o Average age was 17.3 years (SD=3.0; median=17; mode=16)
Text and chat help seekers were younger than call help seekers (i.e., ages 13-17 years).
Figure 9: Age by Mode
Gender
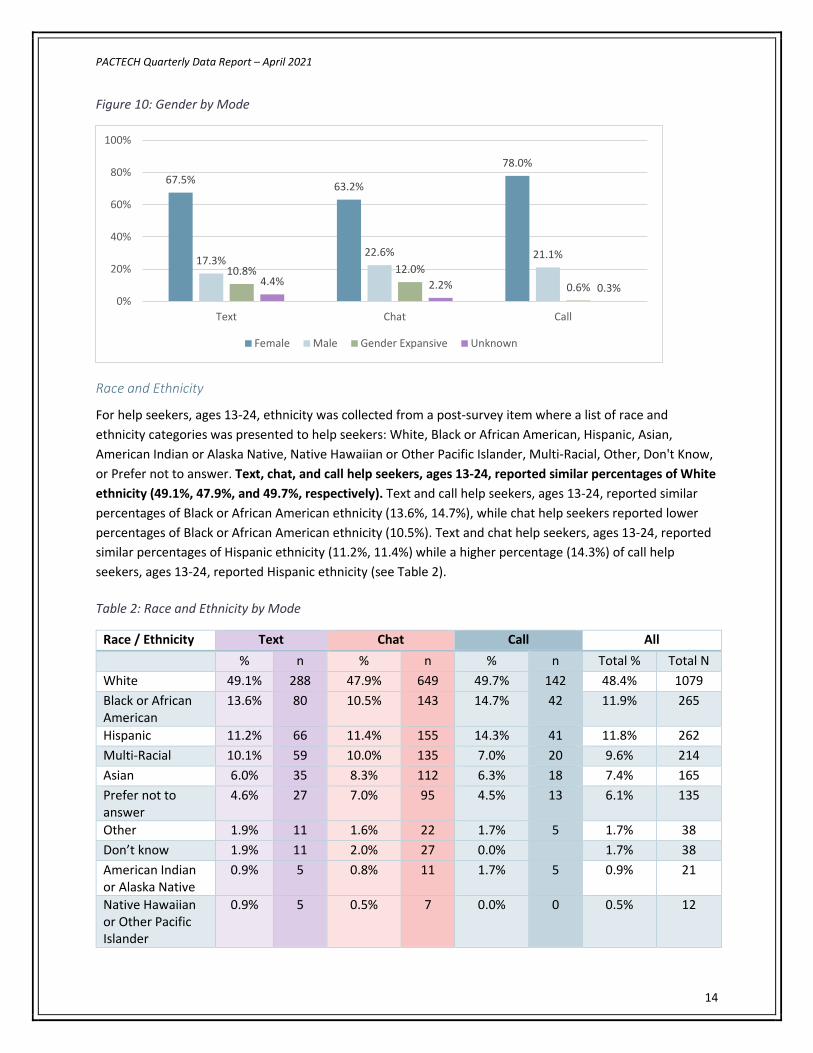
For help seekers' ages 13-24, gender was collected in two formats. Gender was reported by text and chat help seekers in an open-ended pre-survey gender item (Figure 10). In contrast to how age was collected, caller gender was collected by counselors only if it was brought up in conversation and then coded into Female, Male, Gender Expansive, and Unknown. The following is a breakout of gender by contact mode.
● Text gender: Female (67.5%, n=418), Male (17.3%, n=107), Gender Expansive (10.8%, n=67), and Unknown (4.4%, n=27)
● Chat gender: Female (63.2%, n=891), Male (22.6%, n=318), Gender Expansive (12.0%, n=169), and Unknown (2.2%, n=31)
● Call gender: Female (78.0%, n=262), Male (21.1%, n=71), Gender Expansive (0.6%, n= 2), and Unknown (0.3%, n=1)
Most text, chat, and call help seekers, ages 13-24, reported being female. Additionally, text and chat help seekers, ages 13-24, reported "Gender Expansive" more than call help seekers.
84.5% 87.9%
62.5%
15.5% 12.1%
37.5%
0%
20%
40%
60%
80%
100%
Text Chat Call
13-17 18-24
PACTECH Quarterly Data Report – April 2021
14
Figure 10: Gender by Mode
Race and Ethnicity
For help seekers, ages 13-24, ethnicity was collected from a post-survey item where a list of race and ethnicity categories was presented to help seekers: White, Black or African American, Hispanic, Asian, American Indian or Alaska Native, Native Hawaiian or Other Pacific Islander, Multi-Racial, Other, Don't Know, or Prefer not to answer. Text, chat, and call help seekers, ages 13-24, reported similar percentages of White ethnicity (49.1%, 47.9%, and 49.7%, respectively). Text and call help seekers, ages 13-24, reported similar percentages of Black or African American ethnicity (13.6%, 14.7%), while chat help seekers reported lower percentages of Black or African American ethnicity (10.5%). Text and chat help seekers, ages 13-24, reported similar percentages of Hispanic ethnicity (11.2%, 11.4%) while a higher percentage (14.3%) of call help seekers, ages 13-24, reported Hispanic ethnicity (see Table 2). Table 2: Race and Ethnicity by Mode
Race / Ethnicity Text Chat Call All % n % n % n Total % Total N
White 49.1% 288 47.9% 649 49.7% 142 48.4% 1079 Black or African American
13.6% 80 10.5% 143 14.7% 42 11.9% 265
Hispanic 11.2% 66 11.4% 155 14.3% 41 11.8% 262 Multi-Racial 10.1% 59 10.0% 135 7.0% 20 9.6% 214 Asian 6.0% 35 8.3% 112 6.3% 18 7.4% 165 Prefer not to answer
4.6% 27 7.0% 95 4.5% 13 6.1% 135
Other 1.9% 11 1.6% 22 1.7% 5 1.7% 38 Don’t know 1.9% 11 2.0% 27 0.0%
1.7% 38
American Indian or Alaska Native
0.9% 5 0.8% 11 1.7% 5 0.9% 21
Native Hawaiian or Other Pacific Islander
0.9% 5 0.5% 7 0.0% 0 0.5% 12
67.5% 63.2%
78.0%
17.3%22.6% 21.1%
10.8% 12.0%0.6%4.4% 2.2% 0.3%
0%
20%
40%
60%
80%
100%
Text Chat Call
Female Male Gender Expansive Unknown

PACTECH Quarterly Data Report – April 2021
15
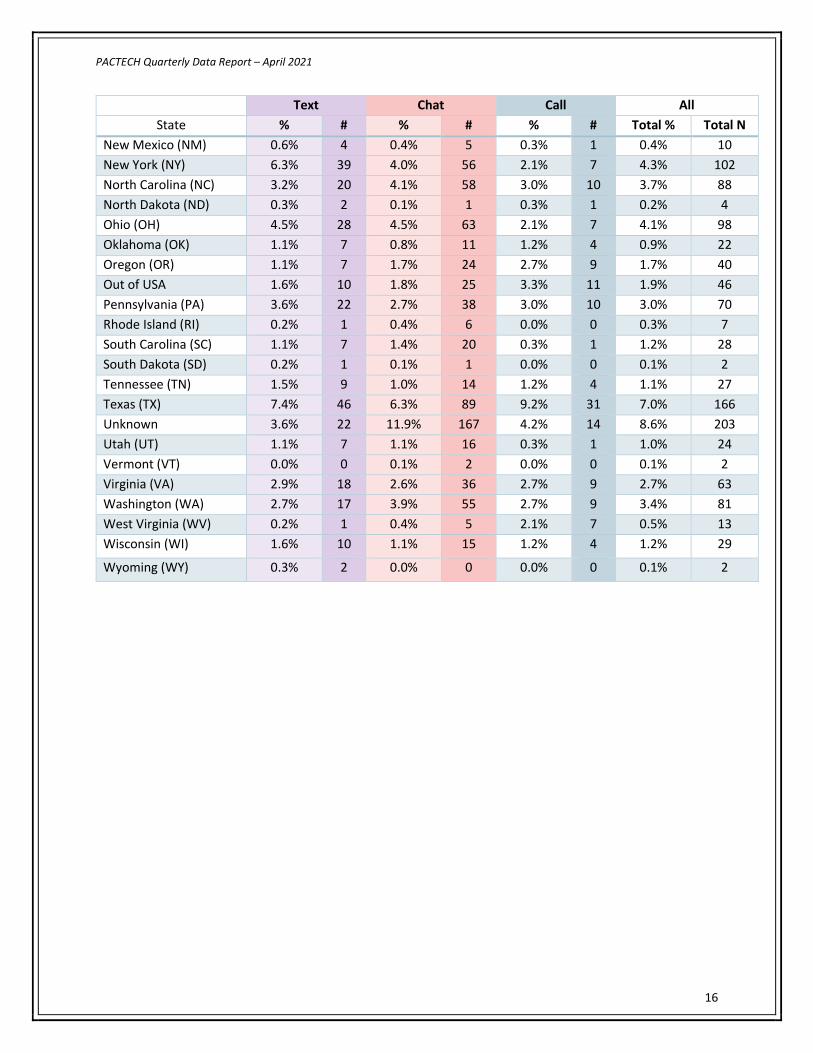
State
Information about the state from which the help seeker was contacting the hotline was collected. Text and chat help seekers were asked their state in the pre-survey items. Counselors collected call help seekers state information. Counselors coded all help seekers' responses to this question into a state variable with a drop-down list. California was the most frequently reported state by all help seekers (see Table 3; most frequently reported state in bold font).
Table 3: State by Mode
Text Chat Call All State % # % # % # Total % Total N
Alabama (AL) 1.0% 6 1.9% 27 2.4% 8 1.7% 41 Alaska (AK) 0.3% 2 0.5% 7 0.0% 0 0.4% 9 Arizona (AZ) 1.5% 9 1.9% 27 2.1% 7 1.8% 43 Arkansas (AR) 1.0% 6 0.6% 8 0.6% 2 0.7% 16 California (CA) 10.5% 65 10.1% 142 14.3% 48 10.8% 255 Colorado (CO) 1.6% 10 1.4% 20 0.6% 2 1.4% 32 Connecticut (CT) 0.8% 5 0.7% 10 1.8% 6 0.9% 21 Delaware (DE) 0.3% 2 0.4% 5 0.6% 2 0.4% 9 District of Columbia (DC)
0.0% 0 0.2% 3 0.0% 0 0.1% 3
Florida (FL) 6.0% 37 5.7% 81 8.3% 28 6.2% 146 Georgia (GA) 4.0% 25 2.8% 39 5.1% 17 3.4% 81 Hawaii (HI) 0.6% 4 0.1% 2 0.0% 0 0.3% 6 Idaho (ID) 0.6% 4 0.3% 4 0.3% 1 0.4% 9 Illinois (IL) 3.6% 22 3.0% 42 1.8% 6 3.0% 70 Indiana (IN) 2.1% 13 1.6% 22 1.2% 4 1.6% 39 Iowa (IA) 0.2% 1 0.9% 12 1.5% 5 0.8% 18 Kansas (KS) 1.0% 6 0.6% 9 0.9% 3 0.8% 18 Kentucky (KY) 1.0% 6 0.5% 7 1.8% 6 0.8% 19 Louisiana (LA) 1.5% 9 0.8% 11 1.2% 4 1.0% 24 Maine (ME) 0.3% 2 0.1% 1 0.6% 2 0.2% 5 Maryland (MD) 3.1% 19 2.8% 39 2.1% 7 2.7% 65 Massachusetts (MA) 1.6% 10 1.4% 20 0.9% 3 1.4% 33 Michigan (MI) 2.9% 18 3.1% 43 2.4% 8 2.9% 69 Minnesota (MN) 2.6% 16 1.8% 25 1.8% 6 2.0% 47 Mississippi (MS) 1.1% 7 0.6% 9 0.6% 2 0.8% 18 Missouri (MO) 1.8% 11 1.8% 26 1.2% 4 1.7% 41 Montana (MT) 0.3% 2 0.1% 2 0.3% 1 0.2% 5 Nebraska (NE) 0.8% 5 0.4% 5 0.9% 3 0.5% 13 Nevada (NV) 0.5% 3 1.1% 16 0.6% 2 0.9% 21 New Hampshire (NH) 0.2% 1 0.6% 8 0.9% 3 0.5% 12 New Jersey (NJ) 2.1% 13 2.1% 30 1.8% 6 2.1% 49
PACTECH Quarterly Data Report – April 2021
16
Text Chat Call All
State % # % # % # Total % Total N New Mexico (NM) 0.6% 4 0.4% 5 0.3% 1 0.4% 10 New York (NY) 6.3% 39 4.0% 56 2.1% 7 4.3% 102 North Carolina (NC) 3.2% 20 4.1% 58 3.0% 10 3.7% 88 North Dakota (ND) 0.3% 2 0.1% 1 0.3% 1 0.2% 4 Ohio (OH) 4.5% 28 4.5% 63 2.1% 7 4.1% 98 Oklahoma (OK) 1.1% 7 0.8% 11 1.2% 4 0.9% 22 Oregon (OR) 1.1% 7 1.7% 24 2.7% 9 1.7% 40 Out of USA 1.6% 10 1.8% 25 3.3% 11 1.9% 46 Pennsylvania (PA) 3.6% 22 2.7% 38 3.0% 10 3.0% 70 Rhode Island (RI) 0.2% 1 0.4% 6 0.0% 0 0.3% 7 South Carolina (SC) 1.1% 7 1.4% 20 0.3% 1 1.2% 28 South Dakota (SD) 0.2% 1 0.1% 1 0.0% 0 0.1% 2 Tennessee (TN) 1.5% 9 1.0% 14 1.2% 4 1.1% 27 Texas (TX) 7.4% 46 6.3% 89 9.2% 31 7.0% 166 Unknown 3.6% 22 11.9% 167 4.2% 14 8.6% 203 Utah (UT) 1.1% 7 1.1% 16 0.3% 1 1.0% 24 Vermont (VT) 0.0% 0 0.1% 2 0.0% 0 0.1% 2 Virginia (VA) 2.9% 18 2.6% 36 2.7% 9 2.7% 63 Washington (WA) 2.7% 17 3.9% 55 2.7% 9 3.4% 81 West Virginia (WV) 0.2% 1 0.4% 5 2.1% 7 0.5% 13 Wisconsin (WI) 1.6% 10 1.1% 15 1.2% 4 1.2% 29
Wyoming (WY) 0.3% 2 0.0% 0 0.0% 0 0.1% 2

PACTECH Quarterly Data Report – April 2021
17
Category of Help Seeker
For help seekers, ages 13-24, information about the type of help seeker was collected and coded by counselors for all modes of contact. The top three most frequently reported categories are highlighted in bold font in Table 4. For text and chat, the top three most reported categories were abused child, friend, and distressed child (not abused child). For call, the top three categories were abused child, friend, and sibling (see Table 4).
Table 4: Category of Help Seeker by Mode
Category of Help Seeker
Text Chat Call All
% n % n % n Total % Total N
Abused Child 51.5% 319 62.5% 880 37.5% 126 56.0% 1325
Friend 20.0% 124 10.6% 150 20.5% 69 14.5% 343
Distressed Child (NOT abused child)
12.8% 79 16.8% 237 7.1% 24 14.4% 340
Adult Survivor 1.9% 12 3.1% 43 4.8% 16 3.0% 71
Sibling 2.6% 16 1.3% 19 9.8% 33 2.9% 68
Other 2.7% 17 1.3% 19 3.3% 11 2.0% 47
Relative 2.3% 14 1.0% 14 4.8% 16 1.9% 44
Unknown 3.1% 19 1.1% 15 1.5% 5 1.6% 39
Parent 0.6% 4 0.4% 5 7.1% 24 1.4% 33
Neighbor 1.1% 7 0.6% 8 0.6% 2 0.7% 17
Bystander 1.1% 7 0.4% 5 1.5% 5 0.7% 17
Repeat-chronic 0.2% 1 0.2% 3 0.0% 0 0.2% 4
Day Care 0.0% 0 0.1% 1 0.9% 3 0.2% 4
Other Hotline 0.0% 0 0.1% 2 0.3% 1 0.1% 3
Perpetrator 0.0% 0 0.1% 2 0.0% 0 0.1% 2
Addict 0.0% 0 0.1% 2 0.0% 0 0.1% 2
Healthcare worker 0.0% 0 0.1% 1 0.3% 1 0.1% 2
Counselor 0.0% 0 0.1% 2 0.0% 0 0.1% 2
Teacher 0.0% 0 0.1% 1 0.0% 0 0.0% 1
PACTECH Quarterly Data Report – April 2021
18
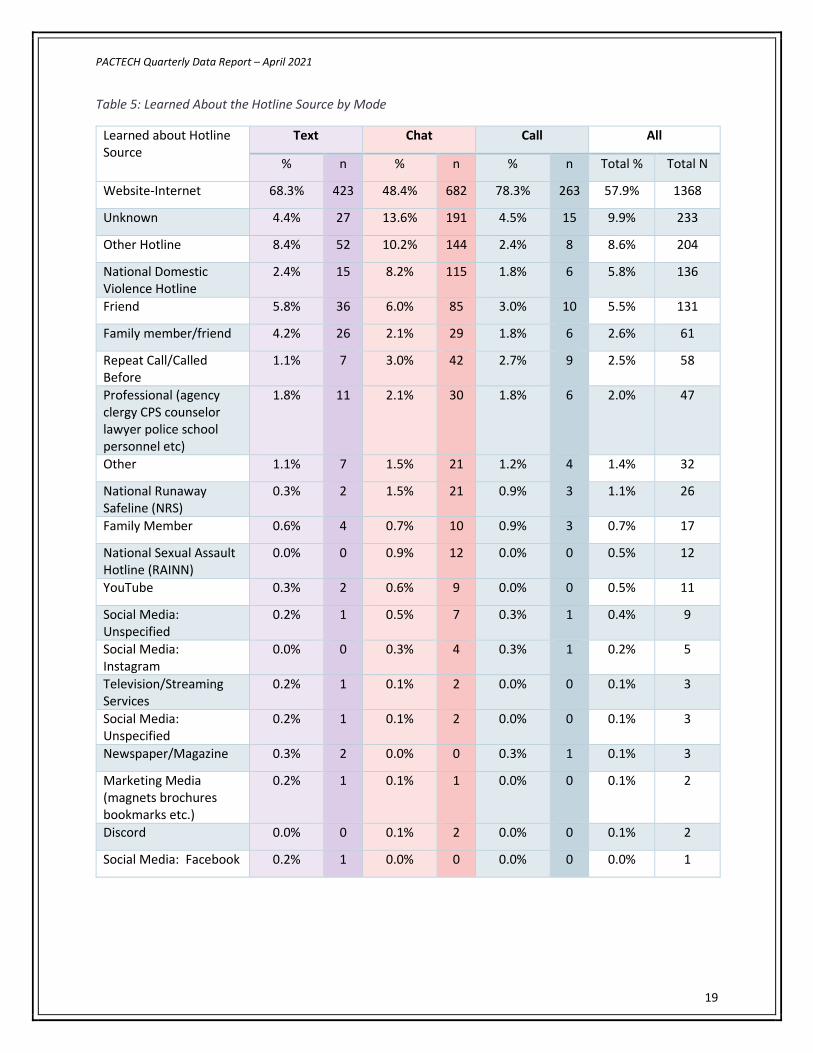
Learned about the Hotline
Information about how the help seeker learned about the hotline was collected. Text and chat help seekers were asked how they learned about the hotline in the pre-survey items. Counselors collected how call help seekers learned about the hotline and coded help seeker's responses into a variable with a drop-down list. The most frequently reported way that text, chat, and call help seekers learned about the hotline was through online sources (see Table 5).
Additionally, for Research Question 4, there was one outcome objective for PACTECH regarding the assessment of how help seekers learned about PACTECH through online sources. Counselors coded help seeker responses into designated categories. The target outcome objective states 60% of text/chat/call users will state they learned about PACTECH through online sources.
The outcome objective was almost met, with an overall average of 57.9% of text, chat, and call help seekers reporting learning about
PACTECH through online sources.
● 57.9% (n=1,368) of all help seekers (all modes combined), ages 13-24, reported hearing about the hotline through a website or internet source.
o 68.3% (n=423) of text help seekers ages 13-24 reported hearing about the hotline through a website or internet source.
o 48.4% (n=682) of chat help seekers ages 13-24 reported hearing about the hotline through a website or internet source. Chat help seekers reported less frequently hearing about the hotline through a website or internet source than the target outcome objective of 60%.
o 78.3% (n=263) of call help seekers ages 13-24 reported hearing about the hotline through a website or internet source.
PACTECH Quarterly Data Report – April 2021
19
Table 5: Learned About the Hotline Source by Mode
Learned about Hotline Source
Text Chat Call All
% n % n % n Total % Total N
Website-Internet 68.3% 423 48.4% 682 78.3% 263 57.9% 1368
Unknown 4.4% 27 13.6% 191 4.5% 15 9.9% 233
Other Hotline 8.4% 52 10.2% 144 2.4% 8 8.6% 204
National Domestic Violence Hotline
2.4% 15 8.2% 115 1.8% 6 5.8% 136
Friend 5.8% 36 6.0% 85 3.0% 10 5.5% 131
Family member/friend 4.2% 26 2.1% 29 1.8% 6 2.6% 61
Repeat Call/Called Before
1.1% 7 3.0% 42 2.7% 9 2.5% 58
Professional (agency clergy CPS counselor lawyer police school personnel etc)
1.8% 11 2.1% 30 1.8% 6 2.0% 47
Other 1.1% 7 1.5% 21 1.2% 4 1.4% 32
National Runaway Safeline (NRS)
0.3% 2 1.5% 21 0.9% 3 1.1% 26
Family Member 0.6% 4 0.7% 10 0.9% 3 0.7% 17
National Sexual Assault Hotline (RAINN)
0.0% 0 0.9% 12 0.0% 0 0.5% 12
YouTube 0.3% 2 0.6% 9 0.0% 0 0.5% 11
Social Media: Unspecified
0.2% 1 0.5% 7 0.3% 1 0.4% 9
Social Media: Instagram
0.0% 0 0.3% 4 0.3% 1 0.2% 5
Television/Streaming Services
0.2% 1 0.1% 2 0.0% 0 0.1% 3
Social Media: Unspecified
0.2% 1 0.1% 2 0.0% 0 0.1% 3
Newspaper/Magazine 0.3% 2 0.0% 0 0.3% 1 0.1% 3
Marketing Media (magnets brochures bookmarks etc.)
0.2% 1 0.1% 1 0.0% 0 0.1% 2
Discord 0.0% 0 0.1% 2 0.0% 0 0.1% 2
Social Media: Facebook 0.2% 1 0.0% 0 0.0% 0 0.0% 1
PACTECH Quarterly Data Report – April 2021
20
Post-survey Response Percentage
To answer the question of response proportion, a percentage was calculated from the number of people who responded to a post-survey compared to all relevant help seekers. The post-survey response percentage was determined by first examining the number of help seekers in the target population, ages 13-24, at a Level 2 or 3 intervention, and those who did not have a dropped contact. Next, a new variable was created to determine if a post-survey was completed for each help seeker who met those criteria. A percentage was then calculated based on these two numbers for each mode. All text and chat help seekers were offered the post-survey. For call help seekers, counselors captured whether a post survey was offered. This variable was used to delete help seekers not offered the survey.
The post-survey response percentage for help seekers ranged from 29.7% to 36.5%, with an average of 33.6%, or one-third of help seekers responding to a post-survey. The following is a breakout of post-survey response percentages by mode of contact:
● 29.7% Post-text survey response percentage o 619 of 2,083 Text post-surveys completed
● 36.5% Post-chat survey response percentage
o 1,409 of 3,864 Chat post-surveys completed
● 30.9% Post-call survey response percentage o 336 of 1,089 Call post-surveys completed
PRESENTING ISSUE
Counselors coded the presenting issue for which help seekers, ages 13-24, contacted the hotline. Help seekers were able to report more than one presenting issue (see Table 6).
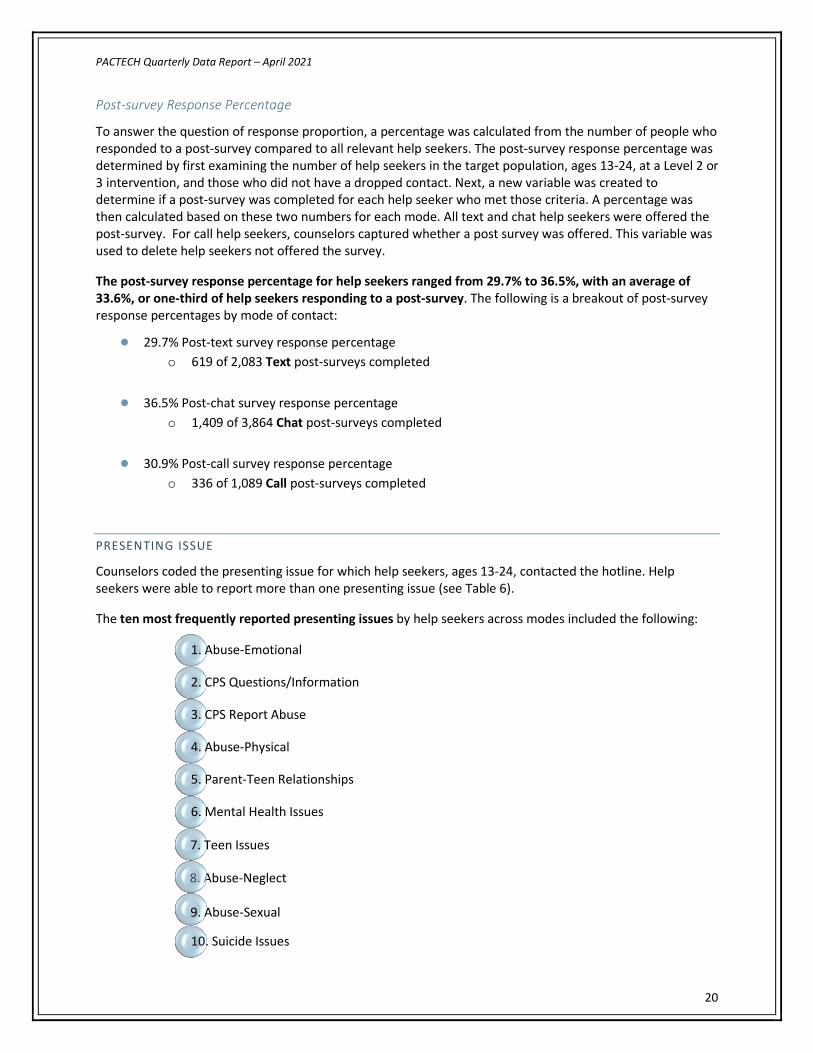
The ten most frequently reported presenting issues by help seekers across modes included the following:
1. Abuse-Emotional
2. CPS Questions/Information
3. CPS Report Abuse
4. Abuse-Physical
5. Parent-Teen Relationships
6. Mental Health Issues
8. Abuse-Neglect
7. Teen Issues
9. Abuse-Sexual
10. Suicide Issues

PACTECH Quarterly Data Report – April 2021
21
Text and chat help seekers' most frequently reported presenting issues are the same as the overall group. However, call help seekers reported suicide issues and teen issues less frequently, yet reported runaway and COVID-19 more frequently than text and chat help seekers. The top ten most frequently reported presenting issues for each mode are in bold font in Table 6. (Please note that the row for parenting concerns-own is also in bold since it was a population of interest for the project.)
Table 6: Presenting Issues Reported by Help Seekers by Mode
Presenting Issue Text n
Chat n
Call n
Total N
Abuse-Emotional 330 888 164 1,382 CPS Questions/Information 278 655 183 1,116 CPS Report Abuse 248 462 192 902 Abuse-Physical 210 574 115 899 Parent-Teen Relationships 224 590 59 873 Mental Health Issues 139 400 94 633 Teen Issues 79 234 30 343 Abuse-Neglect 100 171 67 338 Abuse-Sexual 50 112 34 196 Suicide Issues 39 128 24 191 COVID-19 29 106 50 185 Domestic Violence 40 77 21 138 Childhelp Information 30 80 28 138 Discipline/Behavior Issues 24 74 13 111 Runaways 20 62 21 103 Addiction/Substance Abuse 27 52 23 102 Legal Issues 25 44 26 95 LGBTQIA Issues 24 59 8 91 Other 20 58 12 90 Parenting Concerns-Other Child 34 35 18 87 Abuse-Neglect: Medical 16 46 11 73 School Issues 13 45 13 71 Abuse-Sibling 15 34 8 57 Emancipation 9 31 14 54 Child Support-Custody Dispute 15 19 13 47 Adult Survivor Issues 10 24 12 46 Bullying 11 28 5 44 Online Concerns 14 22 7 43 System Failure 7 15 10 32 Parenting Concerns- Own 3 5 12 20 Abandonment 3 7 7 17 Sex Offender Issues 3 8 4 15

PACTECH Quarterly Data Report – April 2021
22
Presenting Issue Text n
Chat n
Call n
Total N
Child Care Issues 5 8 1 14 Homelessness 5 7 2 14 Abuse-Elderly or Adult 3 8 2 13 Grandparent Rights 1 3 1 5 Father's Rights - 2 1 3 Trafficking - 2 1 3 Immigration Issues - 2 - 2 Youth Sports/Coaching Issue/Safe Sports - - - - Abduction Issues - - - - Welfare Fraud - - - - Donation: Brand Drivers - - - - Refugee Issues - - - - Forced Child Marriage - - - - FGM/C - - - -
CONCLUSION AND NEXT STEPS
PACTECH successfully collected data from pre and post-surveys from help seekers who contacted the National Child Abuse Hotline for assistance via text, chat, or call. The post-survey response percentages remained similar to the previous quarter with one-third of help seekers responding to post-surveys. Regarding the three objectives measured in this report, PACTECH successfully met the first two of its target outcomes and almost met the third target outcome.
The first outcome objective assessing stress was exceeded, with more than 65% of help seekers having reported decreased stress after the session. The second outcome objective assessing hopefulness also was exceeded, with more than 65% of help seekers having reported increased hopefulness after the session. The third target outcome objective was almost met, with 57.9% (target of 60%) of help seekers reported having learned about PACTECH through online sources.
The subsequent data report will be the final one for Phase 2, scheduled to be submitted at the end of September 2021. The report will provide a 12-month summary of PACTECH outcomes, with additional demographic results for help seekers in the PACTECH target population (ages 13-24), designated as a Level 2 or 3 intervention, and have a post-survey. These additional analyses will be conducted at the end of the data collection period, and included in the September 2021 report. Year four scope-of-work discussions for continued evaluation of the PACTECH project are underway.