Prevalence of Upper Limb Disorders and Associated Factors ... · PDF fileFor the investigation...
12
IOSR Journal of Dental and Medical Sciences (IOSR-JDMS) e-ISSN: 2279-0853, p-ISSN: 2279-0861.Volume 14, Issue 5 Ver. VII (May. 2015), PP 77-88 www.iosrjournals.org DOI: 10.9790/0853-14577788 www.iosrjournals.org 77 | Page Prevalence of Upper Limb Disorders and Associated Factors with Psychosocial and Awkward Postureamong Public University Workers in Malaysia Karwan, Mahmood Khudhir 1 ;*Ahmad Azuhairi, Ariffin 2 ; Hayati KS 3 1(Department of Occupational Health and Safety, Faculty of Medicine and Health Sciences, Universiti Putra Malaysia, 43400 UPM Serdang Selangor, Malaysia. 2 * (Department of Community Health, Faculty of Medicine and Health Sciences, Universiti Putra Malaysia, 43400 UPM Serdang Selangor, Malaysia 3(Department of Community Health, Faculty of Medicine and Health Sciences, Universiti Putra Malaysia, 43400 UPM Serdang Selangor, Malaysia. Abstract: Musculoskeletal disorders of the upper limb are a most important cause of ill-health, incapacity and health care expenditure. The purpose of this study is to determine the prevalence of Upper Limb Disorders associated with awkward posture and psychosocial factors among Universiti Putra Malaysia (UPM) workers. Simple random sampling was used to draw 271 participants from six faculties of the university. The use of a structured question was employed for data collection. Results of the study showed thatprevalence of ULDs among UPM workers was 67.2% in different body regions. Results showed that there is a significant association between ULDs and age, awkward posture, control at work, psychological demand, social support, and job satisfaction) (p<0.05). Multivariate logistic analysis showedthat the workers who had medium and very high RULA risk level were 12.242 times more likely to complain about ULDs (OR=12.242, 95%CI: 3.617-41.435), compared to other workers who have low RULA risk level.In conclusion, it can be said from the result of the study that there is high prevalence of upper limb disorders among UPM workers which is significantly associated with age, awkward posture and all psychosocial factors. In order to minimize the prevalence rate of upper limb disorders, it is recommended that workers be educated on prevention strategies and an ergonomic program which emphasizes psycho-social risk factors and how to improve working conditions. Keywords: Upper Limb Disorders, Psycho-social Factors, Prevalence, Public University Workers, Malaysia I. Introduction Upper limb disorders (ULDs) are a subgroup of musculoskeletal disorders and are ailments which have an effect on the neck, shoulders, elbows, hands, and arms [1]. Research conducted in different parts of the world has reported the problem of Upper Limb Disorder among various occupations[2], [4], [5].Almost all activity related to occupation and daily life activity may result in incidences of upper limb disorders in different parts of the body [6], [7]. There are numerous names for the term WRULD such as; work related musculoskeletal disorder (WMSD), Repetitive strain injury (RSI), cumulative trauma disorders (CTD), occupational overuse syndrome (OOS) [5]. Presently, these problems are somewhat common and there are chances that the problems will be even more common and prevalent in the future due to the rising level of computer usage in different occupations [8]. Universiti Putra Malaysia (UPM) which is located in central Peninsular is one of the largest state- owned research universities in Malaysia with a labour force of approximately 7,000 academic and non- academic staff belonging to different areas of specialization in different faculties and institutes [9]. These employees in their different areas of specialization may be exposed to a number of occupational, personal and psycho-social factors which may result in musculoskeletal disorders (MSDs). Associations between awkward posture and ULDs among different occupational groups have constantly been revealed through a number of epidemiological studies [6], [7] also, work-related psychosocial factors such as high workload/demands, lack of job control, low social support, low job satisfaction, and monotonous work with MSDs, and the role of psycho-social factors and stress in these disorders have received increased attention [10], [11], [12], [6], [13]. In Malaysia, astudy conducted among university staff by Siti,(2008) showed that the overall prevalence of MSDs among staff was high (80.4%) [14]. Also, similar results have been achieved in other
Transcript of Prevalence of Upper Limb Disorders and Associated Factors ... · PDF fileFor the investigation...

IOSR Journal of Dental and Medical Sciences (IOSR-JDMS)
e-ISSN: 2279-0853, p-ISSN: 2279-0861.Volume 14, Issue 5 Ver. VII (May. 2015), PP 77-88 www.iosrjournals.org
DOI: 10.9790/0853-14577788 www.iosrjournals.org 77 | Page
Prevalence of Upper Limb Disorders and Associated Factors
with Psychosocial and Awkward Postureamong Public
University Workers in Malaysia
Karwan, Mahmood Khudhir1;*Ahmad Azuhairi, Ariffin
2; Hayati KS
3
1(Department of Occupational Health and Safety, Faculty of Medicine and Health Sciences, Universiti
Putra Malaysia, 43400 UPM Serdang Selangor, Malaysia.
2*(Department of Community Health, Faculty of Medicine and Health Sciences, Universiti Putra Malaysia,
43400 UPM Serdang Selangor, Malaysia
3(Department of Community Health, Faculty of Medicine and Health Sciences, Universiti Putra Malaysia,
43400 UPM Serdang Selangor, Malaysia.
Abstract: Musculoskeletal disorders of the upper limb are a most important cause of ill-health, incapacity
and health care expenditure. The purpose of this study is to determine the prevalence of Upper Limb
Disorders associated with awkward posture and psychosocial factors among Universiti Putra Malaysia
(UPM) workers. Simple random sampling was used to draw 271 participants from six faculties of the
university. The use of a structured question was employed for data collection. Results of the study showed
thatprevalence of ULDs among UPM workers was 67.2% in different body regions. Results showed that there is a significant association between ULDs and age, awkward posture, control at work, psychological
demand, social support, and job satisfaction) (p<0.05). Multivariate logistic analysis showedthat the
workers who had medium and very high RULA risk level were 12.242 times more likely to complain about
ULDs (OR=12.242, 95%CI: 3.617-41.435), compared to other workers who have low RULA risk level.In
conclusion, it can be said from the result of the study that there is high prevalence of upper limb disorders
among UPM workers which is significantly associated with age, awkward posture and all psychosocial
factors. In order to minimize the prevalence rate of upper limb disorders, it is recommended that workers
be educated on prevention strategies and an ergonomic program which emphasizes psycho-social risk
factors and how to improve working conditions.
Keywords: Upper Limb Disorders, Psycho-social Factors, Prevalence, Public University Workers,
Malaysia
I. Introduction Upper limb disorders (ULDs) are a subgroup of musculoskeletal disorders and are ailments which
have an effect on the neck, shoulders, elbows, hands, and arms [1]. Research conducted in different parts
of the world has reported the problem of Upper Limb Disorder among various occupations[2], [4],
[5].Almost all activity related to occupation and daily life activity may result in incidences of upper limb disorders in different parts of the body [6], [7].
There are numerous names for the term WRULD such as; work related musculoskeletal disorder (WMSD),
Repetitive strain injury (RSI), cumulative trauma disorders (CTD), occupational overuse syndrome (OOS)
[5]. Presently, these problems are somewhat common and there are chances that the problems will be even
more common and prevalent in the future due to the rising level of computer usage in different occupations
[8].
Universiti Putra Malaysia (UPM) which is located in central Peninsular is one of the largest state-
owned research universities in Malaysia with a labour force of approximately 7,000 academic and non-academic staff belonging to different areas of specialization in different faculties and institutes [9]. These
employees in their different areas of specialization may be exposed to a number of occupational, personal
and psycho-social factors which may result in musculoskeletal disorders (MSDs).
Associations between awkward posture and ULDs among different occupational groups have
constantly been revealed through a number of epidemiological studies [6], [7] also, work-related
psychosocial factors such as high workload/demands, lack of job control, low social support, low job
satisfaction, and monotonous work with MSDs, and the role of psycho-social factors and stress in these
disorders have received increased attention [10], [11], [12], [6], [13].
In Malaysia, astudy conducted among university staff by Siti,(2008) showed that the overall
prevalence of MSDs among staff was high (80.4%) [14]. Also, similar results have been achieved in other

Prevalence Upper Limb Disordersand Associated Factors with Psychosocial and ….
DOI: 10.9790/0853-14577788 www.iosrjournals.org 78 | Page
studies conducted in different countries. First of all, in Estonia, a study conducted among university office
workers showed the prevalence of MSDs was 80.4% [15]. Moreover, a study which was carried out in
Ghana among commercial minibus driversalso reported that prevalence of MSDs was 78.4%[16].While a reasonable number of researches have revealed that there is an association between office work and
university with MSD symptoms in developed countries, it can be said that there is still limited study with
regard to the prevalence of MSDs amongthe university population in Malaysia, especially the association
betweenpsycho-social factors and ULDs,which has not been widely reported. Based on this fact, this study
focused on Universiti PutraMalaysia workers with the main aim of determining the prevalence of upper
limb disorders among the workers, and to determine if awkward posture and psycho-social factors
contribute to the prevalence of ULDs problems.
II. Material And Methods 2.1Study Location
The study was conducted in Universiti Putra Malaysia which is locatedin central Peninsular Malaysia,
close to the capital city, Kuala Lumpur. This public university has 16 faculties, eight centres, six
institutes, and two postgraduate schools [9].
2.2 Study Design and Study Population
This study employed an analytic cross-sectional design that examined the prevalence of ULDs
among UPM workers, from 2oth May to 1stSeptember2014.Six faculties were selected using simple random
sampling technique.In this study the inclusion criteria was all UPM workers, permanent and temporary
contract workers (who have worked at least ≥12 months in UPM) and no history of upper limb disorders.
Based on Lemeshow et al. (1990) [17] minimum calculated sample size was estimated at 112. After adjusting 20% for non-response and gender (multiplied by 2), the total sample size was 271workers. The
name list of the workers (academic and non-academic) was obtained from the respective faculty websites.
Out of 350 self-administeredquestionnaires, which were distributed among UPM workers, 301of them
agreed to participate giving 86% respondent rate. Non-respondents were those who refused to have the
researcher measure their height and weight (20 workers) and 29 workers who did not agree to fill up the
questionnaire. At the end of the survey, only 271 questionnaires were analysed because 30 respondents
were excluded from the analysis as they did not meet the inclusion criteria of at least12 months on the jobin
UPM and they hada history of upper limb disorders due to injuries.
The formula for the hypothesis testing of two groups that were compared was used(Lemeshow et al., 1990)
[17].
n = 2
2
)21(
)}21(2)11(11)~
1(~
22/1{
PP
PPPPZPPZ
P̃= P1+P2/2
Minimum sample size: n=112
After performing proper calculation and adjusting for non-response with gender, the proper
sample size for doing research was obtained as n =270, six faculties on the basis of lottery technique were
chosen through simple random sampling to select 270 workers from the name list provided.
2.3 Variables
Prevalence ofupper limb disorders in this study was the dependent variable, which means the
presence of pain or discomfort in any part of the upper limb region with neck, shoulders, arms, hands, and
wrists. Socio-demographic characteristics (age, gender, ethnicity, level of education, type of job, income),
with awkward posture and psycho-social factors (including control at work, psychological demand, social
support, job satisfaction) are independent variables of this study.
2.4Study Instrument and Data collection
The self-administered questionnaires were distributed from 2oth May to early September2014 for the
purpose of data collection. The questionnaire comprises three sections containing different items. Section
A: socio-demographic factors,which were used to collect detailed information on the history of all workers
such as age, gender, ethnicity, level of education, type of job, and income. Section B: Upper Limb
Disorders information, which assessed the musculoskeletal problems in some body regions (neck,
shoulders, elbows, hands/ wrists). A modified validated and standardized Nordic questionnaire which was
used by Kuorinkaet al. (1987s) [18]was also used to examine the body parts with musculoskeletal
disorders. Section C: Psycho-social factors were measuredwith the Job Content Questionnaire developed
Prevalence Upper Limb Disordersand Associated Factors with Psychosocial and ….
DOI: 10.9790/0853-14577788 www.iosrjournals.org 79 | Page
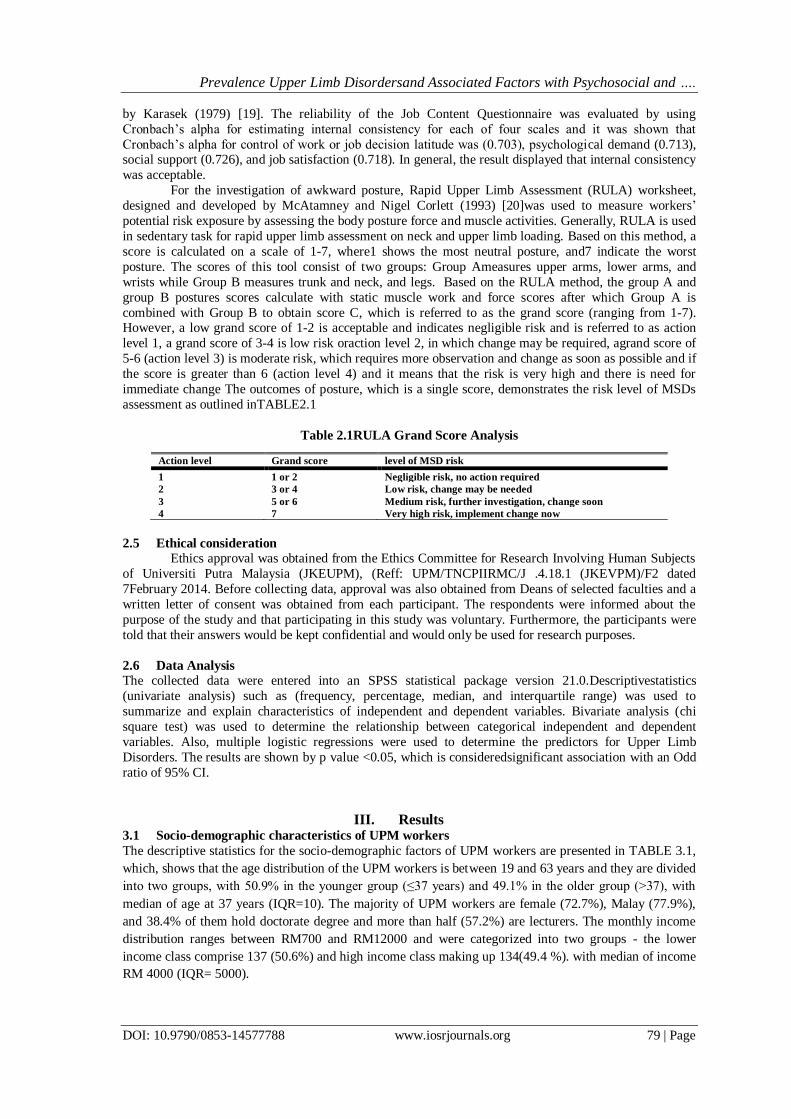
by Karasek (1979) [19]. The reliability of the Job Content Questionnaire was evaluated by using
Cronbach’s alpha for estimating internal consistency for each of four scales and it was shown that
Cronbach’s alpha for control of work or job decision latitude was (0.703), psychological demand (0.713), social support (0.726), and job satisfaction (0.718). In general, the result displayed that internal consistency
was acceptable.
For the investigation of awkward posture, Rapid Upper Limb Assessment (RULA) worksheet,
designed and developed by McAtamney and Nigel Corlett (1993) [20]was used to measure workers’
potential risk exposure by assessing the body posture force and muscle activities. Generally, RULA is used
in sedentary task for rapid upper limb assessment on neck and upper limb loading. Based on this method, a
score is calculated on a scale of 1-7, where1 shows the most neutral posture, and7 indicate the worst
posture. The scores of this tool consist of two groups: Group Ameasures upper arms, lower arms, and
wrists while Group B measures trunk and neck, and legs. Based on the RULA method, the group A and
group B postures scores calculate with static muscle work and force scores after which Group A is
combined with Group B to obtain score C, which is referred to as the grand score (ranging from 1-7). However, a low grand score of 1-2 is acceptable and indicates negligible risk and is referred to as action
level 1, a grand score of 3-4 is low risk oraction level 2, in which change may be required, agrand score of
5-6 (action level 3) is moderate risk, which requires more observation and change as soon as possible and if
the score is greater than 6 (action level 4) and it means that the risk is very high and there is need for
immediate change The outcomes of posture, which is a single score, demonstrates the risk level of MSDs
assessment as outlined inTABLE2.1
Table 2.1RULA Grand Score Analysis
2.5 Ethical consideration Ethics approval was obtained from the Ethics Committee for Research Involving Human Subjects
of Universiti Putra Malaysia (JKEUPM), (Reff: UPM/TNCPIIRMC/J .4.18.1 (JKEVPM)/F2 dated
7February 2014. Before collecting data, approval was also obtained from Deans of selected faculties and a
written letter of consent was obtained from each participant. The respondents were informed about the
purpose of the study and that participating in this study was voluntary. Furthermore, the participants were
told that their answers would be kept confidential and would only be used for research purposes.
2.6 Data Analysis
The collected data were entered into an SPSS statistical package version 21.0.Descriptivestatistics
(univariate analysis) such as (frequency, percentage, median, and interquartile range) was used to
summarize and explain characteristics of independent and dependent variables. Bivariate analysis (chi
square test) was used to determine the relationship between categorical independent and dependent
variables. Also, multiple logistic regressions were used to determine the predictors for Upper Limb
Disorders. The results are shown by p value <0.05, which is consideredsignificant association with an Odd
ratio of 95% CI.
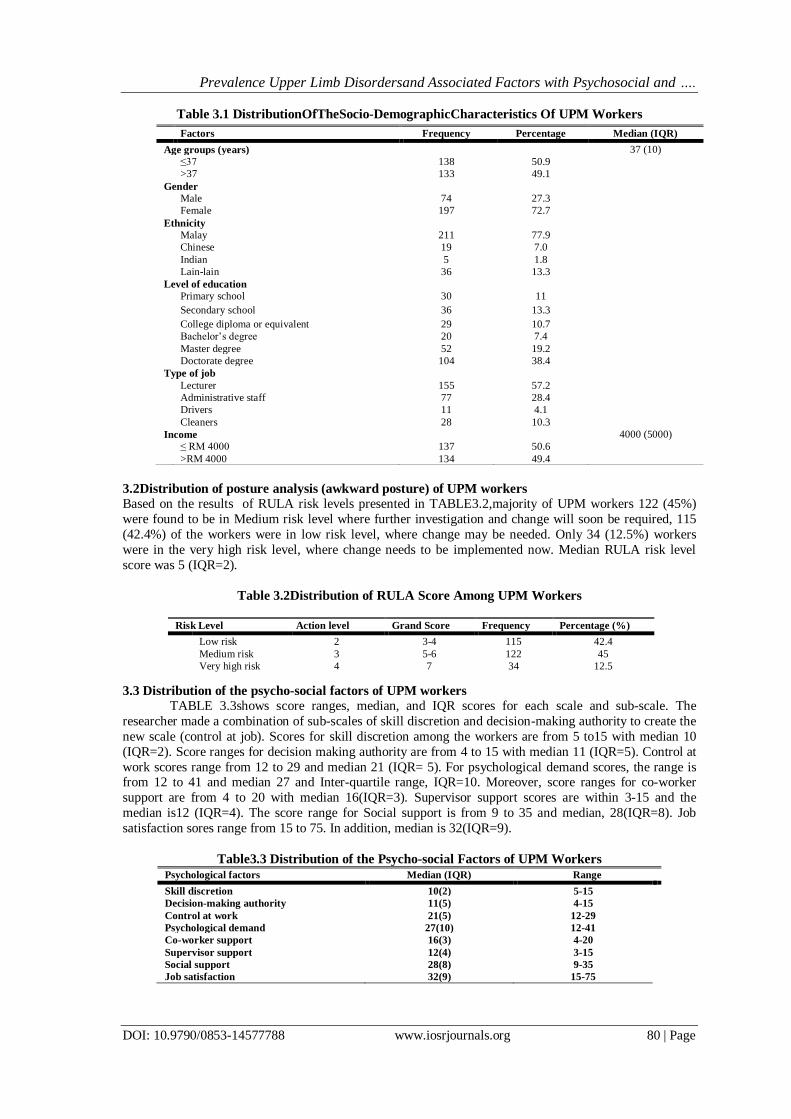
III. Results 3.1 Socio-demographic characteristics of UPM workers
The descriptive statistics for the socio-demographic factors of UPM workers are presented in TABLE 3.1,
which, shows that the age distribution of the UPM workers is between 19 and 63 years and they are divided
into two groups, with 50.9% in the younger group (≤37 years) and 49.1% in the older group (>37), with
median of age at 37 years (IQR=10). The majority of UPM workers are female (72.7%), Malay (77.9%),
and 38.4% of them hold doctorate degree and more than half (57.2%) are lecturers. The monthly income
distribution ranges between RM700 and RM12000 and were categorized into two groups - the lower
income class comprise 137 (50.6%) and high income class making up 134(49.4 %). with median of income
RM 4000 (IQR= 5000).
Action level Grand score level of MSD risk
1 1 or 2 Negligible risk, no action required
2 3 or 4 Low risk, change may be needed
3 5 or 6 Medium risk, further investigation, change soon
4 7 Very high risk, implement change now
Prevalence Upper Limb Disordersand Associated Factors with Psychosocial and ….
DOI: 10.9790/0853-14577788 www.iosrjournals.org 80 | Page
Table 3.1 DistributionOfTheSocio-DemographicCharacteristics Of UPM Workers
3.2Distribution of posture analysis (awkward posture) of UPM workers
Based on the results of RULA risk levels presented in TABLE3.2,majority of UPM workers 122 (45%)
were found to be in Medium risk level where further investigation and change will soon be required, 115
(42.4%) of the workers were in low risk level, where change may be needed. Only 34 (12.5%) workers
were in the very high risk level, where change needs to be implemented now. Median RULA risk level
score was 5 (IQR=2).
Table 3.2Distribution of RULA Score Among UPM Workers
3.3 Distribution of the psycho-social factors of UPM workers
TABLE 3.3shows score ranges, median, and IQR scores for each scale and sub-scale. The
researcher made a combination of sub-scales of skill discretion and decision-making authority to create the
new scale (control at job). Scores for skill discretion among the workers are from 5 to15 with median 10
(IQR=2). Score ranges for decision making authority are from 4 to 15 with median 11 (IQR=5). Control at
work scores range from 12 to 29 and median 21 (IQR= 5). For psychological demand scores, the range is from 12 to 41 and median 27 and Inter-quartile range, IQR=10. Moreover, score ranges for co-worker
support are from 4 to 20 with median 16(IQR=3). Supervisor support scores are within 3-15 and the
median is12 (IQR=4). The score range for Social support is from 9 to 35 and median, 28(IQR=8). Job
satisfaction sores range from 15 to 75. In addition, median is 32(IQR=9).
Table3.3 Distribution of the Psycho-social Factors of UPM Workers
Psychological factors Median (IQR) Range
Skill discretion 10(2) 5-15
Decision-making authority 11(5) 4-15
Control at work 21(5) 12-29
Psychological demand 27(10) 12-41
Co-worker support 16(3) 4-20
Supervisor support 12(4) 3-15
Social support 28(8) 9-35
Job satisfaction 32(9) 15-75
Factors Frequency Percentage Median (IQR)
Age groups (years) 37 (10)
≤37 138 50.9
>37 133 49.1
Gender
Male 74 27.3
Female 197 72.7
Ethnicity
Malay 211 77.9
Chinese 19 7.0
Indian 5 1.8
Lain-lain 36 13.3
Level of education
Primary school 30 11
Secondary school 36 13.3
College diploma or equivalent 29 10.7
Bachelor’s degree 20 7.4
Master degree 52 19.2
Doctorate degree 104 38.4
Type of job
Lecturer 155 57.2
Administrative staff 77 28.4
Drivers 11 4.1
Cleaners 28 10.3
Income 4000 (5000)
≤ RM 4000 137 50.6
>RM 4000 134 49.4
Risk Level Action level Grand Score Frequency Percentage (%)
Low risk 2 3-4 115 42.4
Medium risk 3 5-6 122 45
Very high risk 4 7 34 12.5

Prevalence Upper Limb Disordersand Associated Factors with Psychosocial and ….
DOI: 10.9790/0853-14577788 www.iosrjournals.org 81 | Page
TABLE 3.4shows that the scores of control at work, psychological demand, social support and job
satisfaction are dichotomized into two groups to make two level variables (low and high). Based on the cut-
off-median point, the majority of UPM workers (154 or 57%) experience low job control while 117 (43%) of them have high control of job,119 (44%) of the workers havelow psychological demand and 152 (56%)
of them have high psychological demand. Also, 151 (55.7%) of the UPM workers experience and low
social support while 120 (44.3%) had high social support. 151 (55.7%) of them experienced low job
satisfaction while 120 (44.3%) have high job satisfaction.
Table 3.4Distribution of the Psycho-social Factors of UPM Workers
Psychological factors LowN (%) High N (%) Total
Control at work 154 (57) 117 (43) 271
Psychological demand 119 (44) 152 (56) 271
Social support 151 (55.7) 120 (44.3) 271
Job satisfaction 151(55.7) 120 (44.3) 271
3.4Prevalence of Upper Limb Disorders
Based on TABLE 3.5 the overall self-reported 12-month prevalence of ULDs among UPM
workers, is 182 (67.2%), and 89(32.8%) UPM workers donot complain of having any upper limb disorders.
Table 3.5 Prevalence of General Upper Limb Disorders of UPM Workers (N=271)
3.5 Prevalence of Upper Limb Disorders according to type of Job
TABLE 3.6 shows the prevalence of ULDs among different respondent groups, and the highest
prevalence of ULDs is shown to be among cleaners (78.6%), followed by lecturers (70%), drivers (63.6%)
and administration staff (58%).
Table 3.6 Prevalence of Upper Limb Disorders According to Type of Job
Job title Upper Limb Disorders Total
No Yes
lecturer 47(30%) 108(70%) 155(100%)
Administration staff 32(42%) 45(58%) 77(100%)
Drivers 4(36.4%) 7(63.6%) 11(100%)
Cleaners 6(21.4%) 22(78.6%) 28(100%)
Total 89(32.8%) 182(67.2%) 271(100%)
3.6 Prevalence of ULDs in different body regions
TABLE 3.7 presents the prevalence of ULDs in different upper body regions; neck showing the
highest prevalence of upper limb disorders(54.2%) for the last 12 months among UPM workers, followed
respectively by shoulders (47.2%), wrists/hands (28.1%) and elbows (13%). Further analysis also show that
neck has the highest prevalence of upper limb disorders for the last 12 months that prevented workers from
doing their normal work (31%), followed respectively by shoulders (29.9%), wrists/hands (20.3%), and
elbows (10%). Finally, analysis regarding the question “having trouble at any time during past 7 days”, the
highest rate is for neck pain (17.3%), shoulder pain (16.2%), hand/wrist pain (13.7%) while elbow pain has
the lowest rate of having trouble at 7 days, with only (5.9%).
Table 3.7 Prevalence of ULDs in Different Body Regions (N= 271)
Body regions Any trouble last 12 months Prevented from doing normal work Trouble last 7 days
No. (%) No. (%) No. (%)
Neck 147 (54.2) 84 (31) 47 (17.3) Shoulders 128 (47.2) 81 (29.9) 44 (16.2)
Elbows 35 (13) 27 (10) 16 (5.9) Wrists/
Hands
76 (28.1) 55 (20.3) 37 (13.7)
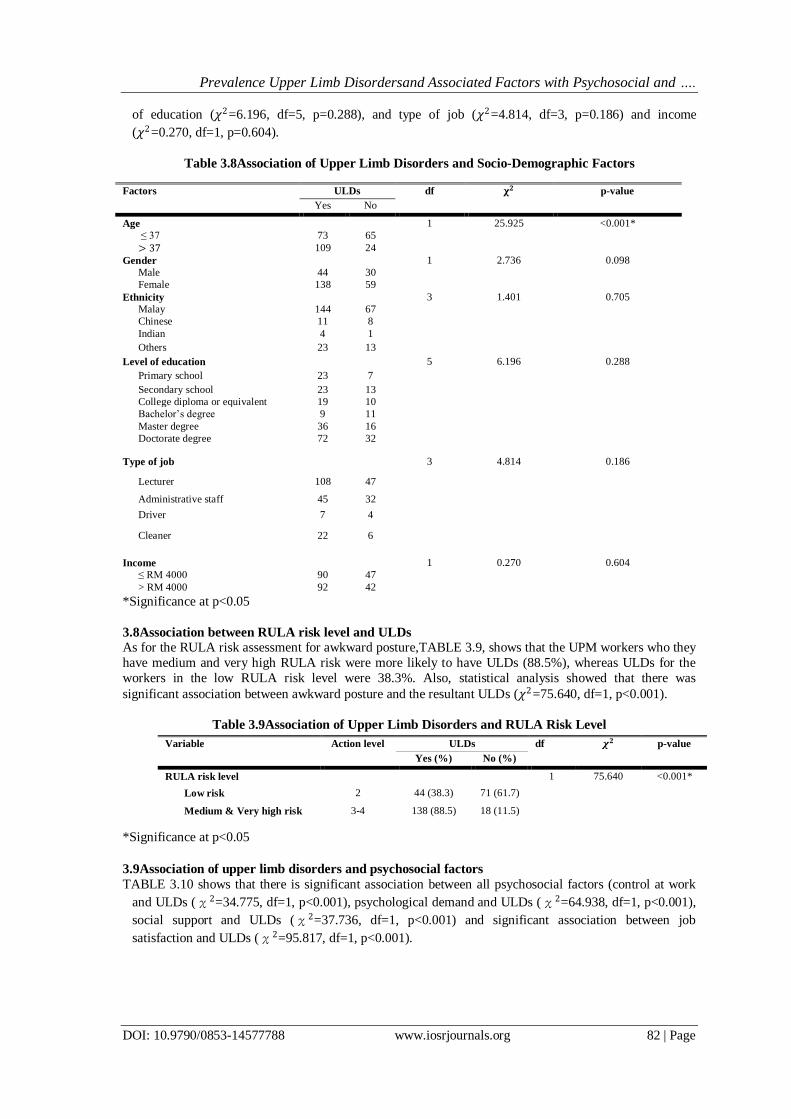
3.7 Association of Upper Limb Disorders and Socio-Demographic Characteristics
TABLE3.8 shows that there are significant associations between age and upper limb disorders
(χ2=25.925, df=1, p< 0.001). However, there are no significant associations shown by chi square (p
value) between ULDs with gender (𝜒2=2.736, df=1, p=0.098), ethnicity (𝜒2=1.401, df=3, p=0.705), level
Upper Limb Disorders Frequency Percentage (%)
1 Yes 182 67.2
No 89 32.8 Total 271 100
Prevalence Upper Limb Disordersand Associated Factors with Psychosocial and ….
DOI: 10.9790/0853-14577788 www.iosrjournals.org 82 | Page
of education (𝜒2=6.196, df=5, p=0.288), and type of job (𝜒2=4.814, df=3, p=0.186) and income
(𝜒2=0.270, df=1, p=0.604).
Table 3.8Association of Upper Limb Disorders and Socio-Demographic Factors
*Significance at p<0.05
3.8Association between RULA risk level and ULDs
As for the RULA risk assessment for awkward posture,TABLE 3.9, shows that the UPM workers who they
have medium and very high RULA risk were more likely to have ULDs (88.5%), whereas ULDs for the
workers in the low RULA risk level were 38.3%. Also, statistical analysis showed that there was
significant association between awkward posture and the resultant ULDs (𝜒2=75.640, df=1, p<0.001).
Table 3.9Association of Upper Limb Disorders and RULA Risk Level
*Significance at p<0.05
3.9Association of upper limb disorders and psychosocial factors
TABLE 3.10 shows that there is significant association between all psychosocial factors (control at work
and ULDs (χ2=34.775, df=1, p<0.001), psychological demand and ULDs (χ2=64.938, df=1, p<0.001),
social support and ULDs (χ2=37.736, df=1, p<0.001) and significant association between job
satisfaction and ULDs (χ2=95.817, df=1, p<0.001).
Factors ULDs df 𝛘𝟐 p-value
Yes No
Age 1 25.925 <0.001*
≤ 37 73 65
> 37 109 24
Gender 1 2.736 0.098
Male 44 30
Female 138 59
Ethnicity 3 1.401 0.705
Malay 144 67
Chinese 11 8
Indian 4 1
Others 23 13
Level of education 5 6.196 0.288
Primary school 23 7
Secondary school 23 13
College diploma or equivalent 19 10
Bachelor’s degree 9 11
Master degree 36 16
Doctorate degree 72 32
Type of job 3 4.814 0.186
Lecturer 108 47
Administrative staff 45 32
Driver 7 4
Cleaner 22 6
Income 1 0.270 0.604
≤ RM 4000 90 47
> RM 4000 92 42
Variable Action level ULDs df 𝝌𝟐 p-value
Yes (%) No (%)
RULA risk level 1 75.640 <0.001*
Low risk 2 44 (38.3) 71 (61.7)
Medium & Very high risk 3-4
138 (88.5) 18 (11.5)

Prevalence Upper Limb Disordersand Associated Factors with Psychosocial and ….
DOI: 10.9790/0853-14577788 www.iosrjournals.org 83 | Page
Table 3.10Association of Upper Limb Disorders and Psycho-social Factors
Psychosocial Factors ULDs df 𝝌𝟐 p-value
Yes No
Control at work or Job decision latitude 1 34.775 <0.001*
Low 126 28
High 56 61
Psychological demand 1 64.938 <0.001*
Low 49 70
High 133 19
Social support 1 37.736 <0.001*
Low 125 26
High 63 57
Job satisfaction 1 95.817 <0.001*
Low 139 12
High 43 77
*Significance at p<0.05
3.10Multivariate logistics
Based on TABLE 3.11Multivariate logistic regression is used to determine to what extent independentvariables affectupper limb disorders, and the process includes completely independent
variables which were earlier shown to be significant in chi square test (p<0.05). From the result of Hosmer-
Lemeshow test we can see that the goodness of fitness is satisfactory (𝜒2=15.143, df=8, p= 0.05). The results show that the workers who had medium and very high RULA risk level were 12.242 times more
likely to complain about ULDs (OR=12.242, 95%CI: 3.617-41.435), compared to other workers who have
low RULA risk level.
𝐿𝑜𝑔𝑌 = −4.682 + 2.505 (𝑋1) + 𝜀
where:Y = ULD symptom, X1= medium and very high RULA risk level, 𝜀= Error
The Negelkerke R2 showed that about 82.5% of the variation of ULD was explained by the predictor
variables entered into the regression model.
Table3.11MultipleLogistic Regressions of Predictors of Upper Limb Disorders
Variables Β S.E Sig. Adjusted OR 95% CI
Age
≤37 - - - 1 -
>37 0.469 0.655 0.474 1.599 0.443, 5.776
RULA risk level
Low risk - - - 1 -
Medium risk & very high risk 2.505 0.622 <0.001* 12.242 3.617,41.435
Control at job
Low 0.426 0.590 0.470 1.532 0.482, 4.868
High - - - 1 -
Psychological demand
Low - - - 1 -
High -0.217 0.669 0.746 0.805 0.217, 2.990
Social support
Low 0.375 0.591 0.526 1.455 0.457, 4.637
High - - - 1 -
Job satisfaction
Low 1.186 .659 0.072 3.275 0.900, 11.911
High - - - 1 -
Constant -4.682 1.069 0.001 0.009
S.E= standard error, *Significant at p< 0.05, OR= Odd ratio, CI= Confidence Interval
IV. Discussion This study reveals that that the prevalence of ULDs is 67.2% among UPM workers. The findings
of this study also show that the prevalence of ULDs among UPM workers is close to that of other previous
findings which reported 65%, [21] but also a bit higher compared to other study findings, which reported
55%, [22]and lower compared to other study findings on a similar population [7], [15], [16]. Age is seen to
have an association with ULDs. The results of this study are consistent with most of the previous
researches done [10], [23], [24], [25], [26].Moreover, this study shows that the prevalence of ULDs
Prevalence Upper Limb Disordersand Associated Factors with Psychosocial and ….
DOI: 10.9790/0853-14577788 www.iosrjournals.org 84 | Page
is(82%) andmuch higher among the older group workers when compared to younger age group workers
(53%). A number of factors may account for the increase in ULD prevalence among older group workers
compared to the younger group. Some of these factors may be biological in nature due to the ageing process such as, degenerative changes that occur in muscles, tendons, ligaments, nerves, and joints.
Therefore, the best approach to preventing and reducing the risk of ULDs among ageing workers is to
organize programs that promote exercising and training in ergonomics.
Even though the findings of the study show that there is no association between gender and ULDs,
the prevalence of ULDs is higher among female workers than male workers (70.1 % vs 59.5%
respectively). This study result concurs with previous research findings [3], [10], [27]. This prevalence in
women canbe explained by the fact that employed women are being exposed to different cumulative risk
factors at work and at home due to the nature of domestic chores performed by women [29]. Another
possible reason why women are more prone to ULDs could be the sex-linked biological features such as
anatomy, physiology or even hormones which are different from those of men. In a case where this
assumption happens to be true, the same workloads experienced by both genders can result in much biophysical strain more among women than their male counterparts. Another factor which may be
responsible for the prevalence of ULDs in women could be the level of sensitivity to pain [30]. More so,
other factors which could cause the prevalence of ULDs among women could be psycho-social factors
such as lack of social support, job dissatisfaction, and family issues.
This study comprisedfound that 211(77.9%) of the respondents were Malay. However, results of
chi square test (p value) showed that there is no significant association between ULDs with ethnicity
(p>0.05). This findingsupports a study conducted among office workers, nurses and caregivers in Estonia,
by Merisalu et al. (2011) that reported no correlation between ethnicity and ULDs [31],while, findings of
other researchers showed significant association between ethnicity and ULDs. [32], [33].
The result showed that the majority of the UPM workers are, Masters and Doctorate degree
holders (57.6%). However, there is no significant association found between ULDs and level of education.
This finding conforms with the findings of a study conducted by Siti(2008) among UPM staff whichindicated that there is no significant association between MSDs and level of education of the
workers[14]. Also, a study carried out among newspaper office workers showed that there was no
significant association between MSDs and level of education [34]. In contrast to the finding of this study,
some previous studies showed that there is a significant association between ULDs and level of education
[35], [36], [37], [26], [28], [38].
Findings of this study also revealed that more than half of the UPM workers (57.2%) are lecturers.
The highest prevalence of ULDs is among cleaners (78.6%), followed by lecturers (70%), drivers (63.6%)
and administrative staff (58%). However, chi square statistical analysis (p value) showed that there is no
significant association between ULDs and type of job (p> 0.05). In contrast to this finding, some
researchers showed that there is significant association between ULDs and type of job[39], [40].This may
be explained by the fact that cleaners might not pay much attention to the discomfort of their body parts, have little information on how to protect themselves and also the fact that they do more manual work with
little or no comfort at awkward positions which may increase their risk of having ULDs in the long term.
This study found that 50.6 % of the respondents had income ≤RM 4000, and 49.4% of
respondent’s monthly income was >RM 4000. The findings of this study showed that there were not
significant associations between ULDs and income. Similar findings have been demonstrated by Darwish
and Al-Zuhair (2013) reported that there was no significant association between monthly income and
MSDs among female secondary school teachers in Saudi Arabia [41]. On the other hand, some studies
found that there were significant association between income and MSDs. One such study was conducted by
Kortt and Baldry (2002) among the Australian population and reported that there was significant
association between MSDs and income [40]. More so, Siti (2008) conducted a study among hospital nurses
in Malaysia and found a significant association exists between MSDs in shoulders and monthly income
[14]. Assessment of the rapid upper limb is used to assess the risk of posture and shows the risk level of
MSDs, revealing that about 45% of the UPM workersare in medium risk level (action level 3).
Meanwhile,none of the workers have acceptable posture (action level one).Chi square test (p value)
indicatessignificant association between RULA risk level and the resultant ULDs obtained from SNQ
(χ2=75.640, df=1, p<0.001). The prevalence of ULDsamong workers who are in a low RULA risk level is 38.3%, whereas ULDs among the workers in medium and very high RULA risk are at 88.5%. The result of
this study is similar toprevious research findings, whichfound that none of the workstations in negligible
risk (action level 1) and they reported significant association between MSDs and RULA risk level[36][42]
[43]. A possible explanation may be due to the fact that, muscles do not work well when placed in
awkward postures. Working with various parts of the body (e.g., joints, limbs, back) in bent, extended or
Prevalence Upper Limb Disordersand Associated Factors with Psychosocial and ….
DOI: 10.9790/0853-14577788 www.iosrjournals.org 85 | Page
flexed positions rather than in a straight or neutral position involves awkward positions that increase the
exertion and muscle force which an employee needs to apply in order to complete a task. When the
muscles are stressed it leads to compression of tendons, nerves and blood vessels, therefore, reducing the supply of blood to the muscles tendons and then causing ULDs.
This study result reveals that based on the median score as cut-off point, the majority of UPM
workers 154 (57 %) experience low jobcontrol. Control at work is significantly associated with ULDs, and
similar findings have been demonstrated in previous studies [10], [6], [44],[30]. In contrast, Kim et al.
(2013), conducted a study among male fire-fighters in Korea. They reported that there was no significant
association between MSDs and insufficient job control [45].
The current study also revealed that most of the UPM workers havehigh psychological demand
(152 or 56%). The result of this study shows that a significant association exists between ULDs and
psychological demand. Corroborating earlier results, those workers with high psychological demand are at
higher risk of MSDs and probably suffer multiple site pains[46], [10], [45], [30]. In addition, this study
reveals that the majority of the UPM workers (151 or 55.7%) experience low social support. The study result shows that by p value < 0.05 the level is significant, and there is a significant association between
ULDs and social support. This finding is consistent with previous research results [6], [57].
The findings of this study show that 151or 55.7% of UPM workers experience low jobsatisfaction.
Chi square test (p value) proved that there is a significant association between ULDs and job satisfaction.
The results of this study corroborate the previous findings by Woods (2005) [13]while conversely, studies
conducted by El-Bestar et al.(2011), Sim et al.(2006) found that there is no significant association between
job satisfaction and ULDs (p value > 0.05). [48], [6]. Possible clarification for this could be the fact that
psycho-social factors related to work can lead to stress. Stress may increase the tone in muscles causing
them to become fatigued, or it may increase the period of muscle activity and decrease the chance for
recovery. When workers are stressed, they experience more muscle contractions than normal and therefore
the muscles cannot relax completely. Also, stress may increase the perception of pain, or undermine the
mechanisms used to cope with pain. Seen from a more pathophysiological perspective, stress may, apart from increasing muscle activity, impair circulation and the supply of oxygen to tissues as a result of
hyperventilation. Moreover, prolonged stress may degrade tissue quality and the ability of tissues to
recover due to hormonal processes [49].
V. Conclusion Upper limb disorders (ULDs) were found to be prevalent among university workers;neck and shoulders
havethe highest prevalence rateamong the body parts covered by the study. Among factors covered by the
study, there is no association between gender, ethnicity, level of education, type of job, income and
ULDs.Furthermore, chi square test (p value) shows that there is significant association between age, awkward posture and all psycho-social factors (control at work, psychological demand, social support, and
job satisfaction) and ULDs among UPM workers. In the same vein, this study reveals that the majority of
the workers have medium and very high RULA risk levels that are significantly associated with ULDs.
Multiple logistic regressions show that RULA risk level is the main risk factors responsible for ULDs
among UPM workers.
5.1Limitations
A number of limitations were encountered in this study. Self-reporting questionnaire to collect data and
recall bias can be considered as limitations. Also, the information collected from this study merely
depended on the questionnaire and observational method without any use of medical diagnosis, so workers’
responses may be biased as a result of social desirability to provide sociably favoured answers rather than the real experience.
5.2 Recommendations
According to the results of this study, psychosocial factors such as decision making, feelings of alienation
and job dissatisfaction have a tangible effect on ULDs. Thus, there is need for an awareness to be created
among workers through several strategic prevention programs and campaigns focused on psycho-social
risk factors and improvements of work conditions targeted at minimizing the risk of ULDs complaints
among workers. Social support should be improved through activities such as team building, recreational
activities, peer group activities and other activities. Additionally, the following engineering and
administrative improvements are needed to reduce the risk of ULDs among UPM workers:
These include:
Prevalence Upper Limb Disordersand Associated Factors with Psychosocial and ….
DOI: 10.9790/0853-14577788 www.iosrjournals.org 86 | Page
1. Engineering improvement
(a) For cleaners, the cleaning equipment should have an acceptable weight, a suitable height and
should be easy to use by cleaners (may be moving cleaning tools and products by using carts from one place to another) in order to reduce the musculoskeletal load.
(b) Provide appropriate workstations, which should be designed to fit different workers, because
every worker’s body type varies. Therefore, ergonomic workstations should be designed for
workers to ensure that they enjoy the best working positions and environment. Additionally, an
ergonomic workstation should be designed in such a way that it allows the user to have a neutral
position on their shoulder or upper limbs. Different workstations should also be made to fit
different types of jobs according to the need so as to promote occupational safety and health.
2. Administrative improvements
(a) Training courses on the Proper usage of VDU, proper work posture and information about risks to
psychological health during work period should be provided. (b) Suitable work schedules that provide the workers a proper time to rest should be provided.
(c) Provide and maintain high work conditions for workers so that they feel comfortable (faraway
from fear of making mistakes, ability to make decisions, how to perform their work, not do extra
work).
Acknowledgements First of all, I would like to start by sincerely expressing my gratitude to Allah Almighty for His
great blessings and for giving me the opportunity, willpower and strength to complete my study. Next, my
sincere gratitude goes to the chairman of my advisory committee,Dr. Ahmad Azuhairi Ariffin, for his immense encouragement, advice, support and constructive criticism from the beginning of this research to
the end. Apart from being a great supervisor, he is a man of principle with wide general Knowledge of
research and in his field of specialization. I count it a privilege to be taught by such a man who understands
the power of education to positively change peoples’ lives. Also I would like to express my sincere
appreciation to my co-supervisor, Dr. Hayati Binti Kadir, for her suggestions and valuable contributions.
Her constructive notes and comments were helpful and motivating to me. Finally, I would like to thank my
parents and friends for their unending moral support, inspiration and understanding. Thus, acknowledging
them will be the least of what I can do to show my gratitude. I am also grateful to the Medical Research
Ethics Committee and UPM for allowing me to conduct this research and special thanks to all workers who
agreed to participate in this study. May God bless you all.
References [1]. Leah, C. (2011). Exercises to reduce musculoskeletal discomfort for people doing a range of static and repetitive
work. Norwich, England: HSE Books.
[2]. Bernaards, C. M., Ariëns, G. A., Simons, M., Knol, D. L., & Hildebrandt, V. H. (2008). Improving work style
behavior in computer workers with neck and upper limb symptoms. Journal of Occupational Rehabilitation, 18(1),
87-101.
[3]. HSE (2013) Musculoskeletal Disorders in Great Britian 2013. Health and Safety Executive, Great Britian.Retrived
(2014-12-10) from:http://www.hse.gov.uk/statistics/causdis/musculoskeletal/msd.pdf
[4]. Borle, A., Gunjal, S., Jadhao, A., Ughade, S., &Humne, A. (2012). Musculoskeletal morbidities among bus drivers
in city of Central India. Age (Years), 46(06.69), 28-57.
[5]. Yassi, A. (1997). Repetitive strain injuries. The Lancet, 349(9056), 943-947.
[6]. Sim, J., Lacey, R. J., & Lewis, M. (2006). The impact of workplace risk factors on the occurrence of neck and upper
limb pain: a general population study. BMC Public Health, 6(1), 234.
[7]. Tamrin, S. B. M., Yokoyama, K., Aziz, N., & Maeda, S. (2012). Association of risk factors with musculoskeletal
disorders among male commercial bus drivers in Malaysia. Human Factors and Ergonomics in Manufacturing &
Service Industries.
[8]. Marmot, M., & Wilkinson, R. (Eds.). (2005). Social determinants of health.Oxford University Press.
[9]. UPM: UPM Portal, UPM website, Retrived (2014-11-18,) from http://www.upm.edu.my/?LANG=en
[10]. Alexopoulos, E. C., Stathi, I.-C., &Charizani, F. (2004). Prevalence of musculoskeletal disorders in dentists.BMC
Musculoskeletal Disorders, 5,16.
[11]. van den Heuvel, S. G., van der Beek, A. J., Blatter, B. M., Hoogendoorn, W. E., & Bongers, P. M. (2005).
Psychosocial work characteristics in relation to neck and upper limb symptoms. Pain, 114(1), 47-53.
[12]. Park, J. K., & Jang, S. H. (2010). Association between Upper Extremity Musculoskeletal Disorders and Psychosocial
Factors at Work: A Review on the Job DCS Model's Perspective. Safety and Health at Work, 1(1), 37-42.
[13]. Woods, V. (2005). Musculoskeletal disorders and visual strain in intensive data processing workers. Occupational
Medicine, 55(2), 121-127.
[14]. Siti, F, Across sectional study on the prevalence of work-related musculoskeletal disorders and associated risk
factors among UPM faculty staffs of UPM, Degree Thesis., University Putra Malaysia, 2008.
Prevalence Upper Limb Disordersand Associated Factors with Psychosocial and ….
DOI: 10.9790/0853-14577788 www.iosrjournals.org 87 | Page
[15]. Oha, K., Viljasoo, V., &Merisalu, E. (2010). Prevalence of musculoskeletal disorders, assessment of parameters of
muscle tone and health status among office workers. In Agronomy Research (Vol. 8, No. Special 1, pp. 192-200).
Estonian Research Institute of Agriculture.
[16]. Abledu, J. K., Offei, E. B., & Abledu, G. K. (2014). Predictors of Work-Related Musculoskeletal Disorders among
Commercial Minibus Drivers in Accra Metropolis, Ghana. Advances in Epidemiology, 2014.
[17]. Lemeshow, S., Hosmer, D. W., Klar, J., Lwanga, S. K., & World Health Organization. (1990). Adequacy of sample
size in healthstudies.
[18]. Kuorinka, I., Jonsson, B., Kilbom, A., Vinterberg, H., Biering-Sørensen, F., Andersson, G., &Jørgensen, K.
(1987).StandardisedNordic questionnaires for the analysis of musculoskeletal symptoms. Applied
Ergonomics, 18(3), 233-237.
[19]. Karasek Jr, R. A. (1979). Job demands, job decision latitude, and mental strain: Implications for job
redesign. Administrative Science Quarterly, 285-308.
[20]. McAtamney, L., & Nigel Corlett, E. (1993). RULA: a survey method for the investigation of work-related upper
limb disorders. Applied Ergonomics, 24(2), 91-99.
[21]. Pandy, R. (2013). Prevalence of upper limb disorders among female librarians. Occupational Medicine, kqt080
[22]. Cardoso, J. P., Ribeiro, I. D. Q. B., Araújo, T. M. D., Carvalho, F. M., & Reis, E. J. F. B. D. (2009). Prevalence of
musculoskeletal pain among teachers. RevistaBrasileira de Epidemiologia, 12(4), 604-614.
[23]. Antonopoulou, M. D., Alegakis, A. K., Hadjipavlou, A. G., & Lionis, C. D. (2009). Studying the association
between musculoskeletal disorders, quality of life and mental health. A primary care pilot study in rural Crete,
Greece. BMCMusculoskeletal Disorders, 10(1), 143.
[24]. Cagnie, B., Danneels, L., Van Tiggelen, D., De Loose, V., & Cambier, D. (2007). Individual and work related risk
factors for neck pain among office workers: a cross sectional study. European Spine Journal, 16(5), 679-686.
[25]. Lee, J. W., Lee, J. J., Mun, H. J., Lee, K. J., & Kim, J. J. (2013). The Relationship between Musculoskeletal
Symptoms and Work-related Risk Factors in Hotel Workers. Annals of Occupational and Environmental
Medicine,25(1), 20.
[26]. Guo, H. R., Chang, Y. C., Yeh, W. Y., Chen, C. W., & Guo, Y. L. (2004). Prevalence of musculoskeletal disorder
among workersin Taiwan: a nationwide study. Journal of occupational health, 46(1), 26-36.
[27]. Janwantanakul, P., Pensri, P., Jiamjarasrangsri, V., & Sinsongsook, T. (2008). Prevalence of self-reported
musculoskeletal symptoms among office workers.Occupational Medicine, 58(6), 436-438.
[28]. Yue, P., Liu, F., & Li, L. (2012). Neck/shoulder pain and low back pain among school teachers in China, prevalence
and risk factors. BMC public health, 12(1), 789.
[29]. Strazdins, L., & Bammer, G. (2004). Women, work and musculoskeletal health.Social Science & Medicine 58
(2004) 997–1005
[30]. Choi, K., Park, J. H., & Cheong, H. K. (2013). Prevalence of musculoskeletal symptoms related with activities of
daily living and contributing factors in Korean adults. Journal of Preventive Medicine and Public Health, 46(1), 39-
49.
[31]. Merisalu, E., Oha, K., Freimann, T., & Sirk, T. (2011). Prevalence of musculoskeletal disorders among office
workers, nurses and caregivers in Estonia. Occupational and Environmental Medicine, 68(Suppl 1), A70-A70.
[32]. Amin, N. A., Nordin, R., Fatt, Q. K., Noah, R. M., & Oxley, J. (2014). Relationship between Psychosocial Risk
Factors and Work-Related Musculoskeletal Disorders among Public Hospital Nurses in Malaysia. Annals of
Occupational and EnvironmentalMedicine, 26(1), 23.
[33]. Raanaas, R. K., & Anderson, D. (2008). A questionnaire survey of Norwegian taxi drivers’ musculoskeletal health,
and work-related risk factors. International Journal of Industrial Ergonomics, 38(3), 280-290.
[34]. Ortiz-Hernández, L., Tamez-González, S., Martı́nez-Alcántara, S., & Méndez-Ramı́rez , I. (2003). Computer use
increases the risk of musculoskeletal disorders among newspaper office workers. Archives of Medical
Research,34(4), 331-342.
[35]. Mahmud, N., Kenny, D. T., Zein, R. M., & Hassan, S. N. (2011). Ergonomic training reduces musculoskeletal
disorders among office workers: results from the 6-month follow-up. The Malaysian Journal of Medical Sciences:
MJMS,18(2), 16.
[36]. Choobineh, A., Tabatabaei, S. H., Tozihian, M., & Ghadami, F. (2007). Musculoskeletal problems among workers of
an Iranian communication company. Indian journal of occupational and environmental medicine, 11(1), 32.
[37]. Öztürk, N., & Esin, M. N. (2011). Investigation of musculoskeletal symptoms and ergonomic risk factors among
female sewing machine operators in Turkey.International Journal of Industrial Ergonomics, 41(6), 585-591.
[38]. Östergren, P. O., Hanson, B. S., Balogh, I., Ektor-Andersen, J., Isacsson, A., Örbaek, P., ...& Isacsson, S. O. (2005).
Incidence of shoulder and neck pain in a working population: effect modification between mechanical and
psychosocial exposures at work? Results from a one year follow up of the Malmö shoulder and neck study
cohort. Journal of Epidemiology and CommunityHealth, 59(9), 721-728.
[39]. Rahman, Z. A., & Atiya, A. S. (2009). Prevalence of work-related upper limbs symptoms (WRULS) among office
workers. Asia-Pacific Journal of Public Health, 21(3), 252-258.
[40]. Kortt, M., & Baldry, J. (2002). The association between musculoskeletal disorders and obesity. Australian Health
Review, 25(6), 207-214.
[41]. Darwish, M. A., & Al-Zuhair, S. Z. (2013). Musculoskeletal Pain Disorders among Secondary School Saudi Female
Teachers.Pain Research and Treatment, 2013.
[42]. Mansor, C., Hazwani, C., Zakaria, S. E., & Dawal, S. Z. M. (2013, December). Investigation on Working Postures
and Musculoskeletal Disorders among Office Workers in Putrajaya.In Advanced Engineering Forum (Vol. 10, pp.
308-312).
[43]. Shamsul Bahri, M. T., Muhammad Aahar, M. N., Mohd Rafee, B. B., Nurul Asyiqin, M. A. and Ng, Y. G.
Ergonomics risk factors and health effects among visual display unit (VDU) users among Malaysian Government
servants. Journal of Medical Safety, (2009) 2, 23-36.

Prevalence Upper Limb Disordersand Associated Factors with Psychosocial and ….
DOI: 10.9790/0853-14577788 www.iosrjournals.org 88 | Page
[44]. Mahmud, N., Bahari, S. F., & Zainudin, N. F. (2014). Psychosocial and Ergonomics Risk Factors Related to Neck,
Shoulder and Back Complaints among Malaysia Office Workers. International Journal of Social Science and
Humanity, 4(4), 260–263.
[45]. Kim, M. G., Kim, K. S., Ryoo, J. H., & Yoo, S. W. (2013). Relationship between occupational stress and work-
related musculoskeletal disorders in Korean male firefighters. Annals of Occupational and Environmental
Medicine,25(1), 9.
[46]. Andersen, J. H., Kaergaard, A., Frost, P., Thomsen, J. F., Bonde, J. P., Fallentin, N., & Mikkelsen, S. (2002).
Physical, psychosocial, and individual risk factors for neck/shoulder pain with pressure tenderness in the muscles
among workers performing monotonous, repetitive work. Spine, 27(6), 660-667.
[47]. Bonde, J. P., Mikkelsen, S., Andersen, J. H., Fallentin, N., Bælum, J., Svendsen, S. W., ...& Kaergaard, A. (2003).
Prognosis of shoulder tendonitis in repetitive work: a follow up study in a cohort of Danish industrial and service
workers. Occupational and Environmental Medicine, 60(9), e8-e8.
[48]. El-Bestar, S. F., El-Mitwalli, A. A. M., & Khashaba, E. O. (2011). Neck-upper extremity musculoskeletal disorders
among workers in the telecommunications company at Mansoura City. International Journal of Occupational Safety
and Ergonomics, 17(2), 195-205.
[49]. OSHWIKI (2013). Psychosocial risk factors for musculoskeletal disorders (MSDs). European Agency for Safety and
Health at Work. Retrieved (January 8, 2015) from
http://oshwiki.eu/wiki/Psychosocial_risk_factors_for_musculoskeletal_disorders_(MSDs)#cite_note-
Van_den_Heuvel.2C_2006-7