Prevalence of signs and symptoms of ocular surface disease in individuals treated and not treated...
7
Original Article Prevalence of signs and symptoms of ocular surface disease in individuals treated and not treated with glaucoma medication Sudipta Ghosh MNAMS,† 1,2 Fleur O’Hare MPhil,† 1 Ecosse Lamoureux PhD, 1 Rasik B Vajpayee FRANZCO 1,3 and Jonathan G Crowston FRANZCO PhD 1 1 Centre for Eye Research Australia, University of Melbourne, Royal Victorian Eye and Ear Hospital, East Melbourne, Victoria, Australia; 2 Rotary Narayana Netralaya, Department of Ophthalmology, Salt Lake, Kolkata, and 3 All Indian Institute of Medical Sciences, New Delhi, India ABSTRACT Background: To determine the prevalence of signs and symptoms of ocular surface disease in two hospital-based cohorts; glaucoma patients and non- glaucoma patients. Design: A cross-sectional, comparative case series. Participants: Glaucoma patients (n = 300) prescribed topical glaucoma medications for 6 months were compared with control patients (n = 100) who were not applying prescribed topical medications. Methods: A validated self-report questionnaire was used to elicit the extent of ocular symptoms. Signs of ocular surface and eyelid disease were assessed along with medication history. Main Outcome Measures: Signs and symptoms of ocular surface pathology were determined including the tear film break-up time, fluorescein staining of the cornea and conjunctiva, meibomian gland dys- function and Schirmer’s test. Results: A significant increase in the prevalence of ocular surface disease signs was observed in the glau- coma population, 70.3%, compared with controls, 33% (P < 0.001). The overall prevalence of clinically significant ocular surface disease symptoms was not significantly different between cohorts, 30.7% versus 24.0%, respectively (P = 0.252). Logistic regression analysis showed that the number of anti- glaucoma medications and duration of therapy were key predictors of significant ocular surface disease signs in the glaucoma group. There was no signifi- cant correlation between signs and symptoms of ocular surface disease in either group after adjusting for age and gender. Conclusions: Signs and symptoms of ocular surface disease are relatively common in older patients, but signs of ocular surface disease are significantly higher in individuals who instil topical glaucoma therapy. Key words: dry eye, glaucoma, glaucoma medication, ocular surface disease. INTRODUCTION Topical medications used to lower intraocular pres- sure in glaucoma can be toxic to the ocular surface and have been reported to increase the prevalence of ocular surface disease. This effect is thought to be largely due to drop preservatives, such as benzal- konium chloride. 1–9 Ocular surface disease (OSD) is characterized by inadequate tear quantity and Correspondence: Ms Fleur O’Hare, Centre for Eye Research Australia, University of Melbourne, Department of Ophthalmology, East Melbourne, Vic. 3002, Australia. Email: [email protected] Received 12 October 2011; accepted 2 February 2012. Competing/conflicts of interest: No stated conflict of interest. Funding sources: The Centre for Eye Research Australia receives Operational Infrastructure Support from the Victorian Government. †Authors contributed equally to the manuscript and share first authorship. Clinical and Experimental Ophthalmology 2012; ••: ••–•• doi: 10.1111/j.1442-9071.2012.02781.x © 2012 The Authors Clinical and Experimental Ophthalmology © 2012 Royal Australian and New Zealand College of Ophthalmologists
-
Upload
sudipta-ghosh -
Category
Documents
-
view
213 -
download
0
Transcript of Prevalence of signs and symptoms of ocular surface disease in individuals treated and not treated...

Original Article
Prevalence of signs and symptoms of ocularsurface disease in individuals treated and nottreated with glaucoma medicationSudipta Ghosh MNAMS,†1,2 Fleur O’Hare MPhil,†1 Ecosse Lamoureux PhD,1 Rasik B Vajpayee FRANZCO1,3
and Jonathan G Crowston FRANZCO PhD1
1Centre for Eye Research Australia, University of Melbourne, Royal Victorian Eye and Ear Hospital, East Melbourne, Victoria, Australia;2Rotary Narayana Netralaya, Department of Ophthalmology, Salt Lake, Kolkata, and 3All Indian Institute of Medical Sciences,New Delhi, India
ABSTRACT
Background: To determine the prevalence of signsand symptoms of ocular surface disease in twohospital-based cohorts; glaucoma patients and non-glaucoma patients.
Design: A cross-sectional, comparative case series.
Participants: Glaucoma patients (n = 300) prescribedtopical glaucoma medications for �6 months werecompared with control patients (n = 100) who werenot applying prescribed topical medications.
Methods: A validated self-report questionnaire wasused to elicit the extent of ocular symptoms. Signs ofocular surface and eyelid disease were assessed alongwith medication history.
Main Outcome Measures: Signs and symptoms ofocular surface pathology were determined includingthe tear film break-up time, fluorescein staining ofthe cornea and conjunctiva, meibomian gland dys-function and Schirmer’s test.
Results: A significant increase in the prevalence ofocular surface disease signs was observed in the glau-coma population, 70.3%, compared with controls,33% (P < 0.001). The overall prevalence of clinically
significant ocular surface disease symptoms wasnot significantly different between cohorts, 30.7%versus 24.0%, respectively (P = 0.252). Logisticregression analysis showed that the number of anti-glaucoma medications and duration of therapy werekey predictors of significant ocular surface diseasesigns in the glaucoma group. There was no signifi-cant correlation between signs and symptoms ofocular surface disease in either group after adjustingfor age and gender.
Conclusions: Signs and symptoms of ocular surfacedisease are relatively common in older patients, butsigns of ocular surface disease are significantly higherin individuals who instil topical glaucoma therapy.
Key words: dry eye, glaucoma, glaucoma medication,ocular surface disease.
INTRODUCTION
Topical medications used to lower intraocular pres-sure in glaucoma can be toxic to the ocular surfaceand have been reported to increase the prevalenceof ocular surface disease. This effect is thought tobe largely due to drop preservatives, such as benzal-konium chloride.1–9 Ocular surface disease (OSD)is characterized by inadequate tear quantity and
� Correspondence: Ms Fleur O’Hare, Centre for Eye Research Australia, University of Melbourne, Department of Ophthalmology, East Melbourne, Vic.
3002, Australia. Email: [email protected]
Received 12 October 2011; accepted 2 February 2012.
Competing/conflicts of interest: No stated conflict of interest.
Funding sources: The Centre for Eye Research Australia receives Operational Infrastructure Support from the Victorian Government.
†Authors contributed equally to the manuscript and share first authorship.
bs_bs_banner
Clinical and Experimental Ophthalmology 2012; ••: ••–•• doi: 10.1111/j.1442-9071.2012.02781.x
© 2012 The AuthorsClinical and Experimental Ophthalmology © 2012 Royal Australian and New Zealand College of Ophthalmologists
quality coupled with disruption of the integrity ofthe ocular surface involving the lids, cornea andconjunctiva. OSD induces a variety of symptomsincluding ocular discomfort, burning and fluctuatingvision.10,11 Increasing age is a leading risk factor forOSD,12–14 and population studies have demonstratedthat in older Australian adults, the prevalence is 7%based on two or more signs12 and 16% based onreporting at least one moderate to severe symptom.15
Although hospital-based studies have reported ahigh prevalence of OSD in glaucoma patients, fewstudies have included comparison with an appropri-ate control population of non-glaucoma patients.Leung et al. recently reported a higher prevalence(59%) of symptoms in a San Diego-based cohort ofglaucoma patients, using the Ocular Surface DiseaseIndex questionnaire. Of these, 27% were reported tohave severe symptoms.16 In the same sample, theprevalence of OSD signs was 54%, with the highestproportion of participants having severe OSD.16 Inanother recent study, Fechtner et al. reported on OSDrates in 630 patients derived from 10 sites. Approxi-mately 48% had symptoms with 12.8% reportingsevere symptoms according to the Ocular SurfaceDisease Index score. Subjects using multiple dropshad significantly higher scores when compared withpatients taking only single drops.17 However, neitherof these studies included a control population, so theadditional impact attributable to glaucoma medi-cations on the prevalence of OSD could not beascertained. To date, few studies investigating OSDin glaucoma have featured a control population.18,19
In a controlled study by Rossi et al., which includedsmall samples of patients under specialist care, rela-tive rates of signs and symptoms were 39.5% and51% in glaucoma patients on at least two topicalhypotensive medications and 5% and 35% in con-trols, respectively.19
The aim of this study was to determine the preva-lence of both signs and symptoms of OSD in a largersample of glaucoma patients attending a tertiaryreferral glaucoma clinic in Melbourne, Australia andcompare these with rates of OSD in an age-equivalent population of non-glaucoma controls. Asecondary aim was to identify independent predic-tors for the presence of OSD in both groups.
METHODS
Study design and participants
We report a hospital-based, cross-sectional, case-comparison study that quantified signs and symp-toms of OSD in glaucoma patients enrolled from atertiary referral glaucoma clinic (n = 300) with non-glaucoma control subjects recruited from a compre-hensive eye clinic in the same hospital who were not
on topical anti-glaucoma medication (n = 100).Eligible patients were identified based on a reviewof their medical records at the time of theirappointment.
Glaucoma patients were recruited from a tertiaryreferral glaucoma clinic at the Royal Victorian Eyeand Ear Hospital, Melbourne, Australia. Inclusioncriteria included patients who had been taking oneor more topical ocular hypotensive eye drops for atleast 6 months. Patients with a self-reported historyof dry eye syndrome prior to taking glaucomamedications, ocular trauma, use of anti-inflammatorydrops such as steroids and non-steroidal anti-inflammatory drops, and previous glaucoma, cornealor conjunctival surgery were excluded from thestudy. Control patients were concurrently recruitedover a similar time frame from a comprehensive oph-thalmology clinic in the same institution. Patientstaking glaucoma medication as well as any of theearlier exclusion criteria were also excluded. Currentuse of artifical lubricant drops was not an exclusioncriteria for either cases or controls. The study proto-col and informed consent were approved by theHuman Research Ethics Committee of the Royal Vic-torian Eye and Ear Hospital, Victoria, Australia. Thestudy adhered to the tenets of the Declaration ofHelsinki.
Ocular symptom questionnaire
The questionnaire consisted of seven questions(Table 1) and was the same as that used in theShihpai Eye Study, a population-based prevalencestudy of dry eye in older adults.20 When a respondentindicated the presence of a symptom, they wereasked to indicate whether the symptom was experi-enced ‘never’, ‘rarely’, ‘sometimes’, ‘often’ or‘always’. This 5-point Likert scale (0–4) was similarto that utilized in the Ocular Surface Disease Indexquestionnaire.21
Assessment of ocular surface
A slit-lamp examination was performed on each par-ticipant by a single investigator (SG). The order of
Table 1. Ocular surface disease symptoms questionnaire
1. Do your eyes feel dry?2. Do you ever feel a gritty or sandy sensation in your eyes?3. Do your eyes have a burning sensation?4. Do your eyes ever feel sticky?5. Do your eyes feel watery or teary?6. Are your eyes ever red?7. Do you notice much crusting or discharge on your
eyelashes?
Responses: ‘never’, ‘rarely’, ‘sometimes’, ‘often’ or ‘always’.Questionnaire adopted from the Shahpai Eye Study.20
2 Ghosh et al.
© 2012 The AuthorsClinical and Experimental Ophthalmology © 2012 Royal Australian and New Zealand College of Ophthalmologists
examination was standardized as follows: tear filmbreak-up time (TBUT) test, slit-lamp examinationand assessment of the meibomian gland, followed bythe Schirmer’s test. The examiner was masked to theresults of the ocular symptom questionnaire whichwas conducted by a single, interview-trained, asso-ciate investigator.
1 TBUT Test: As the instillation of local anaesthet-ics or manipulation of the lid may affect theTBUT, this test was performed before other mea-surement tests. TBUT was performed by apply-ing a dry fluorescein strip at the inferiorpalpebral conjunctiva lightly, and the lower lidwas retracted gently. The patient was asked toblink several times and then desist fromblinking. The tear film was observed with a slitlamp with a cobalt-blue filter.22 The time inseconds between a complete blink and theappearance of a black spot or line was recordedas the TBUT. Clinically abnormal TBUT wasdefined as �5 s, accounting for age-related dec-lination in tear quality.23
2 Cornea and Conjunctiva: A thorough slit-lampexamination of the cornea and conjunctiva wasthen performed. Fluorescein staining of thecornea and conjunctiva was graded accordingto the ‘Cornea and Contact Lens Research Unit(CCLRU)’ grading scales as 0 (no staining), 1(mild; 1–15% surface involvement), 2 (moder-ate; 16–30% surface involvement), 3 (severe;31–45% surface involvement) and 4 (verysevere; 46% or greater surface involvement.24–26
Clinically significant fluorescein staining wasdefined as a grade between and including 2 to4 which is consistent with other reported per-centage involvement criteria in prevalencestudies.12
3 Meibomian Gland Dysfunction: The presence of lidmargin telangiectasia and grading of meibo-mian gland obstruction (grade 0: no obstruc-tion; grade 1: plugging with translucent seroussecretion when compressing the lid margin;grade 2: plugging with viscous or waxy whitesecretion when compressing the lid marginand grade 3: plugging with no secretion whencompressing the lid margin) were recorded.27,28
Clinically significant meibomian gland dys-function was defined as grade 2 or 3.28,29
4 Schirmer’s Test: The Schirmer’s test was per-formed after the slit-lamp examination, so thatocular irritation by the test strip would notinterfere with other examination results. Oneminute after instillation of a drop of 0.5% pro-paracaine, any visible fluid in the inferiorfornix and lid margin was gently dried with acotton swab. A pre-calibrated filter strip (Color
Bar; Eagle Vision, Inc., Memphis, TN, USA)was then placed temporally in each lowerfornix and left in place for 5 min. The patientwas allowed to either blink normally or toclose his or her eyes. After 5 min, the stripswere removed, and the amount of wetting (inmm) was recorded from the pre-calibratedstrips.30 A clinically abnormal Schirmer’s testwas defined as being �5 mm in 5 min, whichis consistent with the definition from otherprevalence studies.20,28,31
Statistical analysis
Chi-square or t-tests were used to determine anydifference between the glaucomatous and controlgroups. The association between OSD signs, poten-tial predictors and OSD symptoms were analysedusing binary logistic regression models. Data wereanalysed using Minitab statistical software (Version16, Minitab Inc. Sydney, NSW, Australia). A P-value<0.05 was considered to be statistically significant.The eye with the more clinically significant ocularsigns was considered for statistical analysis.
RESULTS
Study population
The mean � standard deviation age values for theglaucomatous (n = 300) and control (n = 100) groupswere 66.9 � 14.4 [interquartile range, 58–77 years]and 66.6 � 14.9 (interquartile range, 57.25–77 years;P = 0.83), respectively. There were more male partici-pants in both groups, comprising 58% and 59% inthe glaucoma and control groups, respectively(Table 2).
The primary ocular diagnosis among the glaucomaand control subjects is shown in Table 2. Themean � standard deviation for the duration oftopical therapy in the glaucoma patients was 7.9 �5.8 years. Of these, 92.7% (278/300) were on anti-glaucoma therapy for both eyes. The median numberof anti-glaucomatous eye drops was two bottles foreither eye. Medication was prescribed as eithersingle [right eye: 28.7% and left eye: 32.3%] ormultiple-dose therapy (right eye: 71.3%, left eye:67.7%). Anti-glaucoma therapy containing benza-lkonium chloride preservative was prescribed in93% of treated patients, and the most common classof therapy prescribed was prostaglandin analoguesfollowed by fixed combination therapy (Table 3).The most frequently prescribed medications werelatanoprost (23.4%) and brimonidine (15.7%).Current use of topical artificial lubricants wasreported in 42.7% of glaucoma patients and 44.0% of
Ocular surface disease in glaucoma 3
© 2012 The AuthorsClinical and Experimental Ophthalmology © 2012 Royal Australian and New Zealand College of Ophthalmologists
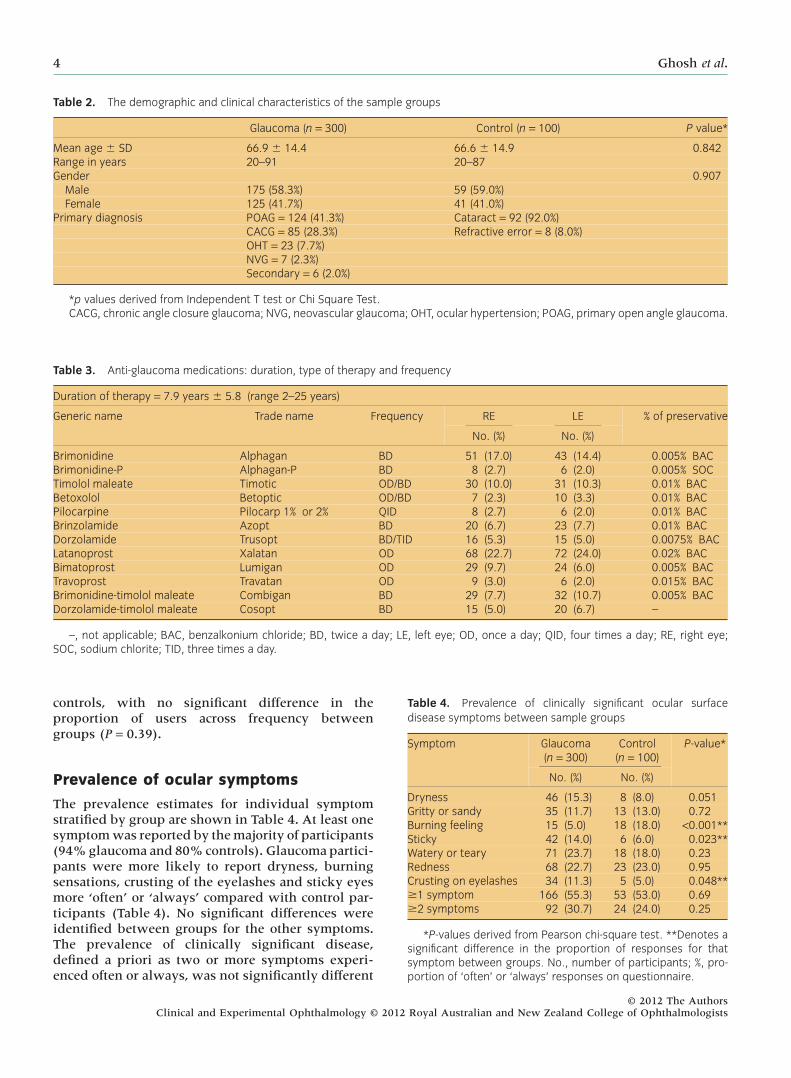
controls, with no significant difference in theproportion of users across frequency betweengroups (P = 0.39).
Prevalence of ocular symptoms
The prevalence estimates for individual symptomstratified by group are shown in Table 4. At least onesymptom was reported by the majority of participants(94% glaucoma and 80% controls). Glaucoma partici-pants were more likely to report dryness, burningsensations, crusting of the eyelashes and sticky eyesmore ‘often’ or ‘always’ compared with control par-ticipants (Table 4). No significant differences wereidentified between groups for the other symptoms.The prevalence of clinically significant disease,defined a priori as two or more symptoms experi-enced often or always, was not significantly different
Table 2. The demographic and clinical characteristics of the sample groups
Glaucoma (n = 300) Control (n = 100) P value*
Mean age � SD 66.9 � 14.4 66.6 � 14.9 0.842Range in years 20–91 20–87Gender 0.907
Male 175 (58.3%) 59 (59.0%)Female 125 (41.7%) 41 (41.0%)
Primary diagnosis POAG = 124 (41.3%) Cataract = 92 (92.0%)CACG = 85 (28.3%) Refractive error = 8 (8.0%)OHT = 23 (7.7%)NVG = 7 (2.3%)Secondary = 6 (2.0%)
*p values derived from Independent T test or Chi Square Test.CACG, chronic angle closure glaucoma; NVG, neovascular glaucoma; OHT, ocular hypertension; POAG, primary open angle glaucoma.
Table 3. Anti-glaucoma medications: duration, type of therapy and frequency
Duration of therapy = 7.9 years � 5.8 (range 2–25 years)
Generic name Trade name Frequency RE LE % of preservative
No. (%) No. (%)
Brimonidine Alphagan BD 51 (17.0) 43 (14.4) 0.005% BACBrimonidine-P Alphagan-P BD 8 (2.7) 6 (2.0) 0.005% SOCTimolol maleate Timotic OD/BD 30 (10.0) 31 (10.3) 0.01% BACBetoxolol Betoptic OD/BD 7 (2.3) 10 (3.3) 0.01% BACPilocarpine Pilocarp 1% or 2% QID 8 (2.7) 6 (2.0) 0.01% BACBrinzolamide Azopt BD 20 (6.7) 23 (7.7) 0.01% BACDorzolamide Trusopt BD/TID 16 (5.3) 15 (5.0) 0.0075% BACLatanoprost Xalatan OD 68 (22.7) 72 (24.0) 0.02% BACBimatoprost Lumigan OD 29 (9.7) 24 (6.0) 0.005% BACTravoprost Travatan OD 9 (3.0) 6 (2.0) 0.015% BACBrimonidine-timolol maleate Combigan BD 29 (7.7) 32 (10.7) 0.005% BACDorzolamide-timolol maleate Cosopt BD 15 (5.0) 20 (6.7) –
–, not applicable; BAC, benzalkonium chloride; BD, twice a day; LE, left eye; OD, once a day; QID, four times a day; RE, right eye;SOC, sodium chlorite; TID, three times a day.
Table 4. Prevalence of clinically significant ocular surfacedisease symptoms between sample groups
Symptom Glaucoma(n = 300)
Control(n = 100)
P-value*
No. (%) No. (%)
Dryness 46 (15.3) 8 (8.0) 0.051Gritty or sandy 35 (11.7) 13 (13.0) 0.72Burning feeling 15 (5.0) 18 (18.0) <0.001**Sticky 42 (14.0) 6 (6.0) 0.023**Watery or teary 71 (23.7) 18 (18.0) 0.23Redness 68 (22.7) 23 (23.0) 0.95Crusting on eyelashes 34 (11.3) 5 (5.0) 0.048**�1 symptom 166 (55.3) 53 (53.0) 0.69�2 symptoms 92 (30.7) 24 (24.0) 0.25
*P-values derived from Pearson chi-square test. **Denotes asignificant difference in the proportion of responses for thatsymptom between groups. No., number of participants; %, pro-portion of ‘often’ or ‘always’ responses on questionnaire.
4 Ghosh et al.
© 2012 The AuthorsClinical and Experimental Ophthalmology © 2012 Royal Australian and New Zealand College of Ophthalmologists
between groups with 30.7% in glaucoma partici-pants and 24.0% in controls (Table 4, P = 0.25).
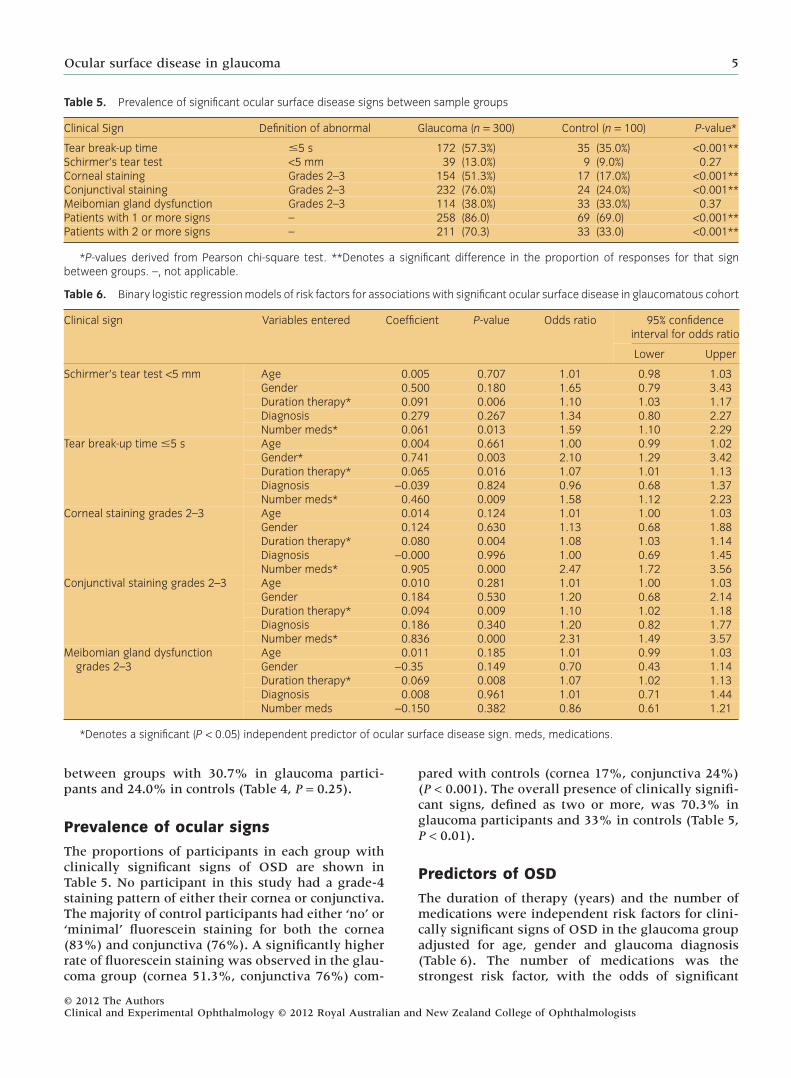
Prevalence of ocular signs
The proportions of participants in each group withclinically significant signs of OSD are shown inTable 5. No participant in this study had a grade-4staining pattern of either their cornea or conjunctiva.The majority of control participants had either ‘no’ or‘minimal’ fluorescein staining for both the cornea(83%) and conjunctiva (76%). A significantly higherrate of fluorescein staining was observed in the glau-coma group (cornea 51.3%, conjunctiva 76%) com-
pared with controls (cornea 17%, conjunctiva 24%)(P < 0.001). The overall presence of clinically signifi-cant signs, defined as two or more, was 70.3% inglaucoma participants and 33% in controls (Table 5,P < 0.01).
Predictors of OSD
The duration of therapy (years) and the number ofmedications were independent risk factors for clini-cally significant signs of OSD in the glaucoma groupadjusted for age, gender and glaucoma diagnosis(Table 6). The number of medications was thestrongest risk factor, with the odds of significant
Table 5. Prevalence of significant ocular surface disease signs between sample groups
Clinical Sign Definition of abnormal Glaucoma (n = 300) Control (n = 100) P-value*
Tear break-up time �5 s 172 (57.3%) 35 (35.0%) <0.001**Schirmer’s tear test <5 mm 39 (13.0%) 9 (9.0%) 0.27Corneal staining Grades 2–3 154 (51.3%) 17 (17.0%) <0.001**Conjunctival staining Grades 2–3 232 (76.0%) 24 (24.0%) <0.001**Meibomian gland dysfunction Grades 2–3 114 (38.0%) 33 (33.0%) 0.37Patients with 1 or more signs – 258 (86.0) 69 (69.0) <0.001**Patients with 2 or more signs – 211 (70.3) 33 (33.0) <0.001**
*P-values derived from Pearson chi-square test. **Denotes a significant difference in the proportion of responses for that signbetween groups. –, not applicable.
Table 6. Binary logistic regression models of risk factors for associations with significant ocular surface disease in glaucomatous cohort
Clinical sign Variables entered Coefficient P-value Odds ratio 95% confidenceinterval for odds ratio
Lower Upper
Schirmer’s tear test <5 mm Age 0.005 0.707 1.01 0.98 1.03Gender 0.500 0.180 1.65 0.79 3.43Duration therapy* 0.091 0.006 1.10 1.03 1.17Diagnosis 0.279 0.267 1.34 0.80 2.27Number meds* 0.061 0.013 1.59 1.10 2.29
Tear break-up time �5 s Age 0.004 0.661 1.00 0.99 1.02Gender* 0.741 0.003 2.10 1.29 3.42Duration therapy* 0.065 0.016 1.07 1.01 1.13Diagnosis -0.039 0.824 0.96 0.68 1.37Number meds* 0.460 0.009 1.58 1.12 2.23
Corneal staining grades 2–3 Age 0.014 0.124 1.01 1.00 1.03Gender 0.124 0.630 1.13 0.68 1.88Duration therapy* 0.080 0.004 1.08 1.03 1.14Diagnosis -0.000 0.996 1.00 0.69 1.45Number meds* 0.905 0.000 2.47 1.72 3.56
Conjunctival staining grades 2–3 Age 0.010 0.281 1.01 1.00 1.03Gender 0.184 0.530 1.20 0.68 2.14Duration therapy* 0.094 0.009 1.10 1.02 1.18Diagnosis 0.186 0.340 1.20 0.82 1.77Number meds* 0.836 0.000 2.31 1.49 3.57
Meibomian gland dysfunctiongrades 2–3
Age 0.011 0.185 1.01 0.99 1.03Gender -0.35 0.149 0.70 0.43 1.14Duration therapy* 0.069 0.008 1.07 1.02 1.13Diagnosis 0.008 0.961 1.01 0.71 1.44Number meds -0.150 0.382 0.86 0.61 1.21
*Denotes a significant (P < 0.05) independent predictor of ocular surface disease sign. meds, medications.
Ocular surface disease in glaucoma 5
© 2012 The AuthorsClinical and Experimental Ophthalmology © 2012 Royal Australian and New Zealand College of Ophthalmologists
fluorescein staining increasing approximately two-fold with every bottle (P < 0.05; cornea: odds ratio[OR] 2.47, 95% CI 1.72–3.56; conjunctiva: OR 2.31,95% CI 1.49–3.57).
There was little association between signs andsymptoms of OSD for either group. Individual logis-tic models were calculated for each clinical sign withthree potential predictor variables for each group(age, gender, stratified individual question responsewhere reference is responses 0–2 and event 3–4).Overall, the majority of OSD signs were not associ-ated with OSD symptoms in the control group,rather, a significant association was found withincreasing age and OSD signs involving TBUT,corneal and conjunctival staining (P < 0.05; OR range1.02 to 1.15, 95% CI range 1.00–1.11 to 1.06–1.24). Asimilar result for age was found in the glaucomagroup (P = 0.017; OR 1.02, 95% CI 1.00 to 1.04).
DISCUSSION
This study demonstrated a high prevalence of OSDin a population of glaucoma patients prescribed withmultiple topical medications. Of note is that we alsofound a high rate of symptoms and signs of OSD ina control population not using prescribed topicalmedication. The use of topical glaucoma therapy didnot increase clinically significant symptoms but didincrease clinically significant signs of OSD. For bothcontrol and glaucoma populations, our rates of OSDare generally higher than studies in the USA13,17,32–34
and Singapore35 but are similar to population studiesconducted in other parts of Asia.28,36 Of note, ourrates of OSD signs are higher, and rates of OSDsymptoms are similar to than those reported inanother recent controlled study that involved asmaller, clinic-based population in Italy.19 In addi-tion, our prevalence rates of OSD in these hospital-based cohorts were significantly higher thanrates reported previously in Australian populationstudies.12,15 Our results may differ from other studiesdue to variations in the definition and measurementtools used to define OSD. It is recognized that theinclusion of both symptoms and signs in OSD diag-nosis is preferable.37
Our findings may also differ from other studiesowing to differences in climate and other environ-mental factors such as pollen levels or pollution. Thepurpose of the study was not to address possiblemechanisms leading to the OSD signs observed,however, there are likely multiple factors underly-ing our findings including those that influence tearevaporation rate and tear production quality.38 Giventhe significant difference (P < 0.05) between themean group result between the glaucoma andcontrol groups for both TBUT (5.04 � 2.83 s and6.85 � 3.19 s, respectively) and Schirmer’s test
(9.90 � 4.04 mm and 11.66 � 4.66 mm, respec-tively), findings suggest that evaporative mecha-nisms may have contributed to the underlyingmechanism.
The majority of glaucoma patients (94.2%) in thecurrent study were on preservative-containing eyedrops, therefore, no valid comparison could be madewith patients on preservative-free eye drops. Hence,in the context of eye drops containing preserva-tive, this study identified that each additional eyedrop was associated with approximately two timeshigher rates of impaired tear break-up time andmoderate to severe signs of epithelial pathology. Thisis in agreement with prior studies where the numberof topical medications has consistently been reportedas a predictor of OSD in glaucoma patients.16,17,19,39 Inaddition, the current study also identified that theduration of therapy is also an independent risk factorfor OSD after adjusting for age, gender and type ofglaucoma. A potential limitation of this study is thatwe did not adjust for changes in therapy over thedisease course or assess adherence rates to the pre-scribed treatment. In addition, although the exam-iner (SG) was masked to the type and number oftopical medications used by participants, they werenot masked to patient diagnosis which could be apotential source of bias in interpreting findings.
This case-comparison study determined the preva-lence and predictors of OSD in glaucoma patientstaking topical therapy for more than 6 months. Bothcases and controls had a high rate of OSD symptoms,however, in the topically treated glaucoma patients,a significantly higher prevalence of clinically signifi-cant signs of OSD was found. In light of the highrates of OSD parameters identified in both groups,we recommend that future studies on the rates ofboth signs and symptoms of OSD in glaucoma alsoinclude a control population not taking any glau-coma medications.
ACKNOWLEDGEMENT
This study was supported by the National Healthand Medical Research Council Centre for ClinicalResearch Excellence #529923.
REFERENCES
1. Arici MK, Arici DS, Topalkara A, Guler C. Adverseeffects of topical antiglaucoma drugs on the ocularsurface. Clin Experiment Ophthalmol 2000; 28: 113–17.
2. Bartlett JD. Adverse effects of antiglaucoma medi-cations. Optom Clin 1991; 1: 103–26.
3. Baudouin C. Side effects of antiglaucomatous drugs onthe ocular surface. Curr Opin Ophthalmol 1996; 7: 80–6.
4. Clearkin L. Adverse effects of topical antiglaucomamedication. Arch Ophthalmol 1995; 113: 849–50.
6 Ghosh et al.
© 2012 The AuthorsClinical and Experimental Ophthalmology © 2012 Royal Australian and New Zealand College of Ophthalmologists

5. Fraunfelder FW. Corneal toxicity from topical ocularand systemic medications. Cornea 2006; 25: 1133–8.
6. Stefan C, Dumitrica DM. Ocular surface disfunction inglaucoma. Oftalmologia 2008; 52: 114–19.
7. Wilson FM 2nd. Adverse external ocular effects oftopical ophthalmic medications. Surv Ophthalmol 1979;24: 57–88.
8. Wilson FM 2nd. Adverse external ocular effects oftopical ophthalmic therapy: an epidemiologic, labora-tory, and clinical study. Trans Am Ophthalmol Soc 1983;81: 854–965.
9. Yalvac IS, Gedikoglu G, Karagoz Y et al. Effects of anti-glaucoma drugs on ocular surface. Acta Ophthalmol Scand1995; 73: 246–8.
10. Latkany R. Dry eyes: etiology and management. CurrOpin Ophthalmol 2008; 19: 287–91.
11. Lemp MA, Foulks GN. The definition and classifica-tion of dry eye disease: report from the Definition andClassification Subcommittee of the International DryEye Workshop. Ocul Surf 2007; 5: 75–92.
12. McCarty CA, Bansal AK, Livingston PM, StanislavskyYL, Taylor HR. The epidemiology of dry eye in Mel-bourne, Australia. Ophthalmology 1998; 105: 1114–19.
13. Moss SE, Klein R, Klein BE. Prevalence of and riskfactors for dry eye syndrome. Arch Ophthalmol 2000;118: 1264–8.
14. Rudnicka AR, Mt-Isa S, Owen CG, Cook DG, AshbyD. Variations in primary open-angle glaucoma preva-lence by age, gender, and race: a Bayesian meta-analysis. Invest Ophthalmol Vis Sci 2006; 47: 4254–61.
15. Chia EM, Mitchell P, Rochtchina E, Lee AJ, Maroun R,Wang JJ. Prevalence and associations of dry eye syn-drome in an older population: the Blue Mountains EyeStudy. Clin Experiment Ophthalmol 2003; 31: 229–32.
16. Leung EW, Medeiros FA, Weinreb RN. Prevalence ofocular surface disease in glaucoma patients. J Glaucoma2008; 17: 350–5.
17. Fechtner RD, Godfrey DG, Budenz D, Stewart JA,Stewart WC, Jasek MC. Prevalence of ocular surfacecomplaints in patients with glaucoma using topicalintraocular pressure-lowering medications. Cornea2010; 29: 618–21.
18. Baffa Ldo P, Ricardo JR, Dias AC et al. Tear film andocular surface alterations in chronic users of antiglau-coma medications. Arq Bras Oftalmol 2008; 71: 18–21.
19. Rossi GC, Tinelli C, Pasinetti GM, Milano G, BianchiPE. Dry eye syndrome-related quality of life in glau-coma patients. Eur J Ophthalmol 2009; 19: 572–9.
20. Lin PY, Tsai SY, Cheng CY, Liu JH, Chou P, Hsu WM.Prevalence of dry eye among an elderly Chinese popu-lation in Taiwan: the Shihpai Eye Study. Ophthalmology2003; 110: 1096–101.
21. Schiffman RM, Christianson MD, Jacobsen G, HirschJD, Reis BL. Reliability and validity of the OcularSurface Disease Index. Arch Ophthalmol 2000; 118: 615–21.
22. Lee JH, Kee CW. The significance of tear film break-uptime in the diagnosis of dry eye syndrome. Korean JOphthalmol 1988; 2: 69–71.
23. McGill JI, Liakos GM, Goulding N, Seal DV. Normaltear protein profiles and age-related changes. Br J Oph-thalmol 1984; 68: 316–20.
24. Jalbert I, Sweeney DF, Holden BA. The characteristicsof corneal staining in successful daily and extendeddisposable contact lens wearers. Clin Exp Optom 1999;82: 4–10.
25. Josephson JE, Caffery BE. Corneal staining character-istics after sequential instillations of fluorescein. OptomVis Sci 1992; 69: 570–3.
26. Josephson JE, Zantos S, Caffery B, Herman JP. Differ-entiation of corneal complications observed in contactlens wearers. J Am Optom Assoc 1988; 59: 679–85.
27. Mathers WD, Shields WJ, Sachdev MS, Petroll WM,Jester JV. Meibomian gland dysfunction in chronicblepharitis. Cornea 1991; 10: 277–85.
28. Jie Y, Xu L, Wu YY, Jonas JB. Prevalence of dry eyeamong adult Chinese in the Beijing Eye Study. Eye(Lond) 2009; 23: 688–93.
29. Mathers WD, Shields WJ, Sachdev MS, Petroll WM,Jester JV. Meibomian gland morphology and tearosmolarity: changes with Accutane therapy. Cornea1991; 10: 286–90.
30. [No authors listed]. Methodologies to diagnose andmonitor dry eye disease: report of the DiagnosticMethodology Subcommittee of the International DryEye WorkShop (2007). Ocul Surf 2007; 5: 108–52.
31. [No authors listed]. Research in dry eye: report of theResearch Subcommittee of the International Dry EyeWorkShop (2007). Ocul Surf 2007; 5: 179–93.
32. Bandeen-Roche K, Munoz B, Tielsch JM, West SK,Schein OD. Self-reported assessment of dry eye in apopulation-based setting. Invest Ophthalmol Vis Sci 1997;38: 2469–75.
33. Schein OD, Munoz B, Tielsch JM, Bandeen-Roche K,West S. Prevalence of dry eye among the elderly. Am JOphthalmol 1997; 124: 723–8.
34. Schein OD, Tielsch JM, Munoz B, Bandeen-Roche K,West S. Relation between signs and symptoms of dryeye in the elderly. A population-based perspective.Ophthalmology 1997; 104: 1395–401.
35. Tong L, Waduthantri S, Wong TY et al. Impact of symp-tomatic dry eye on vision-related daily activities: theSingapore Malay Eye Study. Eye (Lond) 2010; 24: 1486–91.
36. Guo B, Lu P, Chen X, Zhang W, Chen R. Prevalence ofdry eye disease in Mongolians at high altitude inChina: the Henan eye study. Ophthalmic Epidemiol 2010;17: 234–41.
37. [No authors listed]. The epidemiology of dry eyedisease: report of the Epidemiology Subcommittee ofthe International Dry Eye WorkShop (2007). Ocul Surf2007; 5: 93–107.
38. Mantelli F, Tranchina L, Lambiase A, Bonini S. Ocularsurface damage by ophthalmic compounds. Curr OpinAllergy Clin Immunol 2011; 11: 464–70.
39. Pisella PJ, Pouliquen P, Baudouin C. Prevalence ofocular symptoms and signs with preserved and preser-vative free glaucoma medication. Br J Ophthalmol 2002;86: 418–23.
Ocular surface disease in glaucoma 7
© 2012 The AuthorsClinical and Experimental Ophthalmology © 2012 Royal Australian and New Zealand College of Ophthalmologists