Prevalence of Disability and 25th Anniversary of the ... · Morbidity and Mortality Weekly Report....
32
Continuing Education examination available at http://www.cdc.gov/mmwr/cme/conted_info.html#weekly. U.S. Department of Health and Human Services Centers for Disease Control and Prevention Morbidity and Mortality Weekly Report Weekly / Vol. 64 / No. 29 July 31, 2015 25th Anniversary of the Americans with Disabilities Act — July 2015 July 2015 marks the 25th anniversary of the passage of the Americans with Disabilities Act (ADA), signed into law on July 26, 1990, by President George H.W. Bush. ADA prohibits discrimination against persons with dis- abilities in all areas of their everyday lives, such as work, school, transportation, communication, recreation, and access to state and local government services. When first enacted, ADA defined a disability as a “physical or mental impairment that substantially limits one or more of the major life activities.”(1) During the last 2 decades, multiple national surveys measured disability in various ways because of substantial differences in the conceptualization and definition of disability. More recently, several national health surveys incorporated a recommended standard set of questions assessing functional types of disability. In recognition of ADA’s milestone anniversary, this issue of MMWR includes a report using the first data available on functional types of disability in a state-based health survey. It includes prevalence of functional disability using a standard set of disability questions rather than measuring disability in a nonspecific manner. This report presents the percentage of adults with any disability and with specific types of disabilities by state and key demographic characteristics (e.g., sex, age, race/ethnicity). For more information on disability research and surveillance and state and national disability programs and resources, access the CDC’s Disability and Health Branch, available at http://www.cdc.gov/ncbddd/ disabilityandhealth/. Reference 1. Americans with Disabilities Act of 1990, Pub. L. 101-336, 104 Stat. 328 (July 26, 1990) [amended January 1, 2009]. Available at http:// www.ada.gov/pubs/adastatute08.htm. Prevalence of Disability and Disability Type Among Adults — United States, 2013 Elizabeth A. Courtney-Long, MA, MSPH 1 ; Dianna D. Carroll, PhD 1,2 ; Qing C. Zhang, PhD 1 ; Alissa C. Stevens, MPH 1 ; Shannon Griffin- Blake, PhD 1 ; Brian S. Armour, PhD 1 ; Vincent A. Campbell, PhD 1 (Author affiliations at end of text) Understanding the prevalence of disability is important for public health programs to be able to address the needs of persons with disabilities. Beginning in 2013, to measure disability prevalence by functional type, the Behavioral Risk Factor Surveillance System (BRFSS), added five questions* * The BRFSS does not include the recommended question on deafness or serious difficulty hearing. INSIDE 784 National, Regional, State, and Selected Local Area Vaccination Coverage Among Adolescents Aged 13–17 Years — United States, 2014 793 Aviation-Related Wildland Firefighter Fatalities — United States, 2000–2013 797 Current Cigarette Smoking Among Workers in Accommodation and Food Services — United States, 2011–2013 802 Notes from the Field: Large Outbreak of Botulism Associated with a Church Potluck Meal — Ohio, 2015 804 Notes from the Field: Multistate Outbreak of Human Salmonella Poona Infections Associated with Pet Turtle Exposure — United States, 2014 805 Notes from the Field: Atypical Presentations of Hand, Foot, and Mouth Disease Caused by Coxsackievirus A6 — Minnesota, 2014 806 Announcement 807 QuickStats
Transcript of Prevalence of Disability and 25th Anniversary of the ... · Morbidity and Mortality Weekly Report....

Continuing Education examination available at http://www.cdc.gov/mmwr/cme/conted_info.html#weekly.
U.S. Department of Health and Human ServicesCenters for Disease Control and Prevention
Morbidity and Mortality Weekly ReportWeekly / Vol. 64 / No. 29 July 31, 2015
25th Anniversary of the Americans with Disabilities Act — July 2015
July 2015 marks the 25th anniversary of the passage of the Americans with Disabilities Act (ADA), signed into law on July 26, 1990, by President George H.W. Bush. ADA prohibits discrimination against persons with dis-abilities in all areas of their everyday lives, such as work, school, transportation, communication, recreation, and access to state and local government services. When first enacted, ADA defined a disability as a “physical or mental impairment that substantially limits one or more of the major life activities.”(1)
During the last 2 decades, multiple national surveys measured disability in various ways because of substantial differences in the conceptualization and definition of disability. More recently, several national health surveys incorporated a recommended standard set of questions assessing functional types of disability.
In recognition of ADA’s milestone anniversary, this issue of MMWR includes a report using the first data available on functional types of disability in a state-based health survey. It includes prevalence of functional disability using a standard set of disability questions rather than measuring disability in a nonspecific manner. This report presents the percentage of adults with any disability and with specific types of disabilities by state and key demographic characteristics (e.g., sex, age, race/ethnicity).
For more information on disability research and surveillance and state and national disability programs and resources, access the CDC’s Disability and Health Branch, available at http://www.cdc.gov/ncbddd/disabilityandhealth/.
Reference1. Americans with Disabilities Act of 1990, Pub. L. 101-336, 104 Stat.
328 (July 26, 1990) [amended January 1, 2009]. Available at http://www.ada.gov/pubs/adastatute08.htm.
Prevalence of Disability and Disability Type Among Adults —
United States, 2013Elizabeth A. Courtney-Long, MA, MSPH1; Dianna D. Carroll, PhD1,2;
Qing C. Zhang, PhD1; Alissa C. Stevens, MPH1; Shannon Griffin-Blake, PhD1; Brian S. Armour, PhD1; Vincent A. Campbell, PhD1
(Author affiliations at end of text)
Understanding the prevalence of disability is important for public health programs to be able to address the needs of persons with disabilities. Beginning in 2013, to measure disability prevalence by functional type, the Behavioral Risk Factor Surveillance System (BRFSS), added five questions*
* The BRFSS does not include the recommended question on deafness or serious difficulty hearing.
INSIDE784 National, Regional, State, and Selected Local Area
Vaccination Coverage Among Adolescents Aged 13–17 Years — United States, 2014
793 Aviation-Related Wildland Firefighter Fatalities — United States, 2000–2013
797 Current Cigarette Smoking Among Workers in Accommodation and Food Services — United States, 2011–2013
802 Notes from the Field: Large Outbreak of Botulism Associated with a Church Potluck Meal — Ohio, 2015
804 Notes from the Field: Multistate Outbreak of Human Salmonella Poona Infections Associated with Pet Turtle Exposure — United States, 2014
805 Notes from the Field: Atypical Presentations of Hand, Foot, and Mouth Disease Caused by Coxsackievirus A6 — Minnesota, 2014
806 Announcement807 QuickStats

Morbidity and Mortality Weekly Report
778 MMWR / July 31, 2015 / Vol. 64 / No. 29
The MMWR series of publications is published by the Center for Surveillance, Epidemiology, and Laboratory Services, Centers for Disease Control and Prevention (CDC), U.S. Department of Health and Human Services, Atlanta, GA 30329-4027.Suggested citation: [Author names; first three, then et al., if more than six.] [Report title]. MMWR Morb Mortal Wkly Rep 2015;64:[inclusive page numbers].
Centers for Disease Control and PreventionThomas R. Frieden, MD, MPH, Director
Harold W. Jaffe, MD, MA, Associate Director for Science Joanne Cono, MD, ScM, Director, Office of Science Quality
Chesley L. Richards, MD, MPH, Deputy Director for Public Health Scientific ServicesMichael F. Iademarco, MD, MPH, Director, Center for Surveillance, Epidemiology, and Laboratory Services
MMWR Editorial and Production Staff (Weekly)Sonja A. Rasmussen, MD, MS, Editor-in-Chief
Charlotte K. Kent, PhD, MPH, Executive Editor Jacqueline Gindler, MD, Acting EditorTeresa F. Rutledge, Managing Editor
Douglas W. Weatherwax, Lead Technical Writer-EditorTeresa M. Hood, MS, Jude C. Rutledge, Writer-Editors
Martha F. Boyd, Lead Visual Information SpecialistMaureen A. Leahy, Julia C. Martinroe,
Stephen R. Spriggs, Brian E. Wood,Visual Information Specialists
Quang M. Doan, MBA, Phyllis H. King,Teresa C. Moreland, Terraye M. Starr
Information Technology Specialists
MMWR Editorial BoardTimothy F. Jones, MD, Nashville, TN, ChairmanMatthew L. Boulton, MD, MPH, Ann Arbor, MI
Virginia A. Caine, MD, Indianapolis, INJonathan E. Fielding, MD, MPH, MBA, Los Angeles, CA
David W. Fleming, MD, Seattle, WAWilliam E. Halperin, MD, DrPH, MPH, Newark, NJ
King K. Holmes, MD, PhD, Seattle, WARima F. Khabbaz, MD, Atlanta, GA
Patricia Quinlisk, MD, MPH, Des Moines, IAPatrick L. Remington, MD, MPH, Madison, WIWilliam L. Roper, MD, MPH, Chapel Hill, NC
William Schaffner, MD, Nashville, TN
to identify disability in vision, cognition, mobility, self-care, and independent living.† CDC analyzed data from the 2013 BRFSS to assess overall prevalence of any disability, as well as specific types of disability among noninstitutionalized U.S. adults. Across all states, disabilities in mobility and cognition were the most frequently reported types. State-level prevalence of each disability type ranged from 2.7% to 8.1% (vision); 6.9% to 16.8% (cognition); 8.5% to 20.7% (mobility); 1.9% to 6.2% (self-care) and 4.2% to 10.8% (independent living). A higher prevalence of any disability was generally seen among adults living in states in the South and among women (24.4%) compared with men (19.8%). Prevalences of any disability and disability in mobility were higher among older age groups. These are the first data on functional disability types available in a state-based health survey. This information can help public health programs identify the prevalence of and demographic characteristics associated with different disability types among U.S. adults and better target appropriate interventions to reduce health disparities.
BRFSS is an annual state-based random-digit–dialed telephone (landline and cell phone) survey of the U.S. noninstitutionalized civilian population aged ≥18 years.
During 2013, the median response rate among the 50 states and District of Columbia (DC) was 45.9% and ranged from 29.0% (Alabama) to 59.2% (North Dakota).§ The 2013 survey included, for the first time, questions about five disability types (vision, cognition, mobility, self-care, and independent living).¶ Respondents were identified as having one of the five disability types if they answered “yes” to the relevant question. Respondents who responded “yes” to at least one of the disability questions were identified as having any disability. Responses of “don’t know” or “refused” were excluded from analyses. Prevalences of any disability and disability type (with 95% confidence intervals) were calculated by state, sex, age group, race/ethnicity, veteran status, annual household income,
† Based on section 4302 of the Affordable Care Act, the Department of Health and Human Services issued data collection standard guidance to include a standard set of disability identifiers in all national population health surveys. Available at http://aspe.hhs.gov/datacncl/standards/aca/4302/index.pdf.
§ Response rates for BRFSS are calculated using standards set by the American Association of Public Opinion Research Response Rate Formula #4 (http://www.aapor.org/AAPORKentico/AAPOR_Main/media/publications/Standard-Definitions2015_8theditionwithchanges_April2015_logo.pdf ). The response rate is the number of respondents who completed the survey as a proportion of all eligible and likely eligible persons. For detailed information, please see the BRFSS Summary Data Quality Report at http://www.cdc.gov/brfss/annual_data/2013/pdf/2013_DQR.pdf.
¶ The questions for specific disability types are: “Are you blind, or do you have serious difficulty seeing, even when wearing glasses?” (vision); “Because of a physical, mental, or emotional condition, do you have serious difficulty concentrating, remembering, or making decisions?” (cognition); “Do you have serious difficulty walking or climbing stairs?” (mobility); “Do you have difficulty dressing or bathing?” (self-care); and “Because of a physical, mental, or emotional condition, do you have difficulty doing errands alone such as visiting a doctor’s office or shopping?” (independent living).

Morbidity and Mortality Weekly Report
MMWR / July 31, 2015 / Vol. 64 / No. 29 779
employment status, and education level. All estimates were age-adjusted to the 2000 U.S. population. Data were weighted and analyzed to account for the complex sampling design of BRFSS. Two-sided chi-square tests were used to compare prevalence estimates between demographic subgroups.
Overall, 22.2% of U.S. adults (53,316,677 persons) reported any disability. Disability in mobility was the most frequently reported type (13.0%), followed by disability in cognition (10.6%), independent living (6.5%), vision (4.6%), and self-care (3.6%) (Table 1).
Prevalence of any disability differed across states, ranging from 16.4% (Minnesota) to 31.5% (Alabama). Prevalences of each disability type also varied across states. Disability in vision ranged from 2.7% in Idaho and New Hampshire to 8.1% in Mississippi; disability in cognition ranged from 6.9% in North Dakota and South Dakota to 16.8% in Arkansas; disability in mobility ranged from 8.5% in Minnesota to 20.7% in Mississippi; self-care disability ranged from 1.9% in Hawaii to 6.2% in Mississippi; and disability in independent living ranged from 4.2% in Nebraska and Utah to 10.8% in Mississippi. Generally, states with higher disability prevalences were located in the South and those with lower prevalences were in the Midwest or West (Table 1; Figure).
Women reported a higher prevalence of any disability (24.4%) than did men (19.8%), and also reported higher prevalences of each disability type. Prevalences of any disability and of each type were highest in either the oldest age group (≥65 years) or both the middle (45–64 years) and oldest age groups, with the exception of cognition, where the reported prevalence was highest among persons aged 45–64 years (12.0% versus 10.1% [18–44 years] and 9.9% [≥65 years]). Black, non-Hispanic adults reported the highest prevalences of any disability and of each disability type; the highest prevalence of disability in vision (7.4%) was the same among black, non-Hispanic adults and Hispanic adults. Compared with veterans, non-veterans reported a higher prevalence of disability in vision (4.7% versus 3.9%) and independent living (6.7% versus 5.9%). Respondents with higher household income levels and higher levels of education had lower prevalences of any dis-ability and of each disability type. Nearly 50% of adults with a household income of <$15,000 and 40% of adults who did not graduate from high school had any disability compared with only 10.8% of adults with a household income of ≥$50,000 and 11.8% of college graduates, respectively. Prevalence of any disability among unemployed adults was more than twice as high as it was among those who were employed. (33.5% versus 12.6%) (Table 2).
Discussion
In 2000, in the first report of state-based data on disability that was generated from the 1998 BRFSS data (1),** CDC described a median state-level disability prevalence of 17.1% in 11 states and DC. Since 2003, BRFSS has assessed disability†† in all participating states and territories using two questions regarding activity limitation and special equipment use. These questions, however, did not address the type of functional limitation or condition associated with the disability. In 2011, pursuant to Section 4302 of the Affordable Care Act,§§ the Department of Health and Human Services issued guidance for defining and collecting data on disability status using a standard set of questions. On the basis of this guidance,† BRFSS added five additional disability questions to the survey in 2013.*
In 2013, approximately one in five U.S. adults reported any disability, with state-level prevalence of any disability ranging from 16.4% in Minnesota to 31.5% in Alabama. Reasons behind state-level differences in disability are unclear; however, disability prevalence was generally higher in the South, a region noted to have one of the higher prevalences of social deter-minants of poor health (2,3), which are also associated with disability (2–4). The higher overall prevalence of disability in this report compared with the 2000 report might be explained, in part, by the use of different operational definitions of dis-ability, a true increase in prevalence in the 15 years since the 1998 survey, or the inclusion of all states and DC in this report.
Many findings in this study are consistent with earlier reports. Previous research found lower education levels among adults with a disability compared with those without (5); in this study, approximately 40% of those who did not complete high school reported any disability. Public health programs for persons with one or more disabilities might need to account for this, as lower health literacy has been associated with lower education levels (6). The most frequently reported disability type was mobility, which is consistent with other findings (7):
** Two questions from the 1998 BRFSS were used: “Are you limited in any way in any activities because of an impairment or health problem?” and “If you use special equipment or help from others to get around, what type do you use?”
†† The two questions included in the core BRFSS since 2003 are “Are you limited in any way in any activities because of physical, mental, or emotional problems?” and “Do you now have any health problem that requires you to use special equipment, such as a cane, a wheelchair, a special bed, or a special telephone?”
§§ Section 4302 of the Affordable Care Act states “…any federally conducted or supported health care or public health program, activity or survey (including Current Population Surveys and American Community Surveys conducted by the Bureau of Labor Statistics and the Bureau of the Census) collects and reports, to the extent practicable— ‘(A) data on race, ethnicity, sex, primary language, and disability status for applicants, recipients, or participants.’”

Morbidity and Mortality Weekly Report
780 MMWR / July 31, 2015 / Vol. 64 / No. 29
TABLE 1. Prevalence* of any disability and disability type,† by state,§ among adults aged ≥18 years — Behavioral Risk Factor Surveillance System, United States, 2013
State/TerritoryRespondents**
(No.)
Disability type¶
Vision Cognition Mobility Self-care Independent living Any
(%) (95% CI) (%) (95% CI) (%) (95% CI) (%) (95% CI) (%) (95% CI) (%) (95% CI)
Overall 465,053 (4.6) (4.5–4.7) (10.6) (10.4–10.8) (13.0) (12.8–13.2) (3.6) (3.5–3.7) (6.5) (6.4–6.7) (22.2) (21.9–22.4)Alabama 6,333 (7.5) (6.6–8.5) (16.3) (15.0–17.8) (20.6) (19.3–21.9) (5.3) (4.6–6.0) (10.1) (9.2–11.1) (31.5) (29.9–33.2)Alaska 4,429 (3.1) (2.5–3.9) (7.7) (6.6–9.1) (10.3) (9.1–11.6) (3.1) (2.5–3.9) (4.4) (3.7–5.3) (17.7) (16.1–19.4)Arizona 4,078 (4.8) (3.5–6.5) (10.9) (9.3–12.7) (12.4) (10.8–14.2) (3.7) (2.6–5.2) (6.9) (5.5–8.6) (21.8) (19.6–24.2)Arkansas 5,041 (7.2) (6.1–8.4) (16.8) (15.2–18.5) (18.0) (16.6–19.5) (5.3) (4.4–6.3) (9.1) (8.0–10.2) (30.0) (28.1–31.9)California 10,552 (5.4) (4.8–6.0) (9.8) (9.0–10.6) (11.4) (10.7–12.3) (3.4) (3.0–3.9) (5.6) (5.0–6.2) (20.9) (19.9–22.0)Colorado 12,687 (2.9) (2.5–3.3) (9.0) (8.3–9.7) (9.5) (8.9–10.1) (2.5) (2.2–2.9) (4.8) (4.3–5.3) (17.5) (16.7–18.4)Connecticut 7,411 (3.4) (2.7–4.2) (8.5) (7.5–9.7) (9.8) (9.0–10.6) (2.7) (2.2–3.2) (5.8) (5.0–6.7) (18.2) (16.9–19.6)Delaware 5,004 (4.1) (3.5–4.9) (9.9) (8.7–11.2) (12.1) (11.0–13.2) (3.1) (2.5–3.9) (5.9) (5.1–6.9) (20.2) (18.7–21.8)District of Columbia 4,683 (4.6) (3.7–5.6) (9.7) (8.4–11.3) (12.4) (11.1–13.7) (3.9) (3.2–4.8) (6.8) (5.9–7.9) (20.3) (18.6–22.1)Florida 32,652 (5.0) (4.5–5.6) (11.1) (10.3–12.0) (13.2) (12.5–14.0) (3.8) (3.4–4.3) (6.4) (5.8–7.0) (23.1) (22.0–24.2)Georgia 7,686 (5.0) (4.4–5.7) (10.6) (9.7–11.6) (14.2) (13.3–15.1) (3.5) (3.0–4.1) (6.2) (5.6–7.0) (23.0) (21.8–24.3)Hawaii 7,637 (3.6) (3.0–4.3) (7.6) (6.7–8.5) (9.1) (8.3–10.0) (1.9) (1.6–2.4) (5.1) (4.4–5.9) (17.5) (16.3–18.7)Idaho 5,440 (2.7) (2.2–3.3) (8.8) (7.8–10.0) (9.7) (8.8–10.7) (2.7) (2.1–3.3) (5.1) (4.4–5.9) (17.2) (15.9–18.6)Illinois 5,511 (3.9) (3.1–4.8) (8.3) (7.2–9.5) (10.9) (9.8–11.9) (2.8) (2.2–3.5) (5.5) (4.7–6.4) (19.1) (17.6–20.7)Indiana 9,966 (3.9) (3.5–4.4) (10.8) (10.0–11.7) (13.7) (12.9–14.6) (3.9) (3.4–4.4) (6.8) (6.2–7.4) (22.6) (21.5–23.7)Iowa 7,935 (3.4) (2.9–3.9) (9.3) (8.3–10.4) (11.0) (10.2–11.8) (2.9) (2.5–3.4) (5.1) (4.4–5.8) (19.2) (18.0–20.4)Kansas 22,781 (3.3) (3.1–3.6) (9.3) (8.8–9.8) (12.6) (12.2–13.1) (3.1) (2.9–3.4) (5.4) (5.1–5.7) (20.4) (19.8–21.0)Kentucky 10,536 (7.0) (6.2–7.8) (14.8) (13.7–15.9) (18.5) (17.5–19.6) (5.0) (4.4–5.7) (9.7) (8.8–10.6) (29.2) (27.8–30.5)Louisiana 5,128 (5.2) (4.5–6.1) (13.9) (12.3–15.7) (16.6) (15.3–18.0) (5.2) (4.3–6.3) (9.2) (8.0–10.5) (27.4) (25.5–29.4)Maine 7,911 (3.0) (2.5–3.7) (11.2) (10.1–12.4) (10.7) (9.8–11.6) (2.6) (2.2–3.1) (5.8) (5.1–6.6) (20.2) (19.0–21.6)Maryland 12,459 (3.2) (2.8–3.8) (9.3) (8.4–10.3) (11.7) (11.0–12.6) (3.0) (2.5–3.5) (5.6) (4.9–6.3) (19.9) (18.8–21.1)Massachusetts 14,200 (3.2) (2.8–3.7) (10.4) (9.5–11.4) (10.5) (9.8–11.3) (2.7) (2.3–3.1) (6.4) (5.8–7.2) (19.6) (18.5–20.7)Michigan 12,429 (4.7) (4.1–5.2) (12.0) (11.1–12.9) (14.8) (14.0–15.7) (4.4) (3.9–5.0) (7.5) (6.8–8.2) (24.6) (23.5–25.7)Minnesota 13,689 (2.8) (2.3–3.4) (7.7) (6.9–8.6) (8.5) (7.7–9.3) (2.1) (1.7–2.5) (4.4) (3.8–5.1) (16.4) (15.2–17.5)Mississippi 7,217 (8.1) (7.3–9.0) (15.7) (14.4–17.0) (20.7) (19.5–21.9) (6.2) (5.4–7.0) (10.8) (9.7–11.9) (31.4) (29.8–32.9)Missouri 6,940 (4.5) (3.8–5.3) (12.3) (11.1–13.6) (14.7) (13.6–15.9) (4.3) (3.7–5.0) (8.2) (7.3–9.3) (24.0) (22.5–25.6)Montana 9,485 (4.4) (3.9–5.0) (10.2) (9.3–11.1) (12.0) (11.1–12.9) (3.1) (2.6–3.7) (5.3) (4.7–6.0) (20.8) (19.6–21.9)Nebraska 16,605 (3.1) (2.8–3.6) (8.3) (7.6–9.0) (10.7) (10.1–11.5) (2.4) (2.0–2.8) (4.2) (3.8–4.7) (17.9) (17.0–18.9)Nevada 4,921 (4.5) (3.6–5.6) (12.0) (10.2–14.0) (13.2) (11.8–14.8) (3.1) (2.4–4.0) (6.1) (5.1–7.4) (23.7) (21.5–26.0)New Hampshire 6,214 (2.7) (2.2–3.3) (10.0) (8.9–11.2) (9.9) (9.0–10.9) (2.8) (2.2–3.5) (5.7) (4.9–6.6) (19.4) (17.9–20.9)New Jersey 12,486 (3.5) (3.1–4.0) (8.5) (7.7–9.3) (11.1) (10.4–11.9) (2.7) (2.4–3.0) (4.9) (4.4–5.5) (19.0) (18.0–20.0)New Mexico 9,025 (5.0) (4.5–5.6) (11.4) (10.5–12.3) (13.9) (13.0–14.8) (4.5) (3.9–5.2) (8.3) (7.5–9.2) (23.7) (22.5–25.0)New York 8,517 (4.5) (4.0–5.2) (10.1) (9.2–11.1) (12.9) (12.1–13.8) (3.5) (3.0–4.0) (6.7) (6.0–7.4) (22.1) (20.9–23.3)North Carolina 8,634 (4.8) (4.3–5.5) (11.5) (10.6–12.5) (14.9) (14.0–15.8) (4.3) (3.8–4.9) (7.5) (6.8–8.3) (24.3) (23.1–25.5)North Dakota 7,591 (2.9) (2.4–3.6) (6.9) (6.0–7.8) (10.0) (9.2–10.9) (2.3) (1.9–2.9) (4.4) (3.7–5.2) (16.5) (15.3–17.7)Ohio 11,417 (4.5) (3.9–5.1) (11.1) (10.2–12.0) (13.8) (12.9–14.7) (3.5) (3.0–4.0) (7.2) (6.5–8.0) (22.7) (21.6–24.0)Oklahoma 8,122 (6.2) (5.5–7.0) (14.5) (13.5–15.7) (17.5) (16.5–18.4) (4.7) (4.2–5.2) (8.6) (7.8–9.4) (28.2) (26.9–29.5)Oregon 5,741 (4.2) (3.5–5.1) (11.3) (10.1–12.5) (11.0) (10.0–12.1) (3.0) (2.5–3.6) (6.3) (5.4–7.2) (21.7) (20.2–23.2)Pennsylvania 11,022 (3.5) (3.0–4.0) (9.5) (8.7–10.3) (12.5) (11.7–13.2) (3.2) (2.8–3.7) (6.5) (5.9–7.1) (20.8) (19.8–21.9)Rhode Island 6,257 (4.1) (3.4–4.8) (12.1) (10.8–13.5) (12.6) (11.6–13.6) (3.1) (2.6–3.7) (7.1) (6.2–8.2) (23.0) (21.5–24.5)South Carolina 10,340 (5.8) (5.2–6.4) (13.0) (12.0–14.1) (15.6) (14.8–16.5) (4.2) (3.7–4.7) (6.9) (6.3–7.5) (25.5) (24.3–26.7)South Dakota 6,755 (2.9) (2.3–3.5) (6.9) (6.0–7.9) (11.1) (10.1–12.1) (2.3) (1.8–2.9) (4.3) (3.5–5.1) (17.9) (16.6–19.4)Tennessee 5,454 (7.5) (6.5–8.5) (16.1) (14.7–17.6) (19.9) (18.5–21.4) (5.7) (4.9–6.7) (9.9) (8.8–11.1) (31.4) (29.6–33.2)Texas 10,468 (5.0) (4.4–5.7) (9.5) (8.6–10.3) (13.1) (12.2–14.0) (3.7) (3.2–4.2) (6.2) (5.6–6.9) (21.9) (20.8–23.1)Utah 12,328 (3.0) (2.7–3.4) (9.6) (9.0–10.3) (10.0) (9.4–10.6) (2.3) (2.0–2.7) (4.2) (3.8–4.6) (18.9) (18.0–19.7)Vermont 6,186 (2.8) (2.3–3.4) (9.1) (8.1–10.3) (9.0) (8.2–9.7) (2.7) (2.2–3.2) (5.1) (4.4–5.9) (17.8) (16.6–19.2)Virginia 8,023 (4.4) (3.8–5.0) (8.9) (8.0–9.8) (11.7) (10.9–12.6) (3.1) (2.7–3.6) (5.6) (5.0–6.2) (19.6) (18.5–20.7)Washington 10,874 (4.0) (3.6–4.6) (11.2) (10.4–12.1) (12.3) (11.5–13.1) (3.7) (3.2–4.2) (6.2) (5.6–6.8) (22.1) (21.1–23.2)West Virginia 5,814 (6.3) (5.6–7.0) (15.0) (13.8–16.2) (18.8) (17.8–19.9) (5.0) (4.4–5.6) (10.2) (9.3–11.2) (29.8) (28.4–31.3)Wisconsin 6,207 (3.0) (2.4–3.8) (10.0) (8.7–11.4) (11.2) (10.0–12.5) (3.1) (2.5–3.9) (5.9) (5.0–7.0) (19.9) (18.3–21.6)Wyoming 6,232 (3.6) (3.1–4.3) (8.4) (7.4–9.5) (12.3) (11.2–13.4) (2.9) (2.3–3.6) (5.2) (4.5–6.0) (19.5) (18.1–20.9)
Abbreviation: CI = confidence interval. * Weighted estimates, age-adjusted to the 2000 U.S. standard population. † Respondents were asked, “Are you blind or do you have serious difficulty seeing, even when wearing glasses?” (vision disability); “Because of a physical, mental, or
emotional condition, do you have serious difficulty concentrating, remembering, or making decisions?” (cognition disability); “Do you have serious difficulty walking or climbing stairs?” (mobility disability); “Do you have difficulty dressing or bathing?” (self-care disability); and “Because of a physical, mental, or emotional condition, do you have difficulty doing errands alone such as visiting a doctor’s office or shopping?” (independent living disability). Respondents who refused to answer, reported “don’t know,” and other missing responses were excluded from the analyses.
§ Including the District of Columbia. ¶ Each disability type might not be independent; one respondent might have two or more disability types. ** Respondents with missing information on disability are not included; number of respondents in each demographic group in Table 2 might not add to this number.

Morbidity and Mortality Weekly Report
MMWR / July 31, 2015 / Vol. 64 / No. 29 781
the top two causes of disability are associated with physical or mobility limitations (arthritis, back and spine problems) and account for over 35% of all disability (8).
Disability prevalence has been shown to increase with age (5). Although the prevalences of any disability and disabilities in mobility and independent living increased with age, this was not the case for disabilities in vision, cognition and self-care. This observed association of any disability with increasing age might be because of disability in mobility; at 13%, this was the most frequently reported disability type, and disability in mobility increases with age. Prevalences of vision and self-care disability were similar for adults aged 45–64 years and adults aged ≥65 years. In contrast, the highest prevalence of disability in cognition was among adults aged 45–64 years. This could be accounted for, in part, by the exclusion from the survey of adults living in institutional settings, as older adults may be more likely to live in such settings (e.g., nursing homes) than younger adults. In addition, although underlying medical conditions are not ascertained in BRFSS, many middle-aged adults who indicated a limitation in cognition during develop-ment and testing of that question also reported having mental illness (9). Furthermore, among all disability types, the largest increases in prevalence occurred between persons aged 18–44 years and those aged 45–64 years (e.g., the prevalence of mobil-ity disability was more than three times higher among persons aged 45–64 years compared with those aged 18–44 years). Understanding the age profiles of different disability types can enhance the development of age- and disability-inclusive public health programs.
The findings in this report are subject to at least four limi-tations. First, all BRFSS data are self-reported and, therefore, might be subject to recall and social desirability bias. However, self-reporting is the most commonly used method for assess-ing disability for surveillance purposes. Second, nonresponse bias is possible because response rates among the states and DC ranged from 29.0% to 59.2% (median: 45.9%). Third, because three of the disability questions include the modifier “serious,” they might not identify respondents with more moderate limitations or who do not perceive their disabilities to be serious. Finally, BRFSS does not include adults living in institutional settings or group homes, which might systemati-cally exclude persons with disabilities, since persons residing in these settings might be more likely to have a disability. Because these last two limitations can result in an underestimation of the disability prevalence and profile among all U.S. adults, the estimates reported here are likely to be conservative.
Disability has been associated with health disparities in behavioral risk factors (e.g., smoking and physical inactivity) and preventive health measures (e.g., mammography) (4). Maintaining health among people with disabilities is impor-tant, as annual disability-associated health care expenditures were estimated at nearly $400 billion in 2006, with over half
FIGURE. Prevalence* of any disability among adults aged ≥18 years — Behavioral Risk Factor Surveillance System, United States, 2013
20.5–23.119.1–20.4
23.2–31.5
16.4–19.0
DC
Abbreviation: DC = District of Columbia.* Weighted estimates, age-adjusted to the 2000 U.S. standard population.
SummaryWhat is already known on this topic?
Disability has been measured in numerous ways in national health surveys. CDC previously used 1998 BRFSS data to report disability prevalence in 11 states and the District of Columbia (DC). The median disability prevalence, using a nonspecific definition of disability, was 17.1%.
What is added by this report?
Five questions added to the 2013 BRFSS were used to measure functional disability type in the 50 states and DC. Overall prevalence of any disability was 22.2%; the most frequently reported disability types were mobility (mean = 13.0%) and cognition (mean = 10.6%). In general, disability prevalences were higher among women, adults ≥65 years of age, racial/ethnic minorities, persons with annual household incomes <$15,000 per year, and those who had less than a high school education.
What are the implications for public health practice?
More than 53 million U.S. adults reported a disability in 2013. Since disability among adults is associated with disparities in behavioral risk factors for health (e.g., smoking and physical inactivity), more specific information on disability and disability types will inform public health researchers and program planners to better understand the relationships between disability, demographic factors, and health status to identify and address barriers to more effective interventions.

Morbidity and Mortality Weekly Report
782 MMWR / July 31, 2015 / Vol. 64 / No. 29
attributable to costs related to non-independent living (e.g., institutional care, personal care services) (10). The ability of state programs to address these and other important public health needs among adults with disabilities has possibly been hindered by a lack of information on specific disability types. Having information about disability types, the demographic profiles of persons with different disability types, and health disparities associated with disabilities¶¶ will better enable
researchers and program planners to make more focused, data-driven decisions and modify existing interventions to more effectively improve the health of persons with disabilities. 1Division of Human Development and Disability, National Center on Birth
Defects and Developmental Disabilities, CDC; 2Commissioned Corps, U.S. Public Health Service, CDC.
Corresponding author: Elizabeth Courtney-Long, [email protected], 404-498-0264.
¶¶ Disability and Health Data System (http://dhds.cdc.gov/), an online, interactive data tool developed and maintained by CDC on the health of adults with disabilities, will incorporate state-level health data by disability type in an upcoming update of the site.
TABLE 2. Prevalence* of any disability and disability type† by select sociodemographic characteristics among adults aged ≥18 years — Behavioral Risk Factor Surveillance System, United States, 2013
CharacteristicRespondents§
(No.)
Type of disability¶
Vision Cognition Mobility Self-care Independent living Any
(%) (95% CI) (%) (95% CI) (%) (95% CI) (%) (95% CI) (%) (95% CI) (%) (95% CI)
SexMale 190,711 (4.2) (4.0–4.4) (9.3) (9.1–9.6) (11.3) (11.0–11.5) (3.5) (3.3–3.7)** (5.0) (4.8–5.2) (19.8) (19.4–20.1)Female 274,342 (5.0) (4.9–5.2) (11.9) (11.6–12.2) (14.6) (14.3–14.9) (3.7) (3.5–3.8) (7.9) (7.7–8.1) (24.4) (24.1–24.8)
Age group (yrs)††
18–44 129,528 (2.9) (2.7–3.1) (10.1) (9.8–10.4) (5.5) (5.2–5.7) (1.9) (1.8–2.0) (4.4) (4.2–4.6) (15.7) (15.3–16.0)45–64 181,941 (6.5) (6.2–6.7) (12.0) (11.7–12.3) (18.2) (17.8–18.5) (5.6) (5.4–5.8) (8.4) (8.1–8.7) (26.2) (25.8–26.6)≥65 153,584 (6.6) (6.3–6.9) (9.9) (9.5–10.2) (27.4) (27.0–27.9) (5.3) (5.1–5.5) (9.8) (9.5–10.1) (35.5) (35.0–36.0)
Race/EthnicityWhite/Non-Hispanic 363,854 (3.6) (3.5–3.7) (10.1) (9.9–10.3) (12.0) (11.8–12.2) (3.1) (3.0–3.2) (6.1) (5.9–6.2) (20.6) (20.3–20.9)Black/Non-Hispanic 37,105 (7.4) (6.9–7.9) (13.3) (12.7–14.0) (18.7) (18.0–19.4) (5.7) (5.3–6.1) (9.2) (8.7–9.7) (29.0) (28.1–29.9)Hispanic 29,371 (7.4) (6.8–8.0) (12.1) (11.5–12.8) (14.6) (13.8–15.3) (4.7) (4.2–5.1) (7.3) (6.8–7.9) (25.9) (25.0–26.8)Other/Non-Hispanic 27,632 (5.5) (4.8–6.3) (10.2) (9.4–11.1) (11.8) (10.9–12.7) (3.4) (3.0–3.9) (6.4) (5.7–7.1) (21.1) (20.0–22.3)
Veteran statusVeteran 58,713 (3.9) (3.5–4.2) (10.8) (10.2–11.5)** (13.4) (12.8–14.0)** (3.8) (3.4–4.2)** (5.9) (5.4–6.4) (22.1) (21.3–22.9)Non-veteran 406,010 (4.7) (4.6–4.9) (10.6) (10.4–10.8) (13.1) (12.9–13.3) (3.6) (3.5–3.7) (6.7) (6.5–6.8) (22.3) (22.0–22.5)
Annual household income<$15,000 47,828 (12.4) (11.8–13.0) (26.1) (25.3–27.0) (29.2) (28.5–30.0) (10.1) (9.6–10.6) (18.1) (17.4–18.8) (46.9) (46.0–47.9)$15,000–<$25,000 72,390 (7.3) (6.9–7.8) (16.0) (15.5–16.6) (20.1) (19.5–20.6) (5.7) (5.4–6.0) (9.9) (9.5–10.4) (33.0) (32.3–33.7)$25,000–<$35,000 46,740 (4.6) (4.2–5.1) (10.2) (9.6–10.8) (14.1) (13.5–14.7) (3.6) (3.2–4.0) (6.1) (5.6–6.5) (23.6) (22.8–24.4)$35,000–<$50,000 59,235 (3.2) (2.9–3.6) (7.4) (7.0–8.0) (10.1) (9.7–10.6) (2.3) (2.1–2.5) (4.2) (3.9–4.6) (17.7) (17.0–18.3)$50,000+ 176,210 (1.7) (1.6–1.9) (4.3) (4.1–4.5) (5.9) (5.7–6.1) (1.2) (1.1–1.3) (2.2) (2.0–2.3) (10.8) (10.5–11.1)
Employment statusEmployed 230,472 (2.5) (2.3–2.6) (5.6) (5.4–5.8) (6.0) (5.8–6.2) (1.0) (0.9–1.1) (1.7) (1.6–1.9) (12.6) (12.3–12.9)Unemployed 24,661 (7.2) (6.5–8.0) (18.2) (17.2–19.2) (17.2) (16.3–18.2) (4.8) (4.2–5.4) (9.6) (8.8–10.5) (33.5) (32.3–34.7)Retired/Student/Homemaker
172,389 (4.0) (3.7–4.4) (9.4) (9.0–9.9) (11.8) (11.5–12.2) (2.4) (2.3–2.6) (5.4) (5.1–5.7) (21.2) (20.6–21.8)
Unable to work 35,690 (19.1) (18.0–20.3) (48.3) (46.8–49.7) (60.8) (59.4–62.2) (26.9) (25.6–28.2) (45.4) (44.0–46.8) (82.6) (81.3–83.8)
Education level§§
<High school 36,615 (10.8) (10.1–11.4) (19.9) (19.1–20.7) (25.8) (24.9–26.6) (8.0) (7.5–8.5) (13.5) (12.9–14.2) (39.8) (38.8–40.8)High school 125,901 (5.4) (5.1–5.7) (12.1) (11.7–12.5) (16.3) (15.9–16.7) (4.4) (4.2–4.7) (7.9) (7.6–8.2) (26.0) (25.5–26.5)Some college 118,275 (4.0) (3.8–4.3) (10.2) (9.9–10.6) (14.0) (13.6–14.4) (3.8) (3.6–4.0) (6.7) (6.5–7.0) (22.9) (22.4–23.3)College graduate 157,878 (2.0) (1.9–2.1) (4.3) (4.1–4.5) (7.1) (6.9–7.3) (1.6) (1.5–1.8) (3.0) (2.9–3.2) (11.8) (11.5–12.1)
Abbreviation: CI = confidence interval. * Weighted estimates, age-adjusted to the 2000 U.S. standard population. † Respondents were asked, “Are you blind or do you have serious difficulty seeing, even when wearing glasses?” (vision disability); “Because of a physical, mental, or emotional condition, do you
have serious difficulty concentrating, remembering, or making decisions?” (cognition disability); “Do you have serious difficulty walking or climbing stairs?” (mobility disability); “Do you have difficulty dressing or bathing?” (self-care disability); and “Because of a physical, mental, or emotional condition, do you have difficulty doing errands alone such as visiting a doctor’s office or shopping?” (independent living disability). Respondents who refused to answer, reported “don’t know,” and other missing responses were excluded from the analyses.
§ Respondents with missing information on disability are not included; all groups might not add to the same total number or the overall number in Table 1. ¶ Each disability type might not be independent; one respondent might have two or more disability types. ** Groups not significantly different with p-value ≥0.05 determined by two-sided chi-square test. All other group comparisons were statistically significantly different with p-values <0.05. †† Estimates not age-adjusted. §§ Limited to respondents aged ≥25 years.
Morbidity and Mortality Weekly Report
MMWR / July 31, 2015 / Vol. 64 / No. 29 783
References 1. CDC. State-specific prevalence of disability among adults—11 states
and the District of Columbia, 1998. MMWR Morb Mortal Wkly Rep 2000;49:711–4.
2. Beckles GL, Truman BI. Education and Income—United States, 2009 and 2011. MMWR Surveill Summ 62(Suppl 3):9–19. Available at http://www.cdc.gov/mmwr/preview/mmwrhtml/su6203a3.htm?s_cid=su6203a3_w.
3. National Center for Health Statistics. Health, United States, 2014: with special feature on adults aged 55–64. Hyattsville, MD: National Center for Health Statistics, CDC; 2015. Available at http://www.cdc.gov/nchs/data/hus/hus14.pdf.
4. Pharr JR, Bungum T. Health disparities experienced by people with disabilities in the United States: a Behavioral Risk Factor Surveillance System study. Glob J Health Sci 2012;4:99–108.
5. Brault MW. Americans with disabilities: 2010. Washington, DC: Census Bureau; 2012. Current Population Report P70–131. Available at http://www.census.gov/prod/2012pubs/p70-131.pdf.
6. Stewart DW, Adams CE, Cano MA, et al. Associations between health literacy and established predictors of smoking cessation. Am J Public Health 2013;103:e43–9.
7. Carroll DD, Courtney-Long EA, Stevens AC, et al. Vital signs: disability and physical activity—United States, 2009–2012. MMWR Morb Mortal Wkly Rep 2014;63:407–13.
8. CDC. Prevalence and most common causes of disability among adults—United States, 2005. MMWR Morb Mortal Wkly Rep 2009;58:421–6.
9. Miller K, DeMaio TM. Report of cognitive research on proposed American Community Survey disability questions. Washington, DC: National Center for Health Statistics, CDC; Census Bureau; 2006. Survey Methodology Report #2006–6. Available at https://www.census.gov/srd/papers/pdf/ssm2006-06.pdf.
10. Anderson WL, Wiener JM, Finkelstein EA, Armour BS. Estimates of national health care expenditures associated with disability. 2011. J Disabil Policy Stud 2011;21:230–40.

Morbidity and Mortality Weekly Report
784 MMWR / July 31, 2015 / Vol. 64 / No. 29
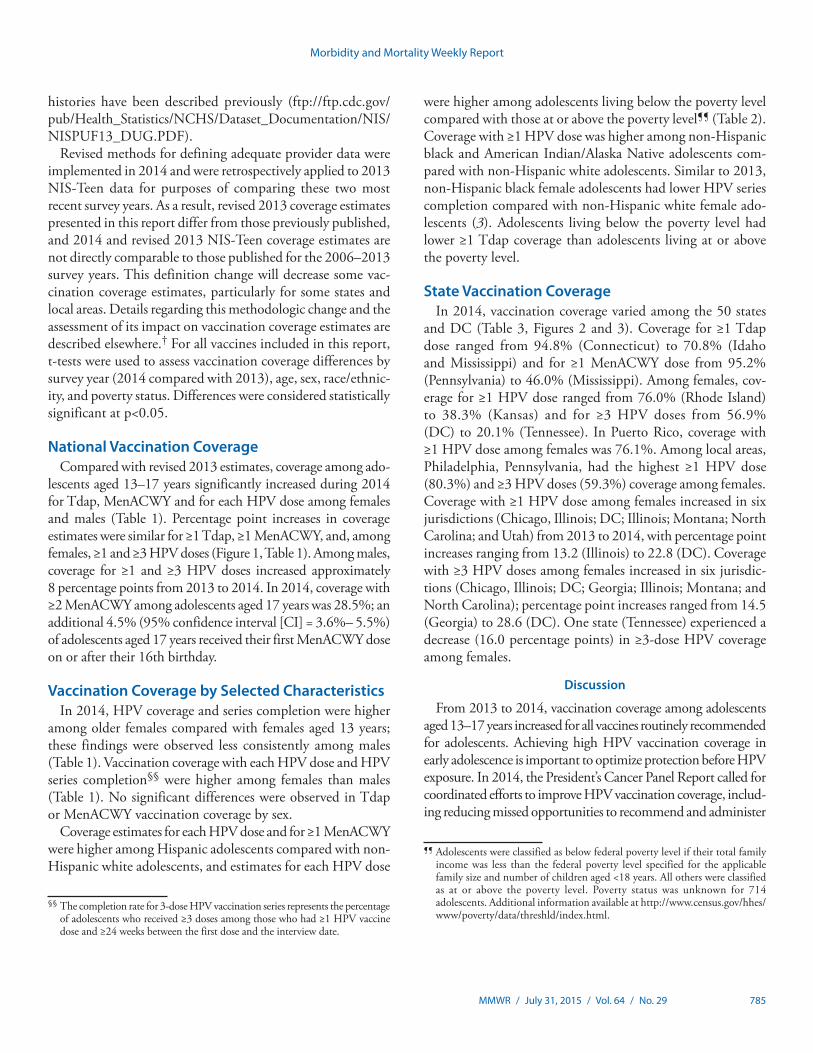
Routine immunization is recommended for adolescents aged 11–12 years by the Advisory Committee on Immunization Practices (ACIP) for protection against diseases including pertussis, meningococcal disease, and human papillomavirus (HPV)–associated cancers (1). To assess vaccination coverage among adolescents, CDC analyzed data collected regarding 20,827 adolescents through the 2014 National Immunization Survey–Teen (NIS-Teen).* From 2013 to 2014, coverage among adolescents aged 13–17 years increased for all routinely recommended vaccines: from 84.7% to 87.6% for ≥1 tetanus-diphtheria-acellular pertussis (Tdap) vaccine dose, from 76.6% to 79.3% for ≥1 meningococcal conjugate (MenACWY) vaccine dose, from 56.7% to 60.0% and from 33.6% to 41.7% for ≥1 HPV vaccine dose among females and males, respectively.†
Coverage differed by state and local area. Despite overall progress in vaccination coverage among adolescents, HPV vaccination coverage continues to lag behind Tdap and MenACWY cover-age at state and national levels. Seven public health jurisdictions achieved significant increases in ≥1- or ≥3-dose HPV vaccination coverage among females in 2014, demonstrating that substantial improvement in HPV vaccination coverage is feasible.
NIS-Teen monitors vaccination coverage among adolescents aged 13–17 years in the 50 states, District of Columbia (DC), selected local areas, and territories§ using a random-digit–dialed sample of landline and cell phone numbers.¶ NIS-Teen occurs in two phases: 1) a telephone interview with an adoles-cent’s parent or guardian, during which sociodemographic and vaccination provider contact information is collected and, after receiving consent, 2) a mailed questionnaire to identified vac-cination providers to obtain immunization information from medical records.** Coverage estimates are based on provider-reported vaccination histories for adolescents with adequate provider data. In 2014, national estimates included information from 20,827 adolescents (10,084 females and 10,743 males).†† Details regarding NIS-Teen methodology, including methods for weighting and synthesizing provider-reported vaccination
National, Regional, State, and Selected Local Area Vaccination Coverage Among Adolescents Aged 13–17 Years — United States, 2014
Sarah Reagan-Steiner, MD1; David Yankey, MS1; Jenny Jeyarajah, MS1; Laurie D. Elam-Evans, PhD1; James A. Singleton, PhD1; C. Robinette Curtis, MD1; Jessica MacNeil, MPH2; Lauri E. Markowitz, MD3; Shannon Stokley, MPH1 (Author affiliations at end of text)
* Eligible participants were born during January 1996–February 2002. Except as noted, coverage estimates for ≥1 and ≥2 varicella vaccine doses were obtained among persons with no history of varicella disease. HPV vaccination coverage does not distinguish between bivalent (2vHPV) or quadrivalent (4vHPV) vaccines. Although the nine-valent HPV vaccine was licensed in December 2014 and routinely recommended by ACIP in February 2015 (2), the vaccine was not distributed until 2015 and therefore was not administered to adolescents in 2014. Some adolescents, both males and females, might have received more than the 3 recommended HPV vaccine doses. Influenza vaccination coverage data are not included in this report but are available online at http://www.cdc.gov/flu/fluvaxview/index.htm.
† NIS-Teen 2013 estimates provided in this report differ from those previously published (3). In 2014, NIS-Teen implemented a revised adequate provider data (APD) definition. For 2014 NIS-Teen and future surveys, any adolescent for whom one or more providers report vaccination history data or who by parental report are completely unvaccinated will be classified as having APD. Adolescents meeting either of these criteria will be included in the NIS-Teen sample and will contribute to vaccination coverage estimates. Before 2014, the APD definition was more restrictive. Adolescents had to meet one or more of the following criteria: 1) if the parent/guardian used a shot card during the household interview: have at least as many doses of measles-containing, varicella, hepatitis A, hepatitis B, and Td/Tdap vaccines by provider report as reported in the household interview, or, if a shot card was not used during the household interview: the parent/guardian indicated that the adolescent had received all vaccinations in any of the measles-containing, varicella, hepatitis A, or hepatitis B categories and the adolescent had two or more unique vaccination dates by provider report; 2) be up-to-date by provider report with ≥1 Td/Tdap, ≥3 hepatitis B, ≥2 MMR, and ≥1 varicella vaccine doses (or parental/provider report of varicella disease history); or 3) be completely unvaccinated by parental report. Questions about MMR, varicella, hepatitis A, and hepatitis B vaccines were removed from the household questionnaire in 2014. Thus, comparisons of household and provider-reported vaccination history were no longer possible for these vaccines. For this report, the revised APD definition was applied retrospectively to 2013 NIS-Teen data, resulting in 684 additional adolescents being included in the 2013 NIS-Teen sample for the United States, excluding territories, for a total of 18,948 adolescents. Additional information on implementation of the revised APD definition and an assessment of impact on vaccination coverage estimates are available at http://www.cdc.gov/vaccines/imz-managers/coverage/nis/teen/apd-report.html.
§ Local areas that received Federal Section 317 immunization funds were sampled separately: Chicago, Illinois; New York, New York; Philadelphia County, Pennsylvania; Bexar County, Texas; and Houston, Texas. One local area (El Paso County, Texas) was oversampled. One territory (Puerto Rico) was sampled separately.
¶ All identified cell phone households were eligible for interview. Sampling weights were adjusted for dual-frame (landline and cell phone), nonresponse, noncoverage, and overlapping samples of mixed telephone users. A description of NIS-Teen dual-frame survey methodology and its effect on reported vaccination estimates is available at http://www.cdc.gov/vaccines/imz-managers/coverage/nis/child/dual-frame-sampling.html.
** The Council of American Survey Research Organizations (CASRO) response rates for the landline and cell phone samples were 60.3% and 31.2%, respectively. For completed interviews in the states and local areas, 11,243 landline calls (57.1%) and 9,584 cell phone calls (52.3%) had adequate provider data. Overall, 54% of completed interviews with adequate provider data were from landlines, and 46% were from cell phones. For Puerto Rico, the landline and cell phone sample CASRO rates were 56.6% and 35.2%, respectively. The CASRO response rate is the product of three other rates: 1) the resolution rate (the proportion of telephone numbers that can be identified as either for business or residence); 2) the screening rate (the proportion of qualified households that complete the screening process); and 3) the cooperation rate (the proportion of contacted eligible households for which a completed interview is obtained).
†† Adolescents from Puerto Rico (107 females and 123 males) were excluded from the national estimates.
Morbidity and Mortality Weekly Report
MMWR / July 31, 2015 / Vol. 64 / No. 29 785
histories have been described previously (ftp://ftp.cdc.gov/pub/Health_Statistics/NCHS/Dataset_Documentation/NIS/NISPUF13_DUG.PDF).
Revised methods for defining adequate provider data were implemented in 2014 and were retrospectively applied to 2013 NIS-Teen data for purposes of comparing these two most recent survey years. As a result, revised 2013 coverage estimates presented in this report differ from those previously published, and 2014 and revised 2013 NIS-Teen coverage estimates are not directly comparable to those published for the 2006–2013 survey years. This definition change will decrease some vac-cination coverage estimates, particularly for some states and local areas. Details regarding this methodologic change and the assessment of its impact on vaccination coverage estimates are described elsewhere.† For all vaccines included in this report, t-tests were used to assess vaccination coverage differences by survey year (2014 compared with 2013), age, sex, race/ethnic-ity, and poverty status. Differences were considered statistically significant at p<0.05.
National Vaccination CoverageCompared with revised 2013 estimates, coverage among ado-
lescents aged 13–17 years significantly increased during 2014 for Tdap, MenACWY and for each HPV dose among females and males (Table 1). Percentage point increases in coverage estimates were similar for ≥1 Tdap, ≥1 MenACWY, and, among females, ≥1 and ≥3 HPV doses (Figure 1, Table 1). Among males, coverage for ≥1 and ≥3 HPV doses increased approximately 8 percentage points from 2013 to 2014. In 2014, coverage with ≥2 MenACWY among adolescents aged 17 years was 28.5%; an additional 4.5% (95% confidence interval [CI] = 3.6%– 5.5%) of adolescents aged 17 years received their first MenACWY dose on or after their 16th birthday.
Vaccination Coverage by Selected CharacteristicsIn 2014, HPV coverage and series completion were higher
among older females compared with females aged 13 years; these findings were observed less consistently among males (Table 1). Vaccination coverage with each HPV dose and HPV series completion§§ were higher among females than males (Table 1). No significant differences were observed in Tdap or MenACWY vaccination coverage by sex.
Coverage estimates for each HPV dose and for ≥1 MenACWY were higher among Hispanic adolescents compared with non-Hispanic white adolescents, and estimates for each HPV dose
were higher among adolescents living below the poverty level compared with those at or above the poverty level¶¶ (Table 2). Coverage with ≥1 HPV dose was higher among non-Hispanic black and American Indian/Alaska Native adolescents com-pared with non-Hispanic white adolescents. Similar to 2013, non-Hispanic black female adolescents had lower HPV series completion compared with non-Hispanic white female ado-lescents (3). Adolescents living below the poverty level had lower ≥1 Tdap coverage than adolescents living at or above the poverty level.
State Vaccination CoverageIn 2014, vaccination coverage varied among the 50 states
and DC (Table 3, Figures 2 and 3). Coverage for ≥1 Tdap dose ranged from 94.8% (Connecticut) to 70.8% (Idaho and Mississippi) and for ≥1 MenACWY dose from 95.2% (Pennsylvania) to 46.0% (Mississippi). Among females, cov-erage for ≥1 HPV dose ranged from 76.0% (Rhode Island) to 38.3% (Kansas) and for ≥3 HPV doses from 56.9% (DC) to 20.1% (Tennessee). In Puerto Rico, coverage with ≥1 HPV dose among females was 76.1%. Among local areas, Philadelphia, Pennsylvania, had the highest ≥1 HPV dose (80.3%) and ≥3 HPV doses (59.3%) coverage among females. Coverage with ≥1 HPV dose among females increased in six jurisdictions (Chicago, Illinois; DC; Illinois; Montana; North Carolina; and Utah) from 2013 to 2014, with percentage point increases ranging from 13.2 (Illinois) to 22.8 (DC). Coverage with ≥3 HPV doses among females increased in six jurisdic-tions (Chicago, Illinois; DC; Georgia; Illinois; Montana; and North Carolina); percentage point increases ranged from 14.5 (Georgia) to 28.6 (DC). One state (Tennessee) experienced a decrease (16.0 percentage points) in ≥3-dose HPV coverage among females.
Discussion
From 2013 to 2014, vaccination coverage among adolescents aged 13–17 years increased for all vaccines routinely recommended for adolescents. Achieving high HPV vaccination coverage in early adolescence is important to optimize protection before HPV exposure. In 2014, the President’s Cancer Panel Report called for coordinated efforts to improve HPV vaccination coverage, includ-ing reducing missed opportunities to recommend and administer
§§ The completion rate for 3-dose HPV vaccination series represents the percentage of adolescents who received ≥3 doses among those who had ≥1 HPV vaccine dose and ≥24 weeks between the first dose and the interview date.
¶¶ Adolescents were classified as below federal poverty level if their total family income was less than the federal poverty level specified for the applicable family size and number of children aged <18 years. All others were classified as at or above the poverty level. Poverty status was unknown for 714 adolescents. Additional information available at http://www.census.gov/hhes/www/poverty/data/threshld/index.html.

Morbidity and Mortality Weekly Report
786 MMWR / July 31, 2015 / Vol. 64 / No. 29
HPV vaccine at every clinical opportunity, increasing parents’ and adolescents’ acceptance of HPV vaccine, and maximizing access to HPV vaccination services (4).
After experiencing no progress in national HPV vaccina-tion coverage among females aged 13–17 years from 2011 to 2012, coverage increased modestly in 2013, and an additional 3.3 percentage points in 2014 (3,5). Five states, DC, and one local area experienced large, significant increases in ≥1- or ≥3-dose HPV vaccination coverage among females, including four (Chicago, DC, Georgia, and Utah) of the 11 jurisdictions
that received resources in 2013 through the Prevention and Public Health Fund from CDC to conduct activities to improve HPV vaccination coverage (6).
In six of the seven jurisdictions with increases in ≥1- or ≥3-dose HPV coverage among females, combinations of strat-egies were important. Immunization programs highlighted incorporating HPV vaccination in cancer control plans, joint initiatives with cancer prevention and immunization stakehold-ers, public communication campaigns, immunization informa-tion system–based reminder/recall, assessment and feedback
TABLE 1. Estimated vaccination coverage with selected vaccines and doses among adolescents aged 13–17* years, by age at interview — National Immunization Survey–Teen (NIS-Teen), United States, 2014
Vaccine
Age at interview (yrs) (2014) Total (adolescents aged 13–17 yrs)
13 (n = 4,292) % (95% CI)
14 (n = 4,329) % (95% CI)
15 (n = 4,143) % (95% CI)
16 (n = 4,215) % (95% CI)
17 (n = 3,848) % (95% CI)
2014 (n = 20,827) % (95% CI)
2013†
(n = 18,948) % (95% CI)
Tdap§ ≥1 dose 87.5 (±2.1) 89.1 (±1.6) 88.3 (±1.9) 86.9 (±2.1) 86.3 (±2.0) 87.6 (±0.9)¶ 84.7 (±1.0)MenACWY** ≥1 dose 78.0 (±2.5) 81.0 (±2.1) 79.2 (±2.5) 79.4 (±2.5) 78.8 (±2.5) 79.3 (±1.1)¶ 76.6 (±1.1)MenACWY ≥2 doses — — — — 28.5 (±2.8)†† — —HPV§§ vaccine coverage by dosesFemales
≥1 dose 51.1 (±4.1) 56.6 (±3.9) 61.0 (±4.3)¶¶ 64.4 (±4.1)¶¶ 66.5 (±4.4)¶¶ 60.0 (±1.9)¶ 56.7 (±1.9)≥2 doses 40.1 (±4.0) 46.4 (±4.0)¶¶ 51.6 (±4.3)¶¶ 55.7 (±4.2)¶¶ 57.6 (±4.7)¶¶ 50.3 (±1.9)¶ 46.9 (±1.9)≥3 doses 26.2 (±3.6) 35.9 (±3.9)¶¶ 41.2 (±4.2)¶¶ 43.8 (±4.1)¶¶ 51.0 (±4.7)¶¶ 39.7 (±1.9)¶ 36.8 (±1.9)
Males≥1 dose 38.9 (±4.2) 42.6 (±4.0) 45.7 (±4.1)¶¶ 40.0 (±4.0) 41.8 (±4.1) 41.7 (±1.8)¶ 33.6 (±1.8)≥2 doses 27.1 (±3.9) 30.9 (±3.8) 35.8 (±4.1)¶¶ 31.2 (±3.8) 32.6 (±4.0) 31.4 (±1.7)¶ 22.6 (±1.6)≥3 doses 16.2 (±3.3) 20.9 (±3.5) 24.9 (±4.0)¶¶ 22.9 (±3.5)¶¶ 23.3 (±3.7)¶¶ 21.6 (±1.6)¶ 13.4 (±1.3)
HPV vaccine 3-dose series completion***
Females 56.1 (±6.3) 66.8 (±5.2)¶¶ 70.3 (±5.0)¶¶ 70.8 (±5.2)¶¶ 78.3 (±5.4)¶¶ 69.3 (±2.4) 69.8 (±2.5)Males 47.1 (±7.6) 56.6 (±6.6) 58.1 (±6.6)¶¶ 64.7 (±6.1)¶¶ 61.7 (±6.6)¶¶ 57.8 (±3.0)¶ 48.2 (±3.9)MMR ≥2 doses 90.2 (±1.8) 91.1 (±1.6) 91.2 (±1.6) 90.2 (±1.9) 90.9 (±1.6) 90.7 (±0.8) 89.6 (±0.9)HepB ≥3 doses 91.3 (±1.8) 91.7 (±1.5) 92.5 (±1.4) 90.2 (±2.0) 91.4 (±1.5) 91.4 (±0.7) 91.3 (±0.8)Varicella vaccineHistory of varicella††† 13.7 (±2.0) 17.8 (±2.4)¶¶ 20.2 (±2.4)¶¶ 24.2 (±2.6)¶¶ 29.3 (±2.8)¶¶ 21.0 (±1.1)¶ 25.2 (±1.1)Among adolescents with no history of varicella≥1 dose vaccine 95.6 (±1.3) 95.7 (±1.2) 95.6 (±1.1) 95.1 (±1.2) 93.6 (±1.5) 95.2 (±0.6)¶ 93.5 (±0.9)≥2 doses vaccine 83.1 (±2.4) 81.9 (±2.3) 81.1 (±2.6) 81.0 (±2.6) 77.1 (±3.1)¶¶ 81.0 (±1.2)¶ 76.8 (±1.3)History of varicella or
received ≥2 doses varicella vaccine
85.4 (±2.1) 85.1 (±1.9) 85.0 (±2.1) 85.6 (±2.0) 83.8 (±2.3) 85.0 (±0.9)¶ 82.7 (±1.0)
Abbreviations: CI = confidence interval; Tdap = tetanus-diphtheria-acellular pertussis vaccine; MenACWY = meningococcal conjugate vaccine; HPV = human papillomavirus; MMR = measles, mumps, and rubella vaccine; HepB = hepatitis B vaccine. * Adolescents (N = 20,827) in the 2014 NIS-Teen were born during the period January 1996–February 2002. † Revised estimates for overall NIS-Teen data for 2013 were provided as a comparison to overall 2014 NIS-Teen data. A revised adequate provider data definition
was implemented in 2014 NIS-Teen, and estimates might not be directly comparable to those previously published. For comparative purposes, 2013 estimates included in this table have been calculated by retrospectively applying the revised adequate provider data definition to 2013 NIS-Teen data and, as a result, will differ from those previously published.
§ Includes percentages receiving Tdap at or after age 10 years. ¶ Statistically significant difference (p<0.05) compared with 2013 NIS-Teen estimates. ** Includes percentages receiving MenACWY or meningococcal-unknown type vaccine. †† ≥2 doses of MenACWY or meningococcal-unknown type vaccine. Calculated only among adolescents who were aged 17 years at time of interview. Does not
include adolescents who received 1 dose of MenACWY vaccine at or after age 16 years. §§ HPV vaccine, either quadrivalent (4vHPV) or bivalent (2vHPV). Although only 4vHPV was recommended for use in males in 2014, some might have received 2vHPV.
In 2014 data, percentage was reported among 10,084 females and 10,743 males. In 2013 data, percentage was reported among 9,042 females and 9,906 males. Some adolescents might have received more than the 3 recommended HPV vaccine doses.
¶¶ Statistically significant difference (p<0.05) in estimated vaccination coverage by age; reference group was adolescents aged 13 years. *** The completion rate for the 3-dose HPV vaccination series represents the percentage of adolescents who received ≥3 HPV doses among those who had ≥1 HPV
vaccine dose with at least 24 weeks between the first dose and the interview date. The denominator for this calculation was limited to 5,703 females and 3,935 males in 2014 and 4,704 females and 2,623 males in 2013 who received their first HPV dose and had enough time to receive the third HPV dose.
††† By parent/guardian report or provider records.

Morbidity and Mortality Weekly Report
MMWR / July 31, 2015 / Vol. 64 / No. 29 787
activities (including clinician-to-clinician educational sessions emphasizing providing strong vaccination recommendations at ages 11–12 years), practice-focused strategies to educate staff and provide input on how to improve routine HPV vaccina-tion within the practice, and using all opportunities to educate clinicians and parents about the importance of on-time HPV vaccination. These experiences are informing development of best practices for improving HPV vaccination coverage. At the start of 2014, only two jurisdictions had school requirements for HPV vaccination, both with broad exemption provisions (http://www.immunize.org/laws). In late 2014, DC expanded its existing school requirement for HPV vaccination to include
males and females through 12th grade, with a requirement for submitting exemption forms annually (http://www.dcregs.dc.gov/Gateway/NoticeHome.aspx?NoticeID=5225019).
Some providers delay strongly recommending HPV vaccine until older adolescence (7). A comparison of age-specific HPV vaccination coverage estimates from 2013 and 2014 showed no improvement in coverage among females aged 13 years, although coverage among males aged 13 years did increase by 6.5 percentage points. Clinician resources to facilitate age-appropriate recommendation and administration of HPV vaccine are available at http://www.cdc.gov/vaccines/who/teens/for-hcp/hpv-resources.html. Changes in clinical
FIGURE 1. Estimated vaccination coverage with selected vaccines and doses among adolescents aged 13–17 years, by survey year — National Immunization Survey–Teen, United States, 2006–2014
0
10
20
30
40
50
60
70
80
90
100
2006 2007 2008 2009 2010 2011 2012 2013 2014
% v
acci
nate
d
Survey year
Tdap*≥1 MenACWY†
≥2 MenACWY§
≥1 HPV (females)¶
≥3 HPV (females)¶
≥1 HPV (males)**≥3 HPV (males)**
Revised APD de�nition††
Abbreviations: Tdap = tetanus toxoid, reduced diphtheria toxoid, and acellular pertussis; MenACWY = meningococcal conjugate; HPV = human papillomavirus; ACIP = Advisory Committee on Immunization Practices; APD = adequate provider data. * ≥1 dose Tdap vaccine at or after age 10 years. † ≥1 dose MenACWY or meningococcal-unknown type vaccine. § ≥2 doses MenACWY or meningococcal-unknown type vaccine, calculated only among adolescents aged 17 years at time of interview. Does not include adolescents
who received their first and only dose of MenACWY at age 16 years or later. ¶ HPV vaccine, either bivalent (2vHPV) or quadrivalent (4vHPV), among females. ACIP recommends 2vHPV, 4vHPV, or nine-valent (9vHPV) vaccine for females.
Although the 9vHPV vaccine was licensed in December 2014 and recommended by ACIP in February 2015, it was not distributed until 2015 and thus was not administered to adolescents in 2014.
** HPV vaccine, either 2vHPV or 4vHPV, among males. ACIP recommends the 4vHPV or 9vHPV vaccines for males; however, some males might have received the 2vHPV vaccine. Although the 9vHPV vaccine was licensed in December 2014 and recommended by ACIP in February 2015, it was not distributed until 2015 and thus was not administered to adolescents in 2014.
†† NIS-Teen implemented a revised APD definition in 2014 and retrospectively applied the revised APD definition to 2013 data. Estimates using different APD definitions might not be directly comparable.

Morbidity and Mortality Weekly Report
788 MMWR / July 31, 2015 / Vol. 64 / No. 29
practice, health systems, and parental acceptance take time. Because NIS-Teen monitors coverage among adolescents aged 13–17 years, the impact of interventions aimed at increasing HPV vaccine administration to adolescents aged 11–12 years cannot be measured until 1–2 years after implementation.
Estimated coverage with ≥1 MenACWY dose continues to increase among adolescents, but geographic disparities are evi-dent and vaccination coverage estimates are still lower than for Tdap. Although 78.8% of adolescents aged 17 years received
≥1 dose of MenACWY, only 28.5% received the complete the 2-dose series. Further evaluation might identify factors that could lead to improved MenACWY series coverage, although older adolescents have fewer preventive health visits, and awareness of the 2-dose recommendation (http://www.cdc.gov/mmwr/preview/mmwrhtml/mm6003a3.htm) might still be low. In addition, because NIS-Teen includes adolescents aged 13–17 years, receipt of MenACWY at age ≥18 years is not captured in these coverage estimates.
TABLE 2. Estimated vaccination coverage among adolescents aged 13–17 years,* by race/ethnicity,† poverty level,§ and selected vaccines and doses — National Immunization Survey–Teen (NIS-Teen), United States, 2014
Vaccine
Race/Ethnicity Poverty status
White only, non-Hispanic (n = 13,443) % (95% CI)¶
Black only, non-Hispanic
(n = 1,986) % (95% CI)
Hispanic (n = 3,255) % (95% CI)
American Indian/Alaska
Native only, non-Hispanic
(n = 303) % (95% CI)
Asian, non-Hispanic
(n = 764) % (95% CI)
Multiracial (n = 985)
% (95% CI)
Below poverty level
(n = 3,709) % (95% CI)
At or above poverty level (n = 16,404) % (95% CI)
Tdap**≥1 dose 88.6 (±0.9) 87.6 (±2.1) 86.7 (±2.4) 86.1 (±6.5) 85.2 (±6.7) 81.9 (±6.3)†† 85.8 (±2.0)†† 88.4 (±0.9)MenACWY §§ ≥1 dose 78.2 (±1.2) 80.3 (±2.8) 82.1 (±2.8)†† 73.5 (±9.2) 82.5 (±6.5) 74.3 (±6.5) 79.0 (±2.4) 79.5 (±1.2)HPV¶¶ vaccine coverage by dosesFemales
≥1 dose 56.1 (±2.2) 66.4 (±4.8)†† 66.3 (±5.1)†† 71.2 (±14.4)†† 54.9 (±9.3) 55.9 (±7.5) 67.2 (±4.2)†† 57.7 (±2.1)≥2 doses 47.1 (±2.2) 53.0 (±5.1)†† 57.4 (±5.1)†† 61.8 (±15.6) 47.5 (±9.1) 45.5 (±7.3) 58.0 (±4.3)†† 47.9 (±2.2)≥3 doses 37.5 (±2.1) 39.0 (±5.0) 46.9 (±5.2)†† 39.4 (±15.4) 35.7 (±8.2) 37.2 (±7.0) 44.7 (±4.3)†† 37.9 (±2.1)
Males≥1 dose 36.4 (±2.0) 42.1 (±4.9)†† 54.2 (±4.9)†† 49.8 (±13.9) 45.8 (±11.4) 40.2 (±10.1) 51.6 (±4.0)†† 39.5 (±2.1)≥2 doses 27.4 (±1.9) 32.0 (±4.8) 39.4 (±4.9)†† 40.5 (±13.1) 38.3 (±11.1) 32.4 (±9.9) 39.4 (±4.1)†† 29.5 (±2.0)≥3 doses 18.8 (±1.7) 20.4 (±4.0) 27.8 (±4.7)†† 26.3 (±10.9) 26.6 (±10.4) 23.5 (±9.6) 27.2 (±3.9)†† 20.2 (±1.8)
HPV vaccine 3-dose series completion***Females 70.6 (±3.2) 61.6 (±6.3)†† 72.8 (±5.4) 55.4 (±22.5) 71.7 (±11.0) 68.9 (±9.5) 68.3 (±5.0) 69.4 (±2.9)Males 57.9 (±3.6) 54.1 (±8.1) 57.2 (±7.0) 57.7 (±17.5) 63.0 (±17.0) 65.1 (±13.6) 58.2 (±6.2) 57.4 (±3.5)≥2 MMR 91.0 (±0.9) 91.1 (±1.9) 90.5 (±1.9) 94.1 (±4.1) 85.8 (±6.9) 90.0 (±3.3) 90.5 (±1.6) 90.8 (±0.9)≥3 HepB 92.2 (±0.8) 91.4 (±1.8) 90.5 (±1.9) 93.9 (±4.3) 85.5 (±6.9) 90.4 (±3.4) 90.3 (±1.7) 91.9 (±0.8)Varicella vaccineHistory of varicella††† 20.2 (±1.2) 18.3 (±2.8) 23.3 (±3.1) 36.1 (±11.8)†† 23.2 (±7.3) 20.5 (±4.3) 24.8 (±2.6)†† 19.5 (±1.2)Among adolescents with no history of varicella≥1 dose vaccine 95.1 (±0.7) 95.3 (±1.4) 95.5 (±1.5) 96.1 (±3.4) 92.4 (±4.2) 95.5 (±2.5) 95.0 (±1.3) 95.2 (±0.6)≥2 doses vaccine 80.0 (±1.4) 84.6 (±2.5)†† 82.5 (±3.1) 84.7 (±6.7) 82.3 (±5.5) 73.1 (±7.8) 82.7 (±2.3) 80.8 (±1.3)History of varicella or
received ≥2 doses varicella vaccine
84.0 (±1.1) 87.4 (±2.1)†† 86.6 (±2.4) 90.2 (±4.5)†† 86.4 (±4.4) 78.6 (±6.5) 87.0 (±1.8)†† 84.5 (±1.1)
Abbreviations: CI = confidence interval; Tdap = tetanus-diphtheria-acellular pertussis vaccine; MenACWY = meningococcal conjugate vaccine; HPV = human papillomavirus; MMR = measles, mumps, and rubella vaccine; HepB = hepatitis B vaccine. * Adolescents (N = 20,827) in the 2014 NIS-Teen were born during the period January 1996–February 2002. † Adolescent’s race/ethnicity was reported by their parent or guardian. Adolescents identified in this report as white, black, Asian, American Indian/Alaska Native,
or multiracial were reported by the parent or guardian as non-Hispanic. Adolescents identified as multiracial had more than one race category selected. Adolescents identified as Hispanic might be of any race. Native Hawaiian or other Pacific Islanders were not included in the table because of small sample sizes.
§ Adolescents were classified as below poverty level if their total family income was less than the federal poverty level specified for the applicable family size and number of children aged <18 years. All others were classified as at or above the poverty level. Additional information available at http://www.census.gov/hhes/www/poverty/data/threshld/index.html. Poverty status was unknown for 714 adolescents.
¶ Estimates with 95% CI half-widths >10 might not be reliable. ** Includes percentages receiving Tdap at or after age 10 years. †† Statistically significant difference (p<0.05) in estimated vaccination coverage by race/ethnicity or poverty level; referent groups were white, non-Hispanic adolescents,
and adolescents living at or above poverty level, respectively. §§ Includes percentages receiving MenACWY and meningococcal-unknown type vaccine. ¶¶ HPV vaccine, either quadrivalent (4vHPV) or bivalent (2vHPV). Although only 4vHPV was recommended for use in males in 2014, some males might have received
2vHPV. Percentage was reported among 10,084 females and 10,743 males. Some adolescents might have received more than the 3 recommended HPV vaccine doses. *** The completion rate for the 3-dose HPV vaccination series represents the percentage of adolescents who received 3 HPV doses among those who had ≥1 HPV
vaccine dose with at least 24 weeks between the first dose and the interview date. The denominator for this calculation was limited to 5,703 females and 3,935 males who received their first HPV dose and had enough time to receive the third HPV dose.
††† By parent/guardian report or provider records.

Morbidity and Mortality Weekly Report
MMWR / July 31, 2015 / Vol. 64 / No. 29 789
MMR vaccine is routinely recommended at ages 12–15 months and 4–6 years (1), and although ≥2-dose MMR coverage among adolescents remains high nationally, seven states had coverage <90%,*** suggesting important vulnerability to measles out-breaks. As of July 24, 2015, a total of 183 measles cases have
been reported this year in the United States (http://www.cdc.gov/measles/cases-outbreaks.html). High MMR coverage is needed to sustain elimination and protect those who cannot be directly vaccinated. Health care providers of adolescents should assess their patients’ vaccination status at each clinical oppor-tunity, take advantage of immunization information systems, which should reflect vaccines delivered in any setting, and offer all vaccines for which adolescents are eligible, including missing doses of MMR, varicella, and hepatitis B vaccines.
TABLE 3. Estimated vaccination coverage with selected vaccines and doses* among adolescents aged 13–17 years,† by HHS region and state or selected local areas — National Immunization Survey–Teen (NIS-Teen), United States, 2014
HHS region and state/local area
≥1 Tdap§
% (95% CI)¶¶≥1 MenACWY¶
% (95% CI)
Females (N = 10,084) Males (N = 10,743)
≥1 HPV**
% (95% CI)≥2 HPV††
% (95% CI)≥3 HPV§§
% (95% CI)≥1 HPV**
% (95% CI)≥2 HPV††
% (95% CI)≥3 HPV§§
% (95% CI)
United States overall 87.6 (±0.9)*** 79.3 (±1.1)*** 60.0 (±1.9)*** 50.3 (±1.9)*** 39.7 (±1.9)*** 41.7 (±1.8)*** 31.4 (±1.7)*** 21.6 (±1.6)***HHS Region I 93.0 (±1.8) 90.8 (±1.8)*** 67.8 (±4.6) 61.0 (±4.8)*** 49.0 (±5.0)*** 54.1 (±4.7) 44.4 (±4.7)*** 29.0 (±4.2)***Connecticut 94.8 (±3.2) 94.9 (±3.0) 63.5 (±8.5) 59.9 (±8.7) 48.5 (±9.1) 50.3 (±9.0) 38.4 (±8.7) 27.0 (±7.8)Maine 85.4 (±4.7) 73.6 (±5.7) 66.8 (±8.1) 52.9 (±8.7) 43.0 (±8.6) 53.1 (±9.0) 42.5 (±8.8) 27.5 (±7.6)***Massachusetts 93.2 (±3.4) 92.1 (±3.3) 69.0 (±8.5) 62.5 (±9.0)*** 49.5 (±9.2) 54.3 (±8.5) 46.2 (±8.6) 27.3 (±7.7)New Hampshire 94.4 (±2.6) 90.6 (±3.2) 71.0 (±7.2) 61.2 (±7.9) 50.1 (±8.4) 56.1 (±7.8)*** 46.9 (±7.9)*** 33.0 (±7.6)***Rhode Island 92.4 (±3.4) 94.1 (±3.2) 76.0 (±7.7) 67.8 (±8.2) 53.7 (±8.5) 69.0 (±7.5) 56.8 (±8.1) 42.9 (±7.9)Vermont 93.4 (±3.3) 81.3 (±5.1) 63.4 (±8.9) 55.8 (±9.2) 49.8 (±9.2) 50.5 (±9.3) 40.5 (±9.1)*** 30.5 (±8.4)HHS Region II 91.0 (±2.4) 84.6 (±3.0) 55.3 (±5.9) 44.8 (±5.9) 38.3 (±5.8) 45.1 (±5.6)*** 34.5 (±5.3)*** 26.1 (±5.1)***New Jersey 90.1 (±4.4) 94.9 (±3.2) 48.0 (±9.8) 39.9 (±9.6) 34.5 (±9.3) 35.5 (±9.4) 26.7 (±8.7) 21.2 (±8.4)New York 91.5 (±2.8) 79.6 (±4.2) 58.8 (±7.4) 47.2 (±7.5) 40.1 (±7.3) 49.8 (±6.8)*** 38.2 (±6.7)*** 28.5 (±6.3)***NY-City of New York 88.7 (±4.9) 86.8 (±4.9) 58.0 (±10.2) 46.2 (±10.2) 38.3 (±9.9) 56.6 (±9.8) 46.3 (±10.2) 35.0 (±10.0)NY-Rest of state 93.2 (±3.5) 75.1 (±6.0) 59.3 (±10.2) 47.8 (±10.3) 41.2 (±10.1) 45.5 (±9.1)*** 33.1 (±8.7) 24.4 (±8.1)***HHS Region III 89.8 (±1.9)*** 85.9 (±2.3)*** 62.5 (±4.8)*** 54.3 (±4.9) 42.5 (±4.8) 44.4 (±4.9)*** 34.5 (±4.6)*** 24.8 (±4.2)***Delaware 90.5 (±3.7)*** 86.7 (±4.6) 67.6 (±9.3) 51.4 (±9.9) 42.3 (±9.8) 54.6 (±9.5)*** 43.8 (±9.9)*** 31.0 (±9.7)***District of Columbia 81.4 (±5.9) 93.5 (±2.8) 75.2 (±9.4)*** 67.8 (±10.3)*** 56.9 (±10.9)*** 68.1 (±9.5) 54.3 (±10.9) 34.5 (±11.0)Maryland 85.0 (±5.3) 86.5 (±4.9)*** 57.9 (±9.9) 52.6 (±10.0) 39.4 (±9.7) 46.9 (±9.7)*** 37.3 (±9.4)*** 24.5 (±8.6)Pennsylvania 93.0 (±2.7) 95.2 (±1.9)*** 66.8 (±7.4) 57.9 (±8.0) 48.2 (±8.1) 47.4 (±7.9) 35.9 (±7.4) 26.0 (±6.7)***PA-Philadelphia 90.3 (±4.3) 92.6 (±3.7) 80.3 (±8.1) 74.1 (±8.8) 59.3 (±10.1) 62.8 (±9.1) 49.9 (±9.5)*** 34.8 (±8.9)***PA-Rest of state 93.4 (±2.9) 95.6 (±2.1)*** 65.1 (±8.4) 55.7 (±9.0) 46.7 (±9.1) 45.4 (±8.9) 34.1 (±8.3) 24.9 (±7.4)Virginia 91.2 (±3.9)*** 72.5 (±6.6) 59.2 (±10.4) 51.1 (±10.5) 35.9 (±9.7) 36.3 (±10.5) 29.7 (±9.9) 22.5 (±9.4)West Virginia 77.9 (±5.8) 78.9 (±5.6) 58.0 (±9.4) 48.3 (±9.3) 40.0 (±9.0) 42.7 (±8.9)*** 28.8 (±8.0) 23.5 (±7.7)HHS Region IV 86.8 (±1.8)*** 71.8 (±2.6) 58.4 (±4.0)*** 46.3 (±4.1) 36.5 (±3.9) 36.7 (±3.9)*** 25.6 (±3.6)*** 16.7 (±3.1)***Alabama 88.6 (±4.0) 71.6 (±5.7) 54.7 (±9.3) 40.7 (±9.0) 35.3 (±8.8) 27.6 (±7.2) 16.1 (±5.8) 9.0 (±4.7)Florida 90.7 (±4.2) 72.2 (±6.7) 57.2 (±10.4) 39.6 (±10.0) 28.5 (±9.1) 41.0 (±10.1) 30.0 (±9.5)*** 17.5 (±8.1)Georgia 86.1 (±4.8) 74.9 (±6.1) 65.4 (±9.1) 56.3 (±9.5)*** 47.1 (±9.7)*** 41.2 (±9.0) 28.0 (±7.8) 21.0 (±7.2)Kentucky 85.5 (±4.8) 78.2 (±5.7) 52.1 (±9.5) 45.1 (±9.4) 37.5 (±9.2) 23.7 (±8.0) 17.5 (±7.2) 13.3 (±6.6)Mississippi 70.8 (±6.3)*** 46.0 (±6.5) 45.8 (±9.5) 30.6 (±8.7) 24.6 (±8.4) 26.5 (±8.0)*** 16.2 (±7.0) NANorth Carolina 92.3 (±3.7) 74.1 (±5.6) 71.1 (±8.1)*** 60.0 (±9.0)*** 54.0 (±9.2)*** 45.2 (±8.9) 31.9 (±8.4) 20.9 (±7.3)South Carolina 72.6 (±6.2) 67.3 (±6.3) 52.1 (±9.5) 46.5 (±9.5) 35.9 (±9.1) 29.4 (±8.5) 22.5 (±7.8)*** 16.1 (±6.8)Tennessee 86.0 (±4.5)*** 74.0 (±5.8) 47.8 (±9.8) 39.4 (±9.6) 20.1 (±6.7)*** 30.5 (±8.5) 19.4 (±7.2) 14.0 (±6.6)HHS Region V 86.7 (±1.8) 80.1 (±2.1) 61.9 (±3.5)*** 52.7 (±3.7)*** 41.9 (±3.6)*** 39.6 (±3.5)*** 31.2 (±3.4)*** 20.6 (±3.0)***Illinois 91.9 (±2.4)*** 77.1 (±4.2) 64.4 (±6.5)*** 58.0 (±6.7)*** 47.7 (±6.9)*** 44.7 (±6.6)*** 34.2 (±6.3)*** 22.6 (±5.7)IL-City of Chicago 84.6 (±5.8) 83.4 (±5.9) 78.1 (±8.1)*** 68.8 (±9.5)*** 52.6 (±10.7)*** 64.9 (±10.0)*** 44.3 (±10.8)*** 26.1 (±9.3)IL-Rest of state 93.6 (±2.6)*** 75.6 (±5.0) 61.2 (±7.7) 55.5 (±8.0)*** 46.5 (±8.2)*** 40.0 (±7.6) 31.9 (±7.3)*** 21.8 (±6.6)Indiana 88.6 (±4.1) 90.0 (±3.9) 61.4 (±8.5) 54.3 (±8.9) 44.4 (±9.0) 23.2 (±6.9) 17.0 (±5.9) 12.8 (±5.1)Michigan 79.3 (±5.4) 90.7 (±4.0) 58.0 (±9.1) 50.9 (±9.3) 40.9 (±9.1) 39.8 (±9.5) 31.9 (±9.1)*** 22.1 (±8.2)Minnesota 87.2 (±5.0) 75.5 (±6.0) 67.0 (±9.4) 53.9 (±10.3) 42.5 (±10.3) 43.9 (±9.9)*** 36.6 (±9.8)*** 13.6 (±7.0)Ohio 83.0 (±4.8) 73.7 (±5.4) 61.0 (±8.4) 47.3 (±8.8) 35.2 (±8.3) 36.8 (±8.1) 29.3 (±7.7) 23.3 (±7.3)Wisconsin 93.3 (±3.7) 73.8 (±6.2) 61.0 (±9.8) 52.1 (±10.0) 40.9 (±9.9) 49.3 (±9.4)*** 39.3 (±9.5)*** 23.6 (±8.1)***HHS Region VI 87.8 (±2.2)*** 85.0 (±2.2)*** 53.0 (±5.0) 44.6 (±5.0) 34.2 (±4.7) 38.2 (±4.6) 27.1 (±4.2) 18.2 (±3.8)Arkansas 84.6 (±4.7)*** 64.8 (±6.1)*** 54.6 (±9.1) 37.8 (±8.7) 23.4 (±7.5) 35.1 (±8.9)*** 21.8 (±7.8)*** 11.4 (±5.6)Louisiana 93.8 (±2.8)*** 91.8 (±3.4) 53.2 (±9.5) 43.8 (±9.2) 38.4 (±9.0) 44.7 (±9.2)*** 32.2 (±8.6) 21.5 (±7.6)New Mexico 83.3 (±5.3) 75.1 (±5.6) 59.0 (±8.9) 48.7 (±9.1) 39.9 (±8.9) 42.8 (±9.3) 33.2 (±8.9) 23.3 (±8.1)Oklahoma 82.6 (±4.7) 70.8 (±5.8) 65.3 (±8.6) 50.8 (±9.3) 36.4 (±9.1) 43.2 (±8.9) 30.2 (±8.2) 19.9 (±7.1)Texas 88.2 (±3.1) 88.6 (±3.0) 50.7 (±7.0) 44.2 (±6.9) 33.9 (±6.5) 36.6 (±6.4) 26.0 (±5.8) 17.7 (±5.2)TX-Bexar County 85.7 (±4.3) 84.3 (±5.0) 47.7 (±9.4) 39.0 (±9.1) 30.8 (±8.5) 35.6 (±8.8) 26.2 (±8.5) 15.0 (±6.7)TX-City of Houston 87.8 (±4.6) 87.4 (±5.0) 66.8 (±9.0) 55.2 (±9.6) 43.8 (±9.8) 53.7 (±9.9)*** 38.6 (±9.6)*** 27.1 (±9.0)TX-El Paso County 86.3 (±5.1) 91.7 (±4.1) 71.9 (±9.9) 61.7 (±10.7) 45.6 (±11.0) 54.2 (±10.3) 42.9 (±10.2) 31.8 (±9.7)TX-Rest of state 88.5 (±3.6) 88.9 (±3.5) 48.7 (±8.2) 43.0 (±8.2) 32.8 (±7.7) 34.4 (±7.5) 24.2 (±6.8) 16.5 (±6.1)
See table footnotes on the next page.
*** Seven states had ≥2-dose MMR coverage estimates among adolescents aged 13–17 years <90% and 95% CI upper bounds <90%: Arizona, Idaho, Missouri, Montana, Texas, Utah, and West Virginia. State and selected local area ≥2-dose MMR estimates are available at http://www.cdc.gov/vaccines/imz-managers/coverage/nis/teen/data/tables-2014.html.

Morbidity and Mortality Weekly Report
790 MMWR / July 31, 2015 / Vol. 64 / No. 29
The findings in this report are subject to at least three limitations. First, household response rates for landline and cell phone samples were 60.3% and 31.2%, respectively, and only 57.1% of landline-completed interviews and 52.3% of cell phone–completed interviews had adequate provider data. Second, estimates might be biased even after adjustments for nonresponse and phoneless households. A total survey error model of 2011 NIS-Teen that included comparison with provider-reported data from National Health Interview Survey participants indicated coverage estimates were 1.3–6.7 percent-age points higher as a result of noncoverage and household nonresponse error.††† Weights have been adjusted to account for the increasing prevalence of cell phone–only households
over time. Nonresponse bias might change, which could affect comparisons of estimates across survey years. Finally, estimates stratified by state/local area and race/ethnicity might be unreli-able because of small sample sizes.
National HPV vaccination coverage estimates continue to be low for adolescents, despite similar percentage point increases in coverage in 2014 for ≥1 Tdap dose, ≥1 MenACWY dose, and, among females, ≥1 HPV dose. Differences in cover-age estimates by vaccine indicate many missed opportuni-ties for simultaneous administration of HPV with Tdap or MenACWY. Wide state and local variation in adolescent coverage with routinely recommended vaccines persists. Routinely recommending HPV vaccination at ages 11–12 years during the same visit and with the same emphasis used for other vaccines is critical. Resources are available for clinicians that focus on cancer prevention and ways to confidently
††† Additional information available at http://www.amstat.org/meetings/jsm/2012/onlineprogram/abstractdetails.cfm?abstractid=304324.
TABLE 3. (Continued) Estimated vaccination coverage with selected vaccines and doses* among adolescents aged 13–17 years,† by HHS region and state or selected local areas — National Immunization Survey–Teen (NIS-Teen), United States, 2014
HHS region and state/local area
≥1 Tdap§
% (95% CI)¶¶≥1 MenACWY¶
% (95% CI)
Females (N = 10,084) Males (N = 10,743)
≥1 HPV**
% (95% CI)≥2 HPV††
% (95% CI)≥3 HPV§§
% (95% CI)≥1 HPV**
% (95% CI)≥2 HPV††
% (95% CI)≥3 HPV§§
% (95% CI)
HHS Region VII 82.1 (±2.8) 65.4 (±3.6) 49.8 (±5.2) 40.6 (±5.0) 31.6 (±4.6) 31.0 (±4.7) 23.8 (±4.3)*** 16.3 (±3.5)***Iowa 76.7 (±6.4) 64.4 (±6.9) 59.5 (±9.9) 52.5 (±9.9) 37.6 (±9.3) 30.2 (±8.8) 26.7 (±8.5) 18.7 (±7.3)Kansas 79.8 (±5.6) 65.1 (±6.5)*** 38.3 (±9.5) 30.4 (±8.7) 24.8 (±8.0) 32.8 (±8.6) 23.5 (±7.7) 19.5 (±7.4)Missouri 86.1 (±4.6) 63.3 (±6.5) 47.5 (±9.2) 36.3 (±8.8) 28.3 (±8.2) 27.9 (±8.4) 20.1 (±7.6)*** 11.3 (±5.7)Nebraska 82.2 (±5.4) 74.1 (±5.8) 59.6 (±9.1) 51.2 (±9.4) 43.3 (±9.5) 39.5 (±9.1) 31.0 (±8.8) 22.8 (±7.8)HHS Region VIII 87.1 (±2.2) 70.9 (±3.0)*** 60.3 (±4.6)*** 48.5 (±4.8) 36.2 (±4.6) 35.2 (±4.5)*** 25.7 (±4.2)*** 18.1 (±3.7)***Colorado 90.2 (±3.6) 76.8 (±4.9) 62.5 (±8.3) 55.1 (±8.7) 42.1 (±8.7) 40.7 (±8.2) 30.8 (±7.8) 21.9 (±7.0)***Montana 84.7 (±4.7) 60.2 (±6.5)*** 57.2 (±9.2)*** 51.0 (±9.2)*** 42.9 (±9.1)*** 33.3 (±9.2) 19.1 (±7.6) 13.0 (±6.4)North Dakota 92.1 (±4.0) 91.8 (±3.3) 60.9 (±9.4) 48.7 (±9.6) 41.7 (±9.4) 37.6 (±9.0) 32.1 (±8.4) 25.3 (±7.8)South Dakota 75.0 (±5.9) 57.0 (±6.6) 61.0 (±9.4) 44.0 (±9.5) 33.1 (±8.8) 34.4 (±9.1)*** 28.4 (±8.8)*** 23.5 (±8.5)***Utah 84.8 (±4.5) 66.9 (±5.9) 59.2 (±8.3)*** 40.0 (±8.5) 26.0 (±7.3) 28.6 (±8.0)*** 19.6 (±6.8)*** 12.4 (±5.5)Wyoming 89.1 (±3.5) 55.6 (±5.7) 50.3 (±8.1) 42.4 (±8.0) 33.6 (±7.6) 29.3 (±7.4)*** 19.3 (±6.6) 12.2 (±5.5)HHS Region IX 87.1 (±3.7) 79.5 (±4.5) 66.7 (±7.5) 58.0 (±7.8) 45.0 (±7.8) 50.2 (±7.4) 38.8 (±7.3) 28.2 (±7.1)***Arizona 84.2 (±4.8) 85.9 (±4.7) 58.2 (±9.4) 46.2 (±9.4) 35.8 (±8.8) 40.6 (±8.3) 28.2 (±7.5) 16.7 (±5.7)California 87.7 (±4.6) 79.3 (±5.7) 69.2 (±9.4) 61.5 (±9.8) 47.7 (±9.8) 52.1 (±9.3) 41.2 (±9.2) 31.1 (±8.9)***Hawaii 82.3 (±4.8) 77.7 (±5.2) 60.4 (±8.6) 49.3 (±8.7) 38.0 (±8.4) 56.5 (±8.6)*** 47.1 (±8.8)*** 30.9 (±8.5)***Nevada 87.6 (±3.8) 66.5 (±5.9) 54.2 (±8.6) 43.5 (±8.5) 32.5 (±8.2) 43.4 (±9.0) 28.3 (±8.2) 15.7 (±6.0)***HHS Region X 85.1 (±2.6) 76.2 (±3.2)*** 63.6 (±5.4) 52.9 (±5.7) 42.3 (±5.7) 45.0 (±5.4)*** 32.9 (±5.2)*** 19.5 (±4.5)***Alaska 73.8 (±5.4) 56.9 (±6.1) 48.7 (±8.8) 45.2 (±8.7) 34.4 (±8.2) 37.9 (±8.6) 25.9 (±7.8) 13.3 (±6.3)Idaho 70.8 (±6.4) 78.1 (±5.8) 59.4 (±10.2) 54.2 (±10.2) 38.3 (±9.9) 32.0 (±8.7) 22.8 (±7.9) 17.2 (±6.9)Oregon 88.0 (±4.2) 68.4 (±6.0) 64.6 (±8.7) 51.7 (±9.2) 43.1 (±9.1) 36.9 (±8.4) 23.0 (±7.0) 12.3 (±4.8)Washington 88.5 (±4.1) 82.1 (±4.9) 65.8 (±8.8) 54.1 (±9.3) 43.8 (±9.4) 53.8 (±8.8)*** 41.8 (±8.8)*** 24.6 (±7.9)***Range††† (70.8-94.8) (46.0-95.2) (38.3-76.0) (30.4-67.8) (20.1-56.9) (23.2-69.0) (16.1-56.8) (9.0-42.9)
TerritoryPuerto Rico 81.7 (±7.2) 83.5 (±6.7) 76.1 (±10.4) 60.7 (±12.8) 49.9 (±13.0) 54.3 (±12.5) 41.6 (±12.5) 23.7 (±10.9)
Abbreviations: CI = confidence interval; Tdap = tetanus-diphtheria-acellular pertussis vaccine; MenACWY = meningococcal conjugate vaccine; HPV = human papillomavirus; NA = not available (estimate not reported because unweighted sample size for the denominator was <30 or 95% CI half-width / estimate > 0.6). * Vaccination estimates for additional measures, including ≥2 doses measles-mumps-rubella vaccine, ≥3 doses hepatitis B vaccine, and ≥1 and ≥2 doses varicella vaccines are available at
http://www.cdc.gov/vaccines/imz-managers/coverage/nis/teen/data/tables-2014.html. † Adolescents (N = 20,827) in the 2014 NIS-Teen were born during the period January 1996–February 2002. § ≥1 dose Tdap at or after age 10 years. ¶ ≥1 dose of MenACWY or meningococcal-unknown type vaccine. ** ≥1 dose of HPV vaccine, either quadrivalent (4vHPV) or bivalent (2vHPV). Although only 4vHPV was recommended for use in males in 2014, some males might have received 2vHPV. For
≥1, ≥2, and ≥3 dose measures, separate percentages are reported among females only (N = 10,084) and among males only (N = 10,743). †† ≥2 doses of HPV vaccine, either 4vHPV or 2vHPV. §§ ≥3 doses of HPV vaccine, either 4vHPV or 2vHPV. ¶¶ Estimates with 95% CI half-widths >10 might not be reliable. *** Statistically significant (p<0.05) percentage point change from 2013. The revised NIS-Teen 2013 estimates used as the basis for this comparison were calculated by retrospectively applying
the revised adequate provider data definition implemented in 2014 to 2013 NIS-Teen data and, as a result, differ from those previously published. Revised NIS-Teen 2013 data included 18,948 adolescents (9,042 females and 9,906 males). Revised 2013 NIS-Teen estimates by state and selected local areas are available at http://www.cdc.gov/vaccines/imz-managers/coverage/nis/teen/apd-report.html.
††† Range excludes selected local areas and Puerto Rico.

Morbidity and Mortality Weekly Report
MMWR / July 31, 2015 / Vol. 64 / No. 29 791
address questions regarding HPV vaccine safety and efficacy. Multifaceted interventions that engage clinicians and other immunization stakeholders and increase community aware-ness might improve HPV vaccination coverage (8). Recent licensure of two vaccines for adolescents (nine-valent HPV [9vHPV] and serogroup B meningococcal vaccines) might provide opportunities for additional protection of adolescents
FIGURE 2. Estimated vaccination coverage with ≥1 dose of human papillomavirus (HPV) vaccine* among females aged 13–17 years† — United States, National Immunization Survey–Teen, 2014
60–69%50–59%
≥70%
≤49%
DC
* HPV vaccine, either quadrivalent or bivalent.† Includes females (N = 10,084) born during the period January 1996–
February 2002.
FIGURE 3. Estimated vaccination coverage with ≥1 dose of human papillomavirus (HPV) vaccine* among males aged 13–17 years† — United States, National Immunization Survey–Teen, 2014
DC
40–49%30–39%≤29%
≥50%
* HPV vaccine, either quadrivalent or bivalent.† Includes males (N = 10,743) born during the period January 1996–February 2002.
against vaccine-preventable diseases in the years ahead (2,9). Furthermore, clinical trials are ongoing to evaluate alternative dosing schedules for 9vHPV, which will be reviewed by ACIP in consideration of reduced-dose HPV vaccination schedules in the United States (2). To protect against HPV-associated cancers and other vaccine-preventable diseases, clinicians should ensure that adolescents receive all vaccines currently recommended routinely at ages 11–12 years. 1Immunization Services Division, National Center for Immunization and
Respiratory Diseases, CDC; 2Division of Bacterial Diseases, National Center for Immunization and Respiratory Diseases, CDC; 3Division of Sexually Transmitted Diseases, National Center for HIV/AIDS, Viral Hepatitis, STD, and TB Prevention, CDC.
Corresponding author: Sarah Reagan-Steiner, [email protected], 404-639-8205.
SummaryWhat is already known on this topic?
Routine immunization is recommended for adolescents aged 11–12 years by the Advisory Committee on Immunization Practices for protection against diseases including pertussis, meningococcal disease, and human papillomavirus (HPV)–associ-ated cancers. During 2006–2013, national coverage with ≥1 dose of tetanus-diphtheria-acellular pertussis (Tdap) vaccine and ≥1 dose of meningococcal conjugate (MenACWY) vaccine increased annually. Although ≥1-dose HPV coverage among females increased during 2007–2011, no change was observed during 2011–2012. However, during 2012–2013 and 2011–2013, ≥1-dose HPV coverage among females and males, respectively, increased.
What is added by this report?
During 2013–2014, vaccination coverage among adolescents aged 13–17 years increased for ≥1 dose of Tdap, ≥1 dose of MenACWY, and each HPV dose among females and males, with considerable variation in coverage by state. Although HPV vaccination coverage among females increased nationally for the second consecutive year, HPV coverage lags behind Tdap and MenACWY coverage. Seven jurisdictions achieved significant increases in ≥1- or ≥3-dose HPV vaccination coverage among females during 2013–2014, demonstrating that substantial improvement in HPV vaccination coverage is feasible.
What are the implications for public health practice?
Despite similar percentage point increases in coverage with Tdap and MenACWY vaccines, and ≥1 HPV dose among females in 2014, national HPV coverage estimates remain low for adolescents. Differences in coverage estimates by vaccine indicate missed opportunities for administering HPV vaccine at visits when Tdap or MenACWY vaccines are given. Routinely recommending HPV vaccine at ages 11–12 years, during the same visit and with the same emphasis used for other vaccines, is critical. Multifaceted interventions that engage clinicians and other immunization stakeholders and increase community awareness might improve HPV vaccination coverage.

Morbidity and Mortality Weekly Report
792 MMWR / July 31, 2015 / Vol. 64 / No. 29
References1. Strikas RA, Advisory Committee on Immunization Practices (ACIP),
ACIP Child/Adolescent Immunization Work Group. Advisory Committee on Immunization Practices recommended immunization schedules for persons aged 0 through 18 years—United States, 2015. MMWR Morb Mortal Wkly Rep 2015;64:93–4.
2. Petrosky E, Bocchini JA Jr, Hariri S, et al. Use of 9-valent human papillomavirus (HPV) vaccine: updated HPV vaccination recommendations of the advisory committee on immunization practices. MMWR Morb Mortal Wkly Rep 2015;64:300–4.
3. Elam-Evans LD, Yankey D, Jeyarajah J, et al. National, regional, state, and selected local area vaccination coverage among adolescents aged 13–17 years—United States, 2013. MMWR Morb Mortal Wkly Rep 2014; 63:625–33.
4. National Institutes of Health. Uptake: urgency for action to prevent cancer. A report to the President of the United States from the President’s Cancer Panel. Bethesda, MD: National Institutes of Health; 2014. Available at http://deainfo.nci.nih.gov/advisory/pcp/annualReports/HPV/PDF/PCP_Annual_Report_2012-2013.pdf.
5. CDC. National and state vaccination coverage among adolescents aged 13–17 years—United States, 2012. MMWR Morb Mortal Wkly Rep 2013; 62:685–93.
6. Curtis CR. Increasing HPV vaccine coverage among adolescents: activities and lessons learned from 2013 PPHF projects. Presented at the 2014 National Immunization Conference; September 29–30, 2014; Atlanta, GA. Available at http://www.taskforce.org/2014-national-immunization-conference-presentations.
7. Allison MA, Dunne EF, Markowitz LE, et al. HPV vaccination of boys in primary care practices. Acad Pediatr 2013;13:466–74.
8. Community Preventive Services Task Force. Guide to Community Preventive Services. Increasing appropriate vaccination. Available at http://www.thecommunityguide.org/vaccines/index.html.
9. Folaranmi T, Rubin L, Martin SW, Patel M, MacNeil JR. Use of serogroup B meningococcal vaccines in persons aged ≥10 years at increased risk for serogroup B meningococcal disease: recommendations of the Advisory Committee on Immunization Practices, 2015. MMWR Morb Mortal Wkly Rep 2015;64:608–12.

Morbidity and Mortality Weekly Report
MMWR / July 31, 2015 / Vol. 64 / No. 29 793
Airplanes and helicopters are integral to the management and suppression of wildfires, often operating in high-risk, low-altitude environments. To update data on aviation-related wildland firefighting fatalities, identify risk factors, and make recommendations for improved safety, CDC’s National Institute for Occupational Safety and Health (NIOSH) analyzed reports from multiple data sources for the period 2000–2013. Among 298 wildland firefighter fatalities identi-fied during 2000–2013, 78 (26.2%) were aviation-related occupational fatalities that occurred during 41 separate events involving 42 aircraft. Aircraft crashes accounted for 38 events. Pilots, copilots, and flight engineers represented 53 (68%) of the aviation-related fatalities. The leading causes of fatal aircraft crashes were engine, structure, or component failure (24%); pilot loss of control (24%); failure to maintain clearance from terrain, water, or objects (20%); and hazardous weather (15%). To reduce fatalities from aviation-related wildland firefighting activities, stringent safety guidelines need to be followed during all phases of firefighting, including training exercises. Crew resource management techniques, which use all available resources, information, equipment, and personnel to achieve safe and efficient flight operations, can be applied to firefighting operations.
Airplanes and helicopters play a major role in the control of wildland (forest, brush, and grass) fires. These aircraft are used to deliver equipment and supplies, deploy and trans-port firefighters, conduct reconnaissance, scout and direct operations, and deliver fire retardant or water. During the past decade, the United States has experienced an increase in the size, frequency, and severity of wildfires, likely attributable to buildup of flammable vegetation, decline in snowpack, and human development in the wildland urban interface (1,2). If these conditions continue, more fire response workers will be needed, and the demand on aviation to support these efforts will increase.
To identify risk factors for aviation-related wildland fire-fighter activities, NIOSH reviewed and extracted case reports from the Fire Administration Firefighter Fatality surveil-lance system, the National Fire Protection Association Fire Incident Data Organization database, the National Wildland Coordinating Group’s Safety Gram, and the National Transportation Safety Board aviation database. A wildland firefighter fatality was defined as any death that occurred in a paid or unpaid wildland firefighter, contractor, aviation crew member or support staff, inmate, or member of the military
while performing official wildland fire duties, including opera-tions (fire or nonfire incident), responding to or returning from a wildland fire incident, or other officially assigned duties.* Other emergency response workers who were fatally injured at wildfires were excluded from this analysis. The number of flight hours for the U.S. Forest Service was used as a denominator to indicate the use of aviation resources because flight hours from other agencies or workforce numbers were not available.
During 2000–2013, a total of 298 wildland firefighter fatali-ties were identified, averaging 21 fatalities per year. Among these, 78 (26.2%) were caused by activities associated with aviation. The number of aviation- related fatalities decreased during 2007–2013, compared with 2000–2006 (Table 1). Of the persons who died in aviation-related activities, 76 (97%) were male, and 53 (68%) were flight crew members (e.g., pilots, copilots, and flight engineers). The average age of flight crew victims was 49 years (range = 20–66 years) and of nonflight crew victims was 33 years (range = 19–54 years). The most common occupation of nonflight crew members was firefighter. Most victims were employed by aerial con-tractors (42), followed by the federal government (15), state government agencies (10), ground contractors (seven), and the military (four). Twenty-five (32%) of the aviation-related fatalities occurred in California, eight occurred in Nevada, and seven in Idaho (Figure).
For pilots in command who were victims, the mean total flight hours (available for 34) was 10,725 hours. Most fatali-ties (67.5%) occurred during June–September; 31% occurred in August. Fifty-two (67%) deaths occurred during the direct support of wildland fire incidents, 12 (16%) during training exercises, and three (4%) at prescribed fires (fires that are delib-erately ignited to reduce fuels, control competing vegetation, improve accessibility, and preserve forest ecology). The remain-ing 11 (14%) fatalities occurred during other nonemergency activities such as repositioning operations, nonemergency staffing replacements, nonfire recovery missions, or traveling to other events.
The 78 deaths occurred during 41 separate events involv-ing 42 firefighting aircraft; 23 (55%) aircraft were fixed wing, and 19 (45%) were helicopters. Three firefighting aircraft
* Wildland firefighting duties include training, reconnaissance, maintenance, public education, inspection, investigations, court testimony, or fundraising; being on call, under orders, or on standby duty, except at the individual’s home or other place of business. Additional information available at http://www.gpo.gov/fdsys/pkg/BILLS-108s459enr/pdf/BILLS-108s459enr.pdf.
Aviation-Related Wildland Firefighter Fatalities — United States, 2000–2013Corey R. Butler, MS1, Mary B. O’Connor, MS2, Jennifer M. Lincoln, PhD2 (Author affiliations at end of text)

Morbidity and Mortality Weekly Report
794 MMWR / July 31, 2015 / Vol. 64 / No. 29
were involved in midair collisions. Two air tankers (airplanes equipped with tanks for carrying and dumping water or retar-dant) collided, and a helicopter evacuating a firefighter collided with a nonfire medical evacuation helicopter while approach-ing a hospital.† Aircraft crashes accounted for 38 (93%) fatal events involving 75 (96%) fatalities. The remaining fatalities occurred in three separate events, two during smokejumper operations and another during rappelling operations. Twenty events involved multiple (range = two to nine) wildland fire-fighter fatalities. Ten (24%) fatal aircraft crashes resulted from structure or component failure, 10 (24%) from pilot loss of control; eight (20%) from failure to maintain clearance from terrain, water or objects; and six (15%) from encounters with hazardous weather (Table 2). Seven (37%) helicopters were operating with external loads when they crashed.
To increase safety, agencies have instituted policies, protocols and training requirements, including improving aircraft inspec-tion and maintenance programs, limiting retardant loads, shifting firefighting strategies to reduce reliance on air tankers during large fires, and ending leases on some retired military aircraft that were considered high risk to firefighter safety (3). These changes have resulted in a decreased number and rate of fatalities in recent years; however, working with and around aircraft is still one of the highest risk activities for firefighters.
Discussion
Airplanes and helicopters are commonly used in wildland fire operations to deploy and transport workers and equipment to and from a fire, apply retardant and water, perform reconnais-sance of fires, and ignite prescribed fires (4). Most operations
performed by aircraft involved in wildland firefighting are considered emergency response operations, and many are considered to be hazardous, such as low-level reconnaissance and water and retardant drops. During 2002–2013, more than 72,000 wildfires burned an average of 7 million acres each year; California reported the largest annual average number of fires (7,998) (5). In 2012, federal land management agencies of the U.S. Department of Agriculture and U.S. Department of the Interior, spent approximately $2 billion suppressing wildfires (6). During 1991–2012, the proportion of the Forest Service budget dedicated to controlling wildfires increased from approximately 13% to 40% (7). As the frequency, complexity, and area burned by wildfires continues to increase, the number and types of personnel and the high demand for the limited number of available aircraft to aid in wildfire suppression will continue to grow (8).
Fighting wildfires often requires a multifaceted approach, involving federal, state, tribal, and local agencies, all with dif-ferent missions, legal responsibilities and authorities (9). While some agencies own their own aircraft, others rely on contracts to provide the fleet necessary for managing wildfires. Training programs, policies, individual qualifications, experience levels, crew abilities and knowledge, resources, and support structure vary among the different agencies that often work together dur-ing these hazardous operations. Using the most stringent safety guidelines available for each activity will ensure the highest level of protection for all workers. Crew resource management comprises a range of skills, knowledge, behaviors, and actions
TABLE 1. Fatal aviation events and associated wildland firefighter fatalities — United States, 2000–2013
Fatal aviation event
7-year interval
2000–2006 2007–2013
No. of events involving a fatality 28 13Rate* 4.6 2.1Average per year 4 2No. of fatalities 49 29Rate* 8.0 4.7Average per year 7 4
Sources: U.S. Fire Administration Firefighter Fatality surveillance system, National Fire Protection Association Fire Incident Data Organization data system, National Wildland Coordinating Group’s Risk Management Committee Safety Gram, Fatalities, Entrapments and Serious Accident data system, and National Transportation Safety Board aviation database.* Rate of fatalities per 100,000 U.S. Forest Service reported flight hours for aircraft
owned, leased, or contracted by the Forest Service by fiscal year. Fiscal year was paired with calendar year to match the summer flying season (i.e., fiscal year 2000 is shown with data from calendar year 2000).
FIGURE. Number (N = 78) of aviation-related wildland firefighter fatalities — United States, 2000–2013
≥106–101–50
Sources: U.S. Fire Administration Firefighter Fatality surveillance system, National Fire Protection Association Fire Incident Data Organization data system, National Wildland Coordinating Group’s Risk Management Committee Safety Gram, Fatalities, Entrapments and Serious Accident data system, and National Transportation Safety Board aviation database.
† The nonfire medical evacuation helicopter with six other nonfirefighting personnel who were fatally injured during this event were not included in this analysis because they were not associated with wildland firefighting operations.

Morbidity and Mortality Weekly Report
MMWR / July 31, 2015 / Vol. 64 / No. 29 795
that can be applied to firefighters and firefighting operations. The Forest Service, U.S. Department of the Interior, and other agencies have incorporated crew resource management system elements (e.g., situational awareness, communication, decision-making, and risk management) that are specifically applicable to wildland firefighting safety. Incorporating such an approach to all firefighting operations might lead to increased efficiency, effectiveness, and safety.
The findings in this report are subject to at least three limita-tions. First, aviation-related fatalities might have occurred that were not included in the databases, especially if the incident did not occur during a wildland fire event (e.g., during main-tenance, training, or in transit to a fire). Second, occupational fatality rates based on the number of wildland firefighters or the number of flight hours logged by wildland firefighters using aircraft as part of their jobs could not be calculated because those data were not available. Finally, reliable wildland fire-fighter workforce population estimates, including the number of aviation contractors and nonfederal flight crew members, were not available. The wildland firefighting workforce com-prises mostly seasonal, volunteer, or contract workers from a variety of different employing agencies. No single data system tracks the number of wildland firefighters, and there is also no occupational code specifically for wildland firefighting.
Wildland firefighting necessitates an interagency approach, requiring many persons to work together in a complex and often unpredictable and hazardous environment. To reduce fatalities from aviation-related wildland firefighting activities, the most stringent safety guidelines need to be followed during all phases of firefighting to help firefighters, flight crews, and fire managers assess risk, limit exposure, share information, and enhance teamwork when using aircraft to control wildfires.
Acknowledgments
Devin Lucas, Alaska Pacific Office, National Institute for Occupational Safety and Health, CDC. Stan Palmer, Bureau of Land Management, U.S. Department of the Interior. Rita Fahy, National Fire Protection Association. Joe Domitrovich, U.S. Forest Service.
1National Institute for Occupational Safety and Health, Western States Office, CDC, 2Alaska Pacific Office, National Institute for Occupational Safety and Health, CDC.
Corresponding author: Corey Butler, [email protected], 303-236-5393.
References1. Brown TJ, Hall BL, Westerling AL. The impact of twenty-first century
climate change on wildland fire danger in the western United States: an applications perspective. Climatic Change 2004;62:365–88.
2. Marlon JR, Bartlein PJ, Walsh MK, et al. Wildfire responses to abrupt climate change in North America. Proceedings of the National Academy of Sciences 2009;106:2519–24
3. US Department of Interior. Congressional testimony: statement of L. Hamilton, National Director, Office of Fire and Aviation Department of Interior, Bureau of Land Management, National Interagency Fire Center, before the Blue Ribbon Panel Report and Aerial Firefight Safety, Subcommittee on Public Lands and Forests, Energy and Natural Resources Committee, US Senate, March 26, 2002. Available at http://www.fs.fed.us/sites/default/files/media/types/testimony/SENR_03-26-2003_Testimony.pdf.
4. US Department of Agriculture, Forest Service. Fire and Aviation Management. Boise, ID: US Department of Agriculture, Forest Service; 2014. Available at http://www.fs.fed.us/fire/aviation/.
5. National Interagency Fire Center. Statistics. Boise, ID: National Interagency Fire Center; 2014. Available at http://www.nifc.gov/fireInfo/fireInfo_statistics.html.
SummaryWhat is already known on this topic?
Working in and around aircraft is considered one of the most dangerous operations when suppressing wildfires. Aviation-related incidents are one of the leading causes of death among wildland firefighters. Many fire management agencies have instituted policies and protocols that are designed to reduce the risk associated with using aircraft when suppressing wildfires.
What is added by this report?
During 2000–2013, a total of 78 firefighters were fatally injured while performing wildland fire duties involving aircraft during 41 separate events. The leading causes of fatal aircraft crashes were engine, structure, or component failure; loss of control of the aircraft; failure to maintain clearance from terrain, water, or objects; and hazardous weather.
What are the implications for public health practice?
Agencies and employers need to ensure that the most stringent and consistent safety guidelines and standards that incorporate a comprehensive approach to efficient, effective, and safer wildland firefighting operations are followed during firefighting operations.
TABLE 2. Causes of fatal aviation events in wildland firefighting activities — United States, 2000–2013
Cause Events (%) Deaths (%)
Failure of engine, structure, or component 10 (24) 18 (23)Loss of control (including failure to
maintain airspeed)10 (24) 15 (19)
Failure to maintain clearance from terrain, water, or obstacles
8 (20) 15 (19)
Weather 6 (15) 13 (17)Midair collisions 2 (5) 3 (4)Failure of parachute or rappel equipment 3 (7) 3 (4)Weight and balance 1 (2) 9 (12)Cause not reported 1 (2) 2 (3)Total 41 —* 78 —*
Sources: U.S. Fire Administration Firefighter Fatality surveillance system, National Fire Protection Association Fire Incident Data Organization data system, National Wildland Coordinating Group’s Risk Management Committee Safety Gram, Fatalities, Entrapments and Serious Accident data system, and National Transportation Safety Board aviation database.* Total does not sum to 100% because of rounding.

Morbidity and Mortality Weekly Report
796 MMWR / July 31, 2015 / Vol. 64 / No. 29
6. National Interagency Fire Center. Federal firefighting costs (suppression only). Boise ID: National Interagency Fire Center; 2014. Available at https://www.nifc.gov/fireInfo/fireInfo_documents/SuppCosts.pdf.
7. Forest Service. Congressional testimony: statement of T. Tidwell, Chief, USDA Forest Service, before the Committee On Energy And Natural Resources U.S. Senate, June 4, 2013. Available at http://www.energy.senate.gov/public/index.cfm/files/serve?File_id=e59df65c-09c6-4ffd-9a83-f61f2822a075.
8. Blue Ribbon Panel. Federal aerial firefighting: assessing safety and effectiveness. Blue Ribbon Panel Report to the Chief, USDA Forest Service and Director, USDI Bureau of Land Management, 2002. Available at http://www.wildlandfire.com/docs/2003_n_before/BRP_Final12052002-1.pdf.
9. Artley DK. Wildland fire protection and response in the United States: the responsibilities, authorities, and roles of federal, state, local, and tribal government. Fairfax, VA: The International Association of Fire Chiefs; 2009. Available at https://www.iafc.org/files/wild_MissionsProject.pdf.

Morbidity and Mortality Weekly Report
MMWR / July 31, 2015 / Vol. 64 / No. 29 797
Tobacco use is the leading cause of preventable disease and death in the United States (1). One of the Healthy People 2020 objectives calls for reducing the proportion of U.S. adults who smoke cigarettes to ≤12% (objective TU-1.1) (2). Despite progress in reducing smoking prevalence over the past several decades, nearly one in five U.S. adults, includ-ing millions of workers, still smoke cigarettes (1,3). During 2004–2010, nearly one fifth (19.6%) of U.S. working adults aged ≥18 years smoked cigarettes, and of all the industry sec-tors, current smoking prevalence among the accommodation and food services sector workers (30%) was the highest (3). CDC analyzed National Health Interview Survey (NHIS) data for 2011–2013 to estimate current cigarette smoking prevalence among adults working in the accommodation and food services sector, and found that these workers had higher cigarette smoking prevalence (25.9%) than all other workers (17.3%). Among workers in accommodation and food ser-vices sector, the highest smoking prevalences were observed among males, non-Hispanic whites, those aged 25–44 years, those with a high school diploma or a General Educational Development (GED) certificate and no college education, those with an annual family income <$35,000, those with no health insurance, and those working in the food services and drinking places industry. These results indicate a need to better understand the reasons for higher smoking prevalence observed among accommodation and food services workers (e.g., workplace culture), so that appropriate intervention strategies can be developed and implemented. Evidence suggests that smoke-free worksites and workplace cessation programs, including comprehensive worksite smoke-free poli-cies, health promotion, access to smoking cessation programs, and increasing the cost of tobacco products, can substantially reduce smoking among workers (1,4,5).
NHIS data are collected annually from a nationally representative sample of the noninstitutionalized U.S. civilian population through a personal household interview. During 2011–2013, survey response rates ranged from 66.3% (2011) to 61.2% (2013) (6). To improve the precision and reliability of the estimates, CDC combined 2011-2013 NHIS data. Data were adjusted for nonresponse and weighted to be nationally representative; 95% confidence intervals were calculated. Two-tailed t-tests were used to determine statistically significant
differences between point estimates.* Cigarette smokers were defined as adults aged ≥18 years who reported having smoked ≥100 cigarettes during their lifetime and, at the time of interview, reported smoking every day or some days. Survey participants were considered to be working currently if, when asked about their employment status during the week before their interview, they responded “working at a job or business,” “with a job or business but not at work,” or “working, but not for pay, at a family-owned job or business.” Information on participants’ industry of employment and occupation was classified by trained coders (6). Workers within the accommodation and food services sector were identified, and two industries and 10 occupations were examined within the sector.† Cigarette smoking prevalences were calculated for the accommodation and food services sector workers and for all other workers (i.e., those not working in the accommodation and food services) by selected characteristics.
During 2011-2013, approximately 142 million (60.5%) of the estimated 235 million U.S. adults aged ≥18 years were employed during the week before the interview; among these, an estimated 9.3 million (6.6%) worked in the accommodation and food services sector. Overall cigarette smoking prevalence was 17.8% among U.S. working adults, with a prevalence of 25.9% among the accommodation and food services sector workers and 17.3% among all other U.S. workers. Among the accommodation and food services sector workers, cigarette smoking was highest among those aged 25−44 years (31.4%), those with a high school diploma/GED certificate and no col-lege education (32.1%), those with an annual family income <$35,000 (30.9%), and those with no health insurance (29.3%) (Table 1).
Compared with all other working adults who currently smoked, accommodation and food services workers who smoked were less educated (41.2% versus 36.0% with only a high school diploma/GED certificate), more likely to live below the federal poverty level (22.3% versus 11.6%), to have
Current Cigarette Smoking Among Workers in Accommodation and Food Services — United States, 2011–2013
Girija Syamlal, MPH1; Ahmed Jamal, MBBS2; Jacek M. Mazurek, MD1 (Author affiliations at end of text)
* Additional information available at http://www.cdc.gov/nchs/data/series/sr_10/sr10_256.pdf.
† Accommodation and food services sector comprises establishments providing customers with lodging and/or preparing meals, snacks, and beverages for immediate consumption, and includes two industries: accommodation and food serving and drinking places. Additional information available at ftp://ftp.cdc.gov/pub/Health_Statistics/NCHS/Datasets/NHIS/NAICS_Sectors_and_Subsectors.pdf.

Morbidity and Mortality Weekly Report
798 MMWR / July 31, 2015 / Vol. 64 / No. 29
≤5 years on the job (75.5% versus 58.3%), and to smoke ≥12 cigarettes per day (70% versus 61.6%) (Table 2).
Cigarette smoking prevalence among workers in the food services and drinking places (26.8%) industry and in five
of the 10 occupations within the accommodation and food services sector was greater than twice the Healthy People 2020 target of ≤12% for U.S. adults. Cigarette smoking prevalence exceeded 25% among workers in the motor vehicle operators
TABLE 1. Cigarette smoking* prevalence among adults aged ≥18 years currently working† in accommodation and food services sector, by selected characteristics — National Health Interview Survey, 2011–2013
Characteristic
Accommodation and food services sector workers
All non-accommodation and food services sector workers
p value†
Estimated population§
(in thousands)Smoking
prevalence (%) (95% CI)
Estimated population
(in thousands)Smoking
prevalence (%) (95% CI)
Total 9,345 25.9 (24.3–27.4) 130,115 17.3 (16.9–17.8) <0.001Age group (yrs)18–24 3,211 20.5 (17.5–23.4) 13,841 17.8 (16.4–19.3) 0.11325–44 3,983 31.4 (28.7–34.1) 57,246 18.6 (17.9–19.2) <0.00145–64 1,939 25.2 (21.7–28.7) 52,652 17.0 (16.4–17. 7) <0.001≥65 212 11.3 (4.9–17.7) 6,376 7.7 (6.6–8.8) 0.275SexMale 4,323 28.3 (25.8–30.9) 69,630 19.5 (18.8–20.1) <0.001Female 5,022 23.8 (21.7–25.8) 60,485 14.9 (14.3–15.4) <0.001Race/EthnicityHispanic 2,338 11.1 (9.1–13.0) 19,074 13.1 (12.2–14.0) 0.066White, non-Hispanic 5,180 33.9 (31.6–36.3) 88,880 19.0 (18.4–19.6) <0.001Black, non-Hispanic 1,127 24.5 (20.7–28.3) 14,338 15.3 (14.3–16.2) <0.001Other 700 18.2 (13.6–22.8) 7,822 12.1 (10.9–13.4) 0.013Education<High school diploma/GED 1,782 23.9 (20.2–27.6) 11,315 26.5 (24.8–28.2) 0.209High school diploma/GED 3,106 32.1 (29.1–35.1) 29,794 27.2 (26.2–28.3) 0.003>High school diploma/GED 4,392 22.2 (19.8–24.5) 88,608 12.8 (12.4–13.3) <0.001Unknown 66 —¶ — 397 16.4 (9.4–23.4) 0.199Annual family Income$0–$34,999 4,205 30.9 (28.3–33.5) 26,629 26.0 (25.0–27.0) 0.001$35,000–$74,999 2,924 24.1 (21.2–26.9) 41,491 19.5 (17.8–20.2) 0.002≥$75,000 1,891 17.8 (13.9–21.7) 55,358 11.9 (11.2–12.6) 0.004Unknown 325 23.9 (13.2–34.6) 6,637 14.0 (12.2–15.9) 0.073Poverty status**Poor 1,557 29.6 (25.5–33.8) 8,047 26.7 (24.8–28.7) 0.207Near poor 2,299 27.6 (24.3–31.0) 15,714 24.2 (22.8–25.5) 0.055Not poor 4,812 23.7 (21.4–26.1) 98,495 15.5 (15.0–16.0) <0.001Unknown 677 26.4 (19.7–33.0) 7,858 17.1 (15.2–19.0) 0.008Health insurance coverageInsured 5,548 23.7 (21.6–25.7) 109,501 15.2 (14.7–15.7) 0.732Not insured 3,725 29.3 (26.7–31.9) 20,202 29.7 (27.5–30.0) <0.001Unknown 72 — — 412 21.7 (13.1–30.2) —U.S. Census Region††
Northeast 1,549 26.7 (21.9–31.6) 23,777 15.8 (14.8–16.8) <0.001Midwest 2,085 30.7 (27.3–34.2) 30,935 20.5 (19.5–21.5) <0.001South 3,445 27.8 (25.4–30.1) 46,060 18.4 (17.6–19.3) <0.001West 2,266 18.0 (15.2–20.9) 29,342 13.5 (12.8–14.2) 0.003
Abbreviations: CI = confidence interval; GED = General Educational Development certificate. * Reported having smoked ≥100 cigarettes during their lifetime and currently smoking every day or some days. † Two-tailed t-tests were used to determine statistically significant differences between smoking among accommodation and food services workers with all other
workers combined. Additional information available at http://www.cdc.gov/nchs/data/series/sr_10/sr10_256.pdf. § Estimated average annual number of adults who were employed during the week before interview. Estimated total number of working adults is rounded down to
the nearest 1,000. ¶ Estimates suppressed because relative standard error for estimate was >30%. ** Poverty status is based on family income and family size using the U.S. Census Bureau’s poverty thresholds for the previous calendar year. ‘‘Poor’’ persons are defined
as being below the poverty threshold. ‘‘Near poor’’ persons have family incomes of 100% to <200% of the poverty threshold. ‘‘Not poor’’ persons have family incomes that are ≥200% of the poverty threshold. Additional information available at ftp://ftp.cdc.gov/pub/health_statistics/nchs/dataset_documentation/nhis/2008/srvydesc.pdf.
†† Additional information available at http://www2.census.gov/geo/pdfs/maps-data/maps/reference/us_regdiv.pdf.

Morbidity and Mortality Weekly Report
MMWR / July 31, 2015 / Vol. 64 / No. 29 799
and material moving and other transportation (37.2%), man-agement (32.6%), supervisors of food preparers (27.3%), food and beverage servers (27.0%), and cooks and food preparers (26.5%) occupations (Table 3).
Discussion
The U.S. Surgeon General’s report on the health conse-quences of smoking concluded that disease and death from tobacco use are overwhelmingly caused by cigarettes and other combustible tobacco products, and that rapid elimination of their use will substantially reduce this burden (1). Furthermore, smoking costs an estimated annual >$130 billion in direct med-ical expenses, $151 billion in lost productivity, and $5.6 billion for lost productivity attributable to premature deaths caused by exposure to secondhand smoke (1). This report indicates that 2.4 million workers in the accommodation and food
services sector currently smoke cigarettes, and among those, prevalence was highest among males, non-Hispanic whites, persons with less education, those who live below the poverty level, those who have been working for <5 years, and those who had no health insurance. Furthermore, no significant changes in cigarette smoking prevalence were observed among accom-modation and food services sector workers since 2004–2010 (3), and smoking prevalence in this sector remains significantly higher than workers in all other sectors.
Several intervention and prevention measures have been shown to be effective in reducing smoking prevalence and secondhand smoke exposure (1,4), including smoke-free workplace policies. Although workplace policies or exposures to secondhand smoke in the workplace were not assessed in this study, historical data have shown that only 43% of workers in food preparation and service occupations are covered under
TABLE 2. Characteristics of cigarette smokers among adults aged ≥18 years currently working in accommodation and food services sector — National Health Interview Survey, 2011–2013
Characteristic
Accommodation and food services sector workers
All other workers (excluding accommodation and food services sector workers)
p value* % (95% CI) % (95% CI)
Education<High school diploma/GED 17.7 (15.0–20.4) 13.3 (12.4–14.2) 0.003High school diploma/GED 41.2 (37.4–45.0) 36.0 (34.7–37.4) 0.011>High school diploma/GED 40.2 (36.3–44.0) 50.4 (49.0–51.8) <0.001Poverty status†
Poor 22.3 (19.4–25.3) 11.6 (10.8–12.5) <0.001Near poor 28.4 (24.8–32.2) 19.0 (17. 9–20.2) <0.001Not poor 41.4 (37.1–45.7) 62.9 (61.6–64.4) <0.001Frequency of smokingEvery day 76.4 (73.1–79.7) 75.4 (74.3–76.5) 0.583Some days 23.6 (20.3–26.9) 24.6 (23.5–25.7) 0.583No. of cigarettes per day≤12 70.6 (66.5–74.7) 61.6 (61.0–63.8) <0.001>12 29.4 (25.3–33.6) 38.4 (36.2–39.0) <0.001Attempted to quit smoking§
Yes 48.0 (43.9–52.1) 46.5 (45.2–47.8) 0.503No 52.0 (47.9–56.1) 53.5 (52.2–54.8) 0.503Years on the job≤5 75.5 (71.8–79.2) 58.3 (56.9–59.7) <0.001>5 24.5 (20.8–28.2) 41.7 (40.3–43.1) <0.001Self-rated physical health¶
Excellent/Good 91.3 (89.2–93.5) 90.9 (90.2–91.6) 0.413Poor/Fair 8.7 (6.5–10.9) 9.1 (8.4–9.8) 0.413Self-rated emotional health**Poor 63.3 (57.0–69.6) 59.8 (57.6–62.0) 0.300Excellent/Good 36.7 (30.5–43.0) 40.2 (38.0–42.4) 0.300
Abbreviations: CI = confidence interval; GED = General Educational Development certificate. * Two-tailed t-tests were used to determine statistically significant differences between smoking among accommodation and food services workers with all other
workers combined. Additional information available at http://www.cdc.gov/nchs/data/series/sr_10/sr10_256.pdf. † Poverty status is based on family income and family size using the U.S. Census Bureau’s poverty thresholds for the previous calendar year. ‘‘Poor’’ persons are defined as
being below the poverty threshold. ‘‘Near poor’’ persons have family incomes of 100% to <200% of the poverty threshold. ‘‘Not poor’’ persons have family incomes that are ≥200% of the poverty threshold. Additional information available at ftp://ftp.cdc.gov/pub/health_statistics/nchs/dataset_documentation/nhis/2008/srvydesc.pdf.
§ Attempts to quit smoking were based on responses to the question, “During the past 12 months, have you stopped smoking for more than 1 day because you were trying to quit smoking?”
¶ Physical health was based on the responses to the question, “Would you say your health in general is excellent, good, fair, or poor?” ** Emotional health was based on the responses to the question, “Have you felt sad, nervous, restless or fidgety, hopeless, that everything was an effort, or worthless,
in the past 30 days?”

Morbidity and Mortality Weekly Report
800 MMWR / July 31, 2015 / Vol. 64 / No. 29
smoke-free worksite policies (7). Although such policies have been shown to be beneficial in reducing smoking rates, increas-ing quit rates among those who smoke, reducing secondhand smoke exposure among nonsmokers and thus improving overall health of workers, they have not yet been universally adopted or implemented.§
Other proven population-based interventions include increasing tobacco prices, implementing comprehensive smoke-free policies in workplaces and public places, employing anti-tobacco mass media campaigns, and ensuring barrier-free access to quitting assistance (8). Furthermore, in concert with Total Worker Health,¶ a strategy that integrates occupational safety and health protection with health promotion to prevent worker injury and illness, employers may adopt workplace interventions that address health risks from both the work environment and from individual behavior, with the goal of reducing smoking-related disparities. Employers, businesses, trade associations, and worker representatives can work in partnership with their state and local health departments to
implement these evidence-based policies and programs to reduce the prevalence of smoking among U.S. workers.
The findings in this report are subject to at least two limi-tations. First, the employment information collected applied only to the week preceding the interview. Some workers might have changed jobs and thus might have been in a different occupation or industry before the time of the survey. However, additional analyses examining longest held job showed similar results. Second, the extent of underreporting or over reporting of cigarette smoking could not be determined because smok-ing information was self-reported and was not validated by biochemical tests; nevertheless, comparison of self-reported smoking status with results of measured serum cotinine levels suggests generally high levels of validity (9).
Workers in the accommodation and food services sector have a higher prevalence of cigarette smoking than all other civilian U.S. working adults. A Healthy People 2020 objective (TU-13) calls for all states to enact laws on smoke-free indoor air that prohibits smoking in public places and worksites (2). Although considerable progress has been made during the past decade, with increasing numbers of states having comprehen-sive smoke-free laws that prohibit smoking in all indoor areas of worksites, restaurants, and bars, an estimated 2.4 million
TABLE 3. Cigarette smoking* prevalence among adults aged ≥18 years working in accommodation and food services sector, by industry and occupation — National Health Interview Survey, 2011–2013
Industry and occupation
Estimated population
(in thousands)†
Smoking prevalence
(%) (95% CI)
IndustryFood services and
drinking places7,899 26.8 (25.1–28.6)
Accommodation 1,446 20.6 (17.0–24.2)OccupationMotor vehicle operators and
material moving and other transportation
241 37.2 (23.6–50.8)
Management 1,170 32.6 (27.5–37.6)Supervisors, food
preparation711 27.3 (21.4–33.2)
Food and beverage serving 2,589 27.0 (23.7–30.3)Cooks and food preparation 1,952 26.5 (22.7–30.3)Building and ground
cleaning and maintenance567 20.7 (14.5–27.0)
Other food preparation and serving related
557 17.8 (11.8–23.8)
Office and administrative support
419 17.3 (11.1–23.5)
Sales and related 692 17.0 (11.3–22.8)Other food service workers 416 30.9 (21.5–40.3)Unknown 30 —§ —
* Persons who reported smoking ≥100 cigarettes during their lifetime and who at the time of interview reported smoking every day or some days.
† Estimated annual average number of adults who were employed during the week before interview. Total number of working adults is rounded down to the nearest 1,000.
§ Estimates suppressed because relative standard error for estimate was >30%.
SummaryWhat is already known on this topic?
Despite progress in reducing smoking prevalence over the past several decades, millions of working adults still smoke ciga-rettes, the most commonly used tobacco product in the United States. During 2004-2010, 19.6% of U.S. working adults were cigarette smokers. Among them, workers in the accommoda-tion and food services sector had one of the highest smoking prevalences (30.0%).
What is added by this report?
During 2011–2013, accommodation and food services workers had nearly 50% higher smoking prevalences than all other U.S. workers, and no significant changes in cigarette smoking prevalence were observed among these workers since 2004–2010. Workers in the accommodation and food service indus-tries and in most occupations within the sector had high smoking prevalences, which were greater than the target of Healthy People 2020 target of ≤12% for U.S. adults.
What are the implications for public health practice?
Continued implementation of effective public health interven-tions and adoption of integrated approaches to address health risks from both the work environment and individual behavior can reduce smoking-related disparities. Employers, businesses, trade associations, and worker representatives can work in partnership with their state and local health departments in implementing evidence-based policies and programs to reduce the prevalence of smoking among the working population.
§ Additional information on cessation interventions for workers available at http://www.cdc.gov/niosh/docs/2015-113.
¶ Additional information available at http://www.cdc.gov/niosh/twh.

Morbidity and Mortality Weekly Report
MMWR / July 31, 2015 / Vol. 64 / No. 29 801
workers in the food and accommodation services sector still smoke cigarettes (10). Continued adoption of proven population-based interventions, in concert with intensified implementation of comprehensive smoke-free laws in indoor public places and worksites, can reduce cigarette smoking and exposure to secondhand smoke and thus can improve individual health (1).
Acknowledgments
Linda J. Neff, Office on Smoking and Health, National Center for Chronic Disease Prevention and Health Promotion, CDC; Charlotte A. Schoenborn, Division of Health Interview Statistics, National Center for Health Statistics, CDC.
1Division of Respiratory Disease Studies, National Institute for Occupational Safety and Health, CDC; 2Office on Smoking and Health, National Center for Chronic Disease Prevention and Health Promotion, CDC.
Corresponding author: Girija Syamlal, [email protected], 304-285-5827.
References 1. CDC. The health consequences of smoking—50 years of progress: a report
of the Surgeon General, 2014. Atlanta, GA: US Department of Health and Human Services, CDC; 2014. Available at http://www.surgeongeneral.gov/library/reports/50-years-of-progress/exec-summary.pdf.
2. US Department of Health and Human Services. Tobacco use objectives. Healthy People 2020. Washington, DC: US Department of Health and Human Services; 2015. Available at https://www.healthypeople.gov/2020/topics-objectives/topic/tobacco-use/objectives.
3. CDC. Current cigarette smoking prevalence among working adults—United States, 2004–2010. MMWR Morb Mortal Wkly Rep 2011; 60:1305–9.
4. Ham DC, Przybeck T, Strickland JR, Luke DA, Bierut LJ, Evanoff BA. Occupation and workplace policies predict smoking behaviors: analysis of national data from the current population survey. J Occup Environ Med 2011;53:1337–45.
5. Task Force on Community Preventive Services. Recommendations for worksite-based interventions to improve workers’ health. Am J Prev Med 2010;38(Suppl):S232–6.
6. CDC. 2011 National Health Interview Survey (NHIS) public use data release: NHIS survey description. Hyattsville, MD: US Department of Health and Human Services, CDC; 2011. Available at ftp://ftp.cdc.gov/pub/Health_Statistics/NCHS/Dataset_Documentation/NHIS/2011/srvydesc.pdf.
7. Shopland DR, Anderson CM, Burns DM, Gerlach KK. Disparities in smoke-free workplace policies among food service workers. J Occup Environ Med 2004;46:347–56.
8. CDC. Best practices for comprehensive tobacco control programs—2014. Atlanta, GA: US Department of Health and Human Services, CDC; 2014. Available at http://www.cdc.gov/tobacco/stateandcommunity/best_practices/index.htm.
9. Caraballo RS, Giovino GA, Pechacek TF, Mowery PD. Factors associated with discrepancies between self-reports on cigarette smoking and measured serum cotinine levels among persons aged 17 years or older: Third National Health and Nutrition Examination Survey, 1988–1994. Am J Epidemiol 2001;153:807–14.
10. CDC. State smoke-free laws for worksites, restaurants, and bars—United States, 2000-2010. MMWR Morb Mortal Wkly Rep 2011;60:472–5.

Morbidity and Mortality Weekly Report
802 MMWR / July 31, 2015 / Vol. 64 / No. 29
Large Outbreak of Botulism Associated with a Church Potluck Meal — Ohio, 2015
Carolyn L. McCarty, PhD1,2; Kristina Angelo, DO2,3; Karlyn D. Beer, PhD2,3; Katie Cibulskas-White1; Kim Quinn, MS1; Sietske de Fijter, MS1; Rick Bokanyi, PhD1; Eric St. Germain1; Karen Baransi1; Kevin
Barlow4; Gwen Shafer4; Larry Hanna4; Kelly Spindler4; Elizabeth Walz, MD5; Mary DiOrio, MD1; Brendan R. Jackson, MD3; Carolina Luquez, PhD3; Barbara E. Mahon, MD3; Colin Basler, DVM2,3; Kathryn Curran,
PhD2,3; Almea Matanock, MD2,3; Kelly Walsh, MPH3; Kara Jacobs Slifka, MD2,3; Agam K. Rao, MD3 (Author affiliations at end of text)
On April 21, 2015, the Fairfield Medical Center (FMC) and Fairfield Department of Health contacted the Ohio Department of Health (ODH) about a patient suspected of having botulism in Fairfield County, Ohio. Botulism is a severe, potentially fatal neuroparalytic illness.* A single case is a public health emergency, because it can signal an outbreak (1). Within 2 hours of health department notification, four more patients with similar clinical features arrived at FMC’s emergency department. Later that afternoon, one patient died of respiratory failure shortly after arriving at the emergency department. All affected persons had eaten at the same widely attended church potluck meal on April 19. CDC’s Strategic National Stockpile sent 50 doses of botulinum antitoxin to Ohio. FMC, the Fairfield Department of Health, ODH, and CDC rapidly responded to confirm the diagnosis, identify and treat additional patients, and determine the source.
A confirmed case of botulism was defined as clinically com-patible illness in a person who ate food from the potluck meal and had 1) laboratory-confirmed botulism or 2) two or more signs of botulism or one sign and two or more symptoms† of botulism. A probable case was a compatible illness that did not meet the confirmed case definition in a person who ate food from the potluck meal.
Among 77 persons who consumed potluck food, 25 (33%) met the confirmed case definition, and four (5%) met the prob-able case definition. The median age of patients was 64 years (range = 9–87 years); 17 (59%) were female. Among 26 (90%) patients who reported onset dates, illness began a median of 2 days after the potluck (range = 1–6 days).
Twenty-seven of the 29 patients initially went to FMC. Twenty-two (76%) patients were transferred from FMC to six hospitals in the Columbus metropolitan area approximately 30 miles away; these transfers required substantial and rapid coordination. Twenty-five (86%) patients received botulinum antitoxin, and 11 (38%) required endotracheal intubation and mechanical ventilation; no other patients died. Within 1 week of the first patient’s arrival at the emergency depart-ment, 16 patients (55%) had been discharged. Among 19 cases that were laboratory-confirmed, serum and stool specimens were positive for botulinum neurotoxin type A or Clostridium botulinum type A.
Interviews were conducted with 75 of 77 persons who ate any of the 52 potluck foods. Consumption of any potato salad (homemade or commercial) yielded the highest association with probable or confirmed case status (risk ratio [RR] = 13.9; 95% confidence interval [CI] = 4.6–41.8), followed by home-made potato salad (RR = 9.1; CI = 3.9–21.2). Of 12 food specimens collected from the church dumpster, six were posi-tive for botulinum neurotoxin type A; five contained potato salad and one contained macaroni and cheese that might have been contaminated after being discarded.
The attendee who prepared the potato salad with home-canned potatoes reported using a boiling water canner, which does not kill C. botulinum spores, rather than a pressure can-ner, which does eliminate spores (2). In addition, the potatoes were not heated after removal from the can, a step that can inactivate botulinum toxin. The combined evidence implicated potato salad prepared with improperly home-canned potatoes, a known vehicle for botulism (3).
This was the largest botulism outbreak in the United States in nearly 40 years (Table). Early recognition of the outbreak by an astute clinician and a rapid, coordinated response likely reduced illness severity and facilitated early hospital discharge. This outbreak response illustrates the benefits of coordination among responders during botulism outbreaks. Close adherence to established home-canning guidelines can prevent botulism and enable safe sharing of home-canned produce (2).
Acknowledgments
Fairfield Medical Center, Lancaster, Ohio; Fairfield Department of Health, Lancaster, Ohio; Ohio Department of Health (ODH) Bureau of Infectious Diseases, Columbus, Ohio; ODH Bureau of Public Health Laboratory, Reynoldsburg, Ohio; ODH Office of Preparedness, Columbus, Ohio; Franklin County Public Health, Columbus, Ohio; Division of Foodborne, Waterborne,
* Botulinum neurotoxin and botulinum neurotoxin–containing species of Clostridium are subject to the select agent regulations (42 CFR Part 73).
† Symptoms of botulism include blurred vision, diplopia (double vision), dizziness, slurred speech, thick-feeling tongue, change in sound of voice, hoarseness, dry mouth, and dysphagia (difficulty swallowing). Signs of botulism include extraocular palsy (paralysis of eye muscles), ptosis, sluggishly reactive pupils, facial paralysis, palatal weakness, impaired gag reflex, musculoskeletal weakness or paralysis, and objective evidence of declining respiratory function.
Notes from the Field

Morbidity and Mortality Weekly Report
MMWR / July 31, 2015 / Vol. 64 / No. 29 803
and Environmental Diseases, National Center for Emerging and Zoonotic Infectious Diseases, CDC; Strategic National Stockpile, Office of Public Health Preparedness and Response, CDC; Office of Regulatory Affairs, CDC.
1Ohio Department of Health; 2Epidemic Intelligence Service, CDC; 3Division of Foodborne, Waterborne, and Infectious Diseases, National Center for Emerging and Zoonotic Infectious Diseases, CDC; 4Fairfield Department of Health; 5Fairfield Medical Center.
Corresponding author: Carolyn L. McCarty, [email protected], 614-728-6941.
TABLE. Outbreaks of botulism with more than 10 cases — United States, 1973–2015
Year State No. of cases No. of deaths Implicated foodHome-canned
ingredient Setting
1977 Michigan 58 0 Peppers Yes Restaurant1978 New Mexico 34 1 Bean and potato salad Unknown Country club1983 Illinois 28 0 Fried onions No Restaurant1994 Texas 23 0 Baked potatoes used in skordalia eggplant dip No Restaurant2001 Texas 16 0 Frozen, canned chili No Church2015 Ohio 29 1 Potato salad prepared with home-canned potatoes Yes Church
Source: CDC. Foodborne Disease Outbreak Surveillance System, unpublished data.
References1. Sobel J. Botulism. Clin Infect Dis 2005;41:1167–73.2. National Center for Home Food Preservation, US Department of
Agriculture. USDA complete guide to home canning, 2009 revision. Washington, DC: US Department of Agriculture; 2009. Available at http://nchfp.uga.edu/publications/publications_usda.html.
3. Sobel J, Tucker N, Sulka A, McLaughlin J, Maslanka S. Foodborne botulism in the United States, 1990–2000. Emerg Infect Dis 2004;10:1606–11.
Morbidity and Mortality Weekly Report
804 MMWR / July 31, 2015 / Vol. 64 / No. 29
Multistate Outbreak of Human Salmonella Poona Infections Associated with Pet Turtle Exposure — United States, 2014
Colin Basler, DVM1, 2; Lyndsay Bottichio, MPH2; Jeffrey Higa, MPH3; Belinda Prado, MPH4; Michael Wong3; Stacey Bosch, DVM2
(Author affiliations at end of text)
In May 2014, a cluster of human Salmonella Poona infec-tions was identified through PulseNet, the national molecu-lar subtyping network for foodborne disease surveillance. Historically, this rare serotype has been identified in multiple Salmonella outbreaks associated with pet turtle exposure and has posed a particular risk to small children (1,2). Although the sale and distribution of small turtles (those with carapace [upper shell] lengths <4 inches [<10.2 cm]) is prohibited by federal law, they are still available for legal purchase online for “bona-fide” scientific, educational, or exhibition purposes, other than use as pets (3). In addition, small turtles are still available for illegal purchase through transient street vendors, at flea markets, and at fairs.
During April 26–September 22, 2014, a total of 40 persons infected with Salmonella Poona pulse-field gel electrophoresis (PFGE) pattern JL6X01.0055 (the outbreak strain) were reported from 12 states. Patients ranged in age from <1 to 75 years (median = 5 years); 16 (40%) patients were aged ≤1 year, and 14 (35%) were female. Among 29 ill persons for whom information about hospitalization was available, eight (28%) were hospitalized; no deaths were reported. Among 28 ill persons who were interviewed, 13 (46%) reported exposure to turtles. Three ill persons reported the size of the turtles, and all identified turtles <4 inches in length. The outbreak strain was isolated from a pet turtle in a California patient’s
home. Turtles had been obtained from several types of loca-tions, including a carnival and a fair. The transient nature of turtle vendors hampered the traceback investigation. No other common food or animals were identified during the course of the investigation.
This outbreak demonstrates that turtles remain a source for human Salmonella infections, especially for young children. Because 40% of ill persons were infants aged ≤1 year and were unlikely to directly handle pet turtles, the potential role of indirect transmission in turtle-associated salmonellosis outbreaks should be considered. Turtles in the home could lead to environmental contamination with Salmonella bacteria and result in human illness. Educational campaigns directed toward parents of young children, in conjunction with the federal turtle ban, might help to prevent future turtle-associated salmonellosis outbreaks. 1Epidemic Intelligence Service, CDC; 2Division of Foodborne, Waterborne, and
Environmental Diseases, National Center for Emerging and Zoonotic Infectious Diseases, CDC; 3California Department of Public Health; 4City of Long Beach Department of Health and Human Services, Long Beach, California.
Corresponding author: Colin Basler, [email protected], 404-639-2214.
References1. CDC. Eight multistate outbreaks of human Salmonella infections linked
to small turtles (final update). Available at http://www.cdc.gov/salmonella/small-turtles-03-12/index.html.
2. CDC. Notes from the field: outbreak of salmonellosis associated with pet turtle exposures—United States, 2011. MMWR Morb Mortal Wkly Rep 2013;62:213.
3. Code of Federal Regulations. Turtles intrastate and interstate requirements, 21 C.F.R. § 1240.62 (2014). Available at http://www.accessdata.fda.gov/scripts/cdrh/cfdocs/cfcfr/cfrsearch.cfm?fr=1240.62.
Notes from the Field
Morbidity and Mortality Weekly Report
MMWR / July 31, 2015 / Vol. 64 / No. 29 805
Notes from the Field
Atypical Presentations of Hand, Foot, and Mouth Disease Caused by Coxsackievirus A6 — Minnesota, 2014
Vicki W. Buttery, MS1; Cynthia Kenyon, MPH1; Stacey Grunewald2; M. Steven Oberste, PhD3; W. Allan Nix3 (Author affiliations at end of text)
In June, 2014, the Minnesota Department of Health (MDH) was notified of a suspected varicella case in a child aged 2 years. The patient had a generalized rash with relative sparing of the trunk and was hospitalized overnight for treatment of dehydra-tion. The child’s mother, who was near the end of a pregnancy, also had a generalized rash, which included the perineal area. Identifying the cause of the rash was important to determine whether administration of varicella zoster immune globulin was indicated to prevent neonatal varicella (1). Enterovirus was detected in specimens from the woman and child by reverse transcriptase-polymerase chain reaction (RT-PCR) testing performed at MDH; partial genome sequencing by CDC showed that both patients were infected with coxsackievirus A6 (CVA6), one of the members of the genus Enterovirus that causes hand, foot, and mouth disease (HFMD).
In September 2014, MDH received reports of nine suspected HFMD cases at a college with approximately 1,000 students. Patients ranged in age from 19–47 years and included seven students, one faculty member, and one staff member. Upon arrival at the campus clinic, all had lesions in the mouth, on the palms of the hands, and on the soles of the feet. One patient, aged 20 years, reported having been exposed to a child with HFMD during the previous month; this patient reported the shedding of a thumbnail about 1 month after symptom onset. Throat swabs were obtained from five patients, and an open lesion was swabbed from a sixth. Testing by MDH using RT-PCR identified Enterovirus in four of five throat swab specimens and in the swab from the lesion; isolates were sub-sequently sequenced and identified by CDC as CVA6. There were no complications, and all patients recovered.
HFMD is a common, contagious childhood disease caused by members of the genus Enterovirus, usually the coxsackievi-ruses. HFMD is typically a mild, febrile illness, characterized by mouth sores and a red, sometimes blistery rash involving the palms of the hands and soles of the feet. Nail loss occasionally occurs, often weeks after symptom onset. In the United States, HFMD is commonly caused by coxsackievirus A16. Cases of HFMD with atypical rashes, involving the arms, legs, trunk,
perioral regions, buttocks, and genitalia have been recently reported in association with CVA6 (2–4). Although HFMD is most common among children aged ≤5 years, adults can also be infected. However, clusters of HFMD in adults are unusual.
During 2011–2012, an outbreak of HFMD caused by CVA6 occurred in North America. Sixty-three cases were reported to CDC, including 15 among adults. Approximately 50% of the adult patients had reported exposure to children with HFMD (2). The college outbreak reported here might also have begun with an exposure to a symptomatic child. The spread of HFMD among adults in a college setting has not been previously described.
Most cases of HFMD are mild and treatment is supportive, although CVA6 has been associated with more severe disease (2). HFMD is transmitted person-to-person through contact with vesicle fluid, respiratory secretions, and feces. Hand wash-ing and routine disinfection of surfaces help prevent spread. Awareness of unusual features of CVA6, including the occur-rence of a varicella-like rash (3,5–7) or a rash with an atypical distribution, can assist health care providers in diagnosing HFMD and recommending appropriate care. 1Minnesota Department of Health; 2University of Minnesota at Crookston;
3Division of Viral Diseases, National Center for Immunization and Respiratory Diseases, CDC.
Corresponding Author: Vicki Buttery, [email protected], 651-201-5197.
References1. CDC. Updated recommendations for use of VariZIG—United States,
2013. MMWR Morb Mortal Wkly Rep 2013;62:574–6.2. CDC. Notes from the field: severe hand, foot, and mouth disease
associated with coxsackievirus A6—Alabama, Connecticut, California, and Nevada, November 2011–February 2012. MMWR Morb Mortal Wkly Rep 2012;61:213–4.
3. Sinclair C, Gaunt E, Simmonds P, et al. Atypical hand, foot, and mouth disease associated with coxsackievirus A6 infection, Edinburgh, United Kingdom, January to February 2014. Euro Surveill 2014;19:6–10.
4. Mathes EF, Oza V, Frieden I, et al. “Excema coxsackium” and unusual cutaneous findings in an enterovirus outbreak. Pediatrics 2013;132:e149–57.
5. Flett K, Youngster I, Huang J, et al. Hand, foot, and mouth disease caused by coxsackievirus A6 [Letter]. Emerg Infect Dis 2012;18:1702–4.
6. Hubiche T, Schuffenecker I, Boralevi F, et al. Dermatological spectrum of hand, foot, and mouth disease from classical to generalized exanthema. Pediatr Infect Dis J 2014;33:e92–8.
7. Miyamoto A, Hirata R, Ishimoto K, et al. An outbreak of hand-foot-and-mouth disease mimicking chicken pox, with a frequent association of onychomadesis in Japan in 2009: a new phenotype caused by coxsackievirus A6. Eur J Dermatol 2014;24:103–4.

Morbidity and Mortality Weekly Report
806 MMWR / July 31, 2015 / Vol. 64 / No. 29
Errata
Vol. 64, No. 18In the report, “Controlling the Last Known Cluster of Ebola
Virus Disease — Liberia, January–February 2015, the author list should read as follows: Tolbert Nyenswah1, Mosoka Fallah1, Sonpon Sieh1, Karsor Kollie1, Moses Badio1, Alvin Gray1, Priscilla Dilah1, Marnijina Shannon1, Stanley Duwor1, Chikwe Ihekweazu2, Thierry Cordier-Lasalle2, Shivam A. Shinde2, Esther Hamblion2, Gloria Davies-Wayne2, Murugan Ratnesh2, Christopher Dye2, Jonathan S. Yoder3, Peter McElroy3, Brooke Hoots3, Athalia Christie3, John Vertefeuille3, Sonja J. Olsen3, A. Scott Laney3, Joyce J. Neal3, Sirin Yaemsiri3, Thomas R. Navin3, Stewart Coulter3, Paran Pordell3, Terrence Lo3, Carl Kinkade3, Frank Mahoney3
Vol. 64, No. 22In the report, “Use of Serogroup B Meningococcal Vaccines
in Persons Aged ≥10 Years at Increased Risk for Serogroup B Meningococcal Disease: Recommendations of the Advisory Committee on Immunization Practices, 2015,” on page 610, the fifth paragraph should read as follows: “In four clinical tri-als (9–11,13) a total of 2,557 subjects received at least 1 dose of MenB-FHbp (21); no serious adverse events considered by the study investigator to be related (or possibly related) to the vaccine were reported. In three additional studies (12) (Pfizer, unpublished data) with a total of 7,251 sub-jects receiving at least 1 dose of MenB-FHbp, four subjects reported seven serious adverse events that were considered by the study investigator to be related (or possibly related) to the vaccine.§ All vaccine-related serious adverse events resolved without sequelae. No increased risk for any specific serious adverse event considered to be clinically significant was iden-tified in any of the studies. No deaths were considered to be related to MenB-FHbp. The most common solicited adverse reactions observed in the 7 days after receipt of MenB-FHbp in the clinical trials were pain at the injection site, fatigue, headache, myalgia, and chills (21).”
Vol. 64, No. 28In the report, “Launch of a Nationwide Hepatitis C
Elimination Program — Georgia, April 2015,” on page 755, the second sentence should read, “MoLHSA partnered with Gilead Sciences, a pharmaceutical manufacturer that agreed to support the program by providing an initial 5,000 courses of the antiviral medications sofosbuvir (Sovaldi), followed by 20,000 treatment courses of ledipasvir-sofosbuvir (Harvoni) annually at no cost.
Announcement
Additional Guidance Online for Providers Regarding 9-Valent HPV Vaccine Use Among Persons Who Previously Received HPV Vaccination
A 9-valent human papillomavirus (HPV) vaccine (Gardasil 9, Merck and Co., Inc.) was licensed for use in females and males in the United States in December 2014 (1,2). This is the third HPV vaccine licensed by the Food and Drug Administration; the other vaccines are the bivalent HPV vaccine, licensed for use in females, and the quadrivalent HPV vaccine, licensed for use in females and males (3).
In February 2015, the Advisory Committee on Immunization Practices (ACIP) recommended 9-valent HPV vaccine as one of three HPV vaccines that can be used for routine vaccination of females and one of two HPV vaccines for routine vaccination of males. ACIP recommendations were published in a March 2015 report (4). Additional information has been posted on the CDC website to provide guidance on issues that were not addressed in the March report but are likely to arise during the transition to 9-valent HPV vaccine, including questions about use of 9-valent HPV vaccine among persons who previously received bivalent or quadrivalent HPV vaccine (http://www.cdc.gov/vaccines/who/teens/downloads/9vHPV-guidance.pdf).
References1. Food and Drug Administration. Highlights of prescribing information:
Gardasil 9 (human papillomavirus 9-valent vaccine, recombinant). Silver Spring, MD: US Department of Health and Human Services, Food and Drug Administration; 2014. Available at http://www.fda.gov/downloads/BiologicsBloodVaccines/Vaccines/ApprovedProducts/UCM426457.pdf.
2. Joura EA, Giuliano AR, Iversen OE, et al. A 9-valent HPV vaccine against infection and intraepithelial neoplasia in women. N Engl J Med 2015;372:711–23.
3. Markowitz LE, Dunne EF, Saraiya M, et al. Human papillomavirus vaccination: recommendations of the Advisory Committee on Immunization Practices (ACIP). MMWR Recomm Rep 2014;63:1–30.
4. Petrosky E, Bocchini JA, Hariri S, et al. Use of 9-valent human papillomavirus (HPV) vaccine: updated HPV vaccination recommendations of the Advisory Committee on Immunization Practices. MMWR Morb Mortal Wkly Rep 2015;64:300–4.
hxv5
Highlight
hxv5
Highlight
hxv5
Highlight

Morbidity and Mortality Weekly Report
MMWR / July 31, 2015 / Vol. 64 / No. 29 807
During 2012–2013, among persons aged ≥65 years, men had higher age-adjusted death rates than women from all unintentional injuries, (128.3 versus 84.1 deaths per 100,000 population, respectively), and from the five leading causes of unintentional injury death. Death rates due to falls were the highest for both men and women, with the rates for men 1.4 times higher than the rates for women (66.7 versus 48.8). Compared to the age-adjusted death rates for women, the rates for men were 2.1 times higher for motor vehicle traffic crashes (21.0 versus 9.9).
Source: National Vital Statistics System mortality data. Available at http://www.cdc.gov/nchs/deaths.htm.
Reported by: Ellen A. Kramarow, PhD, [email protected], 301-458-4325; Yahtyng Sheu, PhD.
* Per 100,000 population, age-adjusted to the 2000 U.S. standard population. † Unintentional injury deaths are identified using the International Classification of Diseases, Tenth Revision
(ICD-10) underlying cause of death codes V01-X59, Y85-Y86 (all unintentional); W00-W19 (fall); [V02–V04](.1,.9), V09.2, [V12–V14](.3–.9), V19(.4–.6), [V20–V28](.3–.9), [V29–V79](.4–.9), V80(.3–.5), V81.1, V82.1, [V83–V86](.0–.3), V87(.0–.8), V89.2 (motor vehicle traffic); W75-W84 (suffocation); X40-X49 (poisoning); and X00-X09 (fire or flame).
¶ 95% confidence interval.
0
20
40
60
80
100
120
140
Dea
ths
per 1
00,0
00
MaleFemale
¶
PoisoningSu�ocationMotor vehicletra�c
FallAllunintentional
Fire or �ame
QuickStats
FROM THE NATIONAL CENTER FOR HEALTH STATISTICS
Death Rates* from Unintentional Injury Among Adults Aged ≥65 Years, by Cause of Death† and Sex — National Vital Statistics System,
United States, 2012–2013

ISSN: 0149-2195
The Morbidity and Mortality Weekly Report (MMWR) Series is prepared by the Centers for Disease Control and Prevention (CDC) and is available free of charge in electronic format. To receive an electronic copy each week, visit MMWR’s free subscription page at http://www.cdc.gov/mmwr/mmwrsubscribe.html. Paper copy subscriptions are available through the Superintendent of Documents, U.S. Government Printing Office, Washington, DC 20402; telephone 202-512-1800.
Readers who have difficulty accessing this PDF file may access the HTML file at http://www.cdc.gov/mmwr/index2015.html. Address all inquiries about the MMWR Series, including material to be considered for publication, to Executive Editor, MMWR Series, Mailstop E-90, CDC, 1600 Clifton Rd., N.E., Atlanta, GA 30329-4027 or to [email protected].
All material in the MMWR Series is in the public domain and may be used and reprinted without permission; citation as to source, however, is appreciated.
Use of trade names and commercial sources is for identification only and does not imply endorsement by the U.S. Department of Health and Human Services.
References to non-CDC sites on the Internet are provided as a service to MMWR readers and do not constitute or imply endorsement of these organizations or their programs by CDC or the U.S. Department of Health and Human Services. CDC is not responsible for the content of these sites. URL addresses listed in MMWR were current as of the date of publication.
Morbidity and Mortality Weekly Report