An Open-Source FPGA-Accelerated x86 Full-System Emulator by Elias El Ferezli A thesis
PrEsto: An FPGA-Accelerated Power EstimationMethodology for Complex Systems
Dam Sunwoo, Gene Y. Wu, Nikhil A. Patil and Derek ChiouDepartment of Electrical and Computer Engineering
The University of Texas of Austin{sunwoo, wu, npatil, derek}@ece.utexas.edu
Abstract—Reduced or bounded power consumption has be-come a first-order requirement for modern hardware design.As a design progresses and more detailed information becomesavailable, more accurate power estimations become possible butat the cost of significantly slower simulation speeds. Powersimulation that is both sufficiently-accurate and fast would havea positive impact on architecture and design.
In this paper, we propose PrEsto, a power modeling method-ology that improves the speed and accuracy of power estima-tion through FPGA-acceleration. PrEsto automatically generatesFPGA-based power estimators consisting of linear models thatare designed to be integrated into fast, accurate FPGA-basedperformance simulators of microprocessors. Our prototype im-plementation predicts the cycle-by-cycle power dissipation of theLEON3 core and the ARM Cortex-A8 core to within 6% ofa commercial gate-level power estimation tool, while runningseveral orders of magnitude faster. The combination of simulationspeed and accuracy is not only useful to architects and designers,it is fast enough to be useful for power-sensitive operating systemand application developers.
I. INTRODUCTION
Reduced and/or bounded power dissipation has become afirst-order requirement for virtually all engineered systems.Power has become especially important in microprocessors,ranging from the lowest-end embedded processors to thehighest-end server processors, due to their ubiquity and ten-dency to consume a large fraction of any system’s powerbudget. Thus, the better the available tools to predict the powerdissipation of a particular design, the better the end-product.
Detailed power simulations using standard EDA tools runextremely slowly, making running full applications virtuallyimpossible. Thus, though the simulator itself may be accurate,the overall results could be inaccurate if what is simulatedis not representative. To improve power simulation speeds,spreadsheet power modeling, where the number of times thecomponent is used by a sequence of operations is multipliedby a pre-computed fixed energy consumption per use, is oftenemployed. This technique is, however, inaccurate because itdoes not account for either timing information or input data.
Detailed power simulations require detailed toggle activity(traditionally generated by RTL simulation) that itself is tradi-tionally slow. The emergence of hardware-accelerated simula-tion technologies, such as Palladium, Quickturn, or academicprojects accelerating computer system simulation [1], [2] havedramatically sped up the generation of toggle activity, openingup the opportunity to speed up accurate power simulation. To
do so, however, requires power models that run at roughlythe same speeds and can be tightly integrated into the samehardware-accelerated platforms.
There is a plethora of work [3]–[7] in the area of regression-based power estimation. Some model cycle-by-cycle power[4], and others model system-level power [7], but rarely both.These models are generally too complex to implement onhardware-accelerated platforms.
In this paper, we introduce PrEsto (PoweR ESTimatOr), anew power estimation methodology that systematically gener-ates fast, accurate, easy-to-implement, and resource-efficientpower models for FPGA platforms. PrEsto models are in-tended to generate accurately comparable power estimations,both at the architectural level and design phases, and run fastenough for even software developers to power-tune operatingsystems and applications.
The contributions of this paper are as follows:• The introduction of a systematic method (PrEsto) to au-
tomatically generate simple, yet accurate, power modelsdesigned to accurately predict cycle-by-cycle power. Themodels are driven by actual control and data transitions.PrEsto power predictions for LEON3 and ARM Cortex-A8 cores are within 6% of gate-level predictions gener-ated by commercial tools (Sections III, V).
• Efficient FPGA-based implementations of PrEsto modelsthat run several orders of magnitudes faster than gate-level simulation and at least an order of magnitude fasterthan software-based architectural power estimation toolswhile being more accurate (Sections IV, V).
• The introduction and evaluation of FPGA implementa-tions of macromodels that can complement the linearpower models for irregular components (Section VI).
II. REDUCING THE COMPLEXITY OF POWER MODELS
Power consumption can be modeled accurately using de-tailed models with sufficient information. Accelerating SPICEmodels with FPGAs have been studied [8], but are impracticalfor large designs. Ideally, we would like to have power modelsthat are very simple and easy to implement on FPGAs, but stillvery accurate. The challenge lies in reducing the complexityof detailed power models without sacrificing accuracy.
The power dissipation of a circuit is more sensitive tosome primary inputs than others [3]. This observation suggeststhat the power dissipation of large complex designs, e.g.,
microprocessors, can be accurately estimated using a smallnumber of key contributor signals. Examples of such signals ina microprocessor include cache read/write and hit/miss signals,pipeline stall signals, etc.
Linear Power Models: Given n signals (si) in a moduleas predictor variables and the power consumption (Pm) ofthe module as the response variable, the relationship betweenthe response and the predictor variables can be modeled as alinear equation as follows:
Pm = c0 + c1s1 + c2s2 + ...+ cnsn
+ cn+1(s1s2) + cn+2(s1s3) + ...+ c2n(s1s2...sn) (1)
where ci is the coefficient of each term, capturing the constantportion (CV 2f ) of the CMOS dynamic power, P = αCV 2f .The activity factor, α, is determined by the actual transitionsof signals, si. The predictor variables in Equation (1) includeall possible crosses of factors, where a cross is the product oftwo or more signals, corresponding to certain events within themodules that are only triggered when more than one controlsignals are asserted. Thus, cross terms are also important. Thetotal number of terms in the equation is 2n. While more signalsand thus more terms in the model will eventually result in aperfect complete equation, having more terms is costly bothin terms of computation and storage.
We use three approaches to reduce the complexity of thelinear model. First, we reduce the design space by usingfewer signals (e.g., high-level signals such as signals at moduleboundaries). Second, for buses, we further reduce the numberof bits by using the Hamming distances from cycle to cycleinstead of using individual bits, since bits in buses are unlikelyto affect power consumption outside the group. Third, we limitboth (i) the maximum number of factors per cross term and(ii) the total number of terms in the linear model. The degreeof optimization can be adjusted arbitrarily depending on thecomplexity of the design, desired accuracy and executionplatform resource constraints.
III. AUTOMATIC POWER MODEL GENERATION IN PRESTO
We propose an automated process that can generate and op-timize the power models. The algorithm in Figure 1 describesthe Automated Power Model Generation (APMG) process forPrEsto. A group of high-level signals (S) and buses (B) arepassed in as candidate factors to be used in the power models.There is no restriction on which signals can be candidatefactors. Signals available in high-level models or input/outputport signals at HDL module boundaries or internal registerskeeping state are good choices for candidate factors. Usingeven gross architectural intuition and filtering out some rarelyused signals (e.g., debug ports) from the list of input/outputports significantly helps reducing the runtime and memoryrequirement of APMG. We run a set of short training runsusing detailed tools (e.g., gate-level simulation) and smalltraining benchmarks. DS , DB and DP are arrays of the dataof the signals, buses, and power, respectively, populated overtime from the training simulation. DS and DB can be multi-dimensional as they may contain more than one signal/bus.
Input: Candidate signals and training data(S, DS), Candidate busesand training data(B, DB), Power and training data(P, DP ),Maximum number of terms per module(N ), CoverageThreshold(Thcov)
Output: TotalPowerModel1: for all module m do2: lm ← GenLinearModel
(Pm = (1 +
∑bi∈Bm
HD(bi))×(1+
∑sj∈Sm
sj+∑
sk∈Sm,sl∈Sm,sk 6=slsksl), DSm , DBm ,
DPm
)3: for all term t in lm do4: MaxValt = |t .c| ×max (HD(t .b))5: end for6: Sort terms by MaxVal and select top N terms7: T1...N ← selected sorted terms8: Calculate Coverage using T1...N
9: PowerModelm =∑N
i=1Ti
10: if Coverage < Thcov then11: Add more candidate signals to S and B, increase N , or
refine training benchmark12: goto line 213: end if14: end for15: TotalPowerModel =
∑m
PowerModelm
Fig. 1. Algorithm for Automatic Power Model Generation (APMG)
The function GenLinearModel in line 2 of the algorithmtakes an input formula (without coefficients) and predic-tor/response variable values as input. It outputs the coefficientsfor the linear model using linear least squares regressionmethods. For each module in the design, an input formula isconstructed using individual control signals and the Hammingdistances (denoted as HD in the algorithm) of buses, includingthe crosses of the factors, as predictor variables and the poweras the response variable. The input formula is shown in afactorized form in line 2. There is also an intercept (constant)term in the input formula. The subscripted Bm, Sm and Pm
denote the variables specific to module m. |Bm| denotesthe number of buses in Bm and |Sm| denotes the numberof signals in Sm. If we consider the entire design spaceincluding all cross factors, the number of terms in the linearmodel follows O(2|Bm|+|Sm|). Thus, the complexity growsexponentially with the number of buses and signals given.
To bound the complexity and to make FPGA implementa-tion practical, we limit the number of factors allowed to forma cross in a term. For all terms that have two or more HDfactors, additional multiplication operations that cost FPGAresources will be required, whereas one bit control signals aremore cost-effective to use. For all the experiments shown inthis paper, we limited the cross factors to a three-way productconsisting of at most one bus HD and at most two controlsignals as shown in the input formula (line 2). A typical termin the linear model will have the form of c · HD(bi) · sj · sk ,where c is the coefficient. By limiting the cross factors, thecomplexity of the model is reduced to O(|Bm| · |Sm|2). Thisrestriction can be adjusted to achieve better accuracy if FPGAresources and APMG runtimes permit.
APMG further attempts to reduce the number of terms inthe linear model and thus reduce the complexity by keeping
only the terms with larger potential values. Since terms withan HD component should weigh the coefficients more heavily,we calculate the maximum value of each term as the absolutevalue of the coefficient(t.c) multiplied by the maximum HDof the bus component in that term (t.b) (line 4), and then selectthe top N terms that have greatest maximum values where Nis specified as a parameter (lines 6-7). A larger value of N willimprove the accuracy of the power model at the cost of highercomplexity. Analyses on the impact of different values of N(both on accuracy and resource) are presented in Section V.
If certain components in the design are not exercised by thetraining benchmark, they may not be reflected in the powermodel. We measure the static coverage of the power modelsto ensure most of the design is covered. Coverage is definedas the proportion of nets that are reachable when propagatingfrom the signals/buses that are chosen for the power models.The fact that a net is covered does not necessarily imply thatwe have the correct weightings for that net, but if a net notcovered, its effect cannot be accounted for in the generatedequation. If the resulting coverage of the power model is notsatisfactory, the user can add more candidate signals and/orrefine the training benchmark to exercise the uncovered area,and then repeat the power modeling for the given module (lines10-12). Since coverage is generally satisfactory even withoutrefinement, the coverage detector is just a safety net. Section Vshows that PrEsto initially reaches high coverage. The totalpower of the design is estimated as a linear sum of the powermodels for all modules (line 15).
PrEsto automatically generates fast power models usingexisting power data either generated by a power simulationof RTL mapped to the appropriate process technology, ormeasured from real parts. Designers can extrapolate existingpower models for designs on new process technologies thatreuse existing components. Of course, RTL is not availablefor every next-generation component. In such cases, one cancombine PrEsto power models with other power modelingtechniques such as (i) dividing the component into smallerbuilding blocks that have RTL or other power models, (ii)analytical models such as those in Wattch [9] or CACTI [10] or(iii) a combination of the two [11] using such models. The totalpower can be calculated by a linear sum of power estimatesmodeled by different modeling approaches.
IV. PRESTO POWER MODELS ON FPGAS
Accurate power models require signal toggle informationgenerated by an accurate simulator. Such simulators are oftenslow, in the 1Hz-100Hz range for gate-level simulators, and inthe 1KHz-100KHz range for behavioral RTL or architecturalsimulators. However, FPGA-based simulators that run in the1MIPS-10MIPS range have recently been developed. Althoughsoftware implementations of PrEsto models are significantlyfaster than gate-level power estimation (Section V), theywere designed to be implemented in FPGA-based simulators,enabling accurate power estimation at 10MIPS and faster.
✓Timing Model (TM)
✓
Interface
Functional Model (FM)
FPGA
Trace
Feedback
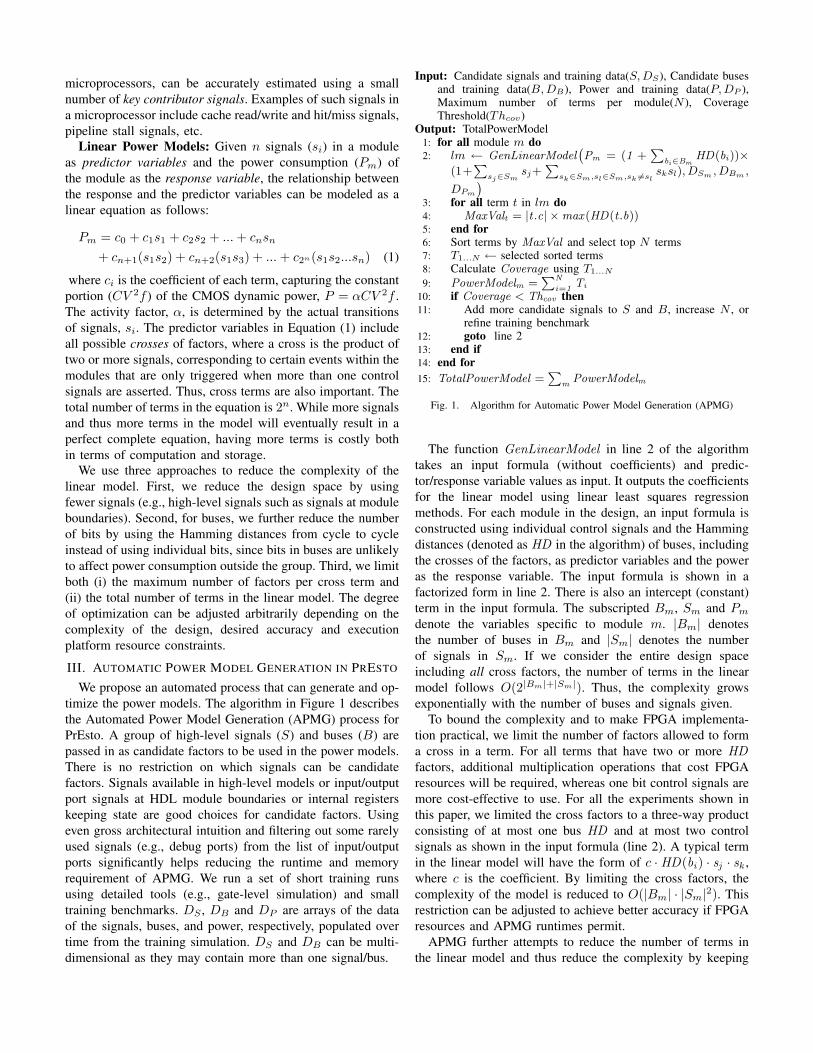
Fig. 2. A high-level view of a FAST simulator
A. Integrating with FAST Simulators
We integrated PrEsto models into an FPGA-AcceleratedSimulation Technologies (FAST) [1], [2] simulator prototypeto (i) demonstrate that they can be integrated into suchsimulators, (ii) measure their simulation performance, and (iii)determine the FPGA-resources they require.
A high-level view of a FAST simulator is shown in Figure 2.FAST simulators are partitioned into a Functional Model (FM)and a Timing Model (TM). The FM executes the functionalaspect of a system, including the behavior of the ISA andperipherals, while the TM models the timing aspects of thesystem. The FM speculatively executes instructions and passesa trace of those instructions, in the order it fetches andexecutes them, to the TM that uses that trace to predicttiming. Any discrepancy between the FM fetch/execute pathand the TM-predicted target fetch/execute path (e.g., branchmisprediction) is addressed by the FM rolling back and re-executing under the guidance of the TM. The FM runsefficiently on a microprocessor. The TM is parallelized byrunning on an FPGA that can efficiently emulate the parallelstructures found in modern computer systems. The speculativenature of FAST simulators means the FM and TM can befairly decoupled while maintaining excellent simulation speedas long as divergence occurs infrequently since rollbacks, andtheir overhead, only occur when there is divergence.
Since FAST simulators are simulators and not emulators,modules can take multiple FPGA cycles to model a singletarget cycle. For example, instead of trying to squeeze an eight-entry CAM into a single clock cycle, it can be modeled in eightFPGA cycles, reducing TM complexity while enabling highfrequencies. By leveraging the multiple FPGA cycle supportneeded for flexible simulation, more accurate power modelsthan would be possible in a single FPGA cycle can be used.
Also, full emulation approaches can consume a huge amountof FPGA resources. The Intel Atom processor port fills upa Xilinx Virtex-5 LX330 FPGA, even after removing theentire L2 cache [12], leaving no room for power models.The FAST TM is much more efficient, as a great amountof the functionality can be abstracted away. Thus, FPGA-based simulators are an ideal environment in which to integratePrEsto power models.
B. Implementing PrEsto on FPGAs
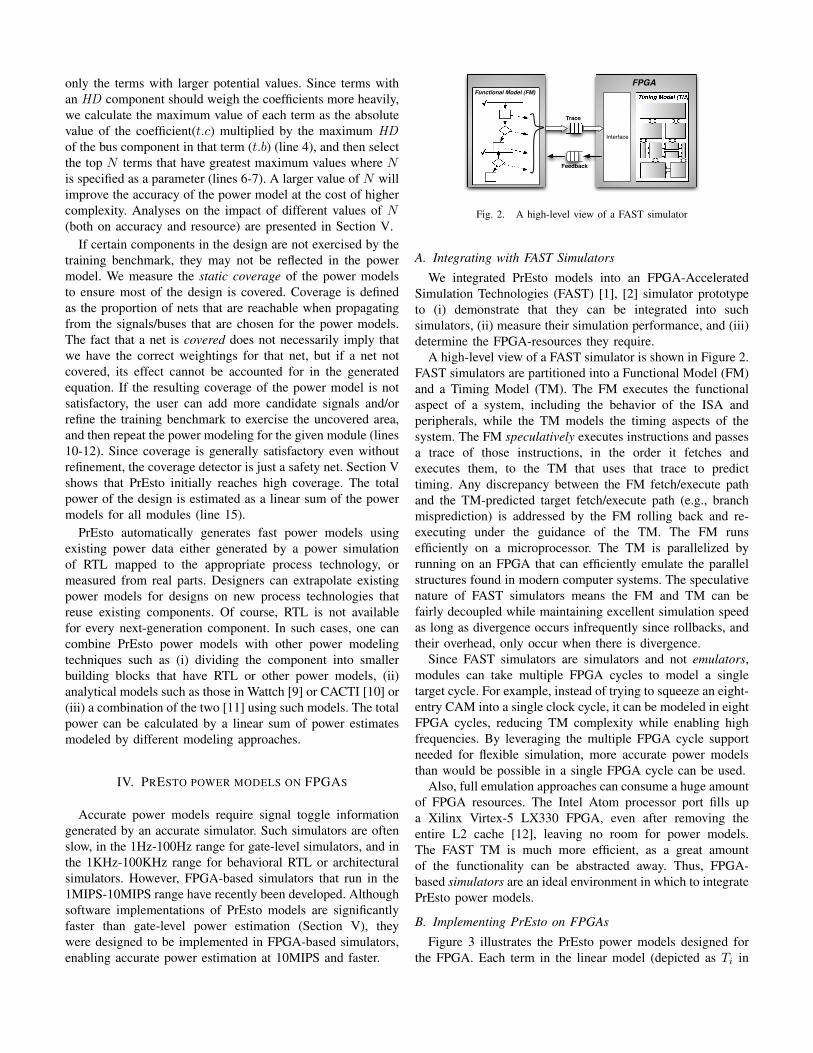
Figure 3 illustrates the PrEsto power models designed forthe FPGA. Each term in the linear model (depicted as Ti in
Input Vector
Power
+
0 1
Coeff
×
HD
…
T0 T1 Tn
sksjbi
HD(bi)
Fig. 3. Block diagram of a PrEsto power model implemented for an FPGA
Core (ISA) LEON3 (SPARC V8) Cortex-A8 (ARMv7)Pipeline Single-issue, 7-stage in-order Superscalar (dual-issue) 13-stage
Branch Pred N/A Two-level dynamic branch predL1 I/D-Cache 4KB, 4-way, LRU 32KB, 4-way, Pseudo-random
L2 Cache N/A 256KB, 8-way, Pseudo-randomI/D TLB 8 entries, Increment replc. 32 entries, fully assoc.
TABLE ILEON3 AND CORTEX-A8 CONFIGURATION USED
the figure) takes at most one bus signal (bi) and two controlsignals (sj , sk) as an input. The HD of a bus is calculatedby first XORing the previous and current input vectors, thencounting the number of ones. The HD is then multiplied bythe coefficient when the selected control signals are true. TheHD multiplicand is relatively short (only 6 bits for a 32-bit bus), requiring few resources. Multiplication can be doneefficiently using the available DSP slices (192 in Virtex-5LX330 parts) in most modern FPGA devices. If the user needsmore multipliers or chooses not to use the dedicated DSPslices, the multiplication can be implemented with shiftersand adders using general FPGA resources. The total predictedpower is the sum of the terms.
V. EXPERIMENTAL RESULTS
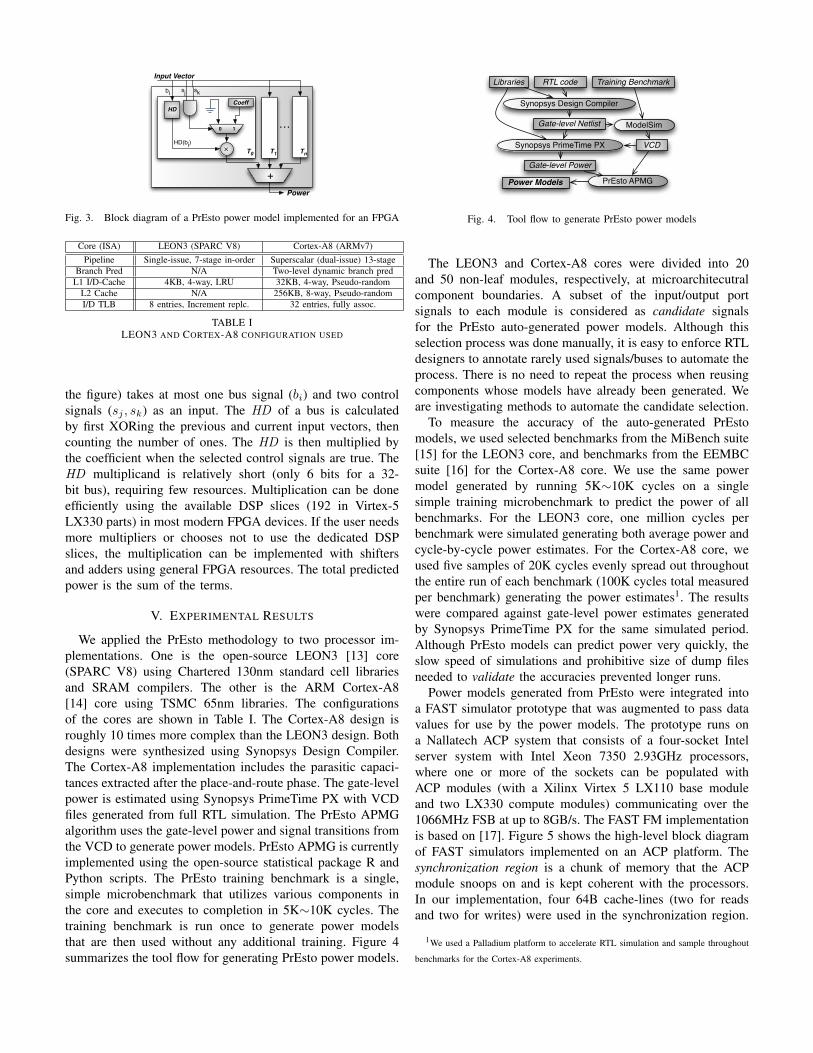
We applied the PrEsto methodology to two processor im-plementations. One is the open-source LEON3 [13] core(SPARC V8) using Chartered 130nm standard cell librariesand SRAM compilers. The other is the ARM Cortex-A8[14] core using TSMC 65nm libraries. The configurationsof the cores are shown in Table I. The Cortex-A8 design isroughly 10 times more complex than the LEON3 design. Bothdesigns were synthesized using Synopsys Design Compiler.The Cortex-A8 implementation includes the parasitic capaci-tances extracted after the place-and-route phase. The gate-levelpower is estimated using Synopsys PrimeTime PX with VCDfiles generated from full RTL simulation. The PrEsto APMGalgorithm uses the gate-level power and signal transitions fromthe VCD to generate power models. PrEsto APMG is currentlyimplemented using the open-source statistical package R andPython scripts. The PrEsto training benchmark is a single,simple microbenchmark that utilizes various components inthe core and executes to completion in 5K∼10K cycles. Thetraining benchmark is run once to generate power modelsthat are then used without any additional training. Figure 4summarizes the tool flow for generating PrEsto power models.
Libraries RTL code Training Benchmark
Synopsys Design Compiler
ModelSimGate-level Netlist
Synopsys PrimeTime PX
PrEsto APMG
VCD
Power Models
Gate-level Power
Fig. 4. Tool flow to generate PrEsto power models
The LEON3 and Cortex-A8 cores were divided into 20and 50 non-leaf modules, respectively, at microarchitecutralcomponent boundaries. A subset of the input/output portsignals to each module is considered as candidate signalsfor the PrEsto auto-generated power models. Although thisselection process was done manually, it is easy to enforce RTLdesigners to annotate rarely used signals/buses to automate theprocess. There is no need to repeat the process when reusingcomponents whose models have already been generated. Weare investigating methods to automate the candidate selection.
To measure the accuracy of the auto-generated PrEstomodels, we used selected benchmarks from the MiBench suite[15] for the LEON3 core, and benchmarks from the EEMBCsuite [16] for the Cortex-A8 core. We use the same powermodel generated by running 5K∼10K cycles on a singlesimple training microbenchmark to predict the power of allbenchmarks. For the LEON3 core, one million cycles perbenchmark were simulated generating both average power andcycle-by-cycle power estimates. For the Cortex-A8 core, weused five samples of 20K cycles evenly spread out throughoutthe entire run of each benchmark (100K cycles total measuredper benchmark) generating the power estimates1. The resultswere compared against gate-level power estimates generatedby Synopsys PrimeTime PX for the same simulated period.Although PrEsto models can predict power very quickly, theslow speed of simulations and prohibitive size of dump filesneeded to validate the accuracies prevented longer runs.
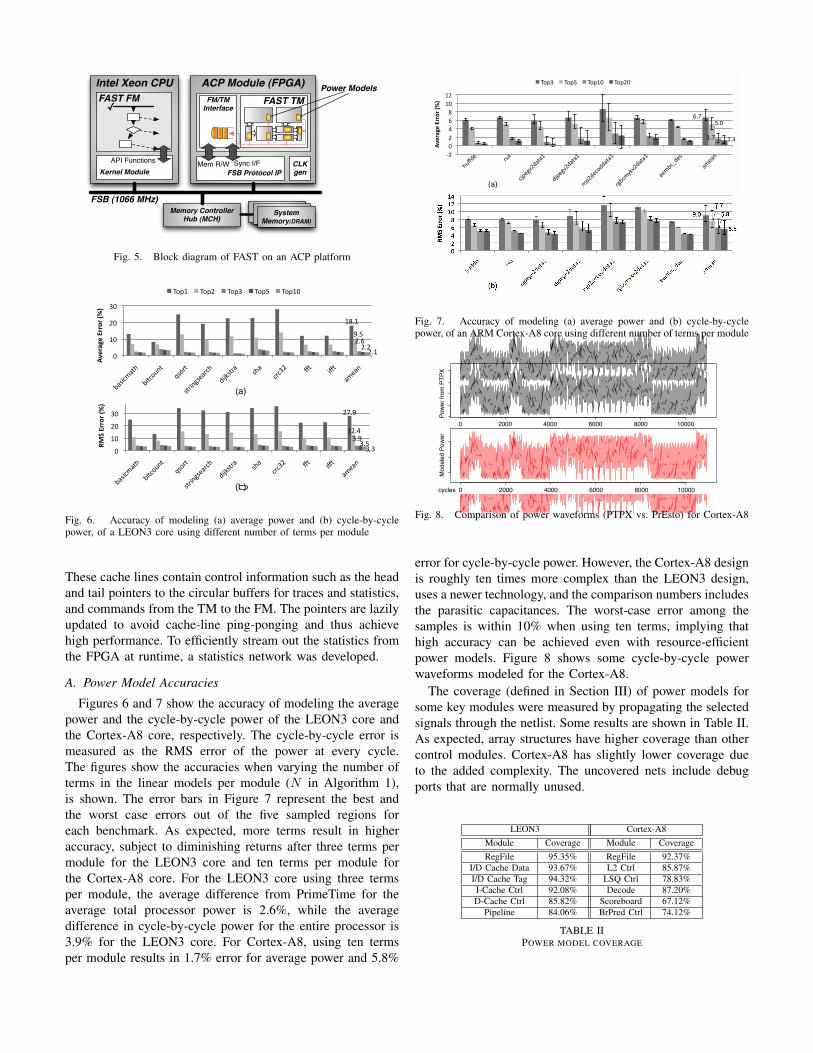
Power models generated from PrEsto were integrated intoa FAST simulator prototype that was augmented to pass datavalues for use by the power models. The prototype runs ona Nallatech ACP system that consists of a four-socket Intelserver system with Intel Xeon 7350 2.93GHz processors,where one or more of the sockets can be populated withACP modules (with a Xilinx Virtex 5 LX110 base moduleand two LX330 compute modules) communicating over the1066MHz FSB at up to 8GB/s. The FAST FM implementationis based on [17]. Figure 5 shows the high-level block diagramof FAST simulators implemented on an ACP platform. Thesynchronization region is a chunk of memory that the ACPmodule snoops on and is kept coherent with the processors.In our implementation, four 64B cache-lines (two for readsand two for writes) were used in the synchronization region.
1We used a Palladium platform to accelerate RTL simulation and sample throughout
benchmarks for the Cortex-A8 experiments.
FAST TMFM/TMInterface
ACP Module (FPGA)
✓FAST FMIntel Xeon CPU
Memory Controller Hub (MCH)
FSB Protocol IPCLKgen
Mem R/W Sync I/F
FSB (1066 MHz)
Kernel ModuleAPI Functions
SystemMemory
SystemMemory
SystemMemory(DRAM)
Power Models
Fig. 5. Block diagram of FAST on an ACP platform
!"#$%
&!#'%(#$%(#)%(#(%*%
&*%
!*%
(*%
'*%
+,-./0,12%
+.1/3451%
6-371%
-17.58-9,7/2%
:.;<-17,%
-2,%
/7/(!% =1
%.=1%
,09,5%
!"#$%&&'&$()
*$
>3?&% >3?!% >3?(% >3?)% >3?&*%
!"#!$
%#&$'#($'#'$'#!$
)$
!)$
')$
*)$
+,-./0,12$
+.1/3451$
6-371$
-17.58-9,7/2$
:.;<-17,$
-2,$
/7/*'$ =1
$.=1$
,09,5$
!"#$%&#'($$)$'*+
,'
>3?!$ >3?'$ >3?*$ >3?&$ >3?!)$
(a)
(b)
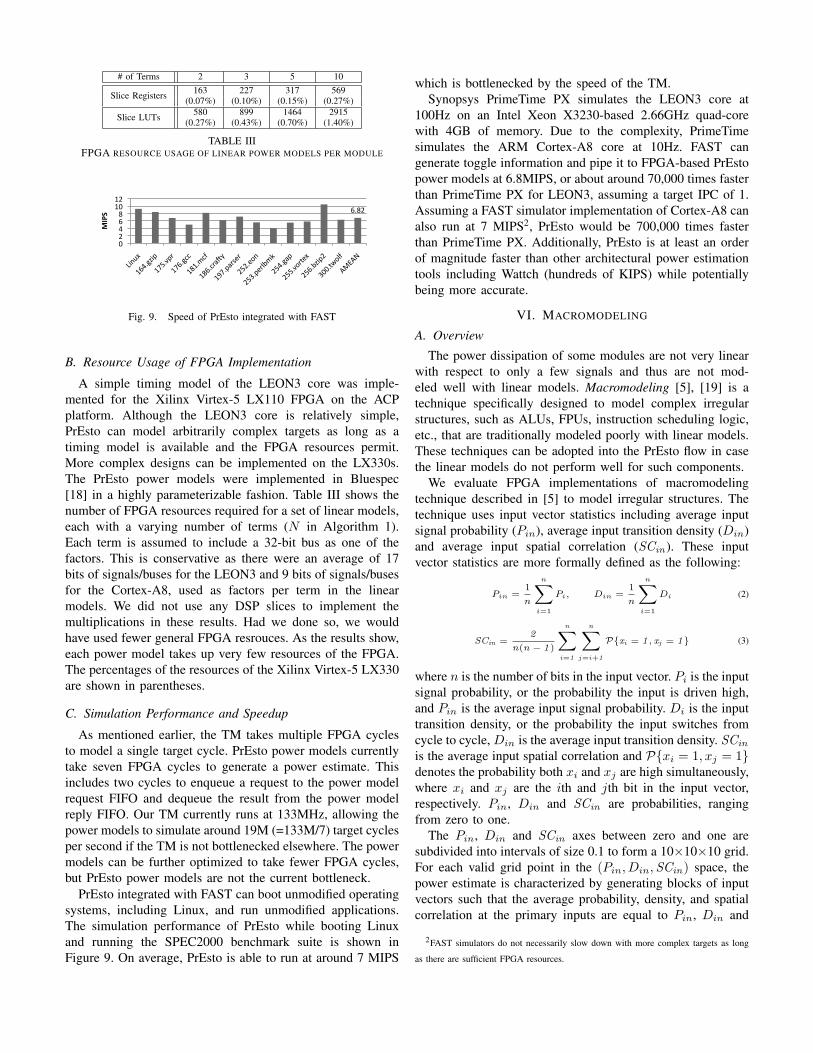
Fig. 6. Accuracy of modeling (a) average power and (b) cycle-by-cyclepower, of a LEON3 core using different number of terms per module
These cache lines contain control information such as the headand tail pointers to the circular buffers for traces and statistics,and commands from the TM to the FM. The pointers are lazilyupdated to avoid cache-line ping-ponging and thus achievehigh performance. To efficiently stream out the statistics fromthe FPGA at runtime, a statistics network was developed.
A. Power Model Accuracies
Figures 6 and 7 show the accuracy of modeling the averagepower and the cycle-by-cycle power of the LEON3 core andthe Cortex-A8 core, respectively. The cycle-by-cycle error ismeasured as the RMS error of the power at every cycle.The figures show the accuracies when varying the number ofterms in the linear models per module (N in Algorithm 1),is shown. The error bars in Figure 7 represent the best andthe worst case errors out of the five sampled regions foreach benchmark. As expected, more terms result in higheraccuracy, subject to diminishing returns after three terms permodule for the LEON3 core and ten terms per module forthe Cortex-A8 core. For the LEON3 core using three termsper module, the average difference from PrimeTime for theaverage total processor power is 2.6%, while the averagedifference in cycle-by-cycle power for the entire processor is3.9% for the LEON3 core. For Cortex-A8, using ten termsper module results in 1.7% error for average power and 5.8%
!"#$
%"%$
&"'$
&"&$
#$
($
)$
*$
'$
+#$
+($
+)$
,-./0$
123$
456078(/393+$
/56078(/393+$
:6(/04;//393+$
17<4:=>8(/393+$
00:<4?/02$
3:03@$
!"#$%&&'&$()
*$
A;6B$ A;6&$ A;6+#$ A;6(#$
(b)
!"#$%"&$
'"#$ '"($
)*$
&$
*$
+$
!$
,$
'&$
'*$
-./01$
234$
567189*04:4'$
067189*04:4'$
;7*015<004:4'$
28=5;>?9*04:4'$
11;=5@013$
4;14A$
!"#$%&#'($$)$'*+
,'
B<7($ B<7%$ B<7'&$ B<7*&$
(a)
Fig. 7. Accuracy of modeling (a) average power and (b) cycle-by-cyclepower, of an ARM Cortex-A8 core using different number of terms per module
0 2000 4000 6000 8000 10000
0 2000 4000 6000 8000 10000
Mod
eled
Pow
erPo
wer
from
PTP
X
cycles
Fig. 8. Comparison of power waveforms (PTPX vs. PrEsto) for Cortex-A8
error for cycle-by-cycle power. However, the Cortex-A8 designis roughly ten times more complex than the LEON3 design,uses a newer technology, and the comparison numbers includesthe parasitic capacitances. The worst-case error among thesamples is within 10% when using ten terms, implying thathigh accuracy can be achieved even with resource-efficientpower models. Figure 8 shows some cycle-by-cycle powerwaveforms modeled for the Cortex-A8.
The coverage (defined in Section III) of power models forsome key modules were measured by propagating the selectedsignals through the netlist. Some results are shown in Table II.As expected, array structures have higher coverage than othercontrol modules. Cortex-A8 has slightly lower coverage dueto the added complexity. The uncovered nets include debugports that are normally unused.
LEON3 Cortex-A8Module Coverage Module CoverageRegFile 95.35% RegFile 92.37%
I/D Cache Data 93.67% L2 Ctrl 85.87%I/D Cache Tag 94.32% LSQ Ctrl 78.83%I-Cache Ctrl 92.08% Decode 87.20%D-Cache Ctrl 85.82% Scoreboard 67.12%
Pipeline 84.06% BrPred Ctrl 74.12%
TABLE IIPOWER MODEL COVERAGE
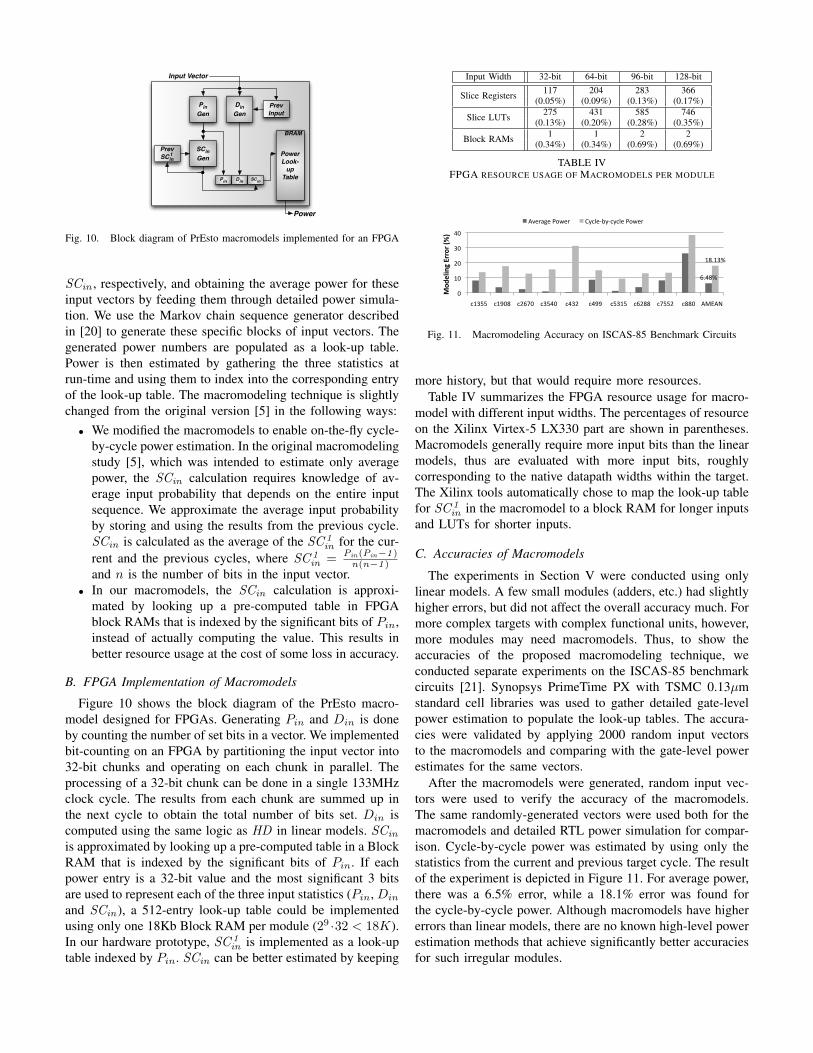
# of Terms 2 3 5 10
Slice Registers 163 227 317 569(0.07%) (0.10%) (0.15%) (0.27%)
Slice LUTs 580 899 1464 2915(0.27%) (0.43%) (0.70%) (1.40%)
TABLE IIIFPGA RESOURCE USAGE OF LINEAR POWER MODELS PER MODULE
!"#$%
&%$%'%!%#%
(&%($%
)*+,-%
(!'"./*0%
(12"304%
(1!".55%
(#("657%
(#!"5489:%
(;1"084<=4%
$2$"=>+%
$2?"0=4@A6B%
$2'".80%
$22"3>4C=-%
$2!"A/*0$%
?&&"CD>@7%
EFGEH%
!"#$%
Fig. 9. Speed of PrEsto integrated with FAST
B. Resource Usage of FPGA Implementation
A simple timing model of the LEON3 core was imple-mented for the Xilinx Virtex-5 LX110 FPGA on the ACPplatform. Although the LEON3 core is relatively simple,PrEsto can model arbitrarily complex targets as long as atiming model is available and the FPGA resources permit.More complex designs can be implemented on the LX330s.The PrEsto power models were implemented in Bluespec[18] in a highly parameterizable fashion. Table III shows thenumber of FPGA resources required for a set of linear models,each with a varying number of terms (N in Algorithm 1).Each term is assumed to include a 32-bit bus as one of thefactors. This is conservative as there were an average of 17bits of signals/buses for the LEON3 and 9 bits of signals/busesfor the Cortex-A8, used as factors per term in the linearmodels. We did not use any DSP slices to implement themultiplications in these results. Had we done so, we wouldhave used fewer general FPGA resrouces. As the results show,each power model takes up very few resources of the FPGA.The percentages of the resources of the Xilinx Virtex-5 LX330are shown in parentheses.
C. Simulation Performance and Speedup
As mentioned earlier, the TM takes multiple FPGA cyclesto model a single target cycle. PrEsto power models currentlytake seven FPGA cycles to generate a power estimate. Thisincludes two cycles to enqueue a request to the power modelrequest FIFO and dequeue the result from the power modelreply FIFO. Our TM currently runs at 133MHz, allowing thepower models to simulate around 19M (=133M/7) target cyclesper second if the TM is not bottlenecked elsewhere. The powermodels can be further optimized to take fewer FPGA cycles,but PrEsto power models are not the current bottleneck.
PrEsto integrated with FAST can boot unmodified operatingsystems, including Linux, and run unmodified applications.The simulation performance of PrEsto while booting Linuxand running the SPEC2000 benchmark suite is shown inFigure 9. On average, PrEsto is able to run at around 7 MIPS
which is bottlenecked by the speed of the TM.Synopsys PrimeTime PX simulates the LEON3 core at
100Hz on an Intel Xeon X3230-based 2.66GHz quad-corewith 4GB of memory. Due to the complexity, PrimeTimesimulates the ARM Cortex-A8 core at 10Hz. FAST cangenerate toggle information and pipe it to FPGA-based PrEstopower models at 6.8MIPS, or about around 70,000 times fasterthan PrimeTime PX for LEON3, assuming a target IPC of 1.Assuming a FAST simulator implementation of Cortex-A8 canalso run at 7 MIPS2, PrEsto would be 700,000 times fasterthan PrimeTime PX. Additionally, PrEsto is at least an orderof magnitude faster than other architectural power estimationtools including Wattch (hundreds of KIPS) while potentiallybeing more accurate.
VI. MACROMODELING
A. Overview
The power dissipation of some modules are not very linearwith respect to only a few signals and thus are not mod-eled well with linear models. Macromodeling [5], [19] is atechnique specifically designed to model complex irregularstructures, such as ALUs, FPUs, instruction scheduling logic,etc., that are traditionally modeled poorly with linear models.These techniques can be adopted into the PrEsto flow in casethe linear models do not perform well for such components.
We evaluate FPGA implementations of macromodelingtechnique described in [5] to model irregular structures. Thetechnique uses input vector statistics including average inputsignal probability (Pin), average input transition density (Din)and average input spatial correlation (SCin ). These inputvector statistics are more formally defined as the following:
Pin =1
n
n∑i=1
Pi, Din =1
n
n∑i=1
Di (2)
SCin =2
n(n − 1)
n∑i=1
n∑j=i+1
P{xi = 1 , xj = 1} (3)
where n is the number of bits in the input vector. Pi is the inputsignal probability, or the probability the input is driven high,and Pin is the average input signal probability. Di is the inputtransition density, or the probability the input switches fromcycle to cycle, Din is the average input transition density. SCin
is the average input spatial correlation and P{xi = 1, xj = 1}denotes the probability both xi and xj are high simultaneously,where xi and xj are the ith and jth bit in the input vector,respectively. Pin, Din and SCin are probabilities, rangingfrom zero to one.
The Pin, Din and SCin axes between zero and one aresubdivided into intervals of size 0.1 to form a 10×10×10 grid.For each valid grid point in the (Pin, Din,SCin) space, thepower estimate is characterized by generating blocks of inputvectors such that the average probability, density, and spatialcorrelation at the primary inputs are equal to Pin, Din and
2FAST simulators do not necessarily slow down with more complex targets as long
as there are sufficient FPGA resources.
PinGen
DinGen
PrevInput
SCinGen
PrevSCin
Pin
PowerLook-
upTableDin SCin
BRAM
Input Vector
Power
1
Fig. 10. Block diagram of PrEsto macromodels implemented for an FPGA
SCin , respectively, and obtaining the average power for theseinput vectors by feeding them through detailed power simula-tion. We use the Markov chain sequence generator describedin [20] to generate these specific blocks of input vectors. Thegenerated power numbers are populated as a look-up table.Power is then estimated by gathering the three statistics atrun-time and using them to index into the corresponding entryof the look-up table. The macromodeling technique is slightlychanged from the original version [5] in the following ways:• We modified the macromodels to enable on-the-fly cycle-
by-cycle power estimation. In the original macromodelingstudy [5], which was intended to estimate only averagepower, the SCin calculation requires knowledge of av-erage input probability that depends on the entire inputsequence. We approximate the average input probabilityby storing and using the results from the previous cycle.SCin is calculated as the average of the SC 1
in for the cur-rent and the previous cycles, where SC 1
in = Pin(Pin−1)n(n−1)
and n is the number of bits in the input vector.• In our macromodels, the SCin calculation is approxi-
mated by looking up a pre-computed table in FPGAblock RAMs that is indexed by the significant bits of Pin,instead of actually computing the value. This results inbetter resource usage at the cost of some loss in accuracy.
B. FPGA Implementation of Macromodels
Figure 10 shows the block diagram of the PrEsto macro-model designed for FPGAs. Generating Pin and Din is doneby counting the number of set bits in a vector. We implementedbit-counting on an FPGA by partitioning the input vector into32-bit chunks and operating on each chunk in parallel. Theprocessing of a 32-bit chunk can be done in a single 133MHzclock cycle. The results from each chunk are summed up inthe next cycle to obtain the total number of bits set. Din iscomputed using the same logic as HD in linear models. SCin
is approximated by looking up a pre-computed table in a BlockRAM that is indexed by the significant bits of Pin. If eachpower entry is a 32-bit value and the most significant 3 bitsare used to represent each of the three input statistics (Pin, Din
and SCin ), a 512-entry look-up table could be implementedusing only one 18Kb Block RAM per module (29 ·32 < 18K).In our hardware prototype, SC 1
in is implemented as a look-uptable indexed by Pin. SCin can be better estimated by keeping
Input Width 32-bit 64-bit 96-bit 128-bit
Slice Registers 117 204 283 366(0.05%) (0.09%) (0.13%) (0.17%)
Slice LUTs 275 431 585 746(0.13%) (0.20%) (0.28%) (0.35%)
Block RAMs 1 1 2 2(0.34%) (0.34%) (0.69%) (0.69%)
TABLE IVFPGA RESOURCE USAGE OF MACROMODELS PER MODULE
!"#$%&
'$"'(%&
)&
')&
*)&
()&
#)&
+'(,,& +'-)$& +*!.)& +(,#)& +#(*& +#--& +,(',& +!*$$& +.,,*& +$$)& /01/2&
!"#$%&'()*++"+),-
.)
/345674&89:45& ;<+=4>?<>+<+=4&89:45&
Fig. 11. Macromodeling Accuracy on ISCAS-85 Benchmark Circuits
more history, but that would require more resources.Table IV summarizes the FPGA resource usage for macro-
model with different input widths. The percentages of resourceon the Xilinx Virtex-5 LX330 part are shown in parentheses.Macromodels generally require more input bits than the linearmodels, thus are evaluated with more input bits, roughlycorresponding to the native datapath widths within the target.The Xilinx tools automatically chose to map the look-up tablefor SC 1
in in the macromodel to a block RAM for longer inputsand LUTs for shorter inputs.
C. Accuracies of Macromodels
The experiments in Section V were conducted using onlylinear models. A few small modules (adders, etc.) had slightlyhigher errors, but did not affect the overall accuracy much. Formore complex targets with complex functional units, however,more modules may need macromodels. Thus, to show theaccuracies of the proposed macromodeling technique, weconducted separate experiments on the ISCAS-85 benchmarkcircuits [21]. Synopsys PrimeTime PX with TSMC 0.13µmstandard cell libraries was used to gather detailed gate-levelpower estimation to populate the look-up tables. The accura-cies were validated by applying 2000 random input vectorsto the macromodels and comparing with the gate-level powerestimates for the same vectors.
After the macromodels were generated, random input vec-tors were used to verify the accuracy of the macromodels.The same randomly-generated vectors were used both for themacromodels and detailed RTL power simulation for compar-ison. Cycle-by-cycle power was estimated by using only thestatistics from the current and previous target cycle. The resultof the experiment is depicted in Figure 11. For average power,there was a 6.5% error, while a 18.1% error was found forthe cycle-by-cycle power. Although macromodels have highererrors than linear models, there are no known high-level powerestimation methods that achieve significantly better accuraciesfor such irregular modules.
VII. RELATED WORK
Several FPGA-based power estimation methodologies [22]–[24] have been proposed recently. All are emulation-based,mapping the entire target RTL, along with power models, onFPGAs. [25] uses a software/FPGA co-simulation approachto accommodate larger SoC designs, but the partitioning wasat module boundaries assuming infrequent communicationbetween modules. The method would suffer from the commu-nication overhead for tightly-coupled modules such as thosefound in a typical microprocessor. These emulation-basedmethods have several disadvantages including (i) the difficultyof porting most full-custom/ASIC designs to FPGAs due tovery different structures, and (ii) the difficulty of integratingmore accurate power models that take several FPGA cyclesinto designs implemented assuming a single cycle betweenpipeline registers.
Many regression-based power estimation methods exist [3]–[7], but they either do not model cycle-by-cycle power orwere not evaluated at the system-level. Most methods are toocomplex to implement on FPGAs. PrEsto is much simpler than[4], yet reaches similar accuracies by exploiting knowledge onthe RTL design (differentiating signals vs. buses, etc.) Others[26] have proposed using statistical methods to generate powermodels. PrEsto positions itself between these detailed methodsand architectural tools such as Wattch [9], targeting acceleratedsystem-level power estimation with simpler heuristics andreasonable accuracies, and is evaluated with full processorimplementations.
VIII. CONCLUSIONS
We proposed PrEsto, an accelerated power estimationmethodology with automated power model generation. Theresulting tool runs significantly faster than other architecturalor RTL simulators while maintaining high accuracy even whenpredicting cycle-by-cycle power. PrEsto models were designedto be easy to incorporate into FPGA-accelerated simulators,enabling them to model complex targets whose RTL could notmap onto a single FPGA. We have validated the methodologyon modern industry designs. We are studying how to buildthermal and leakage models using PrEsto.
PrEsto has a wide range of uses, ranging from RTL design-ers that may want to evaluate the power impact of alternativedesigns, to software developers to power-tune their programs.We believe that such simulators could lead to entire computersystems that are systematically designed to have optimizedpower dissipation.
IX. ACKNOWLEDGMENTS
This material is based upon work supported in part bythe Semiconductor Research Corporation under Grant No.2676957812 and by the National Science Foundation underGrant No. 0615352. We thank Jim Holt of Freescale for hisgenerous support for this work, ARM, Inc. for permission touse their designs for our experiments, Bluespec for softwaredonations, and the anonymous reviewers for their feedback.
REFERENCES
[1] D. Chiou, D. Sunwoo, J. Kim, N. A. Patil, W. H. Reinhart, D. E. Johnson,and Z. Xu, “The FAST Methodology for High-Speed SoC/ComputerSimulation,” in ICCAD, Nov. 2007.
[2] D. Chiou, D. Sunwoo, J. Kim, N. A. Patil, W. H. Reinhart, D. E.Johnson, J. Keefe, and H. Angepat, “FPGA-Accelerated SimulationTechnologies (FAST): Fast, Full-System, Cycle-Accurate Simulators,”in MICRO, Dec. 2007.
[3] Z. Chen, K. Roy, and T. Chou, “Power sensitivity-a new methodto estimate power dissipation considering uncertain specifications ofprimary inputs,” ICCAD, 1997.
[4] Q. Wu, Q. Qiu, M. Pedram, and C.-S. Ding;, “Cycle-accurate macro-models for RT-level power analysis,” IEEE Transactions on VLSISystems, vol. 6, no. 4, pp. 520 – 528, Dec. 1998.
[5] S. Gupta and F. Najm, “Power modeling for high-level power estima-tion,” IEEE Transactions on VLSI Systems, vol. 8, no. 1, pp. 18–29,2000.
[6] A. Bogliolo, L. Benini, and G. D. Micheli, “Regression-based RTLpower modeling,” ACM Trans. on Design Automation of ElectronicSystems, vol. 5, no. 3, pp. 337–372, 2000.
[7] X. Liu and M. Papaefthymiou, “HyPE: Hybrid power estimation forIP-based programmable systems,” Proceedings of the Asia and SouthPacific Design Automation Conference, pp. 606–609, Jan. 2003.
[8] N. Kapre and A. DeHon, “Accelerating SPICE Model-Evaluation usingFPGAs,” FCCM, pp. 37–44, 2009.
[9] D. Brooks, V. Tiwari, and M. Martonosi, “Wattch: a framework forarchitectural-level power analysis and optimizations,” ISCA, Jun. 2000.
[10] S. Wilton and N. Jouppi, “An enhanced access and cycle time modelfor on-chip caches,” WRL Research Report 93/5, Jan. 1994.
[11] X. Liang, K. Turgay, and D. Brooks, “Architectural power modelsfor SRAM and CAM structures based on hybrid analytical/empiricaltechniques,” Proceedings of ICCAD, pp. 824–830, Nov. 2007.
[12] P. H. Wang, J. D. Collins, C. T. Weaver, B. Kuttanna, S. Salamian, G. N.Chinya, E. Schuchman, O. Schilling, T. Doil, S. Steibl, and H. Wang,“Intel Atom processor core made FPGA-synthesizable,” in FPGA, 2009.
[13] “Aeroflex Gaisler,” http://www.gaisler.com/.[14] “ARM webpage,” http://www.arm.com/.[15] M. Guthaus, J. Ringenberg, D. Ernst, T. Austin, T. Mudge, and
R. Brown, “MiBench: A free, commercially representative embeddedbenchmark suite,” IEEE International Workshop on Workload Charac-terization, pp. 3 – 14, Nov. 2001.
[16] “The Embedded Microprocessor Benchmark Consortium,”http://www.eembc.org/. [Online]. Available: http://www.eembc.org/
[17] D. Sunwoo, J. Kim, and D. Chiou, “QUICK: A Flexible Full-SystemFunctional Model,” in Proceedings of ISPASS, Apr. 2009, pp. 249–258.
[18] “Bluespec webpage,” http://www.bluespec.com.[19] Z. Chen, K. Roy, and E. Chong, “Estimation of power dissipation
using a novel power macromodeling technique,” IEEE Transactions onComputer-Aided Design of Integrated Circuits and Systems, vol. 19,no. 11, pp. 1363–1369, 2000.
[20] X. Liu and M. Papaefthymiou, “A Markov chain sequence generator forpower macromodeling,” IEEE Transactions on Computer-Aided Designof Integrated Circuits and Systems, vol. 23, no. 7, pp. 1048–1062, 2004.
[21] F. Brglez and H. Fujiwara, “A neutral netlist of 10 combinationalbenchmark circuits and a target translator in Fortran,” Proceedings ofISCAS, pp. 695–698, Jun. 1985.
[22] J. Coburn, S. Ravi, and A. Raghunathan, “Power emulation: a newparadigm for power estimation,” DAC, pp. 700–705, 2005.
[23] D. Atienza, P. D. Valle, G. Paci, and F. Poletti, “A fast HW/SWFPGA-based thermal emulation framework for multi-processor system-on-chip,” DAC, Jan. 2006.
[24] A. Bhattacharjee, G. Contreras, and M. Martonosi, “Full-system chipmultiprocessor power evaluations using FPGA-based emulation,” Pro-ceedings of ISLPED, Jan. 2008.
[25] M. Ghodrat, K. Lahiri, and A. Raghunathan, “Accelerating System-on-Chip power analysis using hybrid power estimation,” DAC, pp. 883–886,2007.
[26] N. Bansal, K. Lahiri, and A. Raghunathan, “Automatic Power Modelingof Infrastructure IP for System-on-Chip Power Analysis,” Proceedingsof VLSI Design, pp. 513–520, 2007.