Pressure Drops and Void Fractions in Horizontal Two-Phase ...
9
Pressure Drops and Void Fractions in Horizontal Two-Phase Flows OF Potassium LOWELL R. SMITH, M. RASlN TEK, and RICHARD E. BALZHISER University of Michigan, Ann Arbor, Michigan Vapor-liquid flow of a potassium-8% sodium mixture was studied with the use of o boiling heat transfer test loop. Pressure drop data were obtained from a 36-in. long, 0.495-in. I.D. unheated test section. Void fractions were measured at the midpoint of the test section with gamma ray attenuation. Flows were essentially frictional. Quality, total flow rate, and absolute pressure were the principal variables affecting the pressure drop results, which were correlated in terms of a two-phase friction factor. A metallic void fraction correlation was developed from previously reported data for other metollic fluids together with the potassium data of this study. The potassium two phase friction factors fall substantially lower than volues predicted by well- known frictional pressure drop correlations. Metallic void friction values are appreciably lower than data for other fluid systems. Velocity slip ratios appear to be much higher than for other fluid systems due to high liquid-to-vapor density ratios and low void fractions. In recent years metallic fluids have received considera- tion as possible heat transfer media in space electrical power generation cycles which involve boiling and con- densing of the carrier fluid. The rigorous designs required in such applications necessitate the ability to make highly accurate predictions of two-phase flow phenomena. Al- though a voluminous literature exists on the subject of two-phase fluid flow, little has been reported on flow of metallic systems. The two-phase pressure drop along a tube in general is the summation of losses due to friction, acceleration effects, and hydrostatic head. Two-phase val- ues usually are greater than those experienced in single- phase flows with comparable fluid throughputs. Frictional losses are always present and occur for any orientation of the flow channel and for adiabatic or heated conditions. Acceleration losses occur in forced-circulation boiling flows, where the continuous phase chan e causes the mix- in adiabatic flow at low pressure levels. Hydrostatic head terms are present only for vertical or inclined flow systems. Knowledge of the mean two-phase mixture density is necessary in prediction of acceleration losses and hydro- static head. In vapor-liquid flow, the mean velocities of the two phases, based on the cross-sectional area of each, generally are not equal. Because of this “slip,” the true fraction of the pipe cross section occupied by either phase differs from that calculated on the basis of the volumes of gas and liquid entering the tube. As a result, the mean mixture density cannot be calculated on the basis of qual- ity (vapor mass fraction) alone, but requires a knowledge of the void fraction (fraction of the channel cross section occupied by vapor). Void fraction, then, is an important parameter in predicting the hydraulics of many two-phase flow systems, since without it the accelerative and hydro- static contributions to the pressure drop cannot be evalu- ated. In this study, potassium two-phase pressure drop and void fraction data were obtained from a boiling heat trans- fer test loop. Two-phase mixtures were generated in a preheater section, and the pressure drops were measured ture density to vary along the tube. Suc \ losses also occur Lowell R. Smith is with Pan American Petroleum Corporation, Tulsa, Oklahoma. over a horizontal 3-ft. length of 0.495-in. 1.D. tube. Mix- ture qualities at the ends of this test section were obtained by heat balance. Void fractions were measured at the middle of the pressure drop section using single-shot gamma ray attenuation. The potassium test loop included a heat transfer test section, a double-pipe type of exchanger, in which con- densing sodium on the shell side transferred heat to two- phase potassium flowing on the tube-side. Prior to making experimental runs a leak developed in this test section, allowing sodium to enter the potassium system. Two-phase flow runs were not prevented but the data obtained are for flows of a potassium-sodium mixture containing 8% sodium by weight. Chemical analysis of fluid samples showed that this composition was constant over the period during which the two-phase flow data were obtained. In this paper the fluid is referred to as potassium. A study of the data indicates that the results closely approximate the two-phase flow behavior of pure potassium (1 ) . SCINTILLATON PRESSURE DROP DETECTOR TEST SECTION \ T ~-T‘%i UGAMMA RAY 1$31 SOURCE CONDENSER DIFFERENTIAL HEAT TRANSFER PRESSURE TEST SECTION TRANSMITTER SUB-COOLER THROTTLE VALVE Fig. 1. Simplified flow diagram of boiling metal test loop. Page 50 A.1.Ch.E. Journal January, 1966
Transcript of Pressure Drops and Void Fractions in Horizontal Two-Phase ...
Pressure Drops and Void Fractions in
Horizontal Two-Phase Flows OF Potassium LOWELL R. SMITH, M. RASlN TEK, and RICHARD E. BALZHISER
University of Michigan, Ann Arbor, Michigan
Vapor-liquid flow of a potassium-8% sodium mixture was studied with the use of o boiling heat transfer test loop. Pressure drop data were obtained from a 36-in. long, 0.495-in. I.D. unheated test section. Void fractions were measured at the midpoint of the test section with gamma ray attenuation.
Flows were essentially frictional. Quality, total flow rate, and absolute pressure were the principal variables affecting the pressure drop results, which were correlated in terms of a two-phase friction factor. A metallic void fraction correlation was developed from previously reported data for other metollic fluids together with the potassium data of this study.
The potassium two phase friction factors fall substantially lower than volues predicted by well- known frictional pressure drop correlations. Metallic void friction values are appreciably lower than data for other fluid systems. Velocity slip ratios appear to be much higher than for other fluid systems due to high liquid-to-vapor density ratios and low void fractions.
In recent years metallic fluids have received considera- tion as possible heat transfer media in space electrical power generation cycles which involve boiling and con- densing of the carrier fluid. The rigorous designs required in such applications necessitate the ability to make highly accurate predictions of two-phase flow phenomena. Al- though a voluminous literature exists on the subject of two-phase fluid flow, little has been reported on flow of metallic systems. The two-phase pressure drop along a tube in general is the summation of losses due to friction, acceleration effects, and hydrostatic head. Two-phase val- ues usually are greater than those experienced in single- phase flows with comparable fluid throughputs. Frictional losses are always present and occur for any orientation of the flow channel and for adiabatic or heated conditions. Acceleration losses occur in forced-circulation boiling flows, where the continuous phase chan e causes the mix-
in adiabatic flow at low pressure levels. Hydrostatic head terms are present only for vertical or inclined flow systems.
Knowledge of the mean two-phase mixture density is necessary in prediction of acceleration losses and hydro- static head. In vapor-liquid flow, the mean velocities of the two phases, based on the cross-sectional area of each, generally are not equal. Because of this “slip,” the true fraction of the pipe cross section occupied by either phase differs from that calculated on the basis of the volumes of gas and liquid entering the tube. As a result, the mean mixture density cannot be calculated on the basis of qual- ity (vapor mass fraction) alone, but requires a knowledge of the void fraction (fraction of the channel cross section occupied by vapor). Void fraction, then, is an important parameter in predicting the hydraulics of many two-phase flow systems, since without it the accelerative and hydro- static contributions to the pressure drop cannot be evalu- ated.
In this study, potassium two-phase pressure drop and void fraction data were obtained from a boiling heat trans- fer test loop. Two-phase mixtures were generated in a preheater section, and the pressure drops were measured
ture density to vary along the tube. Suc \ losses also occur
Lowell R. Smith is with Pan American Petroleum Corporation, Tulsa, Oklahoma.
over a horizontal 3-ft. length of 0.495-in. 1.D. tube. Mix- ture qualities at the ends of this test section were obtained by heat balance. Void fractions were measured at the middle of the pressure drop section using single-shot gamma ray attenuation.
The potassium test loop included a heat transfer test section, a double-pipe type of exchanger, in which con- densing sodium on the shell side transferred heat to two- phase potassium flowing on the tube-side. Prior to making experimental runs a leak developed in this test section, allowing sodium to enter the potassium system. Two-phase flow runs were not prevented but the data obtained are for flows of a potassium-sodium mixture containing 8% sodium by weight. Chemical analysis of fluid samples showed that this composition was constant over the period during which the two-phase flow data were obtained. In this paper the fluid is referred to as potassium. A study of the data indicates that the results closely approximate the two-phase flow behavior of pure potassium (1 ) .
SCINTILLATON PRESSURE DROP DETECTOR TEST SECTION \
T
~-T‘%i UGAMMA RAY 1$31
SOURCE CONDENSER
DIFFERENTIAL HEAT TRANSFER PRESSURE TEST SECTION TRANSMITTER
SUB-COOLER THROTTLE VALVE
Fig. 1. Simplified flow diagram of boiling metal test loop.
Page 50 A.1.Ch.E. Journal January, 1966
EXPERIMENTAL
The Potassium Test Loop
Two-phase flow studies were conducted in a specially in- strumented test section incorporated within a forced-circulation heat transfer loop. The loop was designed for use with molten alkali metals as the circulating fluids. A flow diagram of the system is shown in Figure 1. Liquid potassium flowed from the electromagnetic pump through the throttle valve, the magnetic flowmeter, and then entered the preheater where vapor was generated. The resulting two-phase mixture passed through the heat transfer section and the horizontal pressure drop test section. Flow continued through the condenser and into the hot well from which liquid was returned to the pump via the subcooler. The circuit was equipped with a liquid metal supply tank as well as valves and auxiliary lines for bleeding, pressurizing, venting, levelling, and draining.
The pump was a Mine Safety Research Style I1 electro- magnetic conduction pump. Liquid flow rate was controlled by varying the applied voltage to the pump or by regulating the throttle valve, which was a stainless steel bellows sealed ball valve. The flowmeter was a Mine Safety Research Style FM-2 magnetic flow meter. Accuracy of measured flow rates was found to be better than 2.8% ( 1 ).
The preheater consisted of three parallel 45-in. lengths of 4-in. O.D. x 3-in. I.D. Haynes-25 pipe heated by electrical radiant heaters. The total rated power was 30 kw., and values were measured to within 0.1 kw.
The heat transfer section was a double-pipe heat exchanger designed for condensation of sodium vapor in the annulus with two-phase potassium flowing in the central tube. The details of the mechanical design of this section are furnished by Balzhiser et al. (2). As mentioned previously, the thin inner wall of this section developed a leak, preventing experi- mental use of the section during two-phase flow runs.
The condenser and subcooler each consisted of 10 ft. of stainless steel finned tube over which air was passed at rates up to 800 std. cu. ft./min. The subcooler's specific function was to help prevent pump cavitation by subcooling the liquid flowing from the hot well. Functions of the hot well were to assure a liquid level above the pump intake even in the event of large flow rate instabilities, to act as an accumulating chamber for system cover gas (argon), and to act as an ex- pansion tank for liquid.
Four thermocouples (TC 25, TC 26, TC 30, TC 31 ) were vital to the establishment of a loop heat balance. These platinum-platinum 10% rhodium thermocouples were cali- brated against a National Bureau of Standards secondary standard and provided measurements accurate to within 1 "F. Standardized thermocouple lead wire connected all thermo- couples to a potentiometer selector switch, and all were elec- trically insulated from the loop. About forty other chromel- alumel thermocouples were used to monitor loop operation.
All piping was traced with electrical warmup heaters, and a zirconium chip hot trap was employed to maintain low oxygen concentraticn. The loop was remotely operated from a control panel which contained several automatic safety features in addition to operating controls. Smith ( 1 ) provides a detailed description of the potassium loop.
For each pressure drop and void fraction value, the fluid quality was calculated at both pressure taps by a heat balance. Equilibrium was assumed to exist between liquid and vapor at both points. Heat loss data, essential for quality calcula- tions, were obtained from a series of all-liquid runs. The heat losses from the preheater, heat transfer section, and pressure drop section were essentially independent of flow rate and were correlated as functions of fluid temperature ( 1 ).
Two-Phase Pressure Drop Measurement
Pressure drop data were measured over a horizontal 36-in. length of 0.495-in. I.D. Haynes-25 alloy seamless Zubing with 0.065-in. wall. Fluid entered this section from a 10-in. hori- zontal calming section. The 4-in. long differential pressure taps were %-in. schedule 40 Haynes-25 pipe nipples welded vertically to the bottom of the tube. Tap openings into the test section were about 3/16-in. in diameter.
Pressure drop was measured with a Taylor Transaire Volu- metric D-P Transmitter connected to a stainless steel pressure
HAYNES -25 TUBING HIGH VOLTAGE
SOURCE
transmitting diaphragm assembly. The pressure transmitting fluid internal to the assembly was sodium-potassium eutectic alloy. The zero point of the transmitter exhibited a slight drift which was periodically checked and corrected. Data were re- corded with a Taylor Transcope Recorder. Values were ac- curate to 1% of full scale, which was set at 100 or 300 in. of water.
Fluid temperatures were measured 10 in. upstream and 13 in. downstream of the inlet and outlet pressure taps, re- spectively. These well types of thermocouples (TC 30 and TC 31) were located away from the ends of the test section to minimize their effect on flow patterns. These calming dis- tances appear adequate in view of Richardson's observation ( 3 ) that sudden areal expansions caused no void fraction changes for air-water flow ( a ranging from 0.30 to 0.80). Temperatures at the pressure taps were estimated from the thermocouple readings by using the experimental pressure gradient and by assuming thermodynamic equilibrium existed. Accuracy of the estimated pressure tap temperatures was shown to be better than 0.3% for values above 1,000"F. ( I ) .
Except at the point of void fraction measurement, the test section was covered with 4 in. of insulation (as was much of the loop).
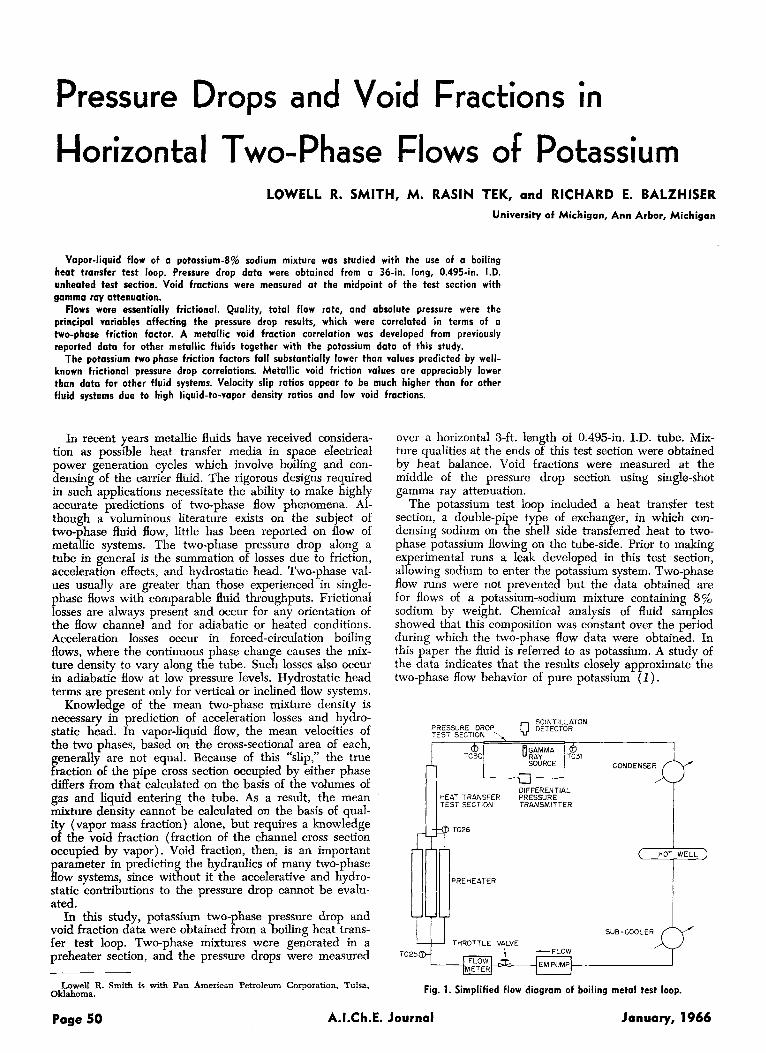
Void Fraction Measurement
The theoretical basis of the gamma ray attenuation tech- nique for measuring void fractions has been reviewed else- where (1, 3 ) . Although the mean two-phase fluid density in the region traversed by the radiation beam is sought, this value is not directly obtained in practice due to lack of ap- propriate absorption coefficients. The usual procedure is to obtain the void fraction by interpolation between detector sig- nals read for single-phase liquid and vapor flows. For the probable flow regimes encountered, it can be shown from Beer's Law that ( 1 , 3 )
In ( N / N z )
In ( N , / N I ) a = (1)
Correct application of Equation (1) requires that a11 the count rates be observed at the same flow temperature. However, single values of Ng and Nr at one temperature may be ad- justed for use at all two-phase flow temperatures encountered (44).
The void fraction measuring system is shown schematically in Figure 2. Thulium-170 decays by beta particle emission to ytterbium-170 which yields two soft rays-a 0.053 MeV. K x-ray and a 0.084 MeV. unconverted gamma ray ( I ). Equa- tion ( l ) assumes the radiation is monoenergetic, but since the low energy photons were almost completely absorbed by the pipe wall, the detector saw primarily the 0.084 Mev radiation.
Gamma rays were detected by the scintillation method. The detector was a Harshaw Integral Line Assembly consisting of a 1.5-in. diameter by I-in. thick, thallium-activated, sodium iodide crystal coupled optically to a 2-in. photomultiplier tube. The photomultiplier tube was provided with external magnetic shielding. Count rates were obtained from a Tracer- lab SC-18 Superscaler which had a resolving time of 5 psec. (less than 1% coincidence loss for count rates up to 120,000
3
w J TO TUBE
PREAMPLIFIER
Vol. 12, No. 1 A.1.Ch.E. Journal Page 51

counts/min). The preamplifier was built to match the elec- tronic characteristics of the scaler.
The source was positioned under the flow tube, the radiation passing upward through the pipe and fluid. The detector was mounted on top of the pipe, and the two components were accurately aligned on a common frame, the position of which was adjusted to align the gamma ray beam with the center line of the flow tube (1). The beam was collimated to a diameter of about 1/32-in. at the source. Radiation reached the detector via a 0.75-in. diameter hole in a 2.75-in. thick steel detector face shield. The source-to-detector distance was 18.25 in.
Void fractions were measured with a "single-shot'' pro- cedure. To obtain a value, the count rate was obtained from the collimated beam. Then the beam was "shut off by sub- stituting a 1.5-in. thick steel plug for the collimator, allowing reading of the background count rate due to scatter. Both count rates were corrected for coincidence loss ( 1 ) and then subtracted to give the value of N for Equation ( 1 ). Flow rate and thermal data were obtained simultaneously with the void fraction measurements.
RESULTS AND CORRELATION OF DATA
Two-Phase Pressure Drop
For nearly all operating conditions the pressure drop and flow rate exhibited fluctuations. It was evident that the loop suffered instabilities as are commonly observed in two-phase test loops. Both quantities were continuously recorded, and values reported as data are the mean values.
The physical and thermal properties necessary for data processing were estimated for the binary metallic mixture containing 8% sodium (1). Properties for the pure com- ponents were those reported by Weatherford et al. ( 5 ) . Ranges of experimental quantities are iven in Table 1." Inlet pressure was taken as the equili rium vapor sure. Consideration of the accuracy of calculated qua ibes showed that 81% of the vaIues were accurate to within
% y s -
Additional material has been deposited as document .8561 with the American Documentation Institute, Photoduplication Service, Library of Congress, Washington 25? D. C , and may be obtained for $1.25 for photopnnts or 35-mm. m i c r o h .
No. of data points Pressure drop, Ib.i/sq. in. Total mass flow rate, 1b.Jhr. Inlet pressure, Ib.i/sq. in. abs. Inlet temperature, "F. Inlet quality
Average quality
Quality change across section
No. of data points Total mass flow rate, I b J h r . Average temperature, O F .
Average quality
Void fraction
10% or better of the reported value (1 ) . High values are known with best precision.
In loop operation, pressure drop data were obtained over a wide range of preheater power inputs while keep- ing the flow rate essentially constant. Examination of the data showed that the pressure drop was influenced by test section absolute pressure level as well as quality and total flow rate. As would be anticipated, the pressure drop varied inversely with system pressure at given flow rate and quality values.
Preliminary treatment of the data suggested correlation of the pressure drop with the above parameters by use of the two-phase friction factor concept. The specific friction factor forms of Huntington (6) and Bertuzzi, Tek, and Poettmann (7) proved unsatisfactory, and it was decided to derive correlating parameters by simple dimensional analysis. The two-phase pressure gradient AP/AL was taken as dependent variable, and total mass velocity G average quality x, inside diameter D, and vapor dens- ity po, were considered to be independent variables. The effect of system pressure level is accounted for by the vapor density, since this property is most sensitive to pres- sure. The pipe diameter, while not a variable in this study, is included since it would generally be expected to influ- ence the results. A generalized dimensional analysis of vapor-liquid flow in ipes, such as that performed by Ros
phases, and perhaps surface tension and contact angle. These quantities did not vary widely over the range of temperatures encountered in this study and for simplicity were deleted in the dimensional analysis which yielded
where
(8), would also inc P ude liquid density, viscosity of both
f = f(x) ( 2 )
(3) Pr n(AP/AL)gc
f = G"
Figure 3 presents a plot of the pressure drop data ac- cording to the relationship suggested by Equation ( 2 ) . The least-squares line through the data is given by
f = 0,0138 x'." (4)
TABLE 1. RANGE AND UNCERTAINTY OF EXPERIMENTAL
QUANTITIES-TWO-PHASE FLOW OF POTASSIUM
Two-phase pressure drop data
Range
226 0.054 to 3.10
108 to 752 0.54 to 15.8 923 to 1428
0.0004 to 0.3788
0.0065 to 0.3784
-0.0051 to $0.0312
Void fraction data
Range
17 131 to 749 879 to 1320
0.0172 to 0.1647
0.153 to 0.860
Uncertainty
. . . . . . . . . . . . 0.05 (maximum) 3. % (maximum ) 0.03 (max. at 1,000"F. ) 4 (max. at 1,000'F.) Depends on quality level ( 1 ) 0.003 at x = 0.05 Depends on quality level ( I ) 0.003 at x = 0.05 Depends on quality level ( 1 ) 0.003 at x = 0.05
Uncertainty
. . . . . . . . . . . . 3.% (maximum) 4 (max. at 1,00O0F.) Depends on quality level 0.003 at x = 0.05 Variablesee Figure 7 0.056 average standard deviation
January, 1966 Page 52 A.1.Ch.E. Journal

AVERAGE QUALlTY, x
Fig. 3. Two-phase frictional pressure gradient correlations for potas- sium and comparison with other correlations.
Statistical treatment of this correlation ( 1 ) showed it to be significant at the 0.1% level. The 95% confidence range for average f values predicted by the correlation is included in Figure 3.
As will be discussed subsequently, the two-phase pres- sure drop correlation is valid only for potassium flows where acceleration contributions are negligible compared to friction losses.
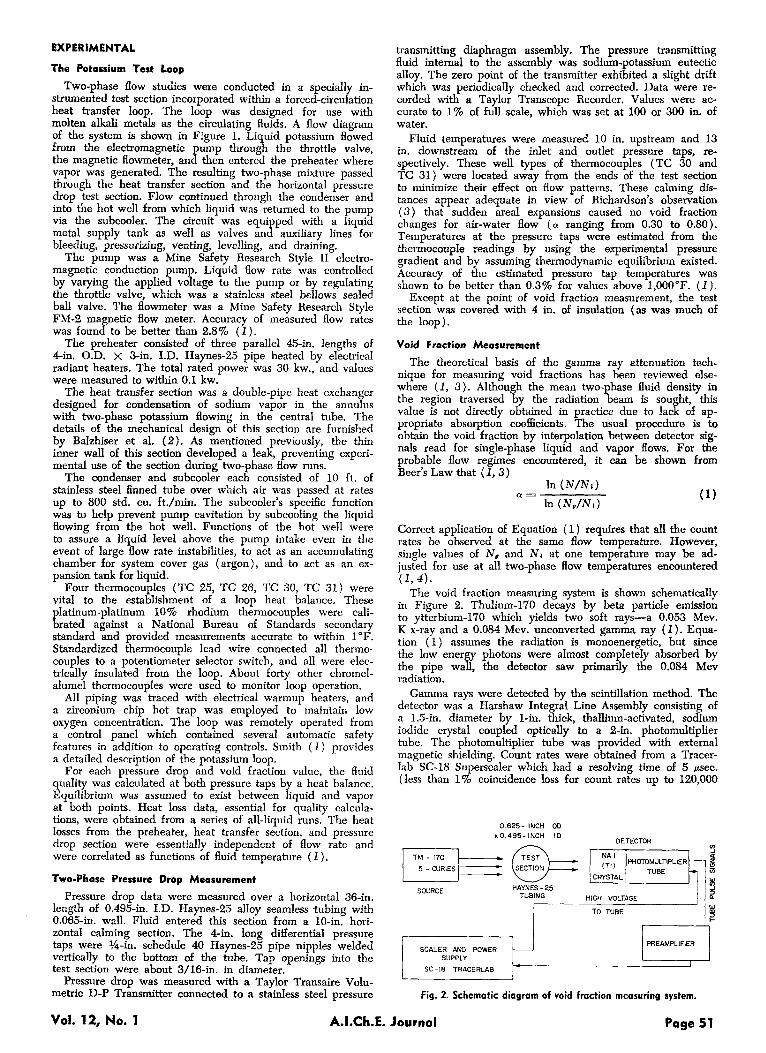
Metallic Void Fractions Ranges of pertinent experimental quantities are given
in Table 1 which indicate that the void fractions were ob- tained over the same flow rate range as the pressure drop data. Actually, the flow rate distribution is narrow, nine void fraction values occurring for flows between 200 and 300 lb./hr., and four values for flows between 300 and 400 Ib./hr. Approximate superficial velocities, assuming an all-liquid flow, ranged from 0.6 to 3.5 ft./sec. with about half the values 1.2 ft./sec.
In a summary of Russian metallic heat transfer research, Kutateladze (9) presents void fraction results for vapor, liquid mercury flows (obtained by Gremilov et al. and also Siryi) and for magnesium amalgam-mercury vapor flows (Korneev) . Void fraction was correlated against the ratio of superficial vapor velocity to total liquid velocity with a parametric all-liquid Froude number which ranged from 1 to 20. In recent investigations of metallic two-phase flows, Smith, Tang, and Walker (10) obtained mercury void fraction data and correlated them in the form sug- gested by Kutateladze. Froude number was the order of 10". However, in extending this work (10) to the potas-
sium-mercury amalgam system, Tang, Smith, and ROSS (11) found the amalgam data would not correlate with the mercury data when the same method of correlation was attempted. All the data were finally resented in the
Ten of the potassium void fraction points occurred for all-liquid Froude numbers between 1.05 and 1.15, prom t-
Kutateladze. However, as experienced by others (11), a correlation of that type was not obtained. When the data were plotted in the manner of Lockhart and Martinelli (12), the resulting graph indicated the existence of a correlation, although considerable scatter was present. Comparison of the potassium data with the mercury and potassium-mercury amalgam results of Tang et al. (11) showed that all these metallic data lay on about the same curve. In addition, Noyes' four reported oints (13) for
plotted in the same region. Because of the agreement among all these metallic data, they are presented in a single correlation, Figure 4.
The correlation of Figure 4 has the form devised by Lockhart and Martinelli (12 ) , where liquid fraction is taken as a function of the variable X which is defined by
form suggested by Lockhart and Martinel E . (12). ing an attempt to correlate the data in the form given Yl y
two-phase adiabatic sodium flows at 8 P b./sq. in. abs.
For flows where the liquid and vapor each exhibit super- ficial Reynolds numbers in the turbulent range (t t flow type), X may be approximated by (12)
All the potassium data were of this type of flow, as were Noyes' sodium points (13). The mercury and potassium mercury data (11) mostly occurred for conditions where liquid and vapor superficial Reynolds numbers were lami- nar and turbulent, respectively, (ut type of flow). Hence, the metallic data in Figure 4 encompass two of the "types of flow" postulated in reference 12. The scatter in the data precludes making any distinctions between types of flow for the correlation.
The least squares line through the metallic data in Figure 4 is given by
a = 1. - 0.574 X0.= This correlation was shown to be significant at the 0.1% level ( I ) . The 90% confidence range for average liquid fraction values is indicated.
(7)
DISCUSSION
Recalling that the experimental results were obtained from flows of a sodium-potassium mixture, it is pertinent to consider how well they may be expected to approximate the behavior of pure potassium. In the temperature range of 900" to 1400°F. only the binary vapor density deviates considerably from values for pure potassium (1). Since the liquid fraction correlation (Figure 4) is derived from several metallic systems, nothing is sacdiced by the fluid's being a binary mixture, particularly since nearIy all the metallic data (the sodium data being the exception) dis- play more scatter than can be attributed to uncertainty in fluid properties. The significance of Figure 4 is in com- parison with other fluid systems, as will be discussed sub- sequently. With regard to possible effect of fluid property differences on the pressure drop results, Smith has shown ( 1 ) that the f values are probably at most affected by 4%, which is within the 95% confidence band of the correla- tion. It is concluded that the experimental results are good approximations to the two-phase flow of pure potassium.
Vol. 12, No. 1 A.1.Ch.E. Journal Page 53

Two-Phase Pressure Drop For about 60% of the pressure drop data, the tempera-
ture decrease across the test section was greater than 15"F., and the mixture quality increased. In many cases the quaIity increase was between 0.01 and 0.02, repre- senting a significant fraction of the test section average quality. I t was previously stated that the two-phase pres- sure gradient correlation, Figure 3, is for frictional pres- sure losses. This statement demands justification in view of the possible acceleration components which could ac- company the quality increases cited above.
For any flow system in which a change of phase occurs, the differential pressure loss is usually considered to be the sum of components due to friction, fluid acceleration, and hydrostatic head. Since the potassium flows were horizontal
- vdv -dP = -dP, + p - g.
The local two-phase mixture density of the Iocal void fraction and individual phase densities
is obtained in terms
p = a p , + ( 1 - a ) p r (9) The acceleration term in Equation (9) may be written in terms of the total mass velocity G and mean density, giv- ing
G' d; -dp=-@,--- ( 10)
g c 3 It is desired to ascertain whether the total pressure
losses measured experimentally included significant ac-
celeration components. To evaluate this possibility it was necessary to establish the -dP, term with assurance. Eighty-eight data points occurred for essentially isother- mal conditions where quality changes were very small, therefore representing frictional flows. These data were used to formulate a correlation for the two-phase friction factor from which the frictional term in Equation (11) could be obtained.
Equation (11) was numerically integrated with flow data for many points, representing a wide range of Bow conditions which exhibited appreciable quality increases ( 1 ) . The metaIlic void fraction correlation, Equation ( 7 ) , was used in evaluation of mixture densities, thermody- namic equilibrium was assumed, and quality was assumed to vary linearly along the section. Calculated overall pres- sure drop values agreed well with experimental vaiues. More important, however, comparison of acceleration and friction components showed that acceleration losses never exceeded 3%, and for most cases it was less than 1.5% of the overall value. While frictional gradients ranged from 0.016 to 1.03 Ib./(sq. in.) (ft.), the acceleration components ranged from 0 to 0.014 lb./'(sq. in.) (ft.). This evaluation demonstrated that the experimental potassium pressure drops were essentially frictional.
It may seem anomalous that the f data in Fi ure 3 show small values for qualities approaching all- B iquid, rather than being of the same order of magnitude as for nearly all-vapor flows. Ordinarily, two-phase pressure gradients are greater for most qualities than for either pure vapor or liquid. It must be remembered, however, that f is defined using po and not a mean mixture density. When plotted in the classical manner of Lockhart and
I .c
0.6
04
0.2
0. I
0.06
0.04
0.02
0.0 I
QOOE
0-004
0.002
METALLIC DATA
0 This study 8-92 Na-K
Tang, K-Hg Amalgam A Tang, Hg
~
ii I I l k I
MEmLL/C DATA - LEAST SQUARES
1
-r- I ! ! I I I I
+ A
V
Hewitt, et. al. A i r - H20 Richardson Air-H20, 112 x 2" Section Richardson Air-HZO, 114 x 2" Section Richardson Air-H20, 118 x 2" Section
0.00 I 0.01 0.02 0.04 0.06 0.1 0.2 0.4 0.6 1.0 2.0 4.0 6.0 10.0 20 40 60 100
X Fig. 4. Metallic liquid fraction correlation and comparison with other data and correlations.
Page 54 A.1.Ch.E. Journal January, 1966

Martinelli (12) the data show the trend of the correlation curves ( 1 ) .
In Figure 3 the potassium data are compared with val- ues predicted by the frictional pressure drop correlations of Lockhart and Martinelli ( 1 2 ) and Bertuzzi, Tek, and Poettmann ( 7), which were developed from air-liquid and natural gas-liquid data. Predicted values from the cor- relations are appreciably high.
Figure 3 also shows a comparison of the potassium data with values calculated from Bankoff's variable density single-fluid model (1 4) which was quite successful in pre- dicting behavior of steam-water flows. Generally, the Bank- off model predicts values which are a factor of lo" higher than the potassium data, and, in contrast with values from the other correlations (7,12), the Bankoff predictions show scatter. The Bankoff K parameter (14), necessary in the application of the model, was evaluated as a smoothed function of pressure from the potassium void fraction data ( 1 ) . The discrepancy between the model and the potas- sium data may arise from the model's inherent assumption that the ratio of mean two-phase viscosity to liquid vis- cosity is unity. In addition, the model was derived for bubble types of flows where slip ratios are low, whereas the potassium data indicate high slip ratios and probably were not bubble flows.
In Figure 5 the potassium correlation is compared with data obtained from other fluid systems. The vertical steam-water data of Isbin, Sher, and Eddy (15) were cor- rected for hydrostatic head before plotting. Pike's steam- water data (16) were obtained from nearly adiabatic flows in a long horizontal tube. The data of Johnson and Abou- Sabe (171, Govier and Omer (18), and Reid et al. (19) were
I0
10
10-
.c
& 0 I- 0
10- z I-
LT LL
w cn
a
0 0
4 10'
P I-
1 0 '
1.0 0. I 0.0 I
I ! I
xx x I
v PIKE, H20-STEAM 5 ISBIN. ET. AL,
POZ DA?
H 2 0 -STEAM REID, E T AL. AIR- H20 4'' PlPF
0
. . .. - REID, E T AL., AIR-HzO, 6" PIPE
A GOVIER, E T AL, AIR - H 2 0 A JOHNSON. ET AL. AIR-HgO ISOTH . JOHNSON; E T AL; AlR-H;O HEAT x TEK, OIL-GAS
Fig. 5. Comparison of potassium two-phase pressure gradient corre- lation with data of other investigations.
from horizontal air-water flows in pipes of various dimen- sions. Except for the heated runs of Johnson and Abou- Sabe, and the nearly adiabatic data of Pike, the data in Figure 5 were obtained from isothermal flows. The data furnished by Tek ( 2 0 ) are from flows of oils and air or natural gas in various sized pipes, The data of Reid et al. were obtained from pipes of large diameter. The data shown in Figure 5 all fall substantially higher than the potassium results, in keeping with the comparison with other correlations (7, 12) which are based on data of the type plotted in Figure 5.
A few experiments on two-phase flows of metallic SYS- tems have been reported (21 ) , but either the flow char- acteristics involved, the system geometries, or the method of data presentation precluded comparison with the re- sults of this study. The only metallic pressure gradient and liquid fraction data for which a valid comparison could be made are the horizontal isothermal mercury- nitrogen results of Koestel ( 2 2 ) . The pressure gradient data are compared with the potassium correlation in Fig- ure 6 which shows very favorable agreement between the two fluid systems. This agreement, as compared with dis- agreement between the potassium and nonmetallic sys- tems, suggests that some fundamental difference exists in pressure drop behavior between metallic and nonmetallic two-phase fluids.
An effort was made to determine a parameter which distinguishes the metallic data of Figures 3 and 6 from the data of other systems shown in Figure 5. Neither the vapor-to-liquid viscosity ratio nor density ratio provided a suitable parametric effect (1 ) . Of several other param- eters examined, the most promising was the liquid vis-
10-1
to-*
c
or' 0 10-2
2 0 0 LL I O - ~
I- 0
z I-
rx
w cn I
0
a
4- 2
lo-'
. -
\ LEAST -SQUARES
LINE THROUGH POirASSfUM DATi
~ MERCURY-NITROGEN OF KOESTEL (22) .tp
0.01 AVERAGE QUALITY, x
10-E I01
Fig. 6. Comparison of potassium two-phase pressure gradient corre- lation with mercury-nitrogen data of Koestel (22).
Vol. 12, No. 1 A.1.Ch.E. Journal Page 55

cosity influence number of Ros ( 8 ) which includes sur- face tension. Indications are that interfacial characteristics and wettability may be principal factors which Weren- tiate two-phase flow behavior among various fluid systems, so surface tension would be expected to have influence in more general correlations.
Metallic Void Fractions The potassium void fraction data were determined by
a single-shot gamma ray attenuation method. This pro- cedure is not as accurate for determining void fractions as the traversing method (3, 16). Pike (16) and Richardson (3) used Lucite mockups of void distributions to assess the accuracy of their experimental procedures. Mockups were not used in this study. However, it has been shown that the potassium values as predicted by the correlation of Figure 4 fall within the accuracy theoretically expected from the gamma ray count rate data (1 ) . The theoretical variance in void fraction due to statistical randomness in gamma ray counting is given by
where
[Partial notation is used in Equation (11) since tempera- ture is also a variable. However, since temperature cor- rections were made in calculating void fractions ( 1 ) , it is assumed any contributions to a'( a) from temperature variance are negligible.] The working beam count rate is
The variance of any individual gamma ray counting meas- urement is equal to the number of counts obtained. Then
Insertion of Equation (14) into Equation (11) and the use of Equation (1) allow complete evaluation of the variance in void fraction due to counting statistics. The standard deviations in void fraction, calculated for the potassium data by this analysis, are plotted in Figure 7. For a values greater than 0.3, the standard deviations range from 4 to 19% of the a values. The point a = 0.153 has a theoretical standard deviation amounting to 73% of the a value. This figure illustrates that the higher a values are inherently more accurate. Decreasing background count rates would improve a values.
Since a narrow stationary radiation beam was employed, errors might have been incurred in stratified flows be- cause of channel wall curvature in regions not scanned. It seems probable, as discussed below, that flow patterns were wavy stratified with intermittent slugging. To get an idea of the magnitude of possible errors due to incomplete scanning of the fluid, the void fraction data were ad- justed to account for the liquid volume not scanned. The adjustments on the average were less than the standard deviation due to counting statistics, suggesting that signi- ficant accuracy probably was not lost by use of a single- shot narrow beam procedure.
Although theoretical considerations give an indication of the accuracy of the potassium a values (Figure 7), the range of scatter in the data is beyond the inaccuracies anticipated. It is believed that this situation arose from the flow instabilities present in the loop. Recall that the pressure drop and flow rate records showed fluctuations, suggesting that liquid slugs periodically traversed the test section. Since gamma ray counts were obtained over 3- min. periods, the oscillatory void fraction behavior was effectively averaged. Randomness in the void fraction
VOID FRACTION, a
Fig. 7. Standard deviation in potassium void fractions due to gamma ray counting statistics.
oscillations very likely caused the pronounced scatter in the data. In view of the data scatter probably being due to these flow oscillations, any inaccuracies due to averag- ing inlet and outlet temperatures and qualities to give values at the point of (Y measurement are probably insig- nificant (that is, these quantities only affect the abscissa X in Figure 4). The oscillatory flow behavior is also be- lieved to have caused much of the scatter in f values shown in Figure 3.
As shown by Figure 4, the metallic liquid fractions fall substantially higher than correlations and data from other fluid systems. The correlation Line of Lockhart and Mar- tinelli (12) , developed from water-air and oil-air data, shows about the same slope as the metallic correlation. Richardson's data (3) on turbulent-turbulent water-air flows in horizontal rectangular channels are in agreement with the Lockhart-Martinelli curve, but similar data of Hewitt, King, and Lovegrove (23) for flows in round tubes fall lower than the correlation. Even if standard de- viations (Figure 7) are placed around each potassium point, the data still are substantially higher than the Lockhart-Martinelli correlation.
The lower part of Figure 4 shows potassium values calculated with a correlation developed by Baroczy ( 2 4 ) which was suggested for use with single-component metallic fluids. The correlation was developed with the mercury-nitrogen data of Koestel (22) and the air-water data of Hewitt et al. (23 ) . The calculated values from Baroczy's correlation show a substantial degree of scatter and the mean line through them is indicated. It is clear that this correlation is more inadequate than the Lock- hart-Martinelli correlation for predicting potassium liquid fractions. Koestel's mercury-nitrogen data (22) are in- cluded in Figure 4.
Recalling from Figure 6 that Koestel's mercury-nitrogen pressure drop data agreed with the friction factor cor- relation used for the potassium data, it is interesting to note the disagreement between liquid fractions in Figure 4. Experimentally, one clear contrast exists between Koestel's flows and the potassium flows: liquid wettabil- ities with respect to the tube wall are opposite. Koestel's data were obtained from a glass test section which would not have been wetted by the mercury. However, the Haynes-25 alloy was wetted by potassium. These oppos- ing wetting characteristics suggest that wettability may be a decisive factor in void fraction behavior. The favor- able friction factor comparison suggests wettability may be of considerably less significance in two-phase fraction pressure loss behavior. Another probable factor in the
Page 56 A. I .Ch .E. Journal January, 1966

wide divergence between liquid fractions for these two flow systems is that Koestel's vapor phase was a noncon- densable second component.
It has been mentioned that the mean velocities of the two phases in vapor-liquid flow, based on the cross-sec- tional area occupied b each phase, are frequently un- equal and the ratio o l vapor-to-liquid velocities greater than unity. This velocity slip ratio is given by
v, X
s = - Vt = ( -) 1 - x (+) (E) (15)
Potassium slip ratios corresponding to each void fraction point were calculated and ran ed from 53 to 1,150, the
fraction data. It is believed, however, that their average value of 350 suggests that potassium values were of the order of lo". This is about a factor of l@ higher than air- water slip ratios observed by Richardson (3) for flows in rectangular channels at atmospheric pressure. Equation (15) indicates that high slip ratios would be observed for metallic fluids, since the density ratio (pz/p,) generally is very high. Koestel's mercury-nitrogen data (22) also show high slips; values for fifty-four data points ranged from 3.9 to 60.7, with the mean value 15.8. These results add credence to the suggestion that potassium S values were of the order of lo", since the values ( 1 - a)/a were much lower for the mercury-nitrogen than for the potas- sium data.
Although the potassium flow patterns were not experi- mentally observed, it is interesting to consider probable characteristics. Of the seventeen liquid fraction values, only two are below 0.2. Bankoff (14) pointed out that in vertical flows, bubble flow is usually observed when liquid fractions are greater than 0.2. Bubble flows would seem improbable in this case, since flows were horizontal and gravitational asymmetry would tend to force liquid to the tube bottom. It seems most likely that the potassium flows were stratified wavy with slugging superimposed. This situation is compatible with the high veIocity slip ratios and also with the fluctuating pressure drop and flow rate behavior.
wide range resulting from the f arge variance in the void
CONCLUSIONS
1. Although the experiments were run with a sodium- potassium mixture containing 8 wt. % sodium, it is be- lieved that the two-phase flow correlations are representa- tive of pure potassium behavior.
2. Two-phase frictional pressure gradients for potassium were correlated in terms of a two-phase friction factor f defined by Equation (3 ) , which accounts for the effects of total mass flow rate, tube diameter, and system pres- sure. Quality was the other correlating variable.
3. Well-known, two-phase pressure dro correlations and a theoretical model, when applied in t hp e usual man- ner, predict potassium pressure gradients that are sub- stantially greater than the experimental values.
ase frictional pressure gradient
viously reported mercury-nitrogen data ( 2 2 ) . These metallic data are much lower than values reported for flows of water-air, oil-air, and water-steam systems.
5. The potassium void fraction data, together with other metallic data reported previously (11, 13), have yielded a Lockhart-Martinelli type of liquid fraction cor- relation for single-component metallic fluids.
6. Metallic void fractions are Iower than for water- steam and water-air systems; previously published corre- lations do not fit the metallic data. The mercury-nitrogen data (22) , with which the potassium pressure gradients agreed favorably, showed large divergence with respect
4. The potassium two- correlation shows remar Eh ably good agreement with pre-
to void fractions. Experimental differences suggest that wettability may be highly influential on void fraction val- ues.
7. Because their liquid-to-vapor density ratios are gen- erally higher, metallic systems display considerably higher velocity slip ratios than nonmetallic fluids. It appears that the potassium slip ratios may have been of the order of loZ, although precise values cannot be stated.
ACKNOWLEDGMENT
This study was made possible by financial support from the U. S . Air Force, Aeronautical Systems Division, Contracts
Engineers of Mine Safety Research Corporation, particularly Guy Kennedy and Earl King, were especially helpful in the design and troubleshooting of the potassium test loop.
AF 33( 616)-8277 and AF 331 657)-11548.
NOTATION
D = tube I.D., ft. f = two-phase friction factor defined by Equation (3) G = total mass velocity, lb.,,,/(hr.) (sq. ft.) g, = gravitational conversion constant, 32.17 (lb.=)
(ft.)/ (Ib.f) (sec.) (sec.) N = gamma ray count rate for two-phase flow, counts/
min. N , gamma ray count rate for all-vapor flow, counts/
min. N , = gamma ray count rate for all-liquid flow, counts/
min. P = absolute pressure, lb.,/sq. in. -dP, = differential pressure drop due to friction, 1b.J
AP/AL = two-phase pressure gradient, Ib.J( sq. in.) (ft.) (AP/AL) g) = pressure gradient that would occur if
the liquid (or vapor) were passed through the tube at its own flow rate, lb.,/(sq. in.) (ft.)
sq. in.
S = velocity slip ratio, given by Equation (15) V = local superficial two-phase mixture velocity, ft./
sec. V, = average vapor velocity, based on cross-sectional
area occupied by vapor, ft./sec. V, = average liquid velocity, based on cross-sectional
area occupied by liquid, ft./sec. X = Lockhart-Martinelli (12) two-phase flow param-
eter defined by Equation (5) X , , = Lockhart-Martinelli X parameter for liquid tur-
bulent-vapor turbulent flow, given by Equation (6)
?c = quality (vapor mass fraction)
Greek Letters
a = void fraction (volume fraction vapor) p = viscosity, Ib.,/(ft.) (hr.) p = density, lb.,/cu. ft. u = variance operator
Subscripts bkg = background counting coll = collimated radiation beam g = vapor phase 1 = liquid phase
LITERATURE CITED
1. Smith, Lowell R., Ph.D. thesis, Univ. Michigan, Ann Arbor
2. Balzhiser, R. E., et al., Rept. RTD-TDR-63-4130, Wright-
3. Richardson, B. L., ANL-5949 (December, 1958). 4. Egen, R. A., D. A. Dingee, and J. W. Chastain, B M I -
( April, 1964).
Patterson Air Force Base, Ohio (November, 1963).
1163 (February 4,1957).
VOl. 12, No. 1 A. I .Ch .E. Journal Page 57

5.
6.
7.
8.
9.
10.
11.
12.
13.
Weathenvord, W. D., J. C. T ler, and P. M. Ku, United States Air Force, WADD-Teci. Rept. 61-96 (November, 1961). Isbin, H. S., R. H. Moen, and D. R. Mosher, AECU-2994 (November, 1954). Bertuzzi, A. F., M. R. Tek, and F. H. Poettmann, J. Petrol. Technol., 8, (January 17,1956). Ros, N. C. J., Trans. Am. SOC. Petrol. Engrs., AZME, 222, 1037 (1961). Kutbteladze, S. S., ed., “Liquid Metal Heat Transfer Media.” Atomnaia Energiia, Suppl. No. 2, Moscow ( 1958), translated by Counsultants Bureau, Inc., New York (1959). Smith, C. R., Y. S. Tang, and C. L. Walker, General Motors Corp. Allison Div., Eng. Dept. Rept. No. 2809 (May 25, 1962). Paper presented at A.1.Ch.E. Chicago meeting (December 2 to 6, 1962). Tang, Y. S., C. R. Smith, and P. T. Ross, General Motors Corp. Allison Div., Eng. Dept. Rept. No. 3549 (Septem- ber 16, 1963). Lockhart, R. W., and R. C. Martinelli, Chem. Eng. PTOg., 45,39 (1949).
14. 15.
16. 17.
18.
19.
20. 21.
22.
23.
24.
Oak Ridge Natl. Lab., to be published (September 4 to 6, 1963). Bankoff, S. G., J. Heat Tram., 82, 265 (1960). Isbin, H. S., N. C. Sher, and K. C. Eddy, A.1.Ch.E. 1.; 3,136 (1957). Pike, R. W., Ph.D. thesis, Georgia Inst. Technol. (1962). Johnson, H. A., and A. H. Abou-Sabe, Trans. Am. SOC. Mech. Engrs., 74, 977 (1952). Govier, G. W., and M. M. Omer, Can. J . Chem. Eng., 40,93 (1962). Reid, R. C., A. B. Reynolds, A: J. Diglio, I. Spiewak, and D. H. Klipstein, A.1.Ch.E. J., 3, 321 (1957). Tek, M . R., private communication (January, 1964). Third Annual High-Temperature Liquid Metal Heat Trans- fer Technology Conference, Oak Ridge Natl. Lab., Tenn., to be published (September 4 to 6, 1963). Koestel, Alfred, TRW Rept. ER-4104 (June, 1960); private communication (January, 1964). Hewitt, G. F., I. King, and P. C. Lovegrove, Brit. Chem. Eng., 8,311 (1963). Baroczy, C. J., Atomics International, Rept. NAA-SR-8171 ( ADril. 1963). , I ,
Noyes’ R‘ “’ paper presented at Third High- Manuscript received September 22, 1964; revision received July 10, Temperature Liquid Metal Heat Transfer Technol. Conf., 1965; paper accepted IUZY 26,1965.
The Low Temperature Removal of Small Quantities of Nitrogen or Methane from
Hydrogen G a s by Physical Adsorption
on a Synthetic Zeolite ARTHUR J. KIDNAY and MICHAEL J. HlZA
National Bureau of Standards, Boulder, Colorado
A flow system wos used to measure the physical adsorption isotherms of two mixtures of nitrogen and hydrogen and two mixtures of methane and hydrogen on a synthetic zeolite. The meosurements were made a t liquid nitrogen temperature and at pressures of 4 to 85 atm. Static systems were used to measure the pure component isotherms of nitrogen, methane, and hydrogen at the some temperature and over the appropriate pressure ranges.
Although many different methods have been proposed for using pure component adsorption isotherms to predict the mixture isotherm, the only method giving quantitative agreement with the data of this study is the empirical “adsorption enhancement factor” (4).
In addition to the adsorption isotherms, the concentration-time or breokthrough curves of the mixtures were measured a t flow rates ranging from 40 to 300 Ib./(hr.)(sq.ft.). The method proposed by Eagletan and Bliss (18) was used to correlate these curves.
Since all materials, with the exception of helium, are solids at liquid hydrogen temperature, the concentration of impurities in the feed gas to a hydrogen liquefier must be reduced to levels equal to their solubilities in gaseous or Liquid hydrogen. Otherwise solid deposition will occur, resulting in eventual plugging.
By using the experimental phase equilibrium data of Dokoupil ( I ) , Baker and Paul (2) have established the desirable impurity levels of nitrogen and carbon monoxide
in Liquefaction grade hydrogen at 1 p.p.m. The data of Hiza and Herring ( 3 ) for the methane-hydrogen system indicate that the tolerable impurity level of methane will be considerably less than 1 p.p.m. Obviously, then, the final step in any hydrogen purification train must be a process capable of attaining a very high degree of purifi- cation. Although there are a number of possible processes for attaining the required impurity level, the only feasi- ble one is physical adsorption at cryogenic temperatures.
Page 58 A.1.Ch.E. Journal January, 1966