Pressure-broadeningcoefficientsandlinestrengthsofH O...
17
Journal of Quantitative Spectroscopy & Radiative Transfer ] (]]]]) ]]]–]]] Pressure-broadening coefficients and line strengths of H 2 O near 1.39 mm: application to the in situ sensing of the middle atmosphere with balloonborne diode lasers G. Durry a,b , V. Zeninari a, , B. Parvitte a , T. Le barbu a,b , F. Lefevre b , J. Ovarlez c , R.R. Gamache d a Groupe de Spectrome´trie Mole´culaire et Atmosphe´rique, UMR CNRS 6089, UFR Sciences Exactes et Naturelles, Moulin de la Housse, BP 1039, 51687 Reims, Cedex 2, France b Service d’Ae´ronomie du CNRS, CNRS-Re´duit de Verrie`res, BP 3, 91371 Verrie`res-le-Buisson Cedex, France c Laboratoire de Me´te´orologie Dynamique, UMR 8539, Ecole Polytechnique, 91128 Palaiseau, Cedex, France d Department of Environmental, Earth, and Atmospheric Sciences, University of Massachusetts Lowell, 265 Riverside Street, Lowell, MA 01854-5045, USA Received 18 June 2004; received in revised form 1 September 2004; accepted 1 September 2004 Abstract Since 1998, we have developed two balloonborne diode laser spectrometers, SDLA and micro-SDLA, to yield in situ concentration data of H 2 O in the middle atmosphere by absorption spectroscopy in the 1.39- mm spectral range. In this paper, we revisit the molecular parameters, line intensities and pressure- broadening coefficients, for several lines of the n 1 +n 3 and 2n 1 bands, which are useful for the monitoring of atmospheric H 2 O. The new values are thoroughly compared to existing molecular database and previous determinations. Calculations are performed to yield the pressure-effect coefficients: the theoretical model is described and the ab initio predictions are compared to laboratory measurements achieved with a laser diode spectrometer. The improvement in the H 2 O monitoring obtained with the new set of molecular data is evaluated directly from vertical H 2 O concentration profiles. r 2004 Elsevier Ltd. All rights reserved. Keywords: Diode laser; Near-infrared spectrometer; Ab initio calculations; Water vapor; Atmospheric applications ARTICLE IN PRESS www.elsevier.com/locate/jqsrt 0022-4073/$ - see front matter r 2004 Elsevier Ltd. All rights reserved. doi:10.1016/j.jqsrt.2004.09.033 Corresponding author. Tel.: +33 3 26 91 34 45; fax: +33 3 26 91 31 47. E-mail address: [email protected] (V. Zeninari).
Transcript of Pressure-broadeningcoefficientsandlinestrengthsofH O...

ARTICLE IN PRESS
Journal of Quantitative Spectroscopy &
Radiative Transfer ] (]]]]) ]]]–]]]
0022-4073/$ -
doi:10.1016/j.
�CorresponE-mail add
www.elsevier.com/locate/jqsrt
Pressure-broadening coefficients and line strengths of H2Onear 1.39 mm: application to the in situ sensing of the middle
atmosphere with balloonborne diode lasers
G. Durrya,b, V. Zeninaria,�, B. Parvittea, T. Le barbua,b, F. Lefevreb,J. Ovarlezc, R.R. Gamached
aGroupe de Spectrometrie Moleculaire et Atmospherique, UMR CNRS 6089, UFR Sciences Exactes et Naturelles,
Moulin de la Housse, BP 1039, 51687 Reims, Cedex 2, FrancebService d’Aeronomie du CNRS, CNRS-Reduit de Verrieres, BP 3, 91371 Verrieres-le-Buisson Cedex, FrancecLaboratoire de Meteorologie Dynamique, UMR 8539, Ecole Polytechnique, 91128 Palaiseau, Cedex, France
dDepartment of Environmental, Earth, and Atmospheric Sciences, University of Massachusetts Lowell,
265 Riverside Street, Lowell, MA 01854-5045, USA
Received 18 June 2004; received in revised form 1 September 2004; accepted 1 September 2004
Abstract
Since 1998, we have developed two balloonborne diode laser spectrometers, SDLA and micro-SDLA, toyield in situ concentration data of H2O in the middle atmosphere by absorption spectroscopy in the 1.39-mm spectral range. In this paper, we revisit the molecular parameters, line intensities and pressure-broadening coefficients, for several lines of the n1+n3 and 2n1 bands, which are useful for the monitoring ofatmospheric H2O. The new values are thoroughly compared to existing molecular database and previousdeterminations. Calculations are performed to yield the pressure-effect coefficients: the theoretical model isdescribed and the ab initio predictions are compared to laboratory measurements achieved with a laserdiode spectrometer. The improvement in the H2O monitoring obtained with the new set of molecular datais evaluated directly from vertical H2O concentration profiles.r 2004 Elsevier Ltd. All rights reserved.
Keywords: Diode laser; Near-infrared spectrometer; Ab initio calculations; Water vapor; Atmospheric applications
see front matter r 2004 Elsevier Ltd. All rights reserved.
jqsrt.2004.09.033
ding author. Tel.: +33 3 26 91 34 45; fax: +33 3 26 91 31 47.
ress: [email protected] (V. Zeninari).

ARTICLE IN PRESS
G. Durry et al. / Journal of Quantitative Spectroscopy & Radiative Transfer ] (]]]]) ]]]–]]]2
1. Introduction
Since 1998, two balloonborne laser diodes, SDLA and micro-SDLA, have been developed withthe support of the French space agency to measure in situ water vapor, methane and carbondioxide in the lower stratosphere [1]. Both sensors have been involved in several Europeancampaigns to study stratospheric ozone (THESEO in 1999–2000) or to investigate the processescontrolling H2O in tropical regions (HIBISCUS in 2003–2004). Furthermore, the sensors arecurrently participating to the validation of environmental satellites like GOMOS-H2O (onboardENVISAT) and ODIN. The H2O molecule plays a major role in the radiative and chemicalequilibrium of the lower stratosphere, the region of the atmosphere where the ozone layer isfound. The observed increase of 1% year in the H2O content of the lower stratosphere, withsuspected impact on the global ozone recovery, is a strong impetus to develop new technique forthe in situ monitoring of H2O. Water vapor is difficult to measure in situ because there are largeamounts of water vapor in the lower layers of the Earth atmosphere (20,000 ppmv at ground levelsin tropical regions) while the stratosphere is comparatively strongly dehydrated (4–5 ppmv).Diode laser spectroscopy is a powerful sensing method to address the monitoring of H2O: bycombining direct/differential detection technique with an appropriate selection of the H2Omolecular transitions scanned over by the laser, it is possible to achieve a dynamic range of fiveorders of magnitude for the concentration measurements and therefore to probe continuouslyH2O in the middle atmosphere [2]. During the ascent/descent of the balloon gondola in the lowerlayers of the atmosphere, the laser scans weak H2O transitions to probe the large amounts ofwater vapor and direct detection is used to record the spectra, whereas strong transitions areselected in conjunction with differential detection to monitor the dehydrated stratosphere.Purposely, we have had developed by THALES–LCR a dedicated telecommunication-typedistributed-feedback InGaAs laser diode emitting from 7165 to 7185 cm�1. That particularspectral domain features essentially H2O transitions from the n1+n3 and 2n1 bands, with lineintensities ranging from 10�20 to 10�23 cm�1mol�1 cm2. The laser diode is connected by means ofan optical fiber to a multipass cell operated open to the atmosphere, which provides an absorptionpath of �50m. The laser beam is absorbed in situ by the ambient H2O molecules while it isbouncing back and forth between both mirrors of the cell. In situ absorption spectra are recordedwithin 1 s at cell output using direct-differential detection technique [1]. Simultaneously, in situmeasurement of atmospheric pressure and temperature are taken from dedicated sensor onboardthe balloon gondola. The molecular concentration is retrieved from the in situ spectra by applyinga non-linear least-squares fit to the full molecular line shape using the corresponding P and T dataand an appropriate molecular model. A complete description of concentration retrieval principaland achieved inaccuracy that lays between 5% and 10%, are found in Ref. [1]. The molecularparameters (line strengths and pressure-broadening coefficients) used to relate the absorption oflaser energy to the molecular densities are an important source of error; for instance, with theassumption of a weak absorption, the molecular absorption is directly proportional to the linestrength. In a previous work, we have observed discrepancies with the HITRAN database interms of positions and intensities, for several lines reached by the THALES laser [3]. In this paper,we investigate experimentally and theoretically essentially the intensities and pressure-broadeningcoefficients which are used by the balloonborne laser hygrometer SDLA and micro-SDLA. Theeffect of error in the intensity and broadening parameter as well as the choice of a Voigt or
ARTICLE IN PRESS
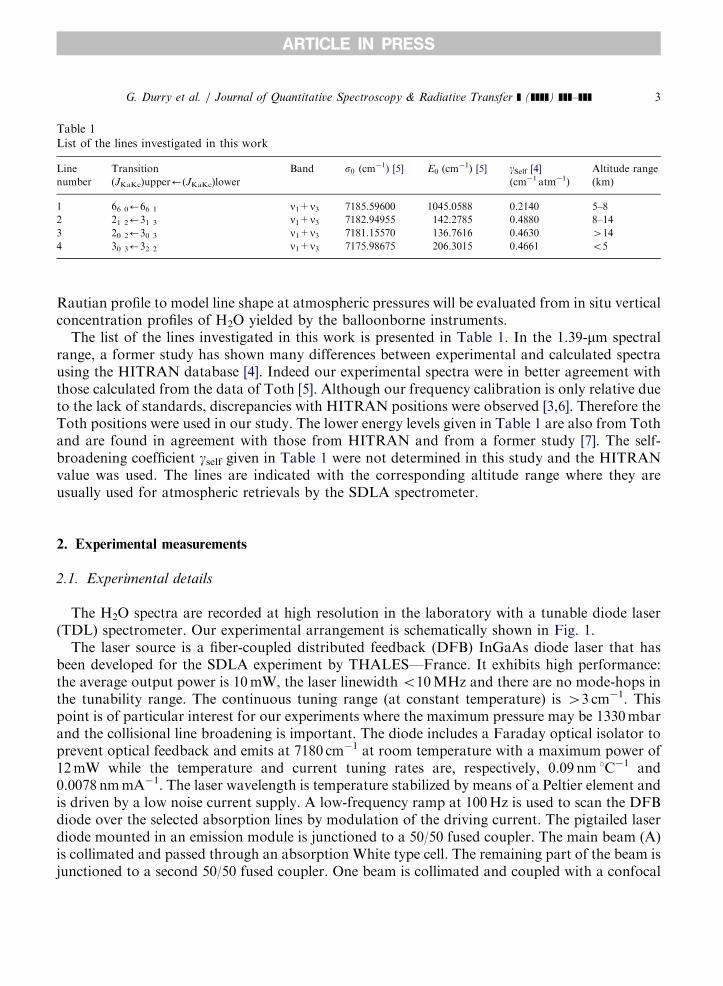
Table 1
List of the lines investigated in this work
Line
number
Transition
(JKaKc)upper’(JKaKc)lowerBand s0 (cm
�1) [5] E0 (cm�1) [5] gSelf [4]
(cm�1 atm�1)
Altitude range
(km)
1 66 0’66 1 n1+n3 7185.59600 1045.0588 0.2140 5–8
2 21 2’31 3 n1+n3 7182.94955 142.2785 0.4880 8–14
3 20 2’30 3 n1+n3 7181.15570 136.7616 0.4630 4144 30 3’32 2 n1+n3 7175.98675 206.3015 0.4661 o5
G. Durry et al. / Journal of Quantitative Spectroscopy & Radiative Transfer ] (]]]]) ]]]–]]] 3
Rautian profile to model line shape at atmospheric pressures will be evaluated from in situ verticalconcentration profiles of H2O yielded by the balloonborne instruments.The list of the lines investigated in this work is presented in Table 1. In the 1.39-mm spectral
range, a former study has shown many differences between experimental and calculated spectrausing the HITRAN database [4]. Indeed our experimental spectra were in better agreement withthose calculated from the data of Toth [5]. Although our frequency calibration is only relative dueto the lack of standards, discrepancies with HITRAN positions were observed [3,6]. Therefore theToth positions were used in our study. The lower energy levels given in Table 1 are also from Tothand are found in agreement with those from HITRAN and from a former study [7]. The self-broadening coefficient gself given in Table 1 were not determined in this study and the HITRANvalue was used. The lines are indicated with the corresponding altitude range where they areusually used for atmospheric retrievals by the SDLA spectrometer.
2. Experimental measurements
2.1. Experimental details
The H2O spectra are recorded at high resolution in the laboratory with a tunable diode laser(TDL) spectrometer. Our experimental arrangement is schematically shown in Fig. 1.The laser source is a fiber-coupled distributed feedback (DFB) InGaAs diode laser that has
been developed for the SDLA experiment by THALES—France. It exhibits high performance:the average output power is 10mW, the laser linewidtho10MHz and there are no mode-hops inthe tunability range. The continuous tuning range (at constant temperature) is 43 cm�1. Thispoint is of particular interest for our experiments where the maximum pressure may be 1330mbarand the collisional line broadening is important. The diode includes a Faraday optical isolator toprevent optical feedback and emits at 7180 cm�1 at room temperature with a maximum power of12mW while the temperature and current tuning rates are, respectively, 0.09 nm 1C�1 and0.0078 nmmA�1. The laser wavelength is temperature stabilized by means of a Peltier element andis driven by a low noise current supply. A low-frequency ramp at 100Hz is used to scan the DFBdiode over the selected absorption lines by modulation of the driving current. The pigtailed laserdiode mounted in an emission module is junctioned to a 50/50 fused coupler. The main beam (A)is collimated and passed through an absorption White type cell. The remaining part of the beam isjunctioned to a second 50/50 fused coupler. One beam is collimated and coupled with a confocal

ARTICLE IN PRESS
Fig. 1. Scheme of the absorption spectrometer. Temp. Cont. stands for temperature controller, Slow mod. stands for
slow modulation, PD stands for photodiode and FP stands for Fabry–Perot interferometer.
G. Durry et al. / Journal of Quantitative Spectroscopy & Radiative Transfer ] (]]]]) ]]]–]]]4
Fabry Perot (FP) interferometer used for frequency calibration (free spectral range 0.0095 cm�1).The other beam is used as the reference (B). The whole set-up takes place in a closed box, filledwith dry nitrogen at atmospheric pressure in order to minimize the absorption by ambient watervapor. Furthermore, the use of optical fibers to conduct light and the use of fused couplers insteadof beam splitters is convenient to prevent further corruption by ambient H2O over the opticalpath followed by the laser beam. The three signals A, B, and FP are sent to a digital oscilloscopeand to a personal computer for data acquisition (10ms per spectrum, 11 bit resolution). We usetwo different absorption cells for this study: a small (10 cm long) cylindrical Pyrex cell and amultiple path White type cell (A) with a path length adjustable between 1 and 10m [8]. Forbroadening measurements the White cell is filled with pure water at low pressure and completedwith high purity (99.9995 %) gases nitrogen and oxygen from Air Liquide—France. The pressureis measured with an uncertainty of 0.5% using two MKS baratron manometers with 10 and1000Torr full scale. All measurements were done at room temperature (29671K). We recordnumerous spectra for each pressure varying from 6 to 1330mbar for the four lines under study.
2.2. Data inversion
To retrieve the coefficients of the line we usually fit a Voigt profile to the moleculartransmission. The molecular transmission TðsÞ is obtained from the three recorded signals A, Band FP in two steps. First the FP signal is used to retrieve the frequency variation law by a 51polynomial interpolation on the interferences fringes. In the second step the method used toretrieve the molecular transmission TðsÞ is from the direct absorption signals A or B using

ARTICLE IN PRESS
G. Durry et al. / Journal of Quantitative Spectroscopy & Radiative Transfer ] (]]]]) ]]]–]]] 5
A ¼ A0TðsÞ: A0 is what would be the laser flux in the absence of absorber in the cell. A0 isobtained from A by a 51 polynomial interpolation over full transmission region. The line intensityS(T) is related to the molecular transmission through the Beer–Lambert law:
TðsÞ ¼ IT ðsÞ=I0ðsÞ ¼ exp½�kðss;T ; pÞnl�;
where n is the density of absorbing molecules on the optical path of length l, and the absorptioncoefficient kðs;T ; pÞ at temperature T and for a gas pressure p is modeled using the Voigt profile
kV ðss;T ; pÞ ¼ SðTÞAy
p
Z þ1�1
expð�t2Þ
y2 þ ðx� tÞ2dt
with
A ¼
ffiffiffiffiffiffiffiffiln 2p
gDopffiffiffipp ; y ¼
ffiffiffiffiffiffiffiffiln 2p gCol
gDop;x ¼
ffiffiffiffiffiffiffiffiln 2p s� s0
gDop;
where S(T) is the line intensity at temperature T, s0 is the line center wavenumber at pressure p,gDop is the Doppler halfwidth and gCol is the collisional halfwidth:
gCol ¼ gSelfpcþ gGaspð1� cÞ;
where gSelf is the self-broadening coefficient obtained from [4], c is the concentration of H2O andgGas is the broadening coefficient of the studied perturbing gas (nitrogen or oxygen). The Voigtprofile cannot be expressed in analytical form but may be expressed as the real part of the complexprobability function W(x,y) defined by
W ðx; yÞ ¼i
p
Z þ1�1
expð�t2Þ
xþ iy� tdt
which can be evaluated using the Humlicek algorithm [9]. Thus the Voigt profile is defined as
kVðss;T ; pÞ ¼ SðTÞA Re½W ðx; yÞ�:
The model developed by Rautian and Sobel’man [10] that take into account Dicke narrowingleads to the expression:
kRðss;T ; pÞ ¼ SðTÞA ReW ðx; yþ zÞ
1�ffiffiffipp
zW ðx; yþ zÞ
� �;
where a, x and y have their previous meaning and z ¼ffiffiffiffiffiffiffiffiln 2p
ðb=gDopÞ where b is related to thecollisional narrowing coefficient b0 by b ¼ b0p: We check that the apparatus function of thespectrometer was negligible by recording low pressure (o0.05mbar) spectra. In these conditionsthe lineshape could be fitted by a simple Gaussian curve having a Doppler width in goodagreement with the theoretical value.Fig. 2 gives an example of a spectrum recorded for the study of the 66 0’66 1 of the n1+n3 band
of H2O at 7185.5960 cm�1 diluted in N2. The experimental spectrum, the fitted calculatedspectrum described by a Rautian profile and the observed calculated residuals obtained using theVoigt profile and the Rautian model are presented. The figure demonstrates a small improvementobtained when Dicke narrowing is taken into account with Rautian model. The Rautian profilegives systematically slightly higher results of collisional widths at low pressure however the slopesof the straight lines obtained by plotting gGas vs. p are comparable. No attempt was made to

ARTICLE IN PRESS
Fig. 2. Example of spectrum for the 66 0’66 1 of the n1+n3 band of H2O at 7185.5960 cm�1 diluted in N2 (pressure is
44mbar and concentration is 2%). Experimental profile, fitted Rautian profile and residuals of the observed spectrum
and calculated ones described by Voigt profile (V) and Rautian model (R) are presented here.
Table 2
Absolute lines intensities for H2O at 296K and comparison with previous determinations
Line number Intensities S (10�22 cm�1 (molecule cm�2)) and differences (%)
S (this work) S [5] Diff. (%) S [4] Diff. (%) S [6] Diff. (%) S [12] Diff. (%)
1a 7.85 7.58 3.4 7.11 9.4 7.85 0.0 7.65 2.5
2 36.9 37.2 �0.8 53.0 �43.6 36.8 �0.3
3 142 143 �0.7 180 �26.8 147 �3.5
4 2.59 2.44 5.8 2.27 12.3 2.61 �0.8
aThis line is in fact an unresolved doublet. The strength given here corresponds to the sum of the strengths of the two
lines. The rotational quantum assignment given in Table 1 corresponds to the strongest transition.
G. Durry et al. / Journal of Quantitative Spectroscopy & Radiative Transfer ] (]]]]) ]]]–]]]6
obtain the value of b since two recent papers give this value for H2O in this region:0.025 cm�1 atm�1 for air [6,11].
2.3. Experimental results
The intensities of the four studied lines are reported in Table 2 with the comparison with othermeasurements and calculations in this region. The linestrengths were measured at varioustemperatures as reported in [3]. The complete set of H2O transitions lying within the tuning rangeof the THALES laser diode is also reported in [3]. The difference between our measurements and

ARTICLE IN PRESS
G. Durry et al. / Journal of Quantitative Spectroscopy & Radiative Transfer ] (]]]]) ]]]–]]] 7
the previous determinations are given in %. For absolute intensities our uncertainty is about 2%.For each line this uncertainty corresponds to one standard deviation obtained by averaging thedifferent measurements. Our measurements are in good agreement with those of Toth [5] for thestrongest lines obtained from Fourier Transform spectrometer. For lower intensities the differenceremains lower than 6%. For all lines the difference with HITRAN database [4] is quite large andvaries from –44% to +13%. The agreement is excellent with the value from Lepere [6] obtainedby diode laser spectroscopy. For all lines the difference with the calculated Partridge data [12] isquite small demonstrating that in this region the ab initio calculations are in very good agreementwith the experimental results. All the results concerning the intensities will influence strongly theH2O retrieval in the atmosphere.Fig. 3 presents an example of the pressure dependence of the collisional halfwidth by N2 for the
lines 1 and 4. The slope of the best fit lines represent the collisional halfwidth coefficient. For somelines the maximal pressure for the calculation of the slope was only 600mbar due to strongadjacent lines.Table 3 shows the experimental values for the broadening coefficients of H2O by N2 along with
the comparison with previous determinations. For all lines our uncertainty is about 2–3%. Theseuncertainties are the sum of the statistical errors derived from the linear fit. For lines 1 and 3 ourvalue corresponds to the mean value of the other experimental results. For lines 2 and 4, our valueis slightly higher.Table 4 shows the experimental values for the broadening coefficients of H2O by O2 along with
the comparison with previous determinations. For all lines our uncertainty is about 2%. For lines1 and 2 our value corresponds to the mean value of the other experimental results. For line 3 ourvalue is slightly lower and slightly higher for line 4. All these experimental results are veryconsistent with each other. One should remark that the ratio g(N2)/g(O2) is approximately equalto 1.7.
Fig. 3. Pressure dependence of the collisional halfwidth for the line 1 (66 0’66 1 at 7185.5960 cm�1) and for the line 4
(30 3’32 2 at 7175.98675 cm�1) of the n1+n3 band of H2O perturbed by N2.

ARTICLE IN PRESS
Table 3
Broadening coefficients of H2O by N2 and comparison with previous determinations
Line number Broadening coefficients g (cm�1 atm�1) by N2 and differences (%)
g (this work) g [13] Diff. (%) g [11] Diff. (%) g [6] Diff. (%) g [14] Diff. (%)
1 0.0456 0.0429 5.9 0.0484 �6.1 0.0469 �2.9 0.0470 �3.1
2 0.1076 0.1056 1.9 0.1000 7.1
3 0.1138 0.1076 5.4 0.1183 �4.0
4 0.1130 0.1004 11.1
Table 4
Broadening coefficients of H2O by O2 and comparison with previous determinations
Line number Broadening coefficients g (cm�1 atm�1) by O2 and differences (%)
g (this work) g [13] Diff. (%) g [11] Diff. (%) g [6] Diff. (%)
1 0.0271 0.0323 �19.2 0.0284 �4.6 0.0258 4.8
2 0.0620 0.0647 �4.4 0.0580 6.5
3 0.0644 0.0677 �5.1 0.0694 �7.8
4 0.0664 0.0588 11.4
Table 5
Broadening coefficients of H2O by air
Line number Broadening coefficients g (cm�1 atm�1) by air and differences (%)
g (this work) g [13] Diff. (%) g [11] Diff. (%) g [6] Diff. (%) g [4] Diff. (%)
1 0.0417 0.0407 2.4 0.0442 �6.0 0.0425 �1.9 0.0505 �21.1
2 0.0980 0.0970 1.0 0.0912 6.9 0.0980 0.0
3 0.1034 0.0992 4.1 0.1080 �4.4 0.1031 0.3
4 0.1032 0.0917 11.1 0.0919 10.9
Our data and the previous data are calculated from g(N2)� 0.79+g(O2)� 0.21 where g(N2) and g(O2) are given inTables 3 and 4. These calculations are further compared with the HITRAN database values.
G. Durry et al. / Journal of Quantitative Spectroscopy & Radiative Transfer ] (]]]]) ]]]–]]]8
To reach the scientific objectives of the SDLA spectrometer, an accuracy better than 5–10% isrequired in the H2O concentration retrieval. Hence, a precise knowledge of the H2O molecularparameters (linestrengths and air broadening coefficient) is of high importance. Table 5 shows theexperimental values for the broadening coefficients of H2O by air along with the comparison withprevious determinations. Our data and the previous data are calculated fromg(N2)� 0.79+g(O2)� 0.21 where g(N2) and g(O2) are given in Tables 3 and 4. For lines 1 and3 our value corresponds to the mean value of the other experimental results. For lines 2 and 4, ourvalue is slightly higher. This trend is the same that the trend observed for g(N2) because theinfluence of g(O2) is small in this calculation. The values for lines 2 and 3 are in very good

ARTICLE IN PRESS
G. Durry et al. / Journal of Quantitative Spectroscopy & Radiative Transfer ] (]]]]) ]]]–]]] 9
agreement with the HITRAN database values but lines 1 and 4 show big differences up to 20%for line 1. This difference will influence the retrieval of the H2O concentration in the atmosphere.Our experimental data will be compared in the next part with calculations based on theRobert–Bonamy formalism.
3. Theoretical calculations
The calculations are based on the complex Robert–Bonamy (CRB) theory [15]. A fulldescription of the formalism can be found in Refs. [16–18], here only the salient features arepresented. The method is complex valued so that the half-width and line shift are obtained from asingle calculation. The dynamics are developed to second order in time giving curved trajectoriesbased on the isotropic part of the intermolecular potential [15]. This has important consequencesin the description of close intermolecular collisions (small impact parameters).Within the CRB formalism the halfwidth, g, and line shift, d; of a ro-vibrational transition f’i
are given by minus the imaginary part and the real part, respectively, of the diagonal elements ofthe complex relaxation matrix. In computational form the halfwidth and line shift are usuallyexpressed in terms of the scattering matrix [19,20]:
ðg� idÞf i ¼n2
2pcv� 1� e�
RS2ðf ;i;J2;v;bÞe�i S1ðf ;i;J2;v;bÞþS2ðf ;i;J2;v;bÞ½ �h iD E
v;b;J2; (1)
where n2 is the number density of perturbers and . . .h iv;b;J2represents a average over alltrajectories (impact parameter b and initial relative velocity v) and initial rotational state J2 ofthe collision partner. S1 (real) and S2 ¼
RS2+iIS2 are the first- and second-order terms in the
expansion of the scattering matrix; they depend on the rovibrational states involved andassociated collision induced jumps from these levels, on the intermolecular potential andcharacteristics of the collision dynamics The exact forms of the S2 and S1 terms are given inRefs. [16–18].The S1 term, which makes a purely imaginary contribution, is isotropic in the absence of any
vibrational dependence of the anisotropic intermolecular forces. It has the appellation of thevibrational dephasing term and arises only for transitions where there is a change in thevibrational state. The potential leading to S1 is written in terms of the isotropic induction andLondon dispersion interactions. The S2 ¼
RS2+iIS2 term is complex valued and results from the
anisotropic interactions. The potential employed in the calculations consists of the leadingelectrostatic components for the H2O–X pair (the dipole and quadrupole moments of H2O withthe quadrupole moment of N2 or O2) and atom–atom interactions [16,21]. The latter are definedas the sum of pair-wise Lennard–Jones 6–12 interactions [22] between atoms of the radiating andthe perturbing molecules. The heteronuclear Lennard–Jones parameters for the atomic pairs canbe constructed from homonuclear atom–atom parameters by the ‘‘combination rules’’ ofHirschfelder et al. [23] or Good and Hope [24]. The atom–atom distance, rij is expressed in termsof the center of mass separation, R, via the expansion in 1/R of Sack [25]. Here the formulation ofNeshyba and Gamache [21] expanded to eighth order is used. Finally, recall that the isotropiccomponent of the atom–atom potential is used to define the trajectory of the collisions within thesemiclassical model of Robert and Bonamy [15].

ARTICLE IN PRESS
G. Durry et al. / Journal of Quantitative Spectroscopy & Radiative Transfer ] (]]]]) ]]]–]]]10
For water vapor, the reduced matrix elements are evaluated using wavefunctions determined bydiagonalizing the Watson Hamiltonian [26] in a symmetric top basis for the vibrational statesinvolved in the transition. For the ground state the Watson constants of Matsushima et al. [27]were used. For the n1+n3 band Watson constants were not available so the Watson constantsderived by Flaud and Camy-Peyret [28] for the n3 band were used so that the wavefunctions wouldhave proper symmetry properties. The rotational constant for N2 is 2.0069 cm
�1 that for O2 is1.4377 cm�1 [29].Many of the molecular parameters for the H2O–N2 or H2O–O2 systems are well known and the
present calculations use the best available values from the literature. The dipole and quadrupolemoments of water vapor are taken from Refs. [30,31], respectively. The quadrupole moment ofnitrogen is from Mulder et al. [32] that for oxygen is from Stogryn and Stogryn [33]. Thenumerical values are listed in Table 6. The ionization potential of water is taken to be avibrationally independent value of 12.6 eV [34]. For nitrogen the polarizability, 17.4� 10�25 cm3,is taken from Ref. [35] and the ionization potential, 15.576 eV, from Ref. [36]. For oxygen thepolarizability, 15.80� 10�25 cm3, is taken from Ref. [35] and the ionization potential,12.063(70.001) eV, from Ref. [34]. In the parabolic approximation, the isotropic part of theinteraction potential is taken into account in determining the distance, effective velocity, and forceat closest approach [15]. To simplify the trajectory calculations, the isotropic part of the atom-atom expansion is fit to an isotropic Lennard–Jones 6–12.The atom–atom parameters for nitrogen-broadening of water vapor have been adjusted as
described in Ref. [37]. There are not enough data for oxygen-broadening of water vapor to makesimilar adjustments of the potential. The final adjustment of the potential parameters was madeby comparing calculated line shifts to measurement. For transitions involving changes in anumber of quanta in n1 and n3 the calculations made using the coefficients in Eq. (4) givesufficiently good agreement with the measurements (see results there after and Ref [17]).Comparing calculations for the n2 band with the measurements of Toth [38] indicated the ab initiovalue of 0.03 in Eq. (4) should be changed to 0.07. Note, a non-linear least-squares optimizationof the potential parameters is currently being done.In the present calculations, the line shape parameters have been calculated without performing
the averaging over the Boltzmann distribution of velocities. Only the mean thermal value v wasused as has been done in most previous calculations, i.e. the mrtv approximation. This reason isthat for halfwidths of H2O at �300K the mrtv calculation and the velocity averaged calculationgive results within a few percent of one another [39].
Table 6
Values of electrostatic moments for the water vapor, N2, O2
Molecule Multipole moment Reference
H2O g ¼ 1.8549� 10�18 esu [29]
Qxx ¼ �0.13� 10�26 esu [31]
Qyy ¼ �2.5� 10�26 esu [31]
Qzz ¼ 2.63� 10�26 esu [31]
N2 Qzz ¼ �1.4� 10�26 esu [32]
O2 Qzz ¼ �0.4� 10�26 esu [33]

ARTICLE IN PRESS
Table 7
Broadening coefficients of H2O by N2, O2 and air: experimental measurements and comparison with calculations. g(air)is calculated from g(N2)� 0.79+g(O2)� 0.21
Line number Experimental and calculated broadening coefficients g (cm�1 atm�1) and differences (%)
g (N2) exp. g (N2) calc. Diff. (%) g (O2) exp. g (O2) calc. Diff. (%) g (air) exp. g (air) calc. Diff. (%)
1 0.0456 0.0426 6.6 0.0271 0.0231 14.8 0.0417 0.0385 7.7
2 0.1076 0.1102 �2.4 0.0620 0.0551 11.1 0.0980 0.0986 �0.6
3 0.1138 0.1138 0.0 0.0644 0.0576 10.6 0.1034 0.1020 1.4
4 0.1130 0.1103 2.4 0.0664 0.0561 15.5 0.1032 0.0989 4.2
G. Durry et al. / Journal of Quantitative Spectroscopy & Radiative Transfer ] (]]]]) ]]]–]]] 11
The calculations were made at 296K for the H2O–N2 and H2O–O2 systems for four rotationaltransitions the n1+n3 band. A clarification is necessary here. Since the line shape parameters,especially the line shift, depend on the vibrational state it is necessary to evaluate the S1 term forthe correct vibrational states. However as described above wavefunctions for the upper state usedthe Watson constants of n3 band. This affects the S2 term but is generally small. The experimentaland calculated broadening coefficients of the 4 lines of H2O by N2, O2 and air are presented inTable 7. There is a very good agreement between experimental results (uncertainty approximately2–3%) and calculations (uncertainty approximately 5 %) for g(N2). This work demonstrates thevery good quality of the calculations based on the RB formalism. For H2O–O2 mixtures theresults are not as good but this is due to not being able to adjust the potential for the H2O–O2case. Finally the trend for the H2O–Air mixture is the same as the trend for the H2O–N2 mixturebecause of the weaker influence of g(O2) in the calculation g(N2)� 0.79+g(O2)� 0.21. We obtainvery good agreement between experimental values and calculated ones. All these parameters areused in the retrieval of the in situ measurements of H2O in the atmosphere.
4. Atmospheric measurements
Fig. 4 shows an in situ vertical concentration profile yielded by the SDLA balloonbornespectrometer in the upper troposphere and lower stratosphere in 2001 for the validation of thesatellite ODIN. The instrument was flown from the CNES balloon launching facility in Aire surAdour, in southern France (431N). More details upon the balloon operations are found in [40].The profile is made of a few thousands of in situ measurements obtained at 1s-intervalles duringascent/descent of the gondola in the middle atmosphere. Each concentration value is obtained byapplying to the in situ spectrum, a non-linear least-squares fit to the full molecular line shape inconjunction with the atmospheric P and T measurements. The laser sweeps different H2Otransitions during the flight to compensate for the decrease with altitude in the H2O content asreported in Fig. 4.In the dehydrated lower stratosphere, we have selected the strong n1+n3, (20 2)’(30 3)
transition at 7181.15 cm�1 with a line strength of �10�20 cm�1mol�1 cm2. At lower altitude, then1+n3, (21 2)’(31 3) and (66 0)’(66 1) transitions at 7182.9 and 7185.5 cm
�1 were chosen thatfeature weaker line strengths of �10�21 and �10�22 cm�1molecule�1 cm2. The selection of the

ARTICLE IN PRESS
Fig. 4. A vertical in situ concentration profile of H2O yielded by the balloonborne laser diode spectrometer SDLA in
southern France on 16 October 2001. The H2O data yielded 1 week later by the ELHYSA balloonborne frost-point
hygrometer as well as the REPROBUS model predictions for the day of the flight are added on the figure. The
calculation of the SDLA data was made using the HITRAN molecular parameters and the revisited molecular data set
reported in this paper.
G. Durry et al. / Journal of Quantitative Spectroscopy & Radiative Transfer ] (]]]]) ]]]–]]]12
H2O line swept over by the laser was made by observing in real-time the in situ spectra during theflight and by changing the laser operating temperature accordingly [40]. The altitude\pressurerange is displayed in Fig. 4, for each selected H2O transition. The in situ H2O measurementsyielded in the lower stratosphere by the ELHYSA balloonborne frost-point hygrometer at thesame period of time as well as the predicted H2O concentration values from the REPROBUSmodel are further displayed in Fig. 4. The ELHYSA frost-point hygrometer was developed 20years ago at the Laboratoire de Meteorologie Dynamique in France: for 20 years, it has beenoperated from aircrafts or balloons for H2O science purposes or for satellites validation [41,42].The ELHYSA sensor is a reference with regards to the in situ monitoring of stratospheric H2Oand its data are reported in Fig. 4 to better stress up the dramatic improvement achieved byprocessing the SDLA measurements with the revisited molecular parameters. REPROBUS is athree-dimensional chemical-transport model driven by the 6-h ECMWF analysis [43]. The modelprofile plotted in Fig. 4 is obtained after about 1 year of simulation, and was extracted in spatialand temporal coincidence with the balloon flight. Note that below the tropopause the H2O mixingratio in REPROBUS is forced by the ECMWF analysis of specific humidity. Using the revisitedmolecular parameters, a much better agreement is further observed in the tropopause between thein situ H2O data yielded by the SDLA and the REPROBUS predictions.In Fig. 4, the calculations were made with both the HITRAN database and the revisited
molecular data. In the stratosphere, we observed a much better agreement with ELHYSAmeasurements and REPROBUS predictions by using the new molecular parameters. Thediscrepancy of ~25% between both concentration profiles is directly related to the difference of

ARTICLE IN PRESS
G. Durry et al. / Journal of Quantitative Spectroscopy & Radiative Transfer ] (]]]]) ]]]–]]] 13
25% between HITRAN and this work line strengths for the n1+n3, (20 2)’(30 3) transition(Table 2).Fig. 5 in an expanded view on the tropospheric measurements in Fig. 4. The tropospheric water
vapor data yielded by a balloonborne P, T-humidity meteorological sonde launched at the sametime period is also displayed to show the agreement between the large spatial structures observedin the various profiles; nevertheless, the sonde measurements can not be used for more accuratecomparisons because of the variability in the H2O content in this region of the atmosphere. Thedifference of �40% and +10% between HITRAN and this work in the determination of the linestrength for the n1+n3, (21 2)’(31 3) and (66 0)’(66 1) transitions still propagate in the verticalprofiles. Around 8 km, the laser emission wavelength was changed from 7182.9 ((21 2)’(31 3)) to7185.5 cm�1 ((66 0)’(66 1)): in the resulting vertical profile, we observe a much better overlappingbetween both altitude region using the new molecular parameters. It is a good insight for theoverall coherency of the molecular data set.Furthermore, for the (66 0)’(66 1) transition at 7185.5 cm
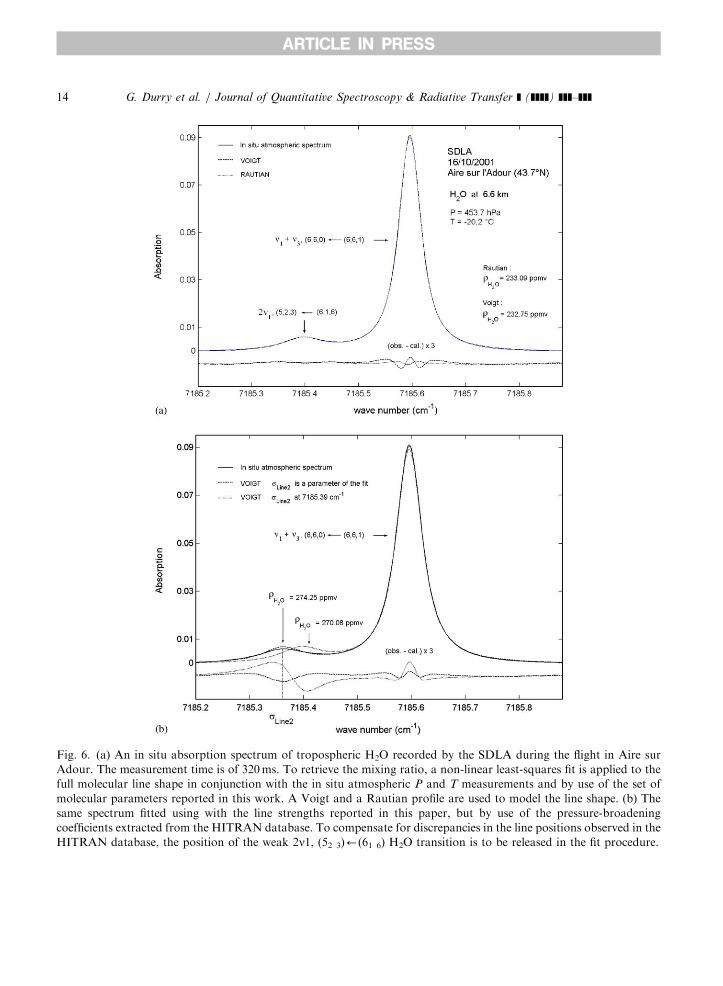
�1, in addition to the 10% differencebetween both line strengths, a large discrepancy of 20% in the pressure-broadening coefficientswas assessed between our measurement and the HITRAN database. To find out how the errorpropagates, a vertical concentration profile was calculated by combining our intensities and thepressure-effect coefficients extracted from the HITRAN database. The achieved profile isdisplayed in Fig. 5.Figs. 6(a) and (b) display an elementary atmospheric H2O spectrum recorded at 6.6 km by
scanning of the (66 0)’(66 1) transition. In Fig. 6(a), the spectrum is fitted using our moleculardata. Furthermore, in the corresponding atmospheric pressure range, one could suspect a
Fig. 5. An expanded view on the H2O data in Fig. 4 obtained in the lower layers of the atmosphere. The humidity
measurements recorded by a balloonborne meteorological sonde launched 1 h after the SDLA are also displayed. See
text for more details.
ARTICLE IN PRESS
Fig. 6. (a) An in situ absorption spectrum of tropospheric H2O recorded by the SDLA during the flight in Aire sur
Adour. The measurement time is of 320ms. To retrieve the mixing ratio, a non-linear least-squares fit is applied to the
full molecular line shape in conjunction with the in situ atmospheric P and T measurements and by use of the set of
molecular parameters reported in this work. A Voigt and a Rautian profile are used to model the line shape. (b) The
same spectrum fitted using with the line strengths reported in this paper, but by use of the pressure-broadening
coefficients extracted from the HITRAN database. To compensate for discrepancies in the line positions observed in the
HITRAN database, the position of the weak 2n1, (52 3)’(61 6) H2O transition is to be released in the fit procedure.
G. Durry et al. / Journal of Quantitative Spectroscopy & Radiative Transfer ] (]]]]) ]]]–]]]14

ARTICLE IN PRESS
G. Durry et al. / Journal of Quantitative Spectroscopy & Radiative Transfer ] (]]]]) ]]]–]]] 15
contribution of Dicke narrowing effect to the line width; therefore, the spectrum was fittedsuccessively using a Voigt and a Rautian profile. When fitting with a Rautian profile, thevalue of the pressure-broadening coefficient was slightly increased to 0.0427 cm�1 atm�1 inagreement with the theory and the diffusion coefficient is taken to 0.025 cm�1 atm�1 [6,11]. Thefit is better using a Rautian model in terms of observed minus calculated values, as shown inFig. 6(a). Nevertheless, in term of retrieved concentration, the difference (less than 0.001%) isnot significant, given the overall measurement error. Basically, the concentration is given bythe surface under the line shape which is only slightly modified here while fitting with aRautian instead of a Voigt profile. The calculation with a Rautian model was kept further for thecomplete altitude range and the conclusion is the same, i.e. in terms of concentration, its effect isnegligible.In Fig. 6(b), we show the result of a fit combining our intensities and the pressure-broadening
coefficients extracted from HITRAN. Using the HITRAN database, a severe line positiondiscrepancy is observed while fitting the 2n1, (52 3)’(61 6) transition that neighbors the n1+n3, (212)’(31 3) line. In a second turn, the fit was processed also by releasing the position of thattransition to improve the quality of the fit. Nevertheless, the agreement is better using ourmolecular data regarding this weak transition (compare Fig. 6(a) and (b) near 7185.35 cm�1). Theresulting concentration values in cases (a) and (b) differ by approximately +15%: hence, the erroron the broadening coefficients propagate further in the overall error adding a �15% contributionto the �10% error due to the inaccuracy in the line strengths.
5. Conclusion
In this paper, a complete set of molecular parameters, intensities and pressure-broadeningcoefficients, was determined theoretically and experimentally near 1.39mm for several H2Otransitions of interest for the in situ laser sensing of the middle atmosphere. The achieved ab initioand laboratory measurements were thoroughly compared to previous determinations and existingmolecular databases. A dramatic improvement in the accuracy of the line strengths and pressurecoefficients was achieved for the selected molecular transition of the order of ten percent, with adirect impact on the quality of H2O concentration values yielded by our balloon borne laserhygrometer in the lower stratosphere and upper troposphere.
Acknowledgments
This laboratory work was supported by the Programme National de Chimie Atmospheriqueof the Institut National des Sciences de l’Univers (INSU) of the Centre National de laRecherche Scientifique (CNRS – France). One of the authors (RRG) is pleased to ac-knowledge support of this research by the National Science Foundation through Grant No.ATM-0242537. Any opinions, findings, and conclusions or recommendations expressed in thismaterial are those of the author(s) and do not necessarily reflect the views of the National ScienceFoundation.

ARTICLE IN PRESS
G. Durry et al. / Journal of Quantitative Spectroscopy & Radiative Transfer ] (]]]]) ]]]–]]]16
References
[1] Durry G, Megie G. Atmospheric CH4 and H2O monitoring with near-infrared InGaAs laser diodes by the SDLA,
a balloonborne spectrometer for tropospheric and stratospheric in situ measurements. Appl Opt 1999;38:7342–54.
[2] Durry G, Megie G. In situ measurements of H2O from a stratospheric balloon by diode laser direct-differential
absorption spectroscopy at 1.39mm. Appl Opt 2000;39:5601–8.[3] Parvitte B, Zeninari V, Pouchet I, Durry G. Diode laser spectroscopy of H2O in the 7165–7185 cm
�1 range for
atmospheric application. JQSRT 2002;75:493–507.
[4] Rothman LS, Barbe A, Chris Benner D, Brown LR, Camy-Peyret C, Carleer MR, Chance K, Clerbaux C, Dana
V, Devi VM, Fayt A, Flaud J- M, Gamache RR, Goldman A, Jacquemart D, Jucks KW, Lafferty WJ, Mandin
J- Y, Massie ST, Nemtchinov V, Newnham DA, Perrin A, Rinsland CP, Schroeder J, Smith KM, Smith MAH,
Tang K, Toth RA, Vander Auwera J, Varanasi P, Yoshino K. The HITRAN molecular spectroscopic database:
edition of 2000 including updates through 2001. JQSRT 2003;82:5–44.
[5] Toth RA. Extensive measurements of H2O line frequencies and strengths: 5750 to 7965 cm�1. Appl Opt
1994;33:4851–67.
[6] Lepere M, Henry A, Valentin A, Camy-Peyret C. Diode laser spectroscopy: Line profiles of H2O in the region of
1.39mm. J Mol Spectrosc 2001;208:25–31.[7] Camy-Peyret C, Flaud JM, Maillard JP, Guelachvili G. Higher ro-vibrational levels of H2O deduced from high
resolution oxygen-hydrogen flame spectra between 6200 and 9100 cm�1. Mol Phys 1977;33:1641.
[8] Courtois D, Delahaigue A, Thiebeaux C, Le Corre H, Mouanda J- C. Adjustable-temperature and multiple-path
optical cell for ozone spectroscopy. J Phys E: Sci Instrum 1988;21:863–5.
[9] Humlicek J. Optimized computation of the Voigt and complex probability functions. JQSRT 1982;27:437–44.
[10] Rautian SG, Sobel’man IC. Sov. Phys Usp 1967;9:701–16.
[11] Moretti L, Sasso A, Gianfrani L, Ciurylo R. Collisional-broadened and Dicke-narrowed lineshapes of H216O and
H218O transitions at 1.39 mm. J Mol Spectrosc 2001;205:20–7.
[12] Partridge H, Schwenke DW. The determination of an accurate isotope dependent potential energy surface for
water from extensive ab initio calculations and experimental data. J Chem Phys 1997;106:4618–35.
[13] Delaye C, Hartmann J- M, Taine J. Calculated tabulations of H2O line broadening by H2O, N2, O2, and CO2 at
high temperature. Appl Opt 1989;28:5080–7.
[14] Nagali V, Chou SI, Baer DS, Hanson RK. Diode laser measurements of temperature-dependent half-widths of
H2O transitions in the 1.4 mm. JQSRT 1997;57:795–809.[15] Robert D, Bonamy J. Short range force effects in semiclassical molecular line broadening calculations. J Phys
1979;40:923–43.
[16] Gamache RR, Lynch R, Neshyba SP. New developments in the theory of pressure-broadening and pressure-
shifting of spectral lines of H2O: the complex Robert–Bonamy formalism. JQSRT 1998;59:319–35.
[17] Lynch R, Gamache RR, Neshyba SP. N2 and O2 induced halfwidths and line shifts of water vapor transitions in
the (301)’(000) and (221)’(000) bands. JQSRT 1998;59:595–613.[18] Lynch R. Ph.D. dissertation, Physics Department, University of Massachusetts Lowell, June 1995.
[19] Baranger M. General impact theory of pressure broadening. Phys Rev 1958;112:855–65.
[20] Ben-Reuven A. Spectral line shapes in gases in the binary-collision approximation. In: Prigogine I, Rice SA,
editors. Advances in chemical physics, vol. 20. New York: Academic Press; 1975. p. 235.
[21] Neshyba SP, Gamache RR. Improved line broadening coefficients for asymmetric rotor molecules: application to
ozone perturbed by nitrogen. JQSRT 1993;50:443–53.
[22] Lennard-Jones JE. On the determination of molecular fields-II: From the equation of state of a gas. Proc Roy Soc
1924;A106:463–77.
[23] Hirschfelder JO, Curtiss CF, Bird RB. Molecular theory of gases and liquids. New York: Wiley; 1964.
[24] Good RJ, Hope CJ. Test of combining rules for intermolecular distances, potential function constants from second
virial coefficients. J Chem Phys 1971;55:111–6.
[25] Sack RA. Two-center expansion for the powers of the distance between two points. J Math Phys 1964;5:260–8.
[26] Watson JKG. Determination of centrifugal distortion coefficients of asymmetric-top molecules. J Chem Phys
1967;46:1935–49.

ARTICLE IN PRESS
G. Durry et al. / Journal of Quantitative Spectroscopy & Radiative Transfer ] (]]]]) ]]]–]]] 17
[27] Matsushima F, Odashima H, Iwaskai T, Tsunekawa S. Frequency measurement of pure rotational transitions of
H2O from 0.5 to 5THz. J Mol Struct 1995;352–353:371–8.
[28] Flaud JM, Camy-Peyret C. Watson Hamiltonian constants for the first vibrational levels of H2O. Private
communication, 1997.
[29] Huber KP, Herzberg G. Molecular spectra and molecular structure constants of diatomic molecules. New York:
Van Nostrand; 1979.
[30] Shostak SL, Muenter JS. The dipole moment of water. II. Analysis of the vibrational dependence of the dipole
moment in terms of a dipole moment function. J Chem Phys 1991;94:5883–90.
[31] Flygare WH, Benson RC. Molecular Zeeman effect in diamagnetic molecules and the determination of molecular
magnetic moments (g values), magnetic susceptibilities, and molecular quadrupole moments. Mol Phys
1971;20:225–50.
[32] Mulder F, Van Dijk G, Van der Avoird A. Multipole moments, polarizabilities, and anisotropic long range
interaction coefficients for nitrogen. Mol Phys 1980;39:407–25.
[33] Stogryn DE, Stogryn AP. Mol Phys 1966;11:371–93.
[34] Lide DR, editor. CRC handbook of physics and chemistry, 77th ed. Clevland, OH: The Chemical Rubber
Company; 1996.
[35] Bogaard MP, Orr BJ. MPT international review of science, physical chemistry. In: Buckingham AD, editor.
Molecular structure and properties, vol. 2. London: Butterworths; 1975 Chapter 5.
[36] Lofthus A. The molecular spectrum of nitrogen. Department of Physics, University of Oslo, Blindern, Norway,
Spectroscopic Report No. 2, 1960.
[37] Gamache RR, Hartmann JM. Collisional parameters of H2O lines: effects of vibration. JQSRT 2004;83:119–47.
[38] Toth RA. Air- and N2-broadening parameters of water vapor: 604 to 2271 cm�1. J Mol Spectrosc 2000;201:218–43.
[39] Gamache RR, Rosenmann L. The effects of velocity averaging in broadening coefficient calculations. J Mol
Spectrosc 1994;164:489–99.
[40] Durry G, Pouchet I. A near-infrared diode laser spectrometer for the in situ measurements of CH4 and H2O from
stratospheric balloons. J Atmos Ocean Technol 2001;18:1485–94.
[41] Ovarlez J. Stratospheric water vapor measurement in the tropical zone by means of a frost-point hygrometer on
board long-duration balloons. J Geophys Res 1991;96:15541–5.
[42] Ovarlez J, Ovarlez H. Stratospheric water vapor content evolution during EASOE. Geophys Res Lett
1994;21:1235–8.
[43] Lefevre F, Figarol F, Carslaw KS, Peter T. The 1997 Arctic ozone depletion quantified from three-dimensional
model simulations. Geophys Res Lett 1998;25:2425–8.


![transitions Robert R. Gamache University of Massachusetts ...faculty.uml.edu/Robert_Gamache/Software/temp/Predicting...Gamache and Hartmann [30] looked at conditions where one of the](https://static.fdocuments.us/doc/165x107/60e765b2e6426147ad2f6b80/transitions-robert-r-gamache-university-of-massachusetts-gamache-and-hartmann.jpg)