2013 Great Downtown - Downtown Westfield (Westfield Town, Union County)

i
Paris, Amsterdam, July 28, 2021
Press release
UNIBAIL-RODAMCO-WESTFIELD REPORTS H1-2021 EARNINGS
First half results reflect significant COVID-19 related disruption – continued resilience in tough operating
conditions
All centres now open and trading - encouraging recovery in footfall and sales data when restrictions ease
Flagship strategy endorsed by successful opening of Westfield Mall of the Netherlands and delivery of last
phase of La Part-Dieu and La Maquinista extensions
Good progress on comprehensive deleveraging plan – agreed or completed €1.7 Bn in European disposals;
US portfolio streamlining underway
H1-2021 in review:
• Continued COVID-related disruption, with the Group’s centres “closed” for 68 days on average (vs. 67
days in H1-2020), despite no closures in the US1
• Progressive reopening of European centres during April and May, with June footfall reaching 76% of
2019 levels and June tenant sales at 86% of 2019 levels in Europe, and reaching 100% in the US
• Rent collection at 89% of rent due, exceeding H1-2020 despite lower collection in France due to
pending decision on government support
• Improvement in letting activity, with 1,218 deals signed, +84% vs. H1-2020 and +3% vs. H1-2019
• Pragmatic approach to lease terms to navigate short term challenges and protect long term value,
with 56% of H1-2021 deals being leases between 12 and 36 months
• Overall vacancy stabilised in Q2 at 8.9% (vs. 8.3% at FY-20 and 8.8% at Q1-2021); vacancy down in
Continental Europe from 5.4% at Q1-2021 to 5.0% at H1-2021; UK down from 12.6% to 12.2%
• Successful opening of Westfield Mall of the Netherlands in March 2021: 94% let with around 1 million
visits in both May and June
• Further progress on European disposals with €1.7 Bn now agreed or completed out of the €4.0 Bn to
be achieved by the end of 2022, including the agreed disposal of 7 Adenauer office building, for which
a promissory deed of sale was signed in July 2021
• €12.5 Bn of cash and available facilities on hand, securing refinancing needs for the next 36-months
• IFRS LTV at 44.4% and 43.7% pro-forma for the proceeds of the sale of 45% of Shopping City Süd
cashed-in in July and 7 Adenauer; H1-2021 proforma Net Financial Debt at €23.0 Bn (FY-20: €24.2 Bn)
• Further strengthening of governance and leadership expertise with the appointment of a Chief
Customer Officer to the Management Board to better address evolving consumer preferences and
drive future growth in advertising, data, and omnichannel retail
1 Centres counted as closed when only “essential” stores were allowed to trade. Weighted by shopping centre NRI in 2019.

ii
Commenting on the results, Jean-Marie Tritant, Chief Executive Officer said:
“URW has demonstrated continued resilience in the face of tough operating conditions, with substantial
lockdowns across our network during the period. Whenever restrictions were lifted, we have seen a recovery
in both footfall and sales, in most cases at higher levels than those seen during the reopening in 2020.
Letting activity improved, as brands continue to choose URW destinations as part of their omnichannel
approach. Our teams have worked hard to stabilize occupancy levels, adopting a pragmatic approach to lease
structure and duration that positions URW to benefit as market conditions improve.
Throughout the first half we maintained our focus on key operational and financial priorities. This includes the
successful opening of our latest flagship destination Westfield Mall of the Netherlands and marked progress in
our deleveraging efforts thanks to both European disposals and the on-going streamlining of our US portfolio.
This process is supported by favourable access to credit markets, giving us ample liquidity to cover all
refinancing needs for the next 36 months.
While positive indicators and continued progress of the vaccination rollout give us reasons to be cautiously
optimistic, the COVID-19 situation and potential government responses to it remain a source of uncertainty in
terms of outlook.
I would like to once again acknowledge the commitment and tenacity of our teams in this unique period.”
H1-2021 H1-2020 Growth
Like-for-like growth2
Net Rental Income (in € Mn) 785 1,065 -26.2% -22.4%
Shopping Centres 753 1,008 -25.3% -21.8%
Offices & Others 32 42 -23.9% -1.0%
Convention & Exhibition 0 15 -97.1% -97.1%
Recurring net result (in € Mn) 472 667 -29.3%
Recurring EPS (in €) 3.41 4.82 -29.3%
Adjusted Recurring EPS (in €) 3.24 4.65 -30.4%
June 30, 2021
Dec. 31, 2020
Growth Like-for-like
growth
Proportionate portfolio valuation (in € Mn) 54,966 56,314 -2.4% -2.3%
EPRA Net Reinstatement Value (in € per stapled share)
162.40 166.80 -2.6%
Figures may not add up due to rounding
2 Like-for-like NRI: Net Rental Income excluding acquisitions, divestments, transfers to and from pipeline (extensions, brownfields or redevelopment of an asset when operations are stopped to enable works), all other changes resulting in any change to square metres and currency exchange rate differences in the periods analysed.

iii
H1-2021 AREPS: €3.24
Reported AREPS amounted to €3.24, down -30.4% from H1-2020, a decrease of -€1.41, split as follows:
• -€1.10 due to the impact of COVID-19 on operations and financing (primarily driven by rent relief);
• -€0.30 due to disposals made in 2020 and H1-2021; and
• -€0.01 of other items.
OPERATING PERFORMANCE
Shopping Centres
During the first half year, on average, the Group’s shopping centres were closed for 68 days (vs. 67 days in H1-
2020), including 92 days in Europe (vs. 60 days in H1-2020). Most of the Group’s European centres had to close
during the period, except for “essential” retailers and centres in Sweden and parts of Spain which remained
open throughout the period (albeit with restrictions still in place that limited traffic).
Following the reopening in April and May, footfall in Europe saw an immediate increase, reaching levels equal
to or above what was seen in the initial reopening in spring 2020. With all centres open throughout June,
footfall in Europe for that month reached 76% of June 2019 levels.
Whilst all of the Group’s European centres are currently able to trade relatively normally, some restrictions
remain in place, and the Group continues to prepare for recently announced policies in key markets.
In the US, footfall is not available for all centres3, for those assets for which sufficient data is available, footfall
in the first half overall was 65% of 2019 levels, reaching 75% in June, including Westfield San Francisco Centre
which was still more heavily impacted.
While tenant sales4 were impacted by closures and restrictions during H1-2021, levels were resilient once
again in periods when the Group’s tenants were able to trade, outperforming footfall trends. In June, when all
centres were open throughout the month, tenant sales in Europe reached 86% of June 2019 levels with Central
Europe at 92%, the Nordics at 91%, France at 90%, Austria at 87%, Germany at 86% and Spain at 85%, while
the UK was at 72%.
In terms of June category performance, Jewellery (+2.1%) performed well, while Food Stores & Mass
Merchandise (-2.0%), Sport (-2.5%), Home (-3.8%) and Health & Beauty (-5.9%) came close to the 2019 levels,
whereas as expected Entertainment (-40.3%), Services (-39.0%), F&B (-21.1%) and to a lesser extent Fashion
(-16.4%) continued to lag.
3 Only includes the 20 centres for which at least one year of comparable Springboard or ShopperTrak data is available. 4 European tenant sales data does not include Zlote Tarasy as it is not managed by URW. Tenant sales performance in URW’s shopping centres (except The Netherlands) in operation, including extensions of existing assets, but excluding deliveries of new brownfield projects, newly acquired assets and assets under heavy refurbishment. Primark sales are based on estimates. Excluding Tesla sales. Carrousel du Louvre is excluded.

iv
While all of the Group’s US centres were open in the first half, tenant sales continued to be negatively
impacted in the first quarter by the on-going closure or limitation of categories such as F&B, Entertainment
and Fitness. These restrictions were generally imposed in California, New York, New Jersey, and Maryland (the
Group’s key US markets) longer than in other parts of the US. Following the reopening of these sectors during
February and March, a marked improvement has been seen with a steady increase from 69% in January to
100% in June for the whole portfolio. Notably, in the non-CBD Flagship centres5, tenant sales saw a positive
evolution from 93% of 2019 levels in March to 107% in June.
Across the portfolio, this was particularly driven by strength in the Luxury category (+45.6% in June or +42.6%
YTD). Moreover, in June, the Group also saw a positive evolution in Home (+27.1%), Jewellery (+23.3%),
Services (+23.2%) and Sports (+18.9%) in particular. For the important Fashion category, a noticeable
improvement was seen from -14.9% in March to -4.0% in June, while F&B recovered to -9.4%, both nearly at
2019 levels.
Rent collection6, as at July 22, amounted to 73% for H1-2021, including 69% in Continental Europe, 77% in the
UK and 80% in the US. Adjusted for the rent relief granted, the collection rate was 89% of the total amount
due.
Rent relief negotiations with tenants relating to the first and second waves of COVID-19 in 2020 are over 80%
signed. With the subsequent waves of COVID-related restrictions in H1-2021, the Group proceeded to apply
the same principles, providing appropriate rent relief on a fair “burden sharing” principle. In total for Europe,
the cash impact of rent relief expected for the first half closures corresponds to 1.5 months (vs. 1.6 months
for 2020 overall).
During H1-2021, the Group signed 1,218 leases, slightly above H1-2019 and +84% above H1-2020. The Group
has adopted a pragmatic approach to lease terms, with an increase in short term leases (between 12 and 36
months), representing 56% of the leases signed, to both limit vacancies while also protecting longer term
rental values. The MGR uplift for deals above 36 months came to +1.3% for the Group, with Continental Europe
at +2.2%, the UK at -1.3% and the US at +2.9%. Overall, the MGR uplift on all deals was -6.5%.
Like-for-like shopping centre NRI was down by -21.8% for the Group, and by -31.0% in Continental Europe,
while the like-for-like NRI was flat in the US. The performance reflects the €220 Mn COVID-19 rent relief signed
or expected to be signed in H1, of which €183 Mn has been charged to the income statement, and €65 Mn of
debtor provisions.
The recovery seen during H1-2021 when centres reopened, and when restrictions for F&B and entertainment
were lifted, gives the Group a high degree of confidence that its Flagship destinations will continue to be the
preferred locations for retailers and consumers as trading conditions gradually normalise.
5 I.e. excluding Westfield World Trade Center and Westfield San Francisco Centre. 6 For the Shopping Centre division, including service charges.

v
Offices & Others
Like-for-like NRI was down by -1.0%, while total NRI fell -23.9%, primarily as a result of the disposals of the
SHiFT and the Les Villages 3, 4 and 6 office buildings. The Trinity building in La Défense, which was delivered
in 2020, achieved its first key lettings with Technip and Welkin & Meraki, and is now 21% let.
Convention & Exhibition
Recurring NOI amounted to -€1.5 Mn compared to €21.1 Mn in H1-2020 and €87.6 Mn in H1-2019, as most
events were banned until mid-May. Restrictions were only lifted at the end of the half with an initial recovery
expected in Q4-2021 (with 158 in pre-bookings, o/w 86 bookings), which should gather pace in 2022 (with
already 299 pre-bookings, o/w 80 bookings).
DELEVERAGING
URW remains committed to deleveraging, through disposals, limiting CAPEX and retaining earnings.
In H1-2021, URW completed the disposal of SHiFT, which was announced in 2020, and the disposal of the Les
Villages 3, 4 and 6 office buildings. In addition, several disposals were announced during the period, including
the sale of Aupark Bratislava in a phased transaction with a headline price of €450 Mn and the sale of a 45%
stake in Shopping City Süd for a headline price of €1,065 Mn (at 100%). These transaction values represented
a price in line with and 3% below the last unaffected appraisal values, and closed in May and July 2021,
respectively.
On July 8, 2021, URW signed a promissory deed of sale and leaseback agreement for the disposal of its
headquarters, 7 Adenauer, in Paris’ 16th district. The Net Disposal Price (“NDP”) of €249 Mn reflected a
premium to the last unaffected appraisal value, and the deal is expected to close in September 2021. Several
minor disposals were also made (the Le Blériot office building in Paris, the Q-Huset office building in Täby, and
a land plot in Osnabrück) for a total NDP of €63 Mn7.
When all announced disposals have completed, URW will have achieved €1.7 Bn out of the €4.0 Bn European
disposal programme which is intended to complete by the end of 2022. In parallel, a taskforce has been put
in place, and several options are under consideration to deliver a radical reduction of the Group’s exposure to
the US.
In addition to the European disposals, during H1-2021 URW voluntarily foreclosed on four US Regional centres
(Westfield Citrus Park, Westfield Countryside, Westfield Sarasota and Westfield Broward). This resulted in the
derecognition of US$411 Mn of non-recourse debt from URW’s balance sheet and a positive net capital gain
of €75 Mn.
7 Group share

vi
The Total Investment Cost (TIC)8 of URW’s development pipeline has reduced to €3.8 Bn, down from €4.4 Bn
as at December 31, 2020, as a result of deliveries, with no major new projects added to the pipeline.
Committed projects amount to €2.3 Bn, of which €1.3 Bn are already invested, leaving only €1.0 Bn left to be
spent. The Group does not intend to start any large scale controlled projects until it has achieved its
deleveraging objectives, or only after forming a capital partnership to reduce capital allocation and generate
development and management fees.
DELIVERIES
In H1-2021, the Group delivered the Westfield Mall of the Netherlands project and the Fashion Pavilion at La
Maquinista (Barcelona), in addition to two department store conversion projects at Westfield Annapolis
(Maryland) and Westfield Garden State Plaza (New Jersey). The average letting9 of these deliveries stands at
88%. The Group also opened the last phase of the La Part-Dieu project (Lyon).
In H2-2021, URW plans to deliver the hotel component of the Gaîté Montparnasse (Paris) mixed use project,
which will be operated by Accor under the Pullman brand.
VALUATION
The proportionate Gross Market Value (GMV) of the Group’s assets as at June 30, decreased by -2.4% to
€55.0 Bn from December 31, 2020, mainly as a result of disposals (-€1.4 Bn) and a like-for-like portfolio
revaluation of -€1.1 Bn (-2.3%), partly offset by CAPEX and positive FX moves.
The EPRA Net Reinstatement Value per share came to €162.40 as at June 30, 2021, down -€4.40
(-2.6%) compared to December 31, 2020, mainly driven by the revaluation of investment properties, offset by
the retained recurring results, revaluation of operating asset (7 Adenauer) and positive FX moves.
FINANCING
The Group’s average cost of debt increased from 1.7% to 1.9%, representing a blended 1.4% for EUR10 debt
and 3.9% for USD and GBP debt. The net financial debt came down from €24.2 Bn to €23.5 Bn between
December 31, 2020, and June 30, 2021. Pro forma for the disposals already agreed but not closed at June 30,
it will reach €23.0 Bn. The Loan-to-Value (LTV) ratio slightly decreased from 44.7% to 44.4%, and 43.7% pro-
forma for the disposal of 45% of Shopping City Süd (Vienna) and 7 Adenauer (Paris).
8 URW Total Investment Cost (TIC) equals 100% TIC multiplied by URW's percentage stake in the project, adjusted by specific own costs and income, if any. 100% TIC is expressed in value at completion. It equals the sum of: (i) all capital expenditures from the start of the project to the completion date and includes: land costs, construction costs, study costs, design costs, technical fees, tenant fitting-out costs paid for by the Group, letting fees and related costs, eviction costs and vacancy costs for renovations or redevelopments of standing assets; and (ii) opening marketing expenses. It excludes: (i) step rents and rent-free periods; (ii) capitalized financial interests; (iii) overhead costs; (iv) early or lost Net Rental Income; and (v) IFRS adjustments. 9 GLA signed, all agreed to be signed and financials agreed. 10 Including SEK.

vii
The Group’s average debt maturity came to 8.7 years. The Interest Coverage Ratio (ICR) was 2.9x. The Funds
from Operations to Net Financial Debt (FFO / NFD) ratio stood at 4.3%. The Group complied with the covenants
on its corporate debt despite the extraordinary operating activities in H1-2021, leading to a -25% decrease in
EBITDA mainly related to rent relief granted.
URW had access to credit markets at favourable conditions, as illustrated by the €1,250 Mn of bonds issued in
May 2021, with a weighted average maturity of 9.6 years and a weighted average coupon of 1.05%, and the
signing of an extended €3.1 Bn five-year sustainability linked revolving credit facility with a syndicate of 19
banks. With cash and available facilities of €12.5 Bn, the Group has fully secured refinancing needs for at least
36 months, which is 12 months longer than as at December 31, 2020.
2021 GUIDANCE
As expected in February 2021, the Group’s performance remains significantly impacted by the COVID-19
pandemic. Despite that, the Group has progressed on its deleveraging programme and its
operational priorities with leasing activity back to 2019 levels and the successful delivery of projects in
Europe and the US. The Group has also been able to reopen all activities albeit with some remaining
restrictions, such as limited capacities in some locations.
While the on-going roll out of successful vaccines supports operational stabilisation, the impact of COVID-19
is anticipated to continue during part of H2-2021. The development of new variants and the restrictions
contemplated to mitigate them generate additional uncertainty for URW’s activities. Given this, URW is
currently not providing any guidance for 2021.
URW is confident in the quality of its assets and the enduring strength of its business and teams. The Group,
with its newly reconfigured management team, is taking all necessary measures to address these challenges
in the best possible manner and strategically position URW for the future.
URW is pursuing the remainder of its disposal programme of €4.0 Bn of European assets over the next 18
months and has put in place a taskforce to deliver a radical reduction of the Group’s exposure to the US, to
complete the planned deleveraging process. These disposals should have a negative impact on the Group’s
results. The Group’s strong liquidity position allows it to complete these disposals over time and in an orderly
fashion.

viii
FINANCIAL SCHEDULE
The next financial events on the Group’s calendar will be: October 27, 2021: Q3-2021 trading statement
February 10, 2022: FY-2021 results
For further information, please contact:
Investor Relations Samuel Warwood +33 1 53 43 72 77 [email protected] Media Relations Nathalie Feld – Image 7 +33 6 30 47 18 37
[email protected] Cornelia Schnepf – Finelk +44 7387 108 998
About Unibail-Rodamco-Westfield Unibail-Rodamco-Westfield is the premier global developer and operator of Flagship Destinations, with a portfolio valued at €55.0 Bn as at June 30, 2021, of which 86% in retail, 7% in offices, 5% in convention & exhibition venues and 2% in services. Currently, the Group owns and operates 86 shopping centres, including 53 Flagships in the most dynamic cities in Europe and the United States. Present on two continents and in 12 countries, Unibail-Rodamco-Westfield provides a unique platform for retailers and brand events and offers an exceptional and constantly renewed experience for customers. With the support of its 2,900 professionals and an unparalleled track-record and know-how, Unibail-Rodamco-Westfield is ideally positioned to generate superior value and develop world-class projects. Unibail-Rodamco-Westfield distinguishes itself by its Better Places 2030 agenda, that sets its ambition to create better places that respect the highest environmental standards and contribute to better cities. Unibail-Rodamco-Westfield stapled shares are listed on Euronext Amsterdam and Euronext Paris (Euronext ticker: URW), with a secondary listing in Australia through Chess Depositary Interests. The Group benefits from a BBB+ rating from Standard & Poor’s and from a Baa2 rating from Moody’s. For more information, please visit www.urw.com Visit our Media Library at https://mediacentre.urw.com Follow the Group updates on Twitter @urw_group, Linkedin @Unibail-Rodamco-Westfield and Instagram @urw_group

1
APPENDIX TO THE PRESS RELEASE
July 28, 2021
CONSOLIDATED FINANCIAL STATEMENTS (IFRS):
1. Consolidated statement of comprehensive income p 3
2. EPRA and Adjusted Recurring Earnings per Share p 4
3. Consolidated statement of financial position p 5
4. Consolidated statement of cash flows p 6
FINANCIAL STATEMENTS ON A PROPORTIONATE BASIS:
1. Consolidated income statement p 8
2. Consolidated income statement by segment p 9
3. Consolidated statement of financial position p 11
MANAGEMENT DISCUSSION & ANALYSIS:
1. Business review and H1-2021 results p 13
2. Investments and divestments p 42
3. Development projects as at June 30, 2021 p 45
4. Property portfolio and Net Asset Value as at June 30, 2021 p 49
5. Financial resources p 71
6. EPRA Performance measures p 85
OTHER INFORMATION:
1. Group consolidated data p 93
2. List of H1-2021 government restrictions p 96
3. Main government support schemes p 98
4. Glossary p 99
Review procedures completed. Statutory auditors’ report issued today.
The press release and its appendix as well as the results presentation slide show can be found on Unibail-Rodamco-Westfield's
website www.urw.com

2
CONSOLIDATED FINANCIAL STATEMENTS (IFRS):
1. Consolidated statement of comprehensive income p 3
2. EPRA and Adjusted Recurring Earnings per Share p 4
3. Consolidated statement of financial position p 5
4. Consolidated statement of cash flows p 6

3
(1) The result on disposal of investment properties includes both the result on disposal of assets and the result on disposal of shares.
(2) The impact of the fair value of the ORNANE and the related financial expenses are restated from the net result of the period if it has a
dilutive impact.
(3) In case of a negative net result for the period, the diluted net result per share is equal to the net result for the period per share.
Consolidated statement of comprehensive income
(€Mn)H1-2021 H1-2020 2020
Gross rental income 834.2 1,075.2 1,897.7
Ground rents paid (17.4) (7.6) (13.7)
Service charge income 174.5 207.2 317.4
Service charge expenses (208.7) (229.1) (363.7)
Property operating expenses (160.2) (193.9) (389.4)
Operating expenses and net service charges (211.8) (223.4) (449.5)
Net rental income 622.4 851.8 1,448.2
Property development and project management revenue 90.2 178.2 251.9
Property development and project management costs (58.2) (156.4) (217.2)
Net property development and project management income 32.0 21.8 34.8
Property services and other activities revenues 72.7 97.8 179.1
Property services and other activities expenses (75.9) (94.6) (175.5)
Net property services and other activities income (3.3) 3.3 3.6
Share of the result of companies accounted for using the equity method (272.8) (730.5) (1,652.4)
Income on financial assets 12.3 12.8 24.8
Contribution of companies accounted for using the equity method (260.4) (717.7) (1,627.6)
Corporate expenses (102.3) (107.3) (207.4)
Depreciation of other tangible assets (1.0) (1.0) (2.1)
Development expenses (0.3) (0.7) (2.6)
Administrative expenses (103.6) (109.0) (212.1)
Acquisition and other costs (0.9) (21.5) (83.4)
Proceeds from disposal of investment properties 1,155.9 632.8 656.3
Carrying value of investment properties sold (1,054.7) (679.3) (742.7)
Result on disposal of investment properties (1) 101.2 (46.4) (86.3)
Valuation gains on assets 238.0 63.9 71.3
Valuation losses on assets (976.0) (2,271.4) (4,908.5)
Valuation movements on assets (738.0) (2,207.5) (4,837.2)
Impairment of goodwill - (736.4) (1,596.1)
NET OPERATING RESULT (350.7) (2,961.6) (6,956.4)
Result from non-consolidated companies 2.1 1.0 1.0
Financial income 106.0 117.1 248.1
Financial expenses (340.9) (336.9) (679.7)
Net financing costs (234.8) (219.8) (431.5)
Fair value adjustment of net share settled bonds convertible into new and/or existing
shares (ORNANE)(2.1) 13.1 1.8
Fair value adjustments of derivatives, debt and currency effect 32.9 (693.3) (570.9)
RESULT BEFORE TAX (552.5) (3,860.7) (7,955.9)
Income tax expenses 91.7 151.1 281.1
NET RESULT FOR THE PERIOD (460.8) (3,709.6) (7,674.8)
Net result for the period attributable to:
- The holders of the Stapled Shares (420.7) (3,525.9) (7,212.6)
- External non-controlling interests (40.1) (183.8) (462.2)
NET RESULT FOR THE PERIOD (460.8) (3,709.6) (7,674.8)
Net result for the period attributable to the holders of the Stapled Shares analysed by
amount attributable to:
- Unibail-Rodamco-Westfield SE members (294.4) (2,773.5) (5,791.0)
- Unibail-Rodamco-Westfield N.V. members (126.3) (752.4) (1,421.6)
NET RESULT FOR THE PERIOD ATTRIBUTABLE TO THE HOLDERS OF THE
STAPLED SHARES(420.7) (3,525.9) (7,212.6)
Average number of shares (undiluted) 138,495,491 138,401,778 138,437,274
Net result for the period (Holders of the Stapled Shares) (420.7) (3,525.9) (7,212.6)
Net result for the period per share (Holders of the Stapled Shares) (€) (3.04) (25.48) (52.10)
Net result for the period restated (Holders of the Stapled Shares) (2) (418.7) (3,538.9) (7,214.4)
Average number of shares (diluted) 140,617,006 140,664,131 140,603,298
Diluted net result per share (Holders of the Stapled Shares) (€) (3) (3.04) (25.48) (52.10)
NET COMPREHENSIVE INCOME (€Mn) H1-2021 H1-2020 2020
NET RESULT FOR THE PERIOD (460.8) (3,709.6) (7,674.8)
Foreign currency differences on translation of financial statements of subsidiaries and
net investments in these subsidiaries263.2 (113.5) (553.9)
Other comprehensive income that may be subsequently recycled to profit or loss 263.2 (113.5) (553.9)
Employee benefits - - (0.2)
Fair Value of Financial assets (2.7) (15.6) (14.9)
Other comprehensive income not subsequently recyclable to profit or loss (2.7) (15.6) (15.1)
OTHER COMPREHENSIVE INCOME 260.5 (129.1) (569.0)
NET COMPREHENSIVE INCOME (200.3) (3,838.8) (8,243.8)
- External non-controlling interests (40.1) (183.8) (462.2)
NET COMPREHENSIVE INCOME (HOLDERS OF THE STAPLED SHARES) (160.2) (3,655.0) (7,781.6)

4
Recurring Earnings per share H1-2021 H1-2020 2020
Net Result of the period attributable to the holders of the Stapled Shares (€Mn) (420.7) (3,525.9) (7,212.6)
Adjustments to calculate EPRA Recurring Earnings, exclude:
(i) Changes in value of investment properties, development properties held for investment and other interests (738.0) (2,207.5) (4,837.2)
(ii) Profits or losses on disposal of investment properties, development properties held for investment and other interests 101.2 (46.4) (86.3)
(iii) Profits or losses on sales of trading properties including impairment charges in respect of trading properties - - -
(iv) Tax on profits or losses on disposals 0.0 0.0 0.0
(v) Impairment of goodwill - (736.4) (1,596.1)
(vi) Changes in fair value of financial instruments and associated close-out costs 30.8 (680.3) (569.1)
(vii) Acquisition and other costs on share deals and non-controlling joint venture interests (0.9) (21.5) (83.4)
(viii) Deferred tax in respect of EPRA adjustments 78.7 167.5 301.0
(ix) Adjustments (i) to (viii) above in respect of joint ventures (unless already included under proportional consolidation) (432.5) (922.4) (1,958.9)
(x) External non-controlling interests in respect of the above 67.9 253.6 560.8
EPRA Recurring Earnings 472.0 667.5 1,056.6
Coupon on the Hybrid Securities (23.9) (24.1) (48.1)
Adjusted Recurring Earnings 448.1 643.4 1,008.5
Average number of shares and ORA 138,495,491 138,401,778 138,437,274
EPRA Recurring Earnings per Share (REPS) €3.41 €4.82 €7.63
EPRA Recurring Earnings per Share growth -29.3% -27.2% -40.0%
Adjusted Recurring Earnings per Share (AREPS) €3.24 €4.65 €7.28
Adjusted Recurring Earnings per Share growth -30.4% -28.0% -41.1%

5
Consolidated Statement of financial position
(€Mn)June 30, 2021 Dec. 31, 2020
NON CURRENT ASSETS 51,991.2 52,878.6
Investment properties 40,422.6 40,947.8
Investment properties at fair value 39,054.7 39,623.6
Investment properties at cost 1,367.9 1,324.1
Shares and investments in companies accounted for using the equity method 8,404.2 8,370.3
Other tangible assets 128.9 279.2
Goodwill 1,225.1 1,248.1
Intangible assets 871.8 876.3
Investments in financial assets 311.0 303.6
Deferred tax assets 26.9 26.5
Derivatives at fair value 600.7 826.8
CURRENT ASSETS 4,397.7 4,399.2
Properties or shares held for sale 454.9 1,038.2
Inventories 25.1 32.0
Trade receivables from activity 636.1 539.4
Tax receivables 195.7 213.2
Other receivables 390.5 438.9
Cash and cash equivalents 2,695.4 2,137.6
TOTAL ASSETS 56,388.9 57,277.8
Equity attributable to the holders of the Stapled Shares 17,222.8 17,393.5
Share capital 693.0 692.4
Additional paid-in capital 13,483.6 13,480.7
Consolidated reserves 3,751.5 10,980.8
Hedging and foreign currency translation reserves (284.6) (547.8)
Consolidated result (420.7) (7,212.6)
- Equity attributable to Unibail-Rodamco-Westfield SE members 17,276.1 17,375.3
- Equity attributable to Unibail-Rodamco-Westfield N.V. members (53.3) 18.2
Hybrid securities 1,988.5 1,988.5
External non-controlling interests 3,313.8 3,413.0
TOTAL SHAREHOLDERS' EQUITY 22,525.1 22,795.0
NON CURRENT LIABILITIES 29,185.3 29,655.4
Non-current commitment to external non-controlling interests 98.5 94.5
Net share settled bonds convertible into new and/or existing shares (ORNANE) - 497.7
Non-current bonds and borrowings 24,688.3 24,310.5
Non-current lease liabilities 932.8 796.6
Derivatives at fair value 1,206.7 1,502.3
Deferred tax liabilities 1,860.0 2,007.8
Non-current provisions 62.5 74.6
Guarantee deposits 205.2 206.2
Amounts due on investments 98.8 102.2
Other non-current liabilities 32.5 63.0
CURRENT LIABILITIES 4,678.5 4,827.4
Liabilities directly associated with properties or shares classified as held for sale - 203.5
Current commitment to external non-controlling interests 3.3 6.1
Amounts due to suppliers and other creditors 1,096.7 1,185.3
Amounts due to suppliers 176.9 211.8
Amounts due on investments 386.7 479.9
Sundry creditors 533.1 493.6
Other current liabilities 739.7 681.0
Net share settled bonds convertible into new and/or existing shares (ORNANE) 602.4 102.6
Current borrowings and amounts due to credit institutions 2,140.6 2,584.1
Current lease liabilities 61.3 32.2
Current provisions 34.5 32.7
TOTAL LIABILITIES AND EQUITY 56,388.9 57,277.8

6
(1) Includes straightlining of key money and lease incentives.
(2) Includes capital gain/losses on property sales, disposals of short-term investments and disposals of operating assets.
Consolidated statement of cash flows
(€Mn)H1-2021 H1-2020 2020
OPERATING ACTIVITIES
Net result (460.8) (3,709.6) (7,674.8)
Depreciation & provisions (1)
16.5 46.5 73.0
Impairment of goodwill - 736.4 1,596.1
Changes in value of property assets 738.0 2,207.5 4,837.2
Changes in value of financial instruments (30.8) 680.3 569.1
Charges and income relating to stock options and similar items 8.3 9.0 12.8
Net capital gains/losses on disposal of investment properties (2) (101.2) 46.4 86.3
Share of the result of companies accounted for using the equity method 272.8 730.5 1,652.4
Income on financial assets (12.3) (12.8) (24.8)
Dividend income from non-consolidated companies (2.2) (1.0) (1.0)
Net financing costs 234.8 219.8 431.5
Income tax charge (income) (91.7) (151.1) (281.1)
Cash flow before net financing costs and tax 571.4 801.9 1,276.9
Income on financial assets 12.3 12.8 24.8
Dividend income and result from companies accounted for using the equity method or non consolidated 144.1 57.3 138.5
Income tax paid (4.4) (14.8) (18.2)
Change in working capital requirement 28.3 (228.2) 1.1
TOTAL CASH FLOW FROM OPERATING ACTIVITIES 751.7 629.0 1,423.1
INVESTMENT ACTIVITIES
Property activities 438.5 697.8 65.8
Acquisition of businesses, net of cash acquired (28.0) (38.6) (70.1)
Amounts paid for works and acquisition of property assets (518.4) (607.5) (1,164.3)
Repayment of property financing 3.7 18.4 19.6
Increase of property financing (131.2) (170.3) (239.4)
Disposal of shares 294.6 1,036.8 1,026.7
Disposal of investment properties 817.8 459.0 493.3
Financial activities 0.9 1.8 16.0
Acquisition of financial assets (1.8) (6.3) (10.1)
Repayment of financial assets 2.8 0.6 18.4
Change in financial assets (0.1) 7.5 7.7
TOTAL CASH FLOW FROM INVESTMENT ACTIVITIES 439.4 699.6 81.8
FINANCING ACTIVITIES
Capital increase of parent company 3.6 2.8 2.8
Purchase of own shares - - (0.5)
Change in capital from companies with non-controlling shareholders 1.2 3.2 4.5
Hybrid securities - (0.3) (0.3)
Distribution paid to parent company shareholders - (747.4) (747.4)
Dividends paid to non-controlling shareholders of consolidated companies (62.2) (73.9) (93.6)
Coupon on the Hybrid Securities (21.6) (21.6) (48.1)
New borrowings and financial liabilities 1,302.1 3,490.9 5,669.6
Repayment of borrowings and financial liabilities (1,591.7) (697.5) (4,082.8)
Financial income 133.3 140.7 242.7
Financial expenses (417.6) (382.4) (628.8)
Other financing activities 21.0 (113.4) (201.6)
TOTAL CASH FLOW FROM FINANCING ACTIVITIES (631.9) 1,601.1 116.5
Change in cash and cash equivalents during the period 559.2 2,929.7 1,621.4
Net cash and cash equivalents at the beginning of the year 2,127.8 486.0 486.0
Effect of exchange rate fluctuations on cash held (2.1) (13.7) 20.4
Net cash and cash equivalents at period-end 2,684.9 3,402.0 2,127.8

7
FINANCIAL STATEMENTS ON A PROPORTIONATE BASIS1:
1. Consolidated income statement p 8
2. Consolidated income statement by segment p 9
3. Consolidated statement of financial position p 11
1 The financial statements include on a proportionate basis the financial statements of the joint-controlled entities, which are accounted for
using the equity method under IFRS. Unibail-Rodamco-Westfield (“URW” or “the Group”) believes that these financial statements on a
proportionate basis give to stakeholders a better understanding of its underlying operations and the joint-controlled entities, as they
represent a significant part of the Group’s operations in the US and the UK. The Group has structured its internal operational and financial
reporting according to this proportionate format.

8
(1) The result on disposal of investment properties includes both the result on disposal of assets and the result on disposal of shares.
Note: The columns “Proportionate” reflect the impact of proportional consolidation instead of the equity method required by IFRS 11 of
the URW jointly controlled assets.
Consolidated income statement
(€Mn)
H1-2021
IFRSProportionate
Total
H1-2021
Proportionate
H1-2020
IFRS Proportionate
Total
H1-2020
Proportionate
2020
IFRS Proportionate
Total
2020
Proportionate
Gross rental income 834.2 236.5 1,070.6 1,075.2 320.7 1,395.9 1,897.7 554.1 2,451.7
Ground rents paid (17.4) (0.3) (17.6) (7.6) (0.2) (7.7) (13.7) (0.2) (14.0)
Service charge income 174.5 29.6 204.1 207.2 36.3 243.5 317.4 68.4 385.8
Service charge expenses (208.7) (38.5) (247.2) (229.1) (44.2) (273.3) (363.7) (88.5) (452.3)
Property operating expenses (160.2) (64.2) (224.4) (193.9) (99.8) (293.7) (389.4) (191.7) (581.2)
Operating expenses and net service charges (211.8) (73.4) (285.1) (223.4) (107.9) (331.3) (449.5) (212.1) (661.6)
Net rental income 622.4 163.1 785.5 851.8 212.8 1,064.6 1,448.2 342.0 1,790.2
Property development and project management revenue 90.2 - 90.2 178.2 - 178.2 251.9 - 251.9
Property development and project management costs (58.2) - (58.2) (156.4) - (156.4) (217.2) - (217.2)
Net property development and project management income 32.0 - 32.0 21.8 - 21.8 34.8 - 34.8
Property services and other activities revenues 72.7 (0.1) 72.6 97.8 (0.1) 97.7 179.1 (0.0) 179.1
Property services and other activities expenses (75.9) (0.6) (76.6) (94.6) 0.0 (94.6) (175.5) 0.1 (175.4)
Net property services and other activities income (3.3) (0.7) (4.0) 3.3 (0.1) 3.2 3.6 0.0 3.6
Share of the result of companies accounted for using the equity method (272.8) 244.2 (28.5) (730.5) 629.6 (100.9) (1,652.4) 1,456.9 (195.5)
Income on financial assets 12.3 (4.1) 8.2 12.8 (4.4) 8.4 24.8 (8.2) 16.6
Contribution of companies accounted for using the equity method (260.4) 240.1 (20.3) (717.7) 625.2 (92.5) (1,627.6) 1,448.7 (178.9)
Corporate expenses (102.3) (1.8) (104.1) (107.3) (3.8) (111.2) (207.4) (6.3) (213.7)
Depreciation of other tangible assets (1.0) - (1.0) (1.0) - (1.0) (2.1) - (2.1)
Development expenses (0.3) - (0.3) (0.7) - (0.7) (2.6) (0.0) (2.6)
Administrative expenses (103.6) (1.8) (105.4) (109.0) (3.8) (112.9) (212.1) (6.3) (218.5)
Acquisition and other costs (0.9) - (0.9) (21.5) - (21.5) (83.4) - (83.4)
Proceeds from disposal of investment properties 1,155.9 0.0 1,155.9 632.8 - 632.8 656.3 1.1 657.4
Carrying value of investment properties sold (1,054.7) (0.0) (1,054.8) (679.3) (0.1) (679.4) (742.7) (0.4) (743.1)
Result on disposal of investment properties (1) 101.2 (0.0) 101.1 (46.4) (0.1) (46.6) (86.3) 0.6 (85.7)
Valuation gains on assets 238.0 23.6 261.6 63.9 9.3 73.3 71.3 6.2 77.5
Valuation losses on assets (976.0) (400.7) (1,376.6) (2,271.4) (817.3) (3,088.7) (4,908.5) (1,721.4) (6,629.9)
Valuation movements on assets (738.0) (377.1) (1,115.1) (2,207.5) (808.0) (3,015.5) (4,837.2) (1,715.2) (6,552.4)
Impairment of goodwill - (6.1) (6.1) (736.4) - (736.4) (1,596.1) (23.9) (1,620.0)
NET OPERATING RESULT (350.7) 17.6 (333.1) (2,961.6) 26.0 (2,935.6) (6,956.4) 46.1 (6,910.3)
Result from non-consolidated companies 2.1 (0.0) 2.0 1.0 (0.0) 1.0 1.0 (0.0) 1.0
Financial income 106.0 0.2 106.3 117.1 0.4 117.5 248.1 1.1 249.3
Financial expenses (340.9) (23.0) (363.9) (336.9) (27.6) (364.5) (679.7) (56.0) (735.7)
Net financing costs (234.8) (22.8) (257.6) (219.8) (27.2) (247.0) (431.5) (54.9) (486.5)
Fair value adjustment of net share settled bonds convertible into new and/or
existing shares (ORNANE)(2.1) - (2.1) 13.1 - 13.1 1.8 - 1.8
Fair value adjustments of derivatives, debt and currency effect 32.9 (1.9) 31.0 (693.3) (2.3) (695.6) (570.9) (3.4) (574.3)
RESULT BEFORE TAX (552.5) (7.2) (559.7) (3,860.7) (3.5) (3,864.2) (7,955.9) (12.3) (7,968.2)
Income tax expenses 91.7 7.2 98.9 151.1 3.4 154.5 281.1 12.3 293.4
NET RESULT FOR THE PERIOD (460.8) 0.0 (460.8) (3,709.6) (0.0) (3,709.6) (7,674.8) 0.0 (7,674.8)
Net result for the period attributable to:
- The holders of the Stapled Shares (420.7) 0.0 (420.7) (3,525.9) (0.0) (3,525.9) (7,212.6) 0.0 (7,212.6)
- External non-controlling interests (40.1) (0.0) (40.1) (183.8) 0.0 (183.8) (462.2) (0.0) (462.2)
NET RESULT FOR THE PERIOD (460.8) 0.0 (460.8) (3,709.6) (0.0) (3,709.6) (7,674.8) 0.0 (7,674.8)

9
(1) Non-recurring activities include valuation movements, disposals, mark-to-market and termination costs of financial instruments, bond
tender premiums, impairment of goodwill or recognition of negative goodwill, amortisation of fair value of assets and liabilities recorded
for the purpose of purchase price allocation, as well as costs directly incurred during a business combination and other non-recurring items.
Recurring
activities
Non-recurring
activities (1)
ResultRecurring
activities
Non-recurring
activities (1)
ResultRecurring
activities
Non-recurring
activities (1)
Result
Gross rental income 225.7 - 225.7 340.2 - 340.2 566.5 - 566.5
Operating expenses and net service charges (48.4) - (48.4) (29.9) - (29.9) (74.8) - (74.8)
Net rental income 177.3 - 177.3 310.3 - 310.3 491.7 - 491.7
Contribution of companies accounted for using the equity method 21.8 (3.3) 18.5 3.2 (30.1) (26.9) 20.7 (72.5) (51.8)
Gains/losses on sales of properties - (9.6) (9.6) - (33.3) (33.3) - (56.9) (56.9)
Valuation movements on assets - (98.9) (98.9) - (640.4) (640.4) - (1,424.7) (1,424.7)
Impairment of goodwill - - - - - - - (0.8) (0.8)
Result from operations Shopping Centres France 199.1 (111.8) 87.3 313.5 (703.8) (390.3) 512.5 (1,554.9) (1,042.4)
Gross rental income 374.3 - 374.3 449.1 - 449.1 801.6 - 801.6
Operating expenses and net service charges (119.3) - (119.3) (172.0) - (172.0) (339.1) - (339.1)
Net rental income 255.0 - 255.0 277.1 - 277.1 462.5 - 462.5
Contribution of companies accounted for using the equity method 2.8 (15.2) (12.4) 2.2 (47.7) (45.4) (1.2) (99.4) (100.6)
Gains/losses on sales of properties - 87.5 87.5 - (12.9) (12.9) - (28.5) (28.5)
Valuation movements on assets - (372.6) (372.6) - (770.9) (770.9) - (2,046.0) (2,046.0)
Impairment of goodwill - - - - (381.4) (381.4) - (710.4) (710.4)
Result from operations Shopping Centres United States 257.8 (300.3) (42.6) 279.4 (1,212.9) (933.5) 461.3 (2,884.3) (2,423.0)
Gross rental income 78.2 - 78.2 112.3 - 112.3 203.9 - 203.9
Operating expenses and net service charges (9.3) - (9.3) (1.0) - (1.0) (12.8) - (12.8)
Net rental income 68.9 - 68.9 111.3 - 111.3 191.1 - 191.1
Contribution of companies accounted for using the equity method 9.5 (31.1) (21.6) 16.8 (34.3) (17.5) 28.9 (46.5) (17.6)
Gains/losses on sales of properties - 5.0 5.0 - 0.4 0.4 - 0.1 0.1
Valuation movements on assets - (99.8) (99.8) - (185.0) (185.0) - (270.4) (270.4)
Impairment of goodwill - - - - - - - (0.3) (0.3)
Result from operations Shopping Centres Central Europe 78.4 (125.9) (47.5) 128.1 (219.0) (90.9) 220.0 (317.1) (97.0)
Gross rental income 68.8 - 68.8 81.4 - 81.4 146.6 - 146.6
Operating expenses and net service charges (6.9) - (6.9) (8.0) - (8.0) (21.7) - (21.7)
Net rental income 61.9 - 61.9 73.4 - 73.4 124.8 - 124.8
Gains/losses on sales of properties - 0.0 0.0 - 0.1 0.1 - 2.0 2.0
Valuation movements on assets - (45.2) (45.2) - (152.9) (152.9) - (307.3) (307.3)
Impairment of goodwill - - - - (103.8) (103.8) - (103.8) (103.8)
Result from operations Shopping Centres Spain 61.9 (45.1) 16.7 73.4 (256.6) (183.2) 124.8 (409.1) (284.2)
Gross rental income 73.5 - 73.5 86.9 - 86.9 141.7 - 141.7
Operating expenses and net service charges (29.8) - (29.8) (36.8) - (36.8) (63.7) - (63.7)
Net rental income 43.7 - 43.7 50.0 - 50.0 78.0 - 78.0
Valuation movements on assets - (278.9) (278.9) - (640.3) (640.3) - (1,201.7) (1,201.7)
Impairment of goodwill - - - - - - - (320.5) (320.5)
Result from operations Shopping Centres United Kingdom 43.7 (278.9) (235.2) 50.0 (640.3) (590.3) 78.0 (1,522.2) (1,444.2)
Gross rental income 60.3 - 60.3 63.9 - 63.9 115.8 - 115.8
Operating expenses and net service charges (6.8) - (6.8) (9.1) - (9.1) (15.1) - (15.1)
Net rental income 53.5 - 53.5 54.8 - 54.8 100.8 - 100.8
Gains/losses on sales of properties - - - - (0.0) (0.0) - (0.0) (0.0)
Valuation movements on assets - (41.3) (41.3) - (118.9) (118.9) - (288.0) (288.0)
Impairment of goodwill - - - - (130.2) (130.2) - (132.2) (132.2)
Result from operations Shopping Centres Nordics 53.5 (41.3) 12.2 54.8 (249.1) (194.3) 100.8 (420.2) (319.5)
Gross rental income 42.0 - 42.0 41.6 - 41.6 97.0 - 97.0
Operating expenses and net service charges (6.8) - (6.8) (2.2) - (2.2) (10.9) - (10.9)
Net rental income 35.2 - 35.2 39.4 - 39.4 86.1 - 86.1
Valuation movements on assets - (58.8) (58.8) - (119.2) (119.2) - (237.2) (237.2)
Result from operations Shopping Centres Austria 35.2 (58.8) (23.6) 39.4 (119.2) (79.8) 86.1 (237.2) (151.0)
Gross rental income 43.9 - 43.9 75.0 - 75.0 131.6 - 131.6
Operating expenses and net service charges (12.7) - (12.7) (9.9) - (9.9) (17.5) - (17.5)
Net rental income 31.2 - 31.2 65.1 - 65.1 114.1 - 114.1
Contribution of companies accounted for using the equity method 0.2 (5.0) (4.8) 1.4 (4.0) (2.6) 1.8 (10.8) (9.0)
Gains/losses on sales of properties - (2.4) (2.4) - (0.1) (0.1) - (0.3) (0.3)
Valuation movements on assets - (136.1) (136.1) - (109.1) (109.1) - (246.4) (246.4)
Impairment of goodwill - (6.1) (6.1) - (51.0) (51.0) - (102.0) (102.0)
Result from operations Shopping Centres Germany 31.4 (149.5) (118.2) 66.4 (164.2) (97.7) 115.8 (359.5) (243.7)
Gross rental income 36.3 - 36.3 33.8 - 33.8 63.6 - 63.6
Operating expenses and net service charges (9.8) - (9.8) (7.4) - (7.4) (14.0) - (14.0)
Net rental income 26.5 - 26.5 26.4 - 26.4 49.6 - 49.6
Gains/losses on sales of properties - (0.0) (0.0) - (0.1) (0.1) - (0.4) (0.4)
Valuation movements on assets - 12.8 12.8 - (107.9) (107.9) - (168.8) (168.8)
Result from operations Shopping Centres The Netherlands 26.5 12.8 39.3 26.4 (108.0) (81.6) 49.6 (169.2) (119.6)
TOTAL RESULT FROM OPERATIONS SHOPPING CENTRES 787.5 (1,099.0) (311.5) 1,031.4 (3,673.1) (2,641.6) 1,748.9 (7,873.6) (6,124.7)
GE
RM
AN
YT
HE
NE
TH
ER
LA
ND
S
SH
OP
PIN
G C
EN
TR
ES
FR
AN
CE
UN
ITE
D S
TA
TE
S
CE
NT
RA
L
EU
RO
PE
SP
AIN
UN
ITE
D
KIN
GD
OM
NO
RD
ICS
AU
ST
RIA
Net result by segment on a proportionate basis
(€Mn)
H1-2021 H1-2020 2020

10
(1) Non-recurring activities include valuation movements, disposals, mark-to-market and termination costs of financial instruments, bond
tender premiums, impairment of goodwill or recognition of negative goodwill, amortisation of fair value of assets and liabilities recorded
for the purpose of purchase price allocation, as well as costs directly incurred during a business combination and other non-recurring items.
Recurring
activities
Non-recurring
activities (1)
ResultRecurring
activities
Non-recurring
activities (1)
ResultRecurring
activities
Non-recurring
activities (1)
Result
Gross rental income 18.2 - 18.2 31.9 - 31.9 62.0 - 62.0
Operating expenses and net service charges 0.4 - 0.4 (5.4) - (5.4) (6.0) - (6.0)
Net rental income 18.6 - 18.6 26.5 - 26.5 56.0 - 56.0
Gains/losses on sales of properties - 5.2 5.2 - (0.6) (0.6) - (0.3) (0.3)
Valuation movements on assets - 94.7 94.7 - 5.7 5.7 - 26.9 26.9
Result from operations Offices France 18.6 99.9 118.5 26.5 5.1 31.6 56.0 26.7 82.7
Gross rental income 18.8 - 18.8 20.7 - 20.7 40.6 - 40.6
Operating expenses and net service charges (5.5) - (5.5) (5.3) - (5.3) (11.1) - (11.1)
Net rental income 13.3 - 13.3 15.4 - 15.4 29.4 - 29.4
Contribution of companies accounted for using the equity method - - - 0.0 - 0.0 0.0 - 0.0
Gains/losses on sales of properties - 15.5 15.5 - - - - (1.4) (1.4)
Valuation movements on assets - 1.3 1.3 - (11.8) (11.8) - (56.6) (56.6)
Result from operations Offices other countries 13.3 16.8 30.1 15.4 (11.8) 3.5 29.4 (58.1) (28.6)
TOTAL RESULT FROM OPERATIONS OFFICES 31.9 116.7 148.6 41.9 (6.7) 35.1 85.4 (31.4) 54.1
Gross rental income 30.7 - 30.7 59.0 - 59.0 81.0 - 81.0
Operating expenses and net service charges (30.2) - (30.2) (44.2) - (44.2) (74.9) - (74.9)
Net rental income 0.4 - 0.4 14.9 - 14.9 6.1 - 6.1
On site property services net income (2.0) - (2.0) 6.2 - 6.2 6.0 - 6.0
Hotels net rental income - - - 0.0 - 0.0 - - -
Valuation movements, depreciation, capital gains (8.6) (69.5) (78.0) (8.6) (126.9) (135.5) (18.2) (272.9) (291.1)
Impairment of goodwill - - - - (3.6) (3.6) - (8.2) (8.2)
TOTAL RESULT FROM OPERATIONS C & E (10.1) (69.5) (79.6) 12.5 (130.5) (118.0) (6.1) (281.1) (287.2)
Net property development and project management income 32.0 (4.1) 27.9 21.8 (7.0) 14.8 34.8 (36.1) (1.3)
Other property services net income 6.6 (18.8) (12.3) 5.5 (30.7) (25.2) 15.8 (23.1) (7.4)
Impairment of goodwill related to the property services - - - - (66.4) (66.4) - (241.8) (241.8)
Corporate expenses (104.1) - (104.1) (111.2) - (111.2) (213.7) - (213.7)
Depreciation of other tangible assets (1.0) - (1.0) (1.0) - (1.0) (2.1) - (2.1)
Development expenses (0.3) - (0.3) (0.7) - (0.7) (2.6) - (2.6)
Acquisition and other costs - (0.9) (0.9) - (21.5) (21.5) - (83.4) (83.4)
NET OPERATING RESULT 742.4 (1,075.5) (333.1) 1,000.3 (3,935.9) (2,935.6) 1,660.4 (8,570.6) (6,910.3)
Result from non consolidated companies 2.0 - 2.0 1.0 - 1.0 1.0 - 1.0
Financing result (257.6) 28.9 (228.7) (247.0) (682.6) (929.6) (486.5) (572.5) (1,059.0)
-
RESULT BEFORE TAX 486.9 (1,046.6) (559.7) 754.3 (4,618.5) (3,864.2) 1,174.9 (9,143.1) (7,968.2)
Income tax expenses 12.9 85.9 98.9 (17.0) 171.5 154.5 (19.7) 313.1 293.4
NET RESULT FOR THE PERIOD 499.8 (960.6) (460.8) 737.3 (4,447.0) (3,709.6) 1,155.3 (8,830.0) (7,674.8)
External non-controlling interests (27.8) 67.9 40.1 (69.8) 253.6 183.8 (98.7) 560.8 462.2
472.0 (892.7) (420.7) 667.5 (4,193.4) (3,525.9) 1,056.6 (8,269.2) (7,212.6)
OF
FIC
ES
& O
TH
ER
S
FR
AN
CE
OT
HE
R
CO
UN
TR
IES
CO
NV
EN
TIO
N &
EX
HIB
ITIO
N
FR
AN
CE
NET RESULT FOR THE PERIOD ATTRIBUTABLE TO THE HOLDERS OF THE
STAPLED SHARES
H1-2021 2020H1-2020
Net result by segment on a proportionate basis (€ Mn)
11
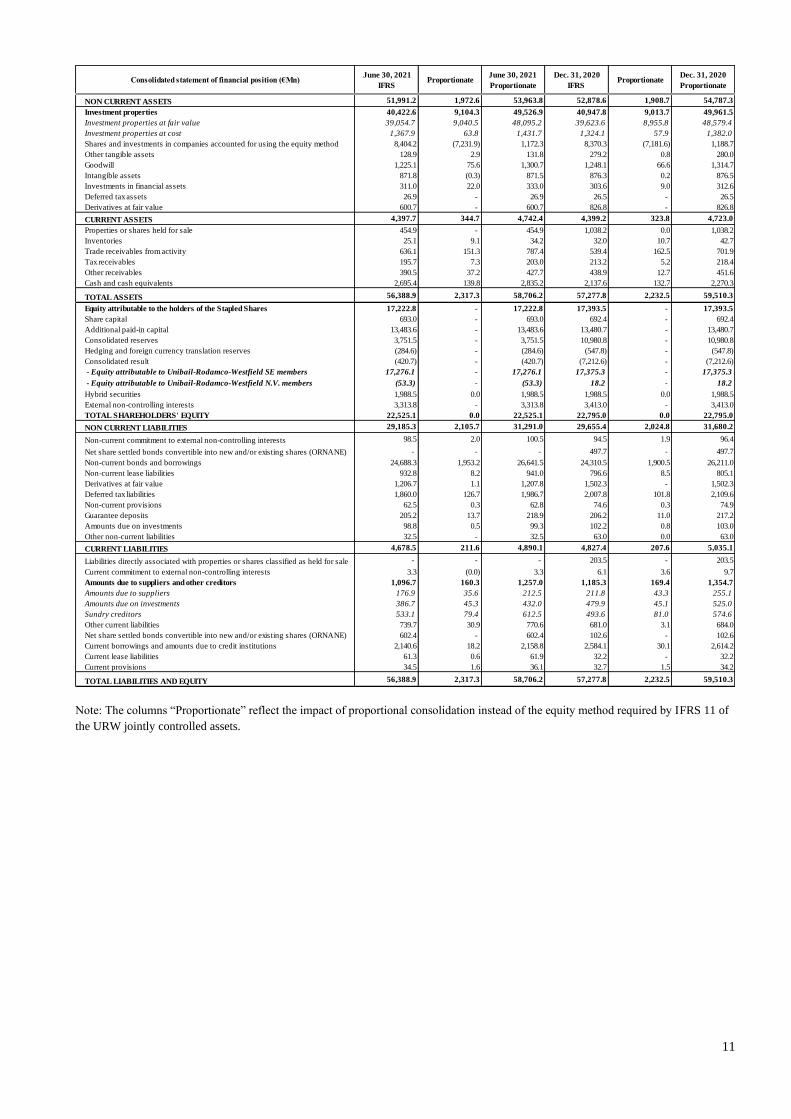
Note: The columns “Proportionate” reflect the impact of proportional consolidation instead of the equity method required by IFRS 11 of
the URW jointly controlled assets.
Consolidated statement of financial position (€Mn) June 30, 2021
IFRS Proportionate
June 30, 2021
Proportionate
Dec. 31, 2020
IFRS Proportionate
Dec. 31, 2020
Proportionate
NON CURRENT ASSETS 51,991.2 1,972.6 53,963.8 52,878.6 1,908.7 54,787.3
Investment properties 40,422.6 9,104.3 49,526.9 40,947.8 9,013.7 49,961.5
Investment properties at fair value 39,054.7 9,040.5 48,095.2 39,623.6 8,955.8 48,579.4
Investment properties at cost 1,367.9 63.8 1,431.7 1,324.1 57.9 1,382.0
Shares and investments in companies accounted for using the equity method 8,404.2 (7,231.9) 1,172.3 8,370.3 (7,181.6) 1,188.7
Other tangible assets 128.9 2.9 131.8 279.2 0.8 280.0
Goodwill 1,225.1 75.6 1,300.7 1,248.1 66.6 1,314.7
Intangible assets 871.8 (0.3) 871.5 876.3 0.2 876.5
Investments in financial assets 311.0 22.0 333.0 303.6 9.0 312.6
Deferred tax assets 26.9 - 26.9 26.5 - 26.5
Derivatives at fair value 600.7 - 600.7 826.8 - 826.8
CURRENT ASSETS 4,397.7 344.7 4,742.4 4,399.2 323.8 4,723.0
Properties or shares held for sale 454.9 - 454.9 1,038.2 0.0 1,038.2
Inventories 25.1 9.1 34.2 32.0 10.7 42.7
Trade receivables from activity 636.1 151.3 787.4 539.4 162.5 701.9
Tax receivables 195.7 7.3 203.0 213.2 5.2 218.4
Other receivables 390.5 37.2 427.7 438.9 12.7 451.6
Cash and cash equivalents 2,695.4 139.8 2,835.2 2,137.6 132.7 2,270.3
TOTAL ASSETS 56,388.9 2,317.3 58,706.2 57,277.8 2,232.5 59,510.3
Equity attributable to the holders of the Stapled Shares 17,222.8 - 17,222.8 17,393.5 - 17,393.5
Share capital 693.0 - 693.0 692.4 - 692.4
Additional paid-in capital 13,483.6 - 13,483.6 13,480.7 - 13,480.7
Consolidated reserves 3,751.5 - 3,751.5 10,980.8 - 10,980.8
Hedging and foreign currency translation reserves (284.6) - (284.6) (547.8) - (547.8)
Consolidated result (420.7) - (420.7) (7,212.6) - (7,212.6)
- Equity attributable to Unibail-Rodamco-Westfield SE members 17,276.1 - 17,276.1 17,375.3 - 17,375.3
- Equity attributable to Unibail-Rodamco-Westfield N.V. members (53.3) - (53.3) 18.2 - 18.2
Hybrid securities 1,988.5 0.0 1,988.5 1,988.5 0.0 1,988.5
External non-controlling interests 3,313.8 - 3,313.8 3,413.0 - 3,413.0
TOTAL SHAREHOLDERS' EQUITY 22,525.1 0.0 22,525.1 22,795.0 0.0 22,795.0
NON CURRENT LIABILITIES 29,185.3 2,105.7 31,291.0 29,655.4 2,024.8 31,680.2
Non-current commitment to external non-controlling interests 98.5 2.0 100.5 94.5 1.9 96.4
Net share settled bonds convertible into new and/or existing shares (ORNANE) - - - 497.7 - 497.7
Non-current bonds and borrowings 24,688.3 1,953.2 26,641.5 24,310.5 1,900.5 26,211.0
Non-current lease liabilities 932.8 8.2 941.0 796.6 8.5 805.1
Derivatives at fair value 1,206.7 1.1 1,207.8 1,502.3 - 1,502.3
Deferred tax liabilities 1,860.0 126.7 1,986.7 2,007.8 101.8 2,109.6
Non-current provisions 62.5 0.3 62.8 74.6 0.3 74.9
Guarantee deposits 205.2 13.7 218.9 206.2 11.0 217.2
Amounts due on investments 98.8 0.5 99.3 102.2 0.8 103.0
Other non-current liabilities 32.5 - 32.5 63.0 0.0 63.0
CURRENT LIABILITIES 4,678.5 211.6 4,890.1 4,827.4 207.6 5,035.1
Liabilities directly associated with properties or shares classified as held for sale - - - 203.5 - 203.5
Current commitment to external non-controlling interests 3.3 (0.0) 3.3 6.1 3.6 9.7
Amounts due to suppliers and other creditors 1,096.7 160.3 1,257.0 1,185.3 169.4 1,354.7
Amounts due to suppliers 176.9 35.6 212.5 211.8 43.3 255.1
Amounts due on investments 386.7 45.3 432.0 479.9 45.1 525.0
Sundry creditors 533.1 79.4 612.5 493.6 81.0 574.6
Other current liabilities 739.7 30.9 770.6 681.0 3.1 684.0
Net share settled bonds convertible into new and/or existing shares (ORNANE) 602.4 - 602.4 102.6 - 102.6
Current borrowings and amounts due to credit institutions 2,140.6 18.2 2,158.8 2,584.1 30.1 2,614.2
Current lease liabilities 61.3 0.6 61.9 32.2 - 32.2
Current provisions 34.5 1.6 36.1 32.7 1.5 34.2
TOTAL LIABILITIES AND EQUITY 56,388.9 2,317.3 58,706.2 57,277.8 2,232.5 59,510.3

12
MANAGEMENT DISCUSSION & ANALYSIS2:
1. Business review and H1-2021 results p 13
2. Investments and divestments p 42
3. Development projects as at June 30, 2021 p 45
4. Property portfolio and Net Asset Value as at June 30, 2021 p 49
5. Financial resources p 71
6. EPRA Performance measures p 85
2 The Management Discussion & Analysis (MD&A) is based on the Financial statements prepared on a proportionate basis.
13
1. BUSINESS REVIEW AND H1-2021 RESULTS
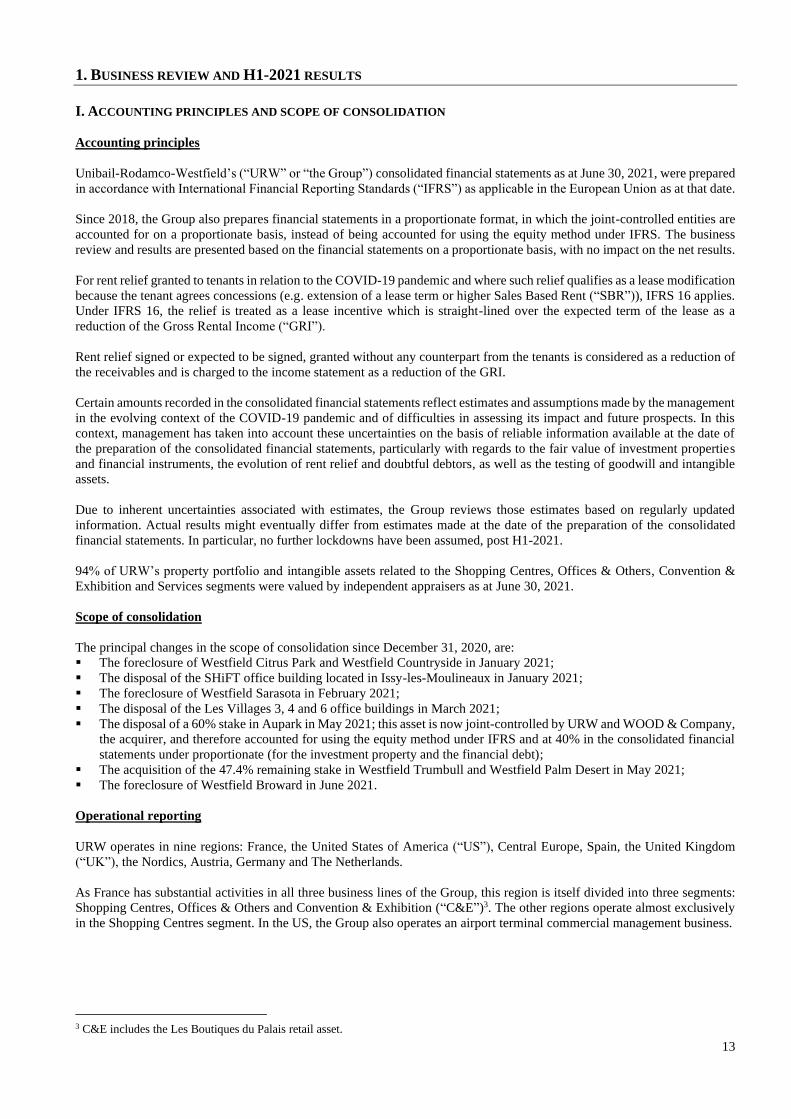
I. ACCOUNTING PRINCIPLES AND SCOPE OF CONSOLIDATION Accounting principles
Unibail-Rodamco-Westfield’s (“URW” or “the Group”) consolidated financial statements as at June 30, 2021, were prepared
in accordance with International Financial Reporting Standards (“IFRS”) as applicable in the European Union as at that date.
Since 2018, the Group also prepares financial statements in a proportionate format, in which the joint-controlled entities are
accounted for on a proportionate basis, instead of being accounted for using the equity method under IFRS. The business
review and results are presented based on the financial statements on a proportionate basis, with no impact on the net results.
For rent relief granted to tenants in relation to the COVID-19 pandemic and where such relief qualifies as a lease modification
because the tenant agrees concessions (e.g. extension of a lease term or higher Sales Based Rent (“SBR”)), IFRS 16 applies.
Under IFRS 16, the relief is treated as a lease incentive which is straight-lined over the expected term of the lease as a
reduction of the Gross Rental Income (“GRI”).
Rent relief signed or expected to be signed, granted without any counterpart from the tenants is considered as a reduction of
the receivables and is charged to the income statement as a reduction of the GRI.
Certain amounts recorded in the consolidated financial statements reflect estimates and assumptions made by the management
in the evolving context of the COVID-19 pandemic and of difficulties in assessing its impact and future prospects. In this
context, management has taken into account these uncertainties on the basis of reliable information available at the date of
the preparation of the consolidated financial statements, particularly with regards to the fair value of investment properties
and financial instruments, the evolution of rent relief and doubtful debtors, as well as the testing of goodwill and intangible
assets.
Due to inherent uncertainties associated with estimates, the Group reviews those estimates based on regularly updated
information. Actual results might eventually differ from estimates made at the date of the preparation of the consolidated
financial statements. In particular, no further lockdowns have been assumed, post H1-2021.
94% of URW’s property portfolio and intangible assets related to the Shopping Centres, Offices & Others, Convention &
Exhibition and Services segments were valued by independent appraisers as at June 30, 2021.
Scope of consolidation
The principal changes in the scope of consolidation since December 31, 2020, are:
▪ The foreclosure of Westfield Citrus Park and Westfield Countryside in January 2021;
▪ The disposal of the SHiFT office building located in Issy-les-Moulineaux in January 2021;
▪ The foreclosure of Westfield Sarasota in February 2021;
▪ The disposal of the Les Villages 3, 4 and 6 office buildings in March 2021;
▪ The disposal of a 60% stake in Aupark in May 2021; this asset is now joint-controlled by URW and WOOD & Company,
the acquirer, and therefore accounted for using the equity method under IFRS and at 40% in the consolidated financial
statements under proportionate (for the investment property and the financial debt);
▪ The acquisition of the 47.4% remaining stake in Westfield Trumbull and Westfield Palm Desert in May 2021;
▪ The foreclosure of Westfield Broward in June 2021.
Operational reporting
URW operates in nine regions: France, the United States of America (“US”), Central Europe, Spain, the United Kingdom
(“UK”), the Nordics, Austria, Germany and The Netherlands.
As France has substantial activities in all three business lines of the Group, this region is itself divided into three segments:
Shopping Centres, Offices & Others and Convention & Exhibition (“C&E”)3. The other regions operate almost exclusively
in the Shopping Centres segment. In the US, the Group also operates an airport terminal commercial management business.
3 C&E includes the Les Boutiques du Palais retail asset.

14
II. COVID-19 AND THE IMPACT ON URW’S BUSINESS
The COVID-19 pandemic has continued to have a significant impact on URW’s business over the course of H1-2021.
Consequently, additional performance indicators were added to provide investors with the clearest possible view of conditions
during the period.
Closing and reopening of the Group’s shopping centres in H1-2021
The operations in URW shopping centres in H1-2021 were again impacted by a series of lockdown and restriction periods
that affected the assets and activities of the Group. During the mandatory shutdowns, the Group’s priority was to ensure the
safety of its employees, customers and suppliers, to ensure security and safety in the assets, and to prepare for reopenings.
The enhanced health and safety measures developed in 2020 remained a key priority in all centres, in particular during
reopening periods. These included specific cleaning and social distancing requirements, put in place in 2020 and monitored
by fully trained in-centre staff. URW’s “Safe & Healthy Places” label, created in 2020 with the support of Bureau Veritas’
scientific committee, is used to attest to the excellence of its HSE practices and to ensure compliance with the latest
recommendations of local health authorities. 50 of the Group’s European centres and all the US centres have now received
this label following an independent audit by Bureau Veritas.
During H1-2021, most of the Group’s European centres had to close at various points, except for “essential” retailers and
excluding the centres in Sweden and parts of Spain which remained open throughout the period, albeit with certain restrictions
on F&B, cinemas and fitness. These closures impacted variously between January and May, with restrictions generally easing
during April and May. In France, centres over 20,000 sqm were forced to close from January 31 until May 19, while smaller
retail formats were only closed in most locations from mid-March, disproportionately affecting URW.
In the US, all of the centres were open throughout the first half, however restrictions on sectors like F&B, entertainment and
fitness were only progressively eased during February and March. The Group was impacted by its weighting to California,
Maryland area and New York (“NY”) where restrictions were generally relaxed later than in many other parts of the country.
For example, in Texas and Florida (the two most populous states apart from California and NY) indoor dining was allowed
throughout Q4-2020 and H1-2021 and all capacity restraints were removed by March, two-months earlier than in California
or NY.
Overall, during the first half of the year, on average, the Group’s shopping centres were closed for 684 days (vs. 67 days in
H1-2020), including 92 days in Europe (vs. 60 days in H1-2020).
As at June 30, 2021, in all European countries, all sectors were allowed to trade including indoor dining and entertainment,
albeit with some remaining capacity limits or other sanitary requirements. A full list of the applicable closures/restrictions is
provided in Appendix 2. As at June 30, all the Group’s US centres are also able to trade normally and all capacity restraints
have been removed.
With no new restrictions being introduced in July, all of the Group’s centres are therefore currently able to trade relatively
normally, however some restrictions remain in the European centres, with for example requirements for negative COVID
tests or completed vaccinations in order to visit bars and restaurants in some markets (e.g. Austria, Czech Republic and
Denmark) or capacity limits remaining within stores and venues in some countries. New French regulation could impose
requirement for COVID-19 pass to enter shopping centres, subject to local decisions.
The vaccination rate has improved significantly, though with differences across countries where the Group operates, reaching
for example 68% of the population having received a first dose in the UK, 58% in France, 60% in Germany and 56% in the
US (including 64% in California and 62% in NY)5. Despite progress made on vaccination and in light of the ongoing
developments around potential different variants of COVID, it is not possible for the Group to accurately predict the
possibility of any restrictions being reintroduced in the second half.
4 Weighted by shopping centres’ NRI in 2019. 5 As at July 23, 2021.

15
Footfall6 and tenant sales7
European footfall
Overall, H1-2021 footfall figures were heavily impacted by the lockdowns and the restrictions imposed by governments.
Ongoing government recommendations in many jurisdictions for people to “work from home” where possible also continued
to more heavily impact shopping centres situated in or close to business districts and/or connected to public transport hubs.
In Europe, H1-2021 footfall decreased by -49% vs. H1-2019. The Nordics and Spain outperformed other countries, with
footfall at -33% and -32%, respectively.
Post reopening: footfall recovery
Following the reopening in April/May, footfall in Europe saw an immediate increase8, reaching levels at least equal to or
above what was seen in the initial reopening in spring 2020. With all centres open throughout June, footfall for Europe for
that month reached 76% of the level of June 2019 (compared to 74% in 2020, which excluded Westfield Forum des Halles,
Westfield Les 4 Temps, Westfield London and Westfield Stratford City), including Austria at 83%, the Nordics and France
at 79% and Spain at 78%, while the UK was at 68%.
US footfall
Due to data limitations, footfall is not available for all centres9 in the US. For those assets for which reliable data is available,
footfall in the first half overall was 65% of 2019 levels, reaching 75% in June, including Westfield San Francisco which was
still more heavily impacted.
European tenant sales
While tenant sales were impacted by the renewed closures and restrictions (with a -48% decline compared to H1-2019), they
again showed encouraging resilience in periods when the Group’s tenants were able to trade, outperforming footfall trends.
In June, when all centres were open throughout the month, tenant sales in Europe reached 86% of June 2019 levels (compared
to 80% in 2020, which excluded Westfield Forum des Halles, Westfield Les 4 Temps, Westfield London and Westfield
Stratford City) including Central Europe at 92%, the Nordics at 91%, France at 90%, Austria at 87% and Spain at 85%, while
the UK was at 72%.
Tenant sales are supported by the increased savings ratio in European countries during the lockdown periods, which in 2020
and Q1-2021 stood at c. 20% across Europe compared to c. 12% historically, with the savings rate in France also exceeding
20% compared to a historical level of c. 15%.
Source: Eurostat, “Euroindicators” July 5, 2021
As a consequence of COVID-19 restrictions all across Europe, the Entertainment sector has suffered the most with a sales
decrease of -86%, followed by Food & Beverage Services (-58%). Fashion retailers experienced a sales drop of -54%, and
the Health & Beauty sector ended at -39%, compared to 2019 levels (respectively -65%, -24%, -17% and -8%, compared to
2020 levels).
Food stores & Mass Merchandise was the most resilient sector, with sales only slightly below 2019 (-4%) and below 2020
(-3%).
6 Footfall data does not include Zlote Tarasy as it is not managed by URW. Footfall in URW’s shopping centres in operation, including
extensions of existing assets, but excluding deliveries of new brownfield projects, newly acquired assets and assets under heavy
refurbishment. Carrousel du Louvre is excluded. 7 European tenant sales data does not include Zlote Tarasy as it is not managed by URW. Tenant sales performance in URW’s shopping
centres (except The Netherlands) in operation, including extensions of existing assets, but excluding deliveries of new brownfield projects,
newly acquired assets and assets under heavy refurbishment. Primark sales are based on estimates. Excluding Tesla sales. Carrousel du
Louvre is excluded. 8 Data from the respective reopening dates through the week ending July 25, 2021. 9 Only includes the 20 centres for which at least one year of comparable Springboard or ShopperTrak data is available.

16
US tenant sales10
Overall US retail sales have seen a strong rebound in H1-2021. This has been supported by the removal of restrictions on in-
person activities and the significant government stimulus package – with US household income rising +21%11 in March
reflecting the $1,400 checks provided to approximately 159 million households as part of the Federal government’s
$1.9 trillion stimulus package.
While all of the Group’s US centres were open in the first half, the tenant sales continued to be negatively impacted in the
first quarter by the on-going closure or limitation of sectors such as F&B, entertainment and fitness. These restrictions were
generally imposed in California, Maryland area and NY/NJ (the Group’s key US markets) longer than in other parts of the
US.
Hence, URW’s US tenant sales for H1-2021 reached 87% of 2019 levels (of which 88% in Flagships and 86% in Regionals)
and 178% of 2020 levels (of which 180% in Flagships and 173% in Regionals).
Following the reopening of these sectors over February and March, a marked improvement has been seen with a steady
increase from 69% in January to 100% in June for the whole portfolio. Notably, in the non-CBD Flagship centres12, tenant
sales reached 93% of 2019 levels in March, 97% in April, 105% in May and 107% in June. This was particularly driven for
the whole US standing portfolio by strength in the Luxury category (+43% for H1-2021). Moreover, the Group also saw a
positive evolution in Sports (+20%), Gifts (+18%), and Home (+17%) in particular. For the important Fashion category, a
noticeable improvement was seen from -15% in March to -4% in June, compared to 2019 levels. The F&B which was the
most impacted, an improvement was seen from -26% in March, to -10% in May and -9% in June.
Group tenant sales summary
Overall, and as seen in 2020, tenant sales generally outperformed footfall reflecting higher conversion rates and average
baskets.
The table below summarises the Group’s tenant sales for the first half:
Region
Tenant Sales
Growth
(%)
H1-2021
vs. H1-2019
Tenant Sales
Growth vs. June
2019
(%)
June
H1-2021 stores
closure period
(in %)(1)
France -53% -10% 38%
Spain -29% -15% 13%
Central Europe -43% -8% 55%
Austria -43% -13% 38%
Nordics -25% -9% 17%
The Netherlands NA NA 65%
Germany -61% -14% 83%
Total Continental Europe -46% -11% 51%
UK -60% -28% 56%
Total Europe -48% -14% 51%
US -13% 0% 0%
Total Group -38% -10% 38% (1) Number of days closed weighted by shopping centres’ NRI in 2019.
Tenant negotiations
In some geographies (including the UK, Germany and certain US municipalities), legal remedies for non-payment of rent
have been temporarily limited, which also hampered the enforceability of rents. In certain regions, existing laws (Austria) or
new laws (Poland) even prohibited the charging of rents during closure periods. A new law not fully enacted in Poland also
provides for a 50% discount of rents to be applied over the three months following reopening.
In Sweden, Denmark, Czech Republic, Germany and Slovakia the government created state subsidy programmes focused
specifically on supporting retail tenants. In France, the government announced its intention to support retailers impacted by
the third lockdown, although the final details of this scheme are yet to be confirmed. URW helped its tenants getting access
to these subsidies whenever possible (see Appendix 3).
10 On standing assets, excluding extensions (Westfield Valley Fair). 11 Source: Bureau of Economic Analysis, April 30, 2021. 12 i.e. excluding Westfield World Trade Center and Westfield San Francisco Centre.

17
URW recognises the issues the Group’s tenants faced due to administrative closures or trading restrictions and the need to
provide relief, generally limited to the period of closure and based on the principle of a fair sharing of the burden. Throughout
the COVID period, negotiations have typically not been about permanently changing lease structures or changing the basis
for rent calculations (e.g. replacing Minimum Guaranteed Rent (“MGR”) with SBR only leases).
Negotiations with tenants regarding the first and second waves of COVID-19 related to 2020 were over 80% signed. With
the subsequent waves of COVID-19 related restrictions in H1-2021, the Group proceeded to apply the same principles in
terms of providing rent relief as were adopted during 2020, with a case by case approach, leading to a fair sharing of the
burden of the lockdowns taking into account potential government support. In total for Europe, the cash impact of rent relief13
for H1-2021 corresponds to 1.5 months (1.6 for the full year 2020).
As at June 30, 2021, rent relief signed or expected to be signed regarding H1-2021 closures amounted to an estimated cash
impact of €220 Mn, €183 Mn of which has been charged to the income statement during this period. The difference will be
straight-lined in future periods.
Bankruptcies
Tenant insolvency procedures have affected 210 stores in the Group’s portfolio in H1-2021 (vs. 391 in H1-2020), representing
1.8% of the stores in URW’s portfolio (5.2% for full year 2020). The total leasing revenues (including service charges) which
remain exposed to tenants currently in some form of bankruptcy procedure amounts to €25 Mn14 over c. 31,000 sqm of retail
space.
In Continental Europe, the number of stores impacted by bankruptcies amounted to 152 (out of 6,984 stores) compared to
235 in H1-2020. Among the impacted stores in H1-2021, 97 of them continue to trade. The most affected regions in H1-2021
were Spain with 45 stores (including Douglas, Carl’s Jr and Hawkers) and Central Europe with 40 stores (including Etam,
Pietro Filipi and Royal Collection). In the UK, 11 stores (out of a total of 644 stores) were affected by insolvency procedures
(8 of them remaining in place), including Dune and Brooks Brothers, compared to 21 in H1-2020.
In the US, total bankruptcies for H1-2021 affected 47 stores (out of 3,977 stores, with 34 out of the 47 remaining in place), a
much lower level than the 135 stores in H1-2020 or 268 in total for FY-2020, likely reflecting that many of the weakest
retailers already entered bankruptcy and during 2021 most retail locations nationally have been able to trade with a strong
economic rebound observed.
Across the Group, in terms of the categories affected, the most bankruptcies were seen in F&B Services (35%), Fashion
(23%) and Health & Beauty (14%).
Rent collection and deferred rent
It should be noted that the rent collection rate is calculated compared to 100% of rents and service charges invoiced, reflecting
no adjustment for deferred or discounted rent in the denominator.
As at June 30, 68% of invoiced H1-2021 rents and service charges had been collected in Europe and 78% in the US,
representing 71% overall for the Group. Collection rates in Europe were naturally lower during the periods of maximum
restrictions. In particular, retailers in France also delayed the payment of their rents in the expectation of governmental
support leading to lower collection rates in February to June, despite a higher 84% collection rate in January, when stores
were still open. In the UK and Germany, protective measures for retailers including moratorium on evictions were
implemented by the government, limiting the capacity of the Group to collect rents.
In the US, while the centres were open, collection rates were still impacted by ongoing limits on certain types of activity in
Q1-2021 and also by local measures limiting the ability to evict tenants for non-payment which resulted in reduced or delayed
payment or automatic deferments in some instances.
The H1-2021 collection rate15 improved with shopping centres’ reopening and retailers’ ability to trade reaching 73% of the
billed rents as at July 22, 2021, the remaining 27% corresponding to 18% of rent relief granted to tenants and 9% of overdues
or deferrals, out of which 6% are covered by provisions for doubtful debtors. It is expected to improve over time if no major
new restrictions are implemented. Adjusted for the rent relief granted, the collection rate for H1-2021 thus came to 89%16 of
the total amount due, with Continental Europe at 87%, 92% for the US and 94% for the UK.
13 In terms of MGR + SBR + Service Charges invoiced in 2019, excluding non-controlled assets and Westfield Mall of the Netherlands. 14 Group share. Stores still occupying premises at end June 2021. 15 Based on cash collection as at July 22, 2021, and assets at 100%. 16 Due after rent relief signed or expected to be granted.

18
Overall rent collection by quarter in 2021 is shown below17:
The collection rate for July18 stood at 72% including 75% in the US, 65% in the UK and 71% in Continental Europe which
is still impacted by low level of collection in France.
The total accounts receivable19 from activities increased by +€85.5 Mn vs. December 31, 2020. The accounts receivable are
net of €64.2 Mn provisions booked in the result for the first half (vs. €103.9 Mn in H1-2020), including €65.4 Mn for
Shopping Centres only.
COVID-19 impact on earnings for H1-2021
While it is difficult to accurately calculate the specific impact of COVID-19 in the operating performance, the Group has
identified the following elements totalling -€152 Mn, with an impact on the Adjusted Recurring Earnings per Share (AREPS)
of -€1.10:
▪ -€1.21: rent relief, as only signed rent relief were accounted for in H1-2020 (-€0.11); partly offset by a decrease of
▪ +€0.28: in doubtful debtors (-€0.57 in H1-2020) taking into account rent collection;
▪ -€0.01: lower variable revenue streams (e.g. SBR, parking, and Commercial Partnerships);
▪ -€0.08: reduction in net income from the Convention & Exhibition business (Group share);
▪ -€0.09: increase in financial expenses due to liquidity measures taken in response to the crisis and higher cost of debt;
and
▪ +€0.01: higher net services income.
In addition, the disposals completed in 2020 and H1-2021 had a negative impact of -€0.30 per share.
Cost reduction and capital expenditure deferrals
Over the past 18-months, the Group has implemented a number of initiatives to generate both short- and long-term cost
savings. The US and UK activities were restructured to ensure optimisation of their processes and tools while simplifying
the organisation, leading to substantial and sustainable savings. As the development pipeline was downsized significantly,
an adjustment of the corresponding staff was made. In addition, furlough plans and “partial activity” schemes were activated
where appropriate. Lastly, non-staff related costs were cut.
In addition to the gross administrative expense savings of c. €80 Mn achieved in 2020 (vs. 2019), the Group further reduced
its gross administrative expenses targeting a further €25 Mn to €30 Mn savings in 2021.
17 Based on cash collection as at July 22, 2021, and assets at 100%. 18 As at July 22, 2021. 19 On a proportionate basis, including Shopping Centres, Offices & Others and C&E.
Q1-2021 Q2-2021 H1 2021
Continental Europe 70% 67% 69%
UK 74% 80% 77%
Total Europe 71% 69% 70%
US 79% 80% 80%
Total URW 73% 73% 73%
RegionRent collection (%)

19
III. BUSINESS REVIEW BY SEGMENT The Business review by segment presented below has been prepared based on the Group’s European perimeter.
Section 4 contains the US Business Review. Unless otherwise indicated, all references in Sections 1 to 3 are to URW’s
European operations and relate to the period ended June 30, 2021. As described above, all the Group’s operations
were significantly affected by the outbreak of COVID-19 pandemic. Consequently, comparisons to prior periods have
limited practical relevance.
1. Europe – Shopping Centres
1.1. Activity
Leasing activity
Leasing activity20 in H1-2021 showed a sizeable increase in volume compared to H1-2020, despite the ongoing impact of the
COVID-19 crisis. In H1-2021, URW signed 663 leases (34721) on standing assets for €106.3 Mn of MGR. These 663 leases
include 283 leases with a maturity below three years to limit vacancy (vs. 136 in H1-2020) without impacting long term asset
values.
The MGR uplift on renewals and relettings was -2.2% (+1.7% in 2020) in Continental Europe and -2.4% (+1.6% in 2020) in
Europe. This was primarily driven by a decrease mainly in Austria, The Netherlands, the Nordics and Germany, partially
offset by a double digit reversion in Spain. Regarding deals with duration above three years, the MGR uplift was +2.2% for
Continental Europe and +0.8% for Europe. The MGR uplift in Flagships in Continental Europe was +3.7% (+3.9% in 2020)
and +1.4% (+3.4% in 2020) in Europe.
Figures may not add up due to rounding.
Despite the challenging backdrop created by the COVID-19 pandemic, the Group continued to see good appetite from leading
international brands to open new and improved concepts in its centres.
The Group signed a number of key new lettings in the most relevant categories (in addition to lettings within the projects at
La Part-Dieu, La Maquinista and Westfield Mall of the Netherlands, discussed later):
▪ DNVBs: Jimmy Fairly in Westfield Carré Sénart and Westfield Rosny 2, Fashionalia in Parquesur, AliExpress in La
Maquinista and Parquesur, as well as a pop-up letting to Dennis Maglic in Westfield Mall of Scandinavia;
▪ Entertainment: Karl’s family outdoor entertainment park signed for 70,000 sqm in CentrO (replacing a former leisure
operator which departed in 2018), Farbie (children’s entertainment concept) in Shopping City Süd, and Indoor Golf (a
golf simulator) in Täby Centrum, Westfield Mall of Scandinavia and Nacka Forum;
▪ Experiential fashion: The Kooples in Westfield Carré Sénart, Polo Ralph Lauren in Westfield Mall of Scandinavia,
Anson’s (a Peek & Cloppenburg brand, market entry to Czech Republic) in Westfield Chodov, Primark in Garbera, and
Lacoste (upsized store) in Westfield Carré Sénart;
20 Leasing activity includes only deals with maturity >= 12 months, consistently with prior periods. 21 Including 12 deals for the five French assets sold in H1-2020.
€ Mn % € Mn %
France 131 37,423 22.1 0.3 - -1.8% 0.4 8.3%
Central Europe 103 29,955 13.1 0.1 0.7% 0.4 5.7%
Spain 90 16,526 11.3 1.4 14.7% 0.8 13.5%
Nordics 94 28,497 11.4 1.1 - -8.9% 0.5 - -9.8%
Austria 81 19,062 8.7 0.8 - -9.9% 0.2 - -3.8%
Germany 56 100,552 7.7 0.5 - -7.4% 0.1 - -1.4%
The Netherlands 34 12,130 2.8 0.3 - -9.4% 0.1 - -3.8%
Total Continental Europe 589 244,145 77.0 1.5 - -2.2% 0.8 2.2%
UK 74 35,823 29.3 0.8 - -2.7% 0.3 - -1.3%
Total Europe 663 279,968 106.3 2.3 - -2.4% 0.4 0.8%
Regionnb of leases
signedsqm
MGR
(€ Mn)
MGR upliftMGR uplift on deals above 3
years firm duration
Lettings / re-lettings / renewals excluding Pipeline

20
▪ Sports/fitness: ASICS in Westfield Carré Sénart, Nike in Westfield Mall of Scandinavia, Täby Centrum, and the first
Nike flagship stores in Poland at Westfield Arkadia and Galeria Mokotów, Clever Fit (a German fitness operator entering
the Czech market) in Westfield Chodov, JD Sports in Bonaire, and Munich in three Spanish centres (Bonaire, Garbera,
La Maquinista);
▪ Innovative Auto: Polestar, a Volvo group electric car brand, in Westfield London;
▪ Food and beverage: Elan café in Carrousel du Louvre, Big Easy (seafood / BBQ style restaurant) in Westfield Stratford
City, and Madame Shawn in CNIT and Westfield Euralille;
▪ Health and beauty: Rituals market entry to Poland in Westfield Arkadia and Normal in Polygone Riviera;
▪ Home: IKEA Planning Studio (a new concept within a shopping centre) in Westfield Chodov, and Maisons du Monde in
Garbera;
▪ Culture & Technology: LEGO market entry to Poland in two centres (Westfield Arkadia, Galeria Mokotów), Bosch in
Donau Zentrum, Dyson in Shopping City Süd, and Sky in Westfield London and Westfield Stratford City.
In terms of renewal activity in the period, the Group signed a number of important deals with Apple, including renewals in
La Part-Dieu, CentrO, Täby Centrum (the only Apple store in Stockholm), and Westfield Stratford City, in addition to a deal
for an upsized flagship store in Westfield London.
The Group also signed seven deals with H&M (including So Ouest, Villeneuve 2, Westfield Euralille and Solna Centrum)
and eight deals with the Inditex group (including Donau Zentrum, Bonaire, and Westfield Stratford City).
In addition, a number of important new stores were opened during the half despite lockdowns:
▪ France: Bershka opened their new flagship and largest in-mall store in Western Europe in Westfield Forum des Halles;
▪ Germany: Huawei opened their first store in a shopping centre in Germany at CentrO;
▪ Austria: John Reed opened their first store in a shopping centre in Austria at Donau Zentrum;
▪ UK: several key openings took place including Genesis and Hackett in Westfield London and Watches of Switzerland in
Westfield Stratford City;
▪ The Netherlands: in addition to the openings at Westfield Mall of the Netherlands described below, Rituals, with a new
flagship store, and Coolblue, a leading Dutch DNVB, opened in Almere;
▪ Poland: LEGO opened in Westfield Arkadia as well as Footlocker and Notino (a DNVB concept with their largest offline
format), and Nike and RTV Euro AGD (including a dedicated gaming zone) opened in Galeria Mokotów;
▪ Slovakia: Saunia opened their first outlet in the country at Aupark (1,144 sqm);
▪ Spain: Sephora opened in Parquesur;
▪ Sweden: the BLX Bouldering Club and ROJI Monster Ice Cream (a market entry to Sweden) opened in Westfield Mall
of Scandinavia.
The Group also continues to explore emerging new categories that align with consumer trends. In H1-2021, two new
experiential, social media based concepts were secured with Smile Safari signed in France in Westfield Euralille, and
Youseum opening in Westfield Mall of the Netherlands. These are “social media museums” which provide photo
opportunities in curated rooms. In addition, reflecting increased consumer interest in sustainable commerce, the Group has
seen four openings focused on sustainable fashion: two vintage concepts (Hippy Market in Westfield Les 4 Temps and Kilo
Shop in La Part-Dieu) and two pop-up stores (Lone Design club and By Rotation, a fashion rental store, in Westfield London).
Despite the COVID-19 situation, the Group also successfully inaugurated Westfield Mall of the Netherlands (117,000 sqm22
of GLA and 280 stores) during the first half, with the soft launch on March 18, 2021, with 205 stores trading (F&B units
were still closed due to COVID-19 restrictions). These included key flagship stores for brands such as Victoria’s Secret (first
full concept in The Netherlands) and Bath & Body Works (market entry) as well as H&M, LEGO, Nike and four Inditex
brands. During the half, new deals for this asset were signed with Urban Outfitters, Bang & Olufsen, Toni & Guy, Pandora,
Miele and G-Star RAW, and with Volvo and MG (automotive). As at June 30, 2021, the asset was 94% let. Footfall over
May/June reached an annualised level above 12 million visits.
The new fully let Fashion Pavilion and renewed Dining Experience at La Maquinista in Spain (10,200 sqm, 19 stores) were
also opened in March and April, respectively, introducing a number of important new tenants including Urban Outfitters,
Abercrombie & Fitch, Uniqlo, JD Sport, Dyson and L’Occitane, as well as the key food anchor La Citi (including five famous
street food operators from Barcelona’s Van Van food market in a permanent location).
Finally, the main part of the major refurbishment and 32,900 sqm extension of La Part-Dieu in Lyon opened in June, with a
number of key openings in H1-2021, including Food Society, an innovative foodhall, and Hapik, an entertainment concept
based on climbing activities. The pre-letting23 of the La Part-Dieu extension as at June 30, 2021, was 94%.
22 Total complex GLA, including co-owners. 23 GLA signed, all agreed to be signed and financials agreed.

21
Commercial Partnerships
The Commercial Partnerships (“CP”) activity was substantially impacted in H1-2021 by the on-going COVID restrictions,
with income at -17.4% below H1-2020 and -34.3% versus H1-2019. In general, media has recovered more quickly than other
segments, while brand experience activity has been the most impacted sub-sector.
Key developments during the first half include:
Media (includes large format Digital Screens, Digital Totems, and Non-digital communication):
▪ Retail, beauty, technology, automotive and fast moving consumer goods categories are proving resilient (e.g. strong
recovery seen in France in May/June with bookings from Chanel, Adidas and JD Sports), while spend from travel and
film categories remains significantly behind pre-COVID-19 levels;
▪ Cloud & Compass “Drive to Store” technology was rolled out in the UK during Q2, enabling Digital Totems to be bought
programmatically with advertising triggered by real-time data including footfall, queue lengths and ticket sales.
Retail (includes temporary Kiosks, Seasonal Markets, Pop-ups, and Car Services):
▪ In Westfield Mall of Scandinavia, the Group launched a pop-up rooftop terrace and restaurant with a premium restaurant
brand (Miss Voon) including a large outdoor screen for viewing the European football championships;
▪ In France, a Dyson pop-up was signed and opened in Westfield Les 4 Temps, in addition to an online media campaign
undertaken for Dyson in Westfield Parly 2, where a permanent Dyson store had already opened;
▪ In Westfield London, the summer theme for the external plaza at Westfield Square has launched from June 21, which
includes a pop-up cinema.
Brand Experience (includes Experiential, Brand Partnerships, Event Sponsorship):
▪ Social distancing measures have encouraged brands to generally delay physical activations until the second half of 2021.
Where centres have reopened in Europe and measures have permitted, key brands have returned to activations in centres
to engage with consumers;
▪ Examples include Design Stage in Shopping City Süd (marketing event with local designers), the Tommy Hilfiger
perfume launch in CentrO, and the pop-up letting to LEGO Exhibition in Täby Centrum (over 1,500 sqm).
In particular, blending together elements of retail and brand experience, innovative auto remains a key driver of commercial
partnerships activity. During the period activities in this sector included:
▪ Aston Martin pop-up in Polygone Riviera;
▪ Tesla weekend brand event in Westfield Chodov and Centrum Černý Most;
▪ Activations in the UK for Cupra (electric and hybrid cars);
▪ Strategic long-term partnership with MG in Westfield Mall of the Netherlands;
▪ Polestar brand event at Westfield Mall of Scandinavia (in addition to two new stores, in Westfield Mall of the Netherlands
and Westfield London);
▪ Brand partnership in France, including pop-up stores and other activations, with Aiways (Chinese automotive brand)
covering three shopping centres (Polygone Riviera, Westfield Euralille and Confluence);
▪ Volkswagen promotion of electric and hybrid cars in Donau Zentrum; and
▪ Moon City E-Mobility pop-up (VW) in Aupark.
Marketing & Communication
Marketing for the first half was concentrated on continuing the #WorkingTogether campaign designed to keep consumers
informed about the latest situation in the Group’s centres and the health and safety measures in place to ensure their safety.
With the reopening, the Group’s centres are running “Rediscover” campaigns, which are category led and aim to inform
consumers of centres reopening and foster rediscovering of physical shopping. Other recent campaigns include Master Chef
Täby, an exclusive partnership with the finalists of Swedish Master Chef (with 1.4 million impressions/views in digital
channels) and, in London, the Disney Cruella campaign, linked to the launch of the Disney movie.
The Group’s CRM database and interactions with its visitors have been maintained during H1-2021 with circa 0.6 million
new members secured through May 2021.
The total database at the end of the period stood at 12.9 million (vs. 14.7 million), of which 9.2 million loyalty members (vs.
10.8 million) as a result of records deleted due to the evolution of the legal framework for data retention. The Group’s apps
have been downloaded 3.1 million times and URW has 8.2 million followers on social media (+8%).
The Group also announced the appointment of Caroline Puechoultres as the new Chief Customer Officer. Her role will be
responsible for growing and enhancing URW’s business and consumer offering by strengthening the company’s commercial
partnerships with brands and retailers, further leveraging data analytics, developing media revenues and expanding

22
omnichannel services including click & collect and curbside delivery, while also driving innovation and strengthening
marketing and branding.
An additional six assets in four European markets will be branded as Westfield destinations in September 2021. The new
branded centres will include La Part-Dieu in Lyon, La Maquinista and Glories in Barcelona, Donau Zentrum and Shopping
City Süd in Vienna and CentrO in Oberhausen. The Group’s Westfield destinations attract both established retailers and
emerging brands in a rapidly evolving retail, lifestyle and entertainment environment, providing flexible leasing formats
across multiple geographies, as well as opportunities to leverage significant consumer audiences for multiplatform marketing
activities.
Innovation
URW continued to strengthen its innovation strategy through two initiatives in particular:
▪ The third edition of the URW x HEC Paris “Hackathon” during which 32 students competed to devise practical projects
relevant to URW on the theme: “Smart Retail & Ecological Crisis: 2,000 sqm to save the world!”;
▪ For the second time, URW also organised the “Innovation Awards”, an internal competition opened to all employees. In
total 69 projects from 11 countries were identified and four projects were rewarded, including:
o The implementation of a contactless mobile food ordering solution in three US airports;
o The creation of a partnership with Zalando “Connected Retail” platform.
URW continued its partnership with blisce/, a tier-1 Venture Capital growth fund backing innovative & mission-driven direct-
to-consumer tech companies. Outstanding results were achieved by Too Good to Go in particular in H1-2021, with 13 million
meals saved since January (as of end of March). This business is now being rolled-out in the US: 200,000 meals have been
saved in the first four cities (Boston, NY, Philadelphia, Washington DC) with 500,000 registered consumers and 2,000 stores.
To support these encouraging results, URW has reinvested in Too Good to Go.
1.2. Net Rental Income
Total consolidated Net Rental Income (“NRI”) was €454.5 Mn for Continental Europe (-33.2%) and €498.2 Mn for Europe
(-31.8%), as a result of negative like-for-like growth, mainly due to the impact of COVID-19 and higher vacancy, as well as
the disposal of five shopping centres in France in May 2020 and of a 60% stake in Aupark in May 2021.
In H1-2020, the NRI was mainly impacted by an increase of doubtful debtors provisions (-€36.5 Mn), whereas only signed
rent relief was booked (-€15.6 Mn), according to the interpretation of IFRS made in accordance with the auditors for that
closing period. In H1-2021, the full amount of rent relief granted or expected to be granted for H1-2021 were booked
(-€162.2 Mn), whether agreed, signed, billed or accrued based on an estimate, and doubtful debtors provisions amounted to
-€56.2 Mn.
Figures may not add up due to rounding.
H1-2021 H1-2020 %
France 177.3 310.3 -42.9%
Central Europe 68.9 111.3 -38.1%
Spain 61.9 73.4 -15.7%
Nordics 53.5 54.8 -2.4%
Austria 35.2 39.4 -10.5%
Germany 31.2 65.1 -52.1%
The Netherlands 26.5 26.4 0.2%
Total NRI - Continental Europe 454.5 680.7 -33.2%
UK 43.7 50.0 -12.6%
Total NRI - Europe 498.2 730.7 -31.8%
Region
Net Rental Income (€Mn)

23
The total net change in NRI amounted to -€232.5 Mn in Europe (including -€226.2 Mn in Continental Europe) and breaks
down as follows:
▪ +€3.2 Mn due to positive currency effects (GBP and SEK);
▪ +€0.3 Mn due to deliveries with positive impact of Westfield Mall of the Netherlands and Fashion Pavilion in La
Maquinista, partly offset by La Part-Dieu project;
▪ -€0.3 Mn due to exceptional and other items;
▪ -€6.7 Mn due to assets moved to the pipeline, primarily in France (mainly in Westfield Les 4 Temps and Westfield Forum
des Halles), the UK, Spain and Austria;
▪ -€46.7 Mn due to disposals of assets, mainly in France (five shopping centres in H1-2020 and Bobigny 2) and the disposal
of a 60% stake in Aupark in May 2021;
▪ -€182.3 Mn of like-for-like NRI growth24 in Europe (-29.3%) (and -€177.4 Mn in Continental Europe (-31.0%)).
Figures may not add up due to rounding.
Figures may not add up due to rounding.
24 Like-for-like NRI: Net Rental Income excluding acquisitions, divestments, transfers to and from pipeline (extensions, brownfields or
redevelopment of an asset when operations are stopped to enable works), all other changes resulting in any change to square metres and
currency exchange rate differences in the periods analysed.
H1-2021 H1-2020 %
France 145.3 226.7 -35.9%
Central Europe 59.5 97.3 -38.8%
Spain 56.2 67.7 -17.0%
Nordics 50.7 54.2 -6.5%
Austria 35.1 39.4 -11.0%
Germany 31.2 65.1 -52.1%
The Netherlands 17.8 22.8 -22.0%
Total NRI Lfl - Continental Europe 395.7 573.1 -31.0%
UK 43.3 48.2 -10.1%
Total NRI Lfl - Europe 439.0 621.3 -29.3%
Region
Net Rental Income (€Mn)
Like-for-like
Indexation
Renewals,
relettings net
of departures
COVID-19
rent discounts
Doubtful
debtorsOther Total
France 0.6% -2.8% -22.9% -8.3% -2.5% -35.9%
Central Europe 1.1% -5.2% -23.9% -5.7% -5.0% -38.8%
Spain -0.1% -2.7% -16.5% 2.7% -0.4% -17.0%
Nordics 1.9% -7.2% -1.2% 5.6% -5.4% -6.5%
Austria 2.2% -7.4% -12.4% 1.2% 5.4% -11.0%
Germany 0.5% -6.9% -38.9% -6.8% 0.0% -52.1%
The Netherlands 1.1% -9.6% -14.1% -0.7% 1.2% -22.0%
Total NRI Lfl - Cont. Europe 0.8% -4.7% -21.0% -4.1% -2.0% -31.0%
UK 0.0% -20.7% -28.9% 21.0% 18.5% -10.1%
Total NRI Lfl - Europe 0.8% -5.9% -21.6% -2.2% -0.4% -29.3%
Region
Net Rental Income Like-for-like evolution (%)

24
Like-for-like NRI decreased by -31.0% in Continental Europe, and includes:
▪ +0.8% of indexation (+1.3% in 2020 and +1.4% in H1-2020);
▪ -4.7% of “Renewals and relettings net of departures” (-1.2% in 2020 and +0.3% in H1-2020), as a result of increased
vacancy and negative reversion on relettings and renewals including deals below one year;
▪ -21.0% due to rent relief granted to tenants in all regions due to COVID-19 (-11.6% in 2020 and -2.5% in H1-2020). The
COVID-19 rent discounts impact has increased significantly compared to H1-2020 due to the change in the estimate
policy25 and to a significantly longer closed period on average in H1-2021 compared to H1-2020. The P&L impact of rent
relief in H1-2021 for the like-for-like perimeter was -€136.1 Mn vs. -€146.6 Mn in 2020 and -€15.6 Mn in H1-2020;
▪ -4.1% due to the increase of the provisions for doubtful debtors (vs. -3.5% in 2020 and -1.8% in H1-2020), mainly due
to the impact of COVID-19 with several bankruptcies in some regions and the Group’s estimates of increased customer
risks. This amount includes the increase in risk in connection with restrictions implemented in 2020 and H1-2021;
▪ -2.0% in “Other” (vs. -4.2% in 2020 and -4.0% in H1-2020), mainly due to lower key money, parking revenues, SBR and
Commercial Partnerships, and higher net service charges during the period as a direct impact of COVID-19 and increased
vacancy.
In the UK, like-for-like NRI decreased by -10.1% (vs. -49.3% in 2020 and -34.1% in H1-2020), mainly driven by rent relief
agreed or estimated in H1-2021 (-28.9%), a negative impact of renewals and relettings (-20.7%) impacted by CVAs, discounts
and higher vacancy, partially offset by significant reversals in doubtful debtors (+21.0%) with a better collection rate and an
insurance claim covering losses of revenues, as well as an initial recovery in parking revenues and SBR in “Other” (+18.5%).
The impact of doubtful debtors improved compared to 2020, as part of the unpaid rents included in doubtful debtors were
subject to rent relief and as a result of a lower level of bankruptcies in H1-2021.
Collectively, European like-for-like NRI decreased by -29.3% in H1-2021.
1.3. Vacancy
The Estimated Rental Value (“ERV”) of vacant space in operation in the portfolio was €80.6 Mn in Continental Europe
(€79.3 Mn as at December 31, 2020, and €62.5 Mn as at June 30, 2020) and €115.9 Mn in Europe (€108.5 Mn as at December
31, 2020, and €90.5 Mn as at June 30, 2020). ERV of vacant space as at June 30, 2021, is slightly below the position as at
March 31, 2021 (€88.0 Mn and €126.4 Mn for Continental Europe and Europe, respectively).
COVID-19 caused a material increase in bankruptcies and delays in lettings in 2020 and to some extent in H1-2021. The
EPRA vacancy rate26 in Continental Europe was 5.0%, 12.2% in the UK (mainly due to Westfield London), and 6.1% in
Europe overall. These levels are in line with vacancy as at December 31, 2020, for Continental Europe (4.9%) and slightly
below March 31, 2021 level (5.4%). Compared to December 31, 2020, vacancy slightly increased in Spain (mainly in La
Maquinista) and Germany (CentrO) and slightly decreased in Austria, the Nordics and The Netherlands. The vacancy rate in
the UK increased from 9.7% as at December 31, 2020, to 12.2% as at June 30, 2021, due to the bankruptcies suffered and
retailers remaining closed after the various lockdowns in the UK. In total, vacancy in Europe of 6.1% was above the one as
at December 31, 2020 of 5.6%, but below the 6.5% level reached as at March 31.
Excluding pipeline. Figures may not add up due to rounding.
25 In H1-2020, only signed rent relief were accounted for. As from December 2020, rent relief signed or expected to be signed without
counterparty are accounted for. 26 EPRA vacancy rate: ERV of vacant spaces divided by ERV of total surfaces.
€Mn %
France 23.1 3.6% 4.3% 3.7%
Central Europe 13.9 5.6% 6.0% 5.5%
Spain 12.0 6.0% 4.5% 4.4%
Nordics 11.1 8.0% 9.1% 9.3%
Austria 1.7 1.6% 2.5% 2.6%
Germany 14.0 6.6% 7.5% 5.2%
The Netherlands 4.7 8.0% 7.3% 9.7%
Total - Continental Europe 80.6 5.0% 5.4% 4.9%
UK 35.3 12.2% 12.6% 9.7%
Total - Europe 115.9 6.1% 6.5% 5.6%
June 30, 2021
Vacancy
Region%
Dec. 31, 2020
%
Mar. 31, 2021

25
1.4. Lease Expiry Schedule
Figures may not add up due to rounding.
MGR (€Mn)
at date of next
break option
As a % of
total
MGR (€Mn)
at expiry date
As a % of
total
Expired 38.3 2.8% 38.3 2.8%
2021 112.2 8.1% 90.3 6.6%
2022 300.2 21.8% 156.1 11.3%
2023 281.2 20.4% 135.3 9.8%
2024 217.6 15.8% 121.3 8.8%
2025 137.8 10.0% 152.5 11.1%
2026 106.4 7.7% 121.6 8.8%
2027 43.1 3.1% 98.9 7.2%
2028 25.2 1.8% 83.1 6.0%
2029 20.3 1.5% 80.0 5.8%
2030 24.5 1.8% 82.5 6.0%
2031 15.6 1.1% 57.1 4.1%
Beyond 54.6 4.0% 160.0 11.6%
Total 1,377.0 100% 1,377.0 100%
Europe
(Shopping
Centres)
Lease expiry schedule

26
2. Continental Europe - Offices & Others
2.1. Office property market as at June 30, 202127
Take-up
Take up in the Paris region stands at 756,561 sqm at the end of H1-2021, an increase of +15% compared to H1-2020 but
-29% below the 10-year average (1,061,786 sqm). Paris CBD accounted for 160,058 sqm, +25% vs. H1-2020, and La Défense
accounted for 91,424 sqm, -42% vs. H1-2020.
23 transactions above 5,000 sqm totalling 222,712 sqm were recorded, which is broadly in line with the number of deals
historically recorded in the market (on average 25 deals of this size are seen each half) but the average deal size has reduced
from approximately 14,000 sqm to 10,000 sqm due to a cautious stance taken by companies regarding future flexibility at
work and in some cases a reduction in headcount. Four major deals have been signed in La Défense, including the Technip
lease at URW’s Trinity tower (6,863 wsqm).
Available area
The immediate supply in the Paris Region increased to 4.1 million sqm (~11% higher vs. Q4-2020) of which 26% is composed
of new or refurbished premises. The vacancy rate rose to 7.3% (vs. 6.8% as at December 31, 2020).
Differences remain significant between sub-regions, for instance, Paris CBD vacancy rate remains low at 4.5% whilst
vacancy in the La Défense district is now at 12.8%.
Rental values
Average face rents recorded in districts with higher vacancy were negatively affected in the first half, for example in the
Northern and Southern Rim, while rental values in the Paris CBD remained firm with a prime rent reaching €930 per sqm.
In La Défense the prime rent was broadly stable at €550 per sqm.
In an increasingly selective market, the achievement of prime face rents is being achieved via a notable increase in incentives
(reaching 29% of face rent in La Défense and 16% in Paris CBD compared to 27% and 13% respectively, at the end of 2020).
2.2. Activity
Consolidated NRI amounted to €28.3 Mn, a -19.9% decrease due primarily to the impact of the disposal of Novotel Lyon
Confluence in May 2020, SHiFT in January 2021 and Les Villages 3, 4 and 6 in March 2021.
Figures may not add up due to rounding.
The decrease of -€7.1 Mn breaks down as follows:
▪ +€2.1 Mn resulting mainly from assets in the pipeline (Gaîté and Pullman Montparnasse Hotel);
▪ +€0.3 Mn due to currency effects of SEK;
▪ -€1.2 Mn due to Trinity delivery;
▪ -€10.5 Mn due to the impact of the disposal of SHiFT and Les Villages 3, 4 & 6 and the Novotel Lyon Confluence in
May 2020;
▪ The like-for-like NRI growth was +€2.3 Mn (+10.8%) thanks to leasing in Versailles Chantiers and Le Sextant and
positive charge settlement in CNIT.
27 Sources: Immostat; BNP Paribas Real Estate.
H1-2021 H1-2020 %
France 18.6 26.5 -29.8%
Nordics 5.5 4.9 10.7%
Other countries 4.2 3.9 8.8%
Total NRI 28.3 35.4 -19.9%
Region
Net Rental Income (€Mn)

27
Figures may not add up due to rounding.
In France, 97.1% of H1-2021 rents billed were collected.
19,155 weighted square meters (wsqm) were leased in standing assets, including 12,608 wsqm in France and 6,547 wsqm in
the Nordics.
The ERV of vacant office space in operation amounted to €27.2 Mn, representing an EPRA vacancy rate of 29.0% (27.2%),
of which €25.0 Mn or 33.8% (30.6%) in France. This vacancy rate includes the Trinity tower delivered in Q4-2020, which is
currently 21% let, following leases signed with Technip and Welkin & Meraki (a premium flexible office space player).
2.3. Lease Expiry Schedule
Figures may not add up due to rounding.
H1-2021 H1-2020 %
France 15.4 13.7 11.8%
Nordics 4.5 4.1 11.3%
Other countries 4.2 3.9 6.8%
Total NRI Lfl 24.1 21.7 10.8%
Region
Net Rental Income (€Mn)
Like-for-like
MGR (€Mn)
at date of next
break option
As a % of
total
MGR (€Mn)
at expiry date
As a % of
total
Expired 0.0 0.1% 0.0 0.1%
2021 3.9 6.7% 2.9 5.0%
2022 8.3 14.4% 4.9 8.4%
2023 5.8 9.9% 5.2 8.9%
2024 8.2 14.1% 1.6 2.7%
2025 14.8 25.6% 11.4 19.6%
2026 3.6 6.2% 3.1 5.3%
2027 0.8 1.4% 11.8 20.4%
2028 4.7 8.1% 4.9 8.4%
2029 0.8 1.4% 2.4 4.1%
2030 4.5 7.8% 5.7 9.8%
2031 0.1 0.2% 0.1 0.1%
Beyond 2.4 4.1% 4.2 7.2%
Total 58.0 100% 58.0 100%
Europe
(Offices &
Others)
Lease expiry schedule

28
3. Convention & Exhibition
The first half of 2021 was considerably impacted by COVID-19, with a ban on all events over the majority of this period
(only exams and private sales were authorised).
Since May 19, 2021, the situation has evolved, first allowing only professional events such as congresses and corporate events
with a limited capacity of 35% of the normal attendees and a maximum 800 of indoor participants, applicable until June 9.
From June 9 to June 29, these measures were further amended to:
▪ Increase the maximum capacity for congresses and corporate events to 65% of the normal attendees and a maximum
5,000 participants;
▪ Allow all exhibitions with a limited capacity of 50% of normal attendees and maximum 5,000 participants;
▪ Require attendees to have a negative COVID-19 test or proof of vaccination for any events with more than 1,000
attendees.
From June 30, all events are allowed with no capacity constraints, however a negative COVID-19 test or proof of vaccination
remains required for attendees at events with more than 1,000 people, until at least September 30.
In June, Viparis hosted two main events: the ‘Congrès de la Société de Réanimation de Langue Française’ (SRLF) at Palais
de Congrès de Paris with 2,500 attendees; and Vivatech, Europe’s largest startup and tech event, with 26,000 attendees, at
Porte de Versailles.
In total, 69 events were held in Viparis venues through June 30, of which 5 exhibitions, 5 congresses and 59 corporate events
(mainly exams and private sales) compared to the 125 and 405 events held in H1-2020 and H1-2019, respectively.
In response to the challenges, Viparis implemented strong cost saving measures, including instituting “partial activity” for
all employees, reducing operating and administrative costs, renegotiating ground rents with some of its landlords and reducing
or delaying all non-essential capital expenditures.
Viparis’ EBITDA amounted to -€1.5 Mn compared to €21.1 Mn in H1-2020 and €87.6 Mn in H1-2019. The decrease is
entirely attributable to the impact of COVID-19 since the initial restrictions in March 2020.
Currently, the Group expects a restart of activity in Q4-2021 with 86 events booked (signed) for the last quarter (34
exhibitions, 24 congresses and 28 corporate events) and 158 events pre-booked in total for Q4-2021 (79 exhibitions, 37
congresses and 42 corporate events). The current level of pre-booking for 2022 stands at 299 events (of which 80 bookings),
of which 96 in the first quarter, a level c. 30% below a comparable “normal” year pre-COVID (2018).
4. US Business Review
Leasing activity
Although the US centres were able to trade throughout the first half, with partial restrictions, (in contrast to most of the
Group’s European centres) the crisis continued to impact lease signings in H1-2021 as tenant negotiations often took longer
to complete. Over the past month, the leasing pipeline is showing signs of recovery as retail sales rebound and move towards
exceeding 2019 levels for certain sectors.
In the period ending on June 30, 2021, 555 leases (190 relettings and 365 renewals) were signed on standing assets,
representing 1,876,397 sq. ft. and $68.5 Mn of MGR28 compared to 314 leases in H1-2020 and 532 leases for the full 2020.
The uplift on relettings and renewals was -12.9%. In the context of a challenging market characterised by conditions more
favourable for tenants than landlords, the Group has selectively undertaken shorter term leases including a higher SBR
component, to speed up negotiations, and to mitigate vacancy until economic conditions improve. As a result, between 12
and 36 months were a larger proportion than normal, with an average MGR uplift of -19.0%, while for leases longer than 36
months MGR uplifts were less affected at +2.9%.
In addition, 19 leases were signed on 80,000 sq. ft. of pipeline project space, mainly at Westfield Valley Fair (11 deals),
Westfield Topanga (three deals), and Westfield Garden State Plaza (two deals) compared to 21 leases in H1-2020 and 32
leases for the full 2020.
28 In addition, the Group signed 14 deals below one year maturity.

29
The letting pipeline on standing assets has a solid level of activity with c. 500 deals approved29, broadly consistent with the
H1-2019 level.
Key leasing deals executed in H1-2021 included:
DNVB:
▪ Brik + Clik (an experiential brand curation concept) in Westfield World Trade Center.
Entertainment:
▪ Little Kitchen Academy (cooking school for children) in Westfield Century City.
Experiential fashion:
▪ Diesel in Westfield Garden State Plaza and Westfield Valley Fair – first to URW’s portfolio;
▪ TravisMathew (golf and lifestyle brand) in Westfield Galleria at Roseville and Westfield Old Orchard;
▪ Aerie/Aerie & Offline in Westfield Garden State Plaza, Westfield Montgomery, Westfield Old Orchard, Westfield Plaza
Bonita, Westfield Southcenter and Westfield Valley Fair;
▪ Savage X Fenty (lingerie brand in conjunction with Rihanna, first long-term concept store) in Westfield Culver City;
▪ Marine Layer in Westfield Century City.
Luxury:
▪ YSL (Saint Laurent) in Westfield Galleria at Roseville;
▪ Hermès in Westfield Topanga.
Food and beverage:
▪ Bar Siena (second location, first in a mall) in Westfield Old Orchard;
▪ Havana Grill in Westfield Mission Valley;
▪ Shake Shack in Westfield Montgomery and Westfield Culver City;
▪ Killney Kopitiam in Westfield Valley Fair;
▪ Baekjeong Koren BBQ in Westfield Valley Fair;
▪ Sweetgreen in Westfield World Trade Center.
Health and beauty:
▪ Versed (skincare brand, first in a mall) in Westfield Century City;
▪ One Medical in Westfield Old Orchard;
▪ Madison Reed in Westfield Garden State Plaza and Westfield Old Orchard – first to URW’s portfolio.
Sports/Fitness/Athleisure:
▪ JD Sports in Westfield Valley Fair and Westfield North County;
▪ Fabletics in Westfield Montgomery and Westfield Galleria at Roseville.
In addition, a number of key stores were opened during this period, including Panerai/IWC/Jaeger Dior Couture and the first
Christian Louboutin in URW’s portfolio in Westfield Valley Fair, Lululemon (expanded store) in Westfield San Francisco
Centre and the first Paris Saint Germain football club store in the US in Westfield Century City. BümoWork also opened
their innovative co-working daycare concept in Westfield Century City.
The Group also signed and opened a new concept with Kitchen United in Westfield Valley Fair – MIX at Westfield – which
operates a facility offering customers the ability to order from multiple restaurants for on-site pick up, locker collection or
delivery.
29 Subject to signed LOI or terms agreed.

30
Commercial Partnerships and Marketing
Commercial Partnerships revenue in H1-2021 amounted to $13.4 Mn, down -$11.5 Mn (-46.2%) from H1-2020 or -$20.4 Mn
(-60.4%) vs. H1-2019. The COVID-19 health crisis impacted all revenue categories, including Media (-47.7%), Retail
(-37.2%) and Brand Partnerships (-47.0%).
With the US centres open (under partial restrictions) throughout H1-2021, commercial partnerships activity resumed,
however there remained an impact from the COVID-19 crisis given its on-going effect on footfall throughout the period. The
digital out of home media market has been hit hard in New York (Westfield World Trade Center / Fulton) and did not pick
up in Q2. Additionally, the entertainment media companies on the West Coast have deferred to more traditional static
billboards and TV advertising rather than shopping centre environments. Despite this, select key media campaigns and
physical activations took place in the first half, including:
▪ Pooch Perfect (ABC television show) fan event at Westfield Century City;
▪ Barry’s Outdoors & SoulCycle Outside activation at Westfield Century City;
▪ Spring in Living Color event at Westfield Garden State Plaza, with over 6,000 customer visits and 3,000 new Instagram
followers, driving over $1 Mn in retail sales;
▪ Sugar Rush at Westfield Topanga, a candy themed outdoor experience, which drew 140,000 visitors; and
▪ Gift With Purchase campaigns for Mother’s Day in Westfield Garden State Plaza, Valentine’s Day in Westfield Valley
Fair and Westfield UTC and Spring Luxury in Westfield Topanga generated retail sales of >$600K.
Airports
Total YTD enplanements are -5% (+20% Domestic, -60% International) vs. H1-2020 and -52% (-37% Domestic, -81%
International) vs. H1-2019. Trends are accelerating positively on Domestic enplanements with a May decrease vs. 2019
limited to -12% (vs. -58% in January). International passenger levels remain low at -75% vs. 2019 (vs. -84% in January).
Travel over the July 4 holiday weekend surpassed even 2019 levels with the TSA screening more than 10 million passengers
over a five-day period, a trend that is expected to continue through the summer.
Net Rental Income and Vacancy (including airports)
The total net change in NRI amounted to +$2.2 Mn and breaks down as follows:
▪ +$6.1 Mn from the acquisitions (Westfield Brandon, Westfield Trumbull and Westfield Palm Desert);
▪ +$5.4 Mn mainly due to Westfield Valley Fair extension;
▪ -$0.8 Mn due to assets transferred in pipeline;
▪ -$8.5 Mn mainly due to the foreclosure of Westfield Countryside, Westfield Citrus Park, Westfield Sarasota and
Westfield Broward and the disposal of Westfield Meriden and Westfield Siesta Key;
▪ Flat NRI like-for-like growth (+0%), mostly due to reversal of doubtful debtors provisions thanks to better collection
and positive SBR, partly offset by negative rents evolution, higher ground leases due on the airport business (following
rent relief in 2020) and Commercial Partnerships.
Excluding airports, the like-for-like NRI stood at +$7.5 Mn, i.e. +3.6%.
Converted into euros, the +$2.2 Mn NRI in the US decreased by -€22.1 Mn i.e. -8.0% due to the strengthening of the euro
against US Dollar.
As at June 30, 2021, the Financial vacancy30 was 14.0% ($171 Mn), up by +90 bps from December 31, 2020 (13.1%, i.e.
$162Mn), of which 14.1% (+150 bps) in Flagships (negatively impacted by Westfield World Trade Center and Westfield
San Francisco Centre, 12.4% excluding these two centres) and 14.0% (-30 bps) in Regionals. The increase in the financial
vacancy in H1-2021 was generated by retailer bankruptcies, additional store closures, not fully compensated by leasing
activity.
Occupancy on a GLA31 basis was 86.0% as at June 30, 2021, (up by +350 bps from December 31, 2020).
30 Financial vacancy in accordance with the EPRA methodology. 31 GLA occupancy taking into account all areas.

31
Lease Expiry Schedule
Figures may not add up due to rounding.
MGR (€Mn)
at date of next
break option
As a % of
total
MGR (€Mn)
at expiry date
As a % of
total
Expired 3.6 0.7% 3.6 0.7%
2021 14.4 2.8% 14.4 2.8%
2022 68.6 13.2% 68.6 13.2%
2023 53.9 10.4% 53.9 10.4%
2024 57.3 11.0% 57.3 11.0%
2025 53.7 10.4% 53.7 10.4%
2026 52.7 10.2% 52.7 10.2%
2027 49.9 9.6% 49.9 9.6%
2028 60.2 11.6% 60.2 11.6%
2029 32.7 6.3% 32.7 6.3%
2030 25.0 4.8% 25.0 4.8%
2031 23.1 4.5% 23.1 4.5%
Beyond 23.6 4.5% 23.6 4.5%
Total 518.8 100% 518.8 100%
US
(Shopping
Centres +
Offices &
Others)
Lease expiry schedule

32
IV. CORPORATE SOCIAL RESPONSIBILITY (“CSR”)
URW pursues its strong emphasis on its Better Places 2030 CSR strategy with tangible efforts and projects delivered around
each of its three pillars:
▪ Better Spaces: environmental performance remains at the heart of URW’s operations and development projects. o Significant achievement on the Group’s major development project of Westfield Hamburg: First major project
to receive the new certification for sustainable building sites by the German Green Building Council (DGNB);
o Continued roll-out of URW’s environmental certification policy for standing assets with two additional US
assets certified BREEAM In Use during H1-2021 (four in total): Westfield Garden State Plaza and Westfield
UTC;
o Delivery of the first two phases of the largest solar (PV) installation on a shopping centre in Europe at Shopping
City Süd in Austria.
▪ Better Communities: an updated target and strong tangible results delivered over H1-2021.
o New key target: €20 Mn of social value generated by URW community-oriented projects in 2021 (vs. €17 Mn
in 2020), following the creation of the URW Social Value framework, a methodology to translate the social
impact generated by the Group initiatives into a monetary value;
o First digital URW for Jobs at Nacka Forum (Sweden) in partnership with Adecco, resulting in 600 applications
for 121 job offers; o Large scale community support programmes delivered such as the backing in the UK by URW and Ocean
Outdoor of the #LetsDoLondonBetter Campaign to support emerging artistic talent;
o Accelerated pace on responsible consumption trends with Grand Prix du Commerce integrating CSR as a key
element, short term integration of locally sourced DNVBs in the UK, second-hand concepts in France and in
the UK, as well as the US expansion of the Group’s partnership with Too Good To Go;
o Vaccination centres were open in URW shopping centres (including Westfield Vélizy 2, Westfield Les
4 Temps, Westfield Stratford City, Westfield Chodov, Westfield Garden State Plaza and La Maquinista) and
Viparis’ sites, with c. 500,000 jabs given.
▪ Better Together: maintaining high engagement levels on D&I and CSR. o Launch of the ‘Be You at URW Charter’ signed by the Management Board and Executive Committee
demonstrating their commitment and accountability to increasing diversity, inclusion and equality within the
Group;
o Active internal and external participation in key D&I events over H1-2021 with International Women’s Day
and LGBTQ+ Pride actions and continued roll out of Unconscious Bias training offered to all employees (42%
already received the training); o Launch of an internal e-learning around Better Places 2030 allowing all employees to learn more on the CSR
strategy and areas of action to foster engagement. Specific high-level training on climate change has been
delivered to the members of the Executive Committee;
o Wide number of activities during Earth Day including the conclusion of a project launched in September 2019
with the planting of 10,000 trees in the city of Wroclaw.
Strengthening its commitment to act sustainably and to the Better Places 2030 strategy, URW also successfully closed a new
five-year €3.1 Bn sustainability-linked revolving credit facility tied to the Sustainable Target Score of the Group. This score
is based on KPIs including energy intensity, GHG emissions reduction, BREEAM In-Use certification and CSR training of
URW employees.
The Group’s ambitious CSR agenda was again recognised by equity and debt investors as a value creation driver for its
stakeholders. In H1-2021, URW membership in the main ESG indices was confirmed, and the Group’s CSR achievements
were reflected in ratings:
▪ Ratings: o V.E (ex. VigeoEiris) ranked URW 2nd in the RE sector in May 2021 with an “advanced” score on Energy
Transition;
o Sustainalytics ranked URW 1st in RE industry and of its rating universe in May 2021 with a “Negligible”
risk rating.
▪ Indices: o Integration into the Euronext CAC 40 ESG index on March 22;
o Euronext Vigeo indices32: World 120, Euro 120, Europe 120 and France 20.
For more information on Better Places 2030, please refer to URW’s 2020 Universal Registration Document.
32 As at June 30, 2021.

33
V. H1-2021 RESULTS
The results of the Group presented below are based on the Consolidated income statement in a proportionate format, in which
the joint-controlled entities are accounted for on a proportionate basis instead of being accounted for using the equity method
under IFRS. The Group has structured its internal operational and financial reporting according to this proportionate format.
Unless otherwise indicated, all references below relate to the period ended June 30, 2021, and the comparisons relate to the
same period in 2020.
Gross Rental Income
The Gross Rental Income (“GRI”) amounted to €1,070.6 Mn (€1,395.9 Mn), a decrease of -23.3%. This decrease resulted
mainly from the negative impact of COVID-19 (rent relief, bankruptcies and higher vacancy) and the impact of disposals in
the course of 2020 and H1-2021.
Figures may not add up due to rounding.
H1-2021 H1-2020 %
France 225.7 340.2 -33.7%
Central Europe 78.2 112.3 -30.3%
Spain 68.8 81.4 -15.6%
Nordics 60.3 63.9 -5.7%
Austria 42.0 41.6 1.0%
Germany 43.9 75.0 -41.5%
The Netherlands 36.3 33.8 7.3%
Subtotal Continental Europe-Shopping Centres 555.2 748.3 -25.8%
United Kingdom 73.5 86.9 -15.4%
Subtotal Europe-Shopping Centres 628.7 835.2 -24.7%
Offices & Others 29.9 42.6 -29.7%
C&E 30.7 59.0 -48.1%
Subtotal Europe 689.3 936.8 -26.4%
United States - Shopping Centres 374.3 449.1 -16.7%
United States - Offices & Others 7.1 10.1 -29.3%
Subtotal US 381.4 459.1 -16.9%
Total URW 1,070.6 1,395.9 -23.3%
Region
Gross Rental Income (€Mn)
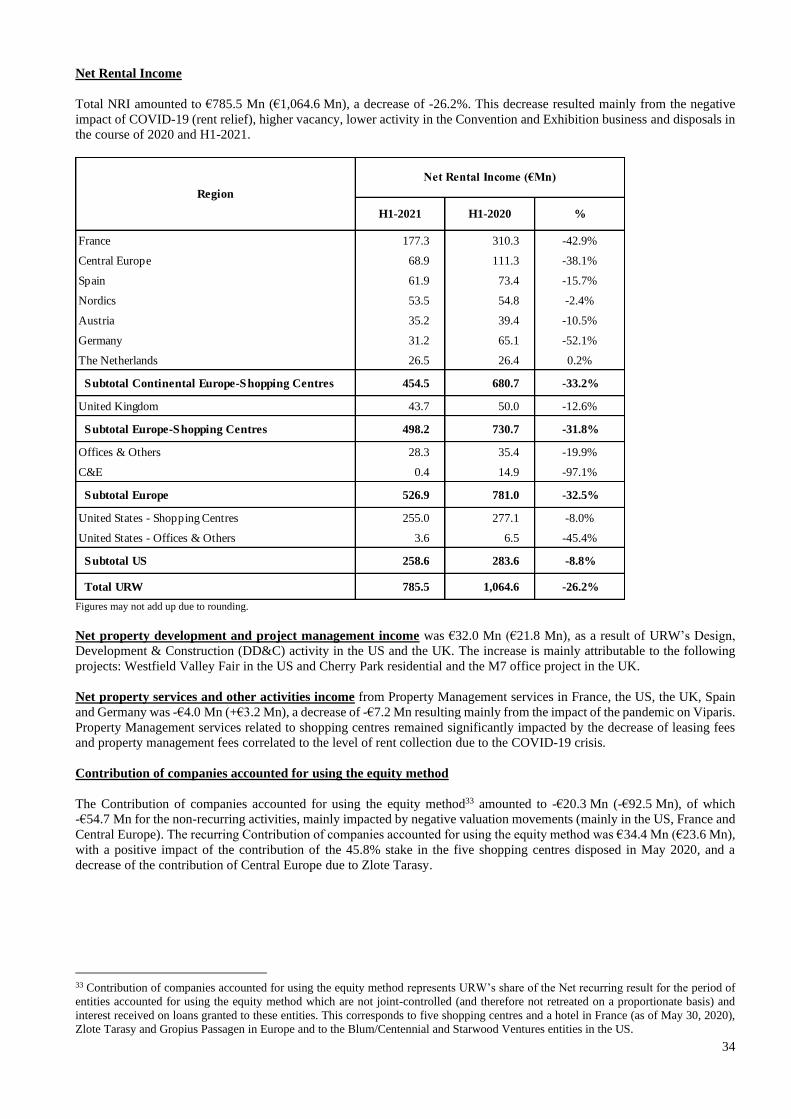
34
Net Rental Income
Total NRI amounted to €785.5 Mn (€1,064.6 Mn), a decrease of -26.2%. This decrease resulted mainly from the negative
impact of COVID-19 (rent relief), higher vacancy, lower activity in the Convention and Exhibition business and disposals in
the course of 2020 and H1-2021.
Figures may not add up due to rounding.
Net property development and project management income was €32.0 Mn (€21.8 Mn), as a result of URW’s Design,
Development & Construction (DD&C) activity in the US and the UK. The increase is mainly attributable to the following
projects: Westfield Valley Fair in the US and Cherry Park residential and the M7 office project in the UK.
Net property services and other activities income from Property Management services in France, the US, the UK, Spain
and Germany was -€4.0 Mn (+€3.2 Mn), a decrease of -€7.2 Mn resulting mainly from the impact of the pandemic on Viparis.
Property Management services related to shopping centres remained significantly impacted by the decrease of leasing fees
and property management fees correlated to the level of rent collection due to the COVID-19 crisis.
Contribution of companies accounted for using the equity method
The Contribution of companies accounted for using the equity method33 amounted to -€20.3 Mn (-€92.5 Mn), of which
-€54.7 Mn for the non-recurring activities, mainly impacted by negative valuation movements (mainly in the US, France and
Central Europe). The recurring Contribution of companies accounted for using the equity method was €34.4 Mn (€23.6 Mn),
with a positive impact of the contribution of the 45.8% stake in the five shopping centres disposed in May 2020, and a
decrease of the contribution of Central Europe due to Zlote Tarasy.
33 Contribution of companies accounted for using the equity method represents URW’s share of the Net recurring result for the period of
entities accounted for using the equity method which are not joint-controlled (and therefore not retreated on a proportionate basis) and
interest received on loans granted to these entities. This corresponds to five shopping centres and a hotel in France (as of May 30, 2020),
Zlote Tarasy and Gropius Passagen in Europe and to the Blum/Centennial and Starwood Ventures entities in the US.
H1-2021 H1-2020 %
France 177.3 310.3 -42.9%
Central Europe 68.9 111.3 -38.1%
Spain 61.9 73.4 -15.7%
Nordics 53.5 54.8 -2.4%
Austria 35.2 39.4 -10.5%
Germany 31.2 65.1 -52.1%
The Netherlands 26.5 26.4 0.2%
Subtotal Continental Europe-Shopping Centres 454.5 680.7 -33.2%
United Kingdom 43.7 50.0 -12.6%
Subtotal Europe-Shopping Centres 498.2 730.7 -31.8%
Offices & Others 28.3 35.4 -19.9%
C&E 0.4 14.9 -97.1%
Subtotal Europe 526.9 781.0 -32.5%
United States - Shopping Centres 255.0 277.1 -8.0%
United States - Offices & Others 3.6 6.5 -45.4%
Subtotal US 258.6 283.6 -8.8%
Total URW 785.5 1,064.6 -26.2%
Region
Net Rental Income (€Mn)

35
Figures may not add up due to rounding.
Administrative expenses (including Development expenses) amounted to -€105.4 Mn, a decrease of +€7.5 Mn due to cost
savings. As a percentage of NRI from shopping centres and offices, administrative expenses were 13.4%, vs. 10.8% in H1-
2020, as a result of the lower NRI partly compensated by cost savings.
The Group launched a number of cost saving initiatives to generate both short- and long-term savings. The US and UK
activities were restructured to ensure optimisation of their processes and tools while simplifying the organisation, leading to
substantial and sustainable savings. The development pipeline was also revised, leading to an adjustment of the corresponding
staff. In addition, furlough plans and “partial activity” schemes were activated. Lastly, non-staff related costs were cut.
Acquisition and other costs amounted to a non-recurring amount of -€0.9 Mn (-€21.5 Mn, mainly due to the integration
costs of Westfield, including severance costs in the US and the UK, the re-branding of ten shopping centres in Continental
Europe, consulting, IT system integration and the shutdown of the Sydney office).
Results on disposal of investment properties were +€101.1 Mn (-€46.6 Mn), reflecting the impact of the disposals of
SHiFT, Les Villages 3, 4 and 6 and Le Blériot in France, Q-Huset office building in Täby in Sweden, a land plot in Osnabrück
in Germany and the disposal of a 60% stake in Aupark in Slovakia.
The gain in the US is due to the foreclosures of Westfield Sarasota, Westfield Citrus Park, Westfield Countryside and
Westfield Broward in the US net of the derecognition of the mortgage debt financing these assets, generating in total an
accounting capital gain.
2021/2020
Recurring
activities
Non-
recurring
activities
TotalRecurring
activities
Non-
recurring
activities
Total
Change in
recurring
activities
France 21.8 3.3 - 18.5 3.2 30.1 - 26.9 - 18.6
Central Europe 9.5 31.1 - 21.6 - 16.8 34.3 - 17.5 - 7.3 -
Germany 0.2 5.0 - 4.8 - 1.4 4.0 - 2.6 - 1.2 -
Subtotal Continental Europe-Shopping Centres 31.5 39.5 - 7.9 - 21.4 68.4 - 47.0 - 10.1
United Kingdom - - - - - - -
Subtotal Europe-Shopping Centres 31.5 39.5 - 7.9 - 21.4 68.4 - 47.0 - 10.1
Offices & Others - - - - - - -
C&E - - - - - - -
Subtotal Europe 31.5 39.5 - 7.9 - 21.4 68.4 - 47.0 - 10.1
United States 2.8 15.2 - 12.4 - 2.2 47.7 - 45.4 - 0.6
Subtotal US 2.8 15.2 - 12.4 - 2.2 47.7 - 45.4 - 0.6
Total URW 34.4 54.7 - 20.3 - 23.6 116.1 - 92.5 - 10.7
Region
Contribution of companies accounted for using the equity method (€Mn)
H1-2021 H1-2020
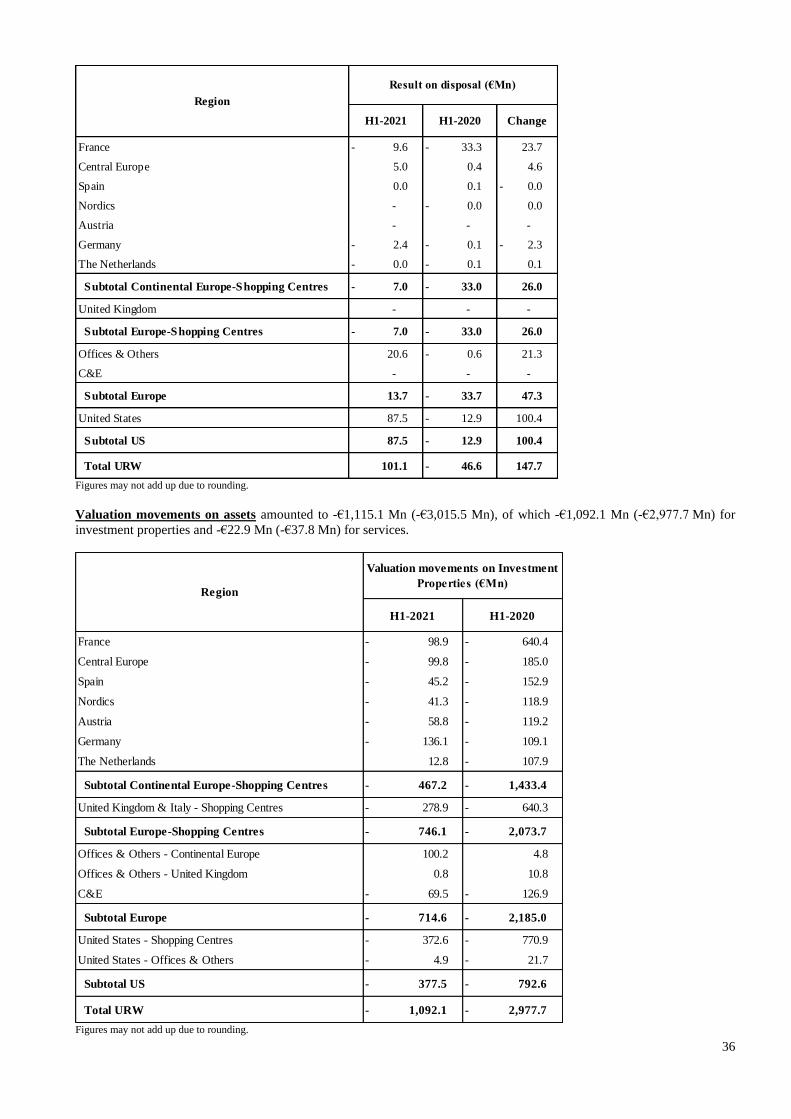
36
Figures may not add up due to rounding.
Valuation movements on assets amounted to -€1,115.1 Mn (-€3,015.5 Mn), of which -€1,092.1 Mn (-€2,977.7 Mn) for
investment properties and -€22.9 Mn (-€37.8 Mn) for services.
Figures may not add up due to rounding.
H1-2021 H1-2020 Change
France 9.6 - 33.3 - 23.7
Central Europe 5.0 0.4 4.6
Spain 0.0 0.1 0.0 -
Nordics - 0.0 - 0.0
Austria - - -
Germany 2.4 - 0.1 - 2.3 -
The Netherlands 0.0 - 0.1 - 0.1
Subtotal Continental Europe-Shopping Centres 7.0 - 33.0 - 26.0
United Kingdom - - -
Subtotal Europe-Shopping Centres 7.0 - 33.0 - 26.0
Offices & Others 20.6 0.6 - 21.3
C&E - - -
Subtotal Europe 13.7 33.7 - 47.3
United States 87.5 12.9 - 100.4
Subtotal US 87.5 12.9 - 100.4
Total URW 101.1 46.6 - 147.7
Region
Result on disposal (€Mn)
H1-2021 H1-2020
France 98.9 - 640.4 -
Central Europe 99.8 - 185.0 -
Spain 45.2 - 152.9 -
Nordics 41.3 - 118.9 -
Austria 58.8 - 119.2 -
Germany 136.1 - 109.1 -
The Netherlands 12.8 107.9 -
Subtotal Continental Europe-Shopping Centres 467.2 - 1,433.4 -
United Kingdom & Italy - Shopping Centres 278.9 - 640.3 -
Subtotal Europe-Shopping Centres 746.1 - 2,073.7 -
Offices & Others - Continental Europe 100.2 4.8
Offices & Others - United Kingdom 0.8 10.8
C&E 69.5 - 126.9 -
Subtotal Europe 714.6 - 2,185.0 -
United States - Shopping Centres 372.6 - 770.9 -
United States - Offices & Others 4.9 - 21.7 -
Subtotal US 377.5 - 792.6 -
Total URW 1,092.1 - 2,977.7 -
Region
Valuation movements on Investment
Properties (€Mn)

37
The negative valuation movements on investment properties resulted mainly from an increase of Discount Rates and Exit
Capitalisation Rates used by appraisers and from the estimated impact on the future cash-flows of COVID-19. Please refer
to the section “Property portfolio and Net Asset Value” for further detail.
Figures may not add up due to rounding.
The -€22.9 Mn of valuation movements in services include the amortisation for the US and UK related to DD&C and property
management and airport contracts recognised as intangible assets in the Consolidated statement of financial position. These
are amortised over the duration of these contracts.
Impairment of goodwill amounted to -€6.1 Mn in H1-2021 vs. -€1,620.0 Mn34 in 2020.
Figures may not add up due to rounding.
Please refer to the section “Goodwill” for further detail.
34 On a proportionate basis. Under IFRS, there was no impairment of the goodwill in H1-2021.
H1-2021 H1-2020
Services Continental Europe 1.2 - 1.2 -
Subtotal Continental Europe 1.2 - 1.2 -
Net Property development - Amortisation 4.1 - 7.0 -
Other property services - Amortisation 17.7 - 29.5 -
Subtotal US and UK 21.7 - 36.6 -
Total URW 22.9 - 37.8 -
Region
Valuation movements on services
(€Mn)
H1-2021 2020
France - 0.8 -
Central Europe - 0.3 -
Spain - 103.8 -
Nordics - 132.2 -
Austria - -
Germany 6.1 - 102.0 -
The Netherlands - -
C&E - 8.2 -
Other - -
Subtotal Continental Europe 6.1 - 347.3 -
United Kingdom - 434.1 -
Subtotal Europe 6.1 - 781.4 -
United States - 838.6 -
Subtotal US - 838.6 -
Total URW 6.1 - 1,620.0 -
Region
Impairment of goodwill (€Mn)

38
Financing result
Net financing costs (recurring) totalled -€257.6 Mn (after deduction of capitalised financial expenses of €28.9 Mn allocated
to projects under construction) (-€247.0 Mn). This increase of -€10.6 Mn includes the impact of measures taken to preserve
liquidity during COVID-19 crisis and increased financial costs following the downgrades of URW’s rating in 2020 and H1-
2021.
URW’s average cost of debt35 for the period was 1.9% (1.7% in 2020). URW’s financing policy is described in the section
“Financial resources”.
Non-recurring financial result amounted to +€28.9 Mn:
▪ -€2.1 Mn mark-to-market of the ORNANEs issued in 2014 and 2015;
▪ +€31.0 Mn mainly due to the mark-to-market of derivatives and exchange rate losses resulting from the revaluation of
bank accounts and revaluation of debt issued in foreign currencies, partially offset by the revaluation of preference shares.
URW recognises the change in value of its derivatives directly in the income statement.
Income tax expenses are due to the Group’s activities in countries where specific tax regimes for property companies36 do
not exist or are not used by the Group.
The total income tax expenses for H1-2021 amounted to a credit of +€98.9 Mn. Income tax allocated to the recurring net
result amounted to +€12.9 Mn (-€17.0 Mn), mainly due to a tax credit in the US and the overall impact of COVID-19 resulting
in a decrease of the taxable income of Viparis, service companies and other taxable companies. Non-recurring income tax
amounted to a credit of +€85.9 Mn (+€171.5 Mn) mainly due to the reversal of deferred tax liabilities as a consequence of
the negative valuation movements.
External non-controlling interests amounted to +€40.1 Mn comprising recurring and non-recurring external non-
controlling interests. The recurring external non-controlling interests amounted to -€27.8 Mn (-€69.8 Mn) and mainly relate
to French shopping centres (-€35.7 Mn, mainly Westfield Les 4 Temps, Westfield Parly 2 and Westfield Forum des Halles),
to the stake of the CCIR in Viparis (+€16.0 Mn) and to URW Germany and Ruhr Park (-€3.8 Mn). The non-recurring non-
controlling interests amounted to +€67.9 Mn (+€253.6 Mn), due primarily to the impact of negative valuation movements.
Net result for the period attributable to the holders of the Stapled Shares was a loss of -€420.7 Mn (-€3,525.9 Mn). This
figure breaks down as follows:
▪ €472.0 Mn of recurring net result (€667.5 Mn) (as a result of COVID-19 crisis, increase in vacancy, disposals in 2020
and H1-2021 and the increase of net financing costs);
▪ -€892.7 Mn of non-recurring net result37 (-€4,193.4 Mn) mainly because of negative valuation movements and negative
mark-to-market of financial instruments.
The Adjusted Recurring Earnings38 reflect a profit of €448.1 Mn.
The average number of shares outstanding was 138,495,491 (138,401,778). The increase is mainly due to the issuance of
performance shares in 2020 and H1-2021. The number of shares outstanding as at June 30, 2021, was 138,594,416.
EPRA Recurring Earnings per Share (REPS) came to €3.41 (€4.82), a decrease of -29.3%.
Adjusted Recurring Earnings per Share (AREPS)38 came to €3.24 (€4.65), a decrease of -30.4% due mainly to the
impact of the COVID-19 crisis, the disposals made in 2020 and H1-2021 and the increase of cost of debt.
35 Average cost of debt = Recurring financial expenses (excluding those on financial leases and related to partners’ current accounts) +
capitalised financial expenses (excluding non-recurring financial expenses such as mark-to-market and termination costs of financial
instruments including bonds repurchased, currency impact) / average net debt over the period. 36 For example, in France: SIIC (Société d’Investissements Immobiliers Cotée); and in the US: REITs. 37 Include valuation movements, disposals, mark-to-market and termination costs of financial instruments, including bond tender premiums,
impairment of goodwill or reversal of negative goodwill and other non-recurring items. 38 Under IFRS, the Hybrid Securities are accounted for as shareholders’ equity. The Adjusted Recurring Earnings are calculated based on
the Recurring net result for the period attributable to the holders of the Stapled Shares minus the coupon on the Hybrid Securities (from
June 1, 2018).

39
VI. GOODWILL39
Impairment tests-method
According to IFRS, the recoverable value of goodwill is tested annually or whenever there is an indication that an asset may
be impaired at each reporting date. Due to COVID-19 and the shutdown of most of the Group’s shopping centres during
several months in H1-2021, the Group completed a full testing of its goodwill for the closing of accounts as at June 30, 2021,
as well as for previous closing periods since December 2018. Although using the same method and impairment test model
as the ones used by the Group in 2018 and 2019, some adjustments were made in order to reflect current uncertainties about
the impact of COVID-19 on the broader economy, the shape of the economic recovery and the impact on the business of the
Group.
The impairment tests of the goodwill allocated to each geographical segment as per June 30, 2021, were based on:
▪ The results of the 5-year Business Plan (“5YBP”) exercise for 2021-2025 per geographical segment (including detailed
profit & loss statements, proposed capital expenditures and disposals) with a review per asset and geographical segment
of the estimated impact of the COVID-19 crisis;
▪ The discount rates before tax per geographical segment based on a calculation of the WACC per region which reflect the
current market assessment of the interest rates and the specific risks associated with each geographical segment as at June
30, 2021. These discount rates were also compared with the discount rates used by appraisers for the valuation of
Investment Properties as at June 30, 2021, and the consistency between those was ensured;
▪ An allocation of the Group’s corporate administrative expenses to the geographical segments, as a percentage of their
respective NRI;
▪ A discounted cash-flow calculation for each geographical segment on a 10-year basis, consistent with the method applied
by the Group’s appraisers, and a discounted terminal value, to which a long-term growth rate estimated as at June 30,
2021, is applied.
The value in use calculated for each geographical segment was then compared to the net asset value of each geographical
segment, including the intangible assets and goodwill allocated, as disclosed in the notes to the Consolidated Financial
Statements as at June 30, 2021.
Impairment tests-results per region
The value of the goodwill allocated to France Retail, Central Europe, Austria and Germany was found justified as at June 30,
2021. The decrease of -€23.0 Mn in Central Europe is due to the impact of the disposal of a 60% stake in Aupark, which
goodwill was justified by tax optimisation.
Breakdown of the goodwill
There was no impairment of the goodwill in H1-2021 (vs. -€736.4 Mn in H1-2020 and -€1,596.1 Mn in 2020).
The goodwill in the Consolidated Statement of Financial Position (IFRS) as at June 30, 2021 amounts to €1,225.1 Mn and
breaks down as follows:
Figures may not add up due to rounding.
39 This section refers to the IFRS Consolidated financial statements.
€Mn Dec. 31, 2020 Disposal Currency impact June 30, 2021
Goodwill justified by fee business 119.3 - - 119.3
Goodwill justified by tax optimisations 199.5 23.0 - - 176.6
Other goodwill 929.3 - - 929.3
Total Goodwill 1,248.1 23.0 - - 1,225.1

40
VII. CONSOLIDATED STATEMENT OF CASH FLOWS
The consolidated statement of cash flows was prepared only in IFRS, not on a proportionate basis.
Unless otherwise indicated, all references below relate to the period ended June 30, 2021, and the comparisons relate to the
same period in 2020.
Cash flow from operating activities
The total cash flow from operating activities increased to +€751.7 Mn (+€629.0 Mn) reflecting the decrease of NRI, more
than compensated by a stabilised change in working capital requirement at +€28.3 Mn (-€228.2 Mn) and higher dividend
income and result from companies accounted for using the equity method or non-consolidated (+€144.1 Mn vs. +€57.3 Mn).
Cash flow from investment activities
The cash flow from investment activities was +€439.4 Mn (+€699.6 Mn) reflecting a decrease in amounts paid for works and
acquisition of property assets to -€518.4 Mn (-€607.5 Mn) and less cash flow generated by the disposals of shares or
investment properties (+€1,112.4 Mn in total in H1-2021 vs. +€1,495.8 Mn in H1-2020).
Cash flow from financing activities
The total cash flow from financing activities amounted to -€631.9 Mn (+€1,601.1 Mn) reflecting mainly the decrease of new
debt raised in H1-2021 due to the high level of cash on hand as at end of December 2020 and disposal proceeds in H1-2021.
VIII. POST-CLOSING EVENTS On July 8, Unibail-Rodamco-Westfield signed a promissory deed of sale and leaseback agreement with a French institutional
investor for the 7 Adenauer office building in Paris (URW’s global headquarters). The Net Disposal Price of €249 Mn
represents a premium to the last unaffected book value. This transaction is subject to standard conditions precedent and is
expected to close in September 2021. 7 Adenauer is a 12,307 sqm office building located in Paris’s 16 th district.
Simultaneously with the promissory deed of sale, URW has signed a new, standard lease on the building, which will remain
its global headquarters.
On July 21, URW closed the disposal of a 45% minority stake in Shopping City Süd (138,600 sqm owned GLA) in Vienna
(Austria) to Crédit Agricole Assurances in line with the agreement signed on April 28 (see section “Investments and
divestments”). URW retains a controlling stake in the JV holding the asset and remains the asset and property manager. The
JV put in place a non-recourse 7-year mortgage loan at a 1.39% cost for a total amount of €351 Mn corresponding to a Loan-
To-Value (“LTV”) below 35% at closing.
Upon closing of these transactions, URW will have completed €1.7 Bn40, i.e. 42% of the previously announced €4.0 Bn
European disposal programme, which is expected to be completed by year-end 2022.
IX. OUTLOOK
As expected in February 2021, the Group’s performance remains significantly impacted by the COVID-19 pandemic. Despite
that, the Group has progressed on its deleveraging programme and its operational priorities with leasing activity back to 2019
levels and the successful delivery of projects in Europe and the US. The Group has also been able to reopen all activities
albeit with some remaining restrictions, such as limited capacities in some locations.
While the on-going roll out of successful vaccines supports operational stabilisation, the impact of COVID-19 is anticipated
to continue during part of H2-2021. The development of new variants and the restrictions contemplated to mitigate them
generate additional uncertainty for URW’s activities. Given this, URW is currently not providing any guidance for 2021.
URW is confident in the quality of its assets and the enduring strength of its business and teams. The Group, with its newly
reconfigured management team, is taking all necessary measures to address these challenges in the best possible manner and
strategically position URW for the future.
URW is pursuing the remainder of its disposal programme of €4.0 Bn of European assets over the next 18 months and has
put in place a taskforce to deliver a radical reduction of the Group’s exposure to the US, to complete the planned deleveraging
40 Including the sale of 45% of Shopping City Süd, previously announced, which closed in July 21.

41
process. These disposals should have a negative impact on the Group’s results. The Group’s strong liquidity position allows
it to complete these disposals over time and in an orderly fashion.

42
2. INVESTMENTS AND DIVESTMENTS
Through June 30, 2021, URW invested €451.9 Mn41, Group share, in capital expenditures in assets and on
construction, extension and refurbishment projects, compared to €528.3 Mn in H1-2020 and €737.5 Mn in H1-2019,
a slowdown mainly due to the measures taken to reduce capital expenditures in the context of COVID-19.
1. Total capital expenditures
The total investments break down as follows:
Figures may not add up due to rounding.
2. Shopping Centres
URW invested €329.8 Mn42 in its Shopping Centre portfolio:
▪ €110.1 Mn was invested in construction, extension and refurbishment projects, including mainly: Les Ateliers Gaîté,
Westfield Topanga and Solna Centrum redevelopments and extensions and Westfield Hamburg (see also section
“Development projects”);
▪ €157.2 Mn was invested in enhancement and improvement projects on standing assets, including mainly Westfield Mall
of the Netherlands, La Part-Dieu, Westfield Les 4 Temps and Shopping City Süd;
▪ Replacement Capex43 amounted to €23.6 Mn;
▪ Financial interest, eviction costs, external letting fees (internal letting fees are now included in Administrative expenses)
and other costs were capitalised for €17.3 Mn, €11.7 Mn, €3.8 Mn and €6.1 Mn, respectively.
This does not include the increase in the Group’s stake from 10% to 50% in a project in Poland (Centrum Ursynów) for a
total amount of €36.4 Mn and the acquisition of the 47.4% stake in Westfield Trumbull and Westfield Palm Desert for a total
amount of €7.3 Mn.
3. Offices & Others
URW invested €116.9 Mn in its Offices & Others portfolio:
▪ €98.6 Mn was invested in construction and refurbishment projects, mainly in France (the Triangle office building44, the
Pullman Montparnasse hotel and Gaîté office), the UK (Westfield Stratford City and Westfield London) and Germany
(Westfield Hamburg offices, residential and hotels) (see also section “Development projects”);
▪ €3.5 Mn was invested in enhancement and improvement projects on standing assets, mainly in the US and France;
▪ Replacement Capex amounted to €0.9 Mn;
▪ Financial interest and other costs capitalised amounted to €13.9 Mn.
41 On a proportionate basis, Group share. 42 Amount capitalised in asset value. 43 Replacement Capex relates to works either on equipment or the structure of a standing asset. The primary purpose of Replacement Capex
is to ensure that the asset is in good working order and / or to make minor improvements. These investments can be triggered by
obsolescence, maintaining technical performance at market levels or compliance with regulatory requirements. These amounts do not
include Replacement Capex spent as part of the TIC of extension and / or renovation projects on which the Group’s standard Return On
Investment (ROI) is expected. 44 Refundable tax for office creation.
100% Group Share 100% Group Share 100% Group Share 100% Group Share
Shopping centres 349.0 329.8 430.4 403.1 533.9 505.6 917.5 850.6
Offices & Others 116.9 116.9 119.7 119.7 193.2 191.4 229.7 229.7
Convention & Exhibition 10.1 5.3 10.6 5.5 80.8 40.6 22.9 11.8
Total Capital Expenditures 476.0 451.9 560.8 528.3 807.9 737.5 1,170.1 1,092.1
in € MnProportionate
H1-2021 2020H1-2020 H1-2019
43
4. Convention & Exhibition
URW invested €5.3Mn in its Convention & Exhibition portfolio:
▪ €0.3 Mn was invested for construction works at Porte de Versailles;
▪ €2.8 Mn was invested in enhancement and improvement projects on standing assets, mainly in Porte de Versailles;
▪ Replacement Capex amounted to €2.0 Mn;
▪ Financial interest and other costs capitalised amounted to €0.2 Mn.
5. Disposals URW defaulted on several regional malls in the US and asked the servicer of its loans for the appointment of a receiver. The
receiver was appointed by the relevant Court which transferred the management and control of each related asset. Since the
appointment dates, URW is not the owner of these assets, is not liable to the debt and cannot recognise the revenues generated
by these assets. This includes Westfield Citrus Park and Westfield Countryside in Florida with an effective transfer on January
13, 2021, the Westfield Sarasota shopping centre in Florida with an effective transfer on February 23, 2021 and Westfield
Broward, with an effective transfer on June 23, 2021. The special servicers agreed to release URW from all obligations under
the Westfield Sarasota loan and any associated guarantees, in return for a one-off payment of $10.9 Mn.
On January 21, 2021, further to an agreement entered into on October 12, 2020, URW announced the completion of the
disposal of the SHiFT office building, located in Issy-les-Moulineaux (Paris region), to a consortium of French institutional
buyers (Primonial REIM, La Française and EDF Invest). The Disposal Price45 of the transaction is €620 Mn.
On March 17, 2021, URW announced the completion of the disposals of the Les Villages 3, 4 and 6 office buildings, located
in La Défense (Paris region) to French institutional investors. Agreements for the disposals were signed in December 2020.
Village 3 was sold to an institutional fund managed by La Française Real Estate Managers on March 4, 2021. Village 4 and
6 were sold to institutional funds managed by Perial AM on March 17, 2021. The total Net Disposal Price46 of both
transactions is €215 Mn.
On April 28, URW entered into an agreement for the phased disposal of Aupark Bratislava, a 59,600 sqm Flagship destination
in Slovakia, which attracted 11.8 million visits in 2019. WOOD & Company, as transaction leader, together with its joint
venture partner Tatra Asset Management (“the Purchasers”), initially acquired a 60% interest on the basis of an agreed Total
Acquisition Cost (“TAC”) of €450 Mn (at 100%). The remaining 40% will be acquired through pre-agreed stakes in 2022,
2023 and 2024. The TAC is in line with the appraisal value. The joint venture formed by URW and the Purchasers has also
refinanced existing debt of Aupark by obtaining non-recourse bank financing of €229.5 Mn. In light of the impact of the on-
going COVID-19 pandemic, URW has provided a three-year rent guarantee equal to a maximum circa 2% of the Gross
Market Value (“GMV”) and a participative loan including an earn-out mechanism, with a maximum amount at risk equal to
circa 2% of the GMV, and a potential earn-out to URW, which applies should the returns to the Purchasers be lower than or
exceed the agreed levels. This transaction was completed on May 27, 2021. URW will continue to manage the property,
together with WOOD & Company, until the asset has been fully acquired by the Purchasers and the earn-out mechanism
settled in return for market standard property and asset management fees.
On April 28, URW also signed an agreement with Crédit Agricole Assurances to sell a 45% stake in Shopping City Süd, a
200,000 sqm Flagship destination in Vienna, Austria, which attracted close to 25 million visits in 2019. The two parties have
also established a joint venture that will see URW continue asset and property management as part of a long-term management
contract. The implied offer price for the asset is €1,065 Mn (at 100%), representing a 3% discount to the last unaffected
appraisal value (December 31, 2020). In light of the impact of the ongoing COVID-19 pandemic, URW has granted the joint
venture a two-year rental guarantee capped at circa 2% of the implied offer price (at 100%). The transaction was closed on
July 21.
URW also disposed several of minor assets: Le Blériot, an office building located in Paris region, the Q-Huset office building
located in Täby, and a land plot located in Osnabrück for a total Net Disposal Price (“NDP”) of €63 Mn47.
On July 8, URW signed a promissory deed of sale and leaseback agreement with a French institutional investor for the 7
Adenauer office building in Paris (URW’s global headquarters). The Net Disposal Price of €249 Mn represents a premium
to the last unaffected book value. This transaction is subject to standard conditions precedent and is expected to close in
September 2021. 7 Adenauer is a 12,307 sqm office building located in Paris’s 16 th district. Simultaneously with the
promissory deed of sale, URW has signed a new, standard lease on the building, which will remain its global headquarters.
45 Total Acquisition Cost (TAC) reduced by the Transaction Tax incurred by the buyer. 46 Net Disposal Price: Total Acquisition Cost incurred by the acquirer minus all transfer taxes and transaction costs. 47 Group share.

44
Upon closing of the 7 Adenauer disposal and the sale of 45% stake in Shopping City Süd, URW will have completed
€1.7 Bn of its planned €4.0 Bn European asset disposal programme. URW is in discussions on the disposal of a number
of assets.
The Group’s strong liquidity position allows it to complete these disposals over time and in an orderly fashion.

45
3. DEVELOPMENT PROJECTS AS AT JUNE 30, 2021
As at June 30, 2021, URW’s share of the Total Investment Cost (“TIC”48 and “URW TIC”49) of its development
project pipeline amounted to €3.8 Bn50, corresponding to a total of 0.6 million sqm of Gross Lettable Area (“GLA”51)
to be re-developed or added to the Group’s standing assets.
1. Pipeline variations since December 31, 2020
The development pipeline decreased by -€0.6 Bn, down from €4.4 Bn as at December 31, 2020, mainly due to deliveries:
In €Bn
1.1. Projects delivered in H1-2021
Since December 31, 2020, the Group delivered four projects representing a URW TIC of €0.7 Bn and a total GLA of
110,454 sqm:
▪ The 87,053 sqm Westfield Mall of the Netherlands retail extension and renovation, a unique and innovative shopping,
dining, leisure and entertainment destination, which comprises various flagship stores such as LEGO, Hugo Boss, Nike,
Victoria’s Secret, O’Learys, Kinepolis, Zara, H&M, Peek & Cloppenburg and JD Sports. It gathers an iconic architecture,
an extensive food and beverage offer, a wide range of leisure options and “The Gallery” with an attractive mix of designer
and lifestyle brands such as Ace & Tate, Coef, Skins Cosmetics, Smaak Amsterdam and Miccy's Jewelz;
▪ The Fashion Pavilion project in La Maquinista in Spain, which adds local champions to the Dining Experience, and
upgrades the fashion offer notably with Urban Outfitters, a 1,000 sqm Uniqlo, and the first ever Abercrombie & Fitch
location in Spain;
▪ Two restructuring projects in the US: the Lord & Taylor box at Westfield Annapolis, including the creation of a bright
walk-way connecting the east and west wings of the mall, and a new fashion district; and the reconfiguration of the
previous JC Penney box into a multi-tenant retail building activity in the heart of Westfield Garden State Plaza.
The average letting52 of these deliveries stands at 88% as at June 30, 2021.
48 100% TIC is expressed in value at completion. It equals the sum of: (i) all capital expenditures from the start of the project to the
completion date and includes: land costs, construction costs, study costs, design costs, technical fees, tenant fitting-out costs paid for by
the Group, letting fees and related costs, eviction costs and vacancy costs for renovations or redevelopments of standing assets; and
(ii) opening marketing expenses. It excludes: (i) step rents and rent-free periods; (ii) capitalised financial interests; (iii) overhead costs;
(iv) early or lost Net Rental Income; and (v) IFRS adjustments. 49 URW TIC: 100% TIC multiplied by URW’s percentage stake in the project, adjusted by specific own costs and income, if any. 50 This includes the Group’s share of projects fully consolidated and projects accounted for using the equity method, excluding Viparis
projects and commitments on the roads for the Westfield Milano project. 51 GLA equals Gross Lettable Area of projects at 100%. 52 GLA signed, all agreed to be signed and financials agreed.

46
1.2. Project changes
Since December 31, 2020, there have been changes in the URW TIC and in the delivery dates of some projects:
▪ The Garbera extension project has been reassessed, following the progress in pre-letting, and now includes a second
phase of an additional 8,545 sqm;
▪ The Gaîté Montparnasse mixed-use project was delayed and the URW TIC increased due to the settlement of the COVID-
19 claims with construction companies, and increased construction costs related to COVID-19;
▪ The URW TIC of the Westfield Hamburg-Überseequartier mixed-use project increased as a result of the deteriorated
construction market conditions in the pandemic context;
▪ The URW TIC of the Cherry Park residential project increased due to currency movements.
2. Pipeline projects as at June 30, 2021
2.1. Summary of pipeline projects
(1) Figures subject to change according to the maturity of projects.
(2) URW share of the expected stabilised Net Rental Income divided by the URW TIC increased by rent incentives (step rents and rent
free periods), and for redevelopment projects only, the Gross Market Value of the standing assets at the launch of the project.
(3) In the case of staged phases in a project, the date corresponds to the opening date of the main phase.
(4) Formerly named Michelet-Galilée.
*Units acquired for the project are included in the TIC at their acquisition cost.
2.2. Detailed overview
The Group’s pipeline consists of two distinct groupings:
1. Committed projects for which URW owns the land or building rights and has obtained:
▪ All necessary administrative authorisations and permits;
▪ Approvals of joint venture partners (if applicable);
▪ Approvals of URW’s internal governing bodies to start superstructure construction works; and
▪ On which such works have started.
2. Controlled projects in an advanced stage of studies, for which URW controls the land or building rights, and all required
administrative authorisations have been filed or are expected to be filed shortly. There can be no assurance these will
become “Committed” projects, as this will be subject to having obtained all required administrative approvals, as well
as those of joint venture partners (if applicable) and of URW’s internal governing bodies to start superstructure works.
Besides these approvals, the Group retains the flexibility to decide to launch them, if and when appropriate. URW could
in particular consider launching these projects with joint venture partners.
Development Projects (1) Sub-Business Country Type
URW
Ownership
100% GLA
(sqm)
URW
TIC
(€Mn)
URW
Cost to
Date
(€Mn)
Yield
on
Cost (2)
Project
Valuation
GAITE MONTPARNASSE RETAIL Shopping Centres France Redevelopment / Extension 100% 33,809 sqm 210 H1 2022 Fair Value
GAITE MONTPARNASSE OTHERS Offices & Others France Redevelopment / Extension 100% 64,457 sqm 260 H1 2022 Fair Value
WESTFIELD TOPANGA RESTRUCTURING (*) Shopping Centres US Extension / Renovation 55% 16,786 sqm 230 H1 2022 Fair Value
GARBERA EXTENSION Shopping Centres Spain Extension / Renovation 100% 19,684 sqm 120 H1 2023 At Cost
WESTFIELD HAMBURG - ÜBERSEEQUARTIER RETAIL Shopping Centres Germany Greenfield / Brownfield 100% 95,149 sqm 760 H2 2023 At Cost
WESTFIELD HAMBURG - ÜBERSEEQUARTIER OTHERS Offices & Others Germany Greenfield / Brownfield 100% 75,805 sqm 490 H2 2023 At Cost
CHERRY PARK RESIDENTIAL Offices & Others UK Greenfield / Brownfield 25% 87,440 sqm 790 H2 2024 Fair Value
Others 33,429 sqm 140
Total Committed Projects 2,250 1,270 5.6%
LIGHTWELL (4) Offices & Others France Redevelopment / Extension 100% 34,789 sqm 110 H1 2024 Fair Value
TRIANGLE Offices & Others France Greenfield / Brownfield 100% 91,351 sqm 670 Post 2025 At Cost
SISTERS Offices & Others France Greenfield / Brownfield 100% 90,434 sqm 700 Post 2025 At Cost
Others 2,323 sqm 40
Total Controlled Projects 1,520 160
URW TOTAL PIPELINE 3,770 1,430
100%
TIC
(€Mn)
Opening
date (3)

47
URW Development pipeline by grouping
The committed pipeline now includes the 8,454 sqm second phase of the Garbera extension project, and the Nouveau Forum
project at Westfield Forum des Halles (177 sqm of additional space following partial restructuring). This project consists in
enlarging and upgrading the food & beverage offer, consistently with the strong position of the existing cinema, which is the
most visited in Europe.
56% of the total committed pipeline URW TIC has been already spent as at June 30, 2021, representing an amount of
€1,270 Mn, of which €740 Mn on retail pipeline and €530 Mn on offices and others.
Of the €980 Mn still to be invested for committed projects, €300 Mn has already been contracted.
Only 10% of the total controlled pipeline URW TIC has been spent, representing an amount of €160 Mn, including land
costs, mainly on offices and other projects.
Controlled€1,520 Mn
40%
Retail€1,340 Mn
36%
Offices & Others€910 Mn
24%
Committed€2,250 Mn
60%
Controlle
d
€1,520 Mn
40%
Retail
€1,340 Mn
36%
Offices & O
thers
€910 Mn
24%
Committed
€2,250 Mn
60%
France€580 Mn
41%
Germany€630 Mn
44%
UK€90 Mn
6%
US€60 Mn
4%
Spain
€60 Mn4%
Denmark€10 Mn
1%
URW Cost to Date per country
(€1,430 Mn)

48
URW Development pipeline per type and business53
(1) Including Residential and Hotel units.
The Offices & Others sector represents 64% (€2.4 Bn) of the total URW TIC, of which 57% are controlled projects (Triangle
and Sisters) with expected delivery dates beyond 2025. Greenfield and brownfield projects represent 85% and correspond to
approximately 341,000 sqm of new GLA, of which 60% are office, 24% residential and 16% hotels projects. The remainder
will be invested in the redevelopment or refurbishment of 123,000 sqm GLA of existing assets.
In the Retail sector, the Group focused on extensions, restructurings and refurbishments on select standing assets, which
represent 45% of the €1.4 Bn retail pipeline, following H1-2021 deliveries. The remainder consists of the Westfield
Hamburg-Überseequartier mixed-use project expected to be delivered in H2-2023. 35% of the approximately 180,000 sqm
retail GLA consists of dining and leisure GLA.
In addition, third party urban regeneration developments are ongoing around a number of the Group’s assets and are expected
to reinforce the respective catchment areas and the position of URW’s destinations.
The Group’s strategy, particularly for the Offices & Others controlled projects, is to join with strategic capital partners prior
to launching these projects, in order to reduce the capital allocation on the balance sheet of the Group, whilst leveraging on
existing projects and generating development/management fees.
3. Deliveries expected in H2-2021 and pre-letting progress
The hotel project at Gaîté Montparnasse is scheduled to be delivered and opened during H2-2021 and will be operated by
Accor under the Pullman brand.
4. Investments in H1-2021
See section “Investments and divestments”.
53 Figures may not add up due to rounding.
Greenfield / Brownfield Retail
€760 Mn20%
Extension / Renovation / Redevelopment
Retail€620 Mn
16%
Greenfield / Brownfield Offices & Others
€2,030 Mn54%
Redevelopment / Extension Offices & Others
€360 Mn10%
(1)
(1)
RetailGreenfield / Brownfield
66,679 sqm10%
RetailExtension / Renovation /
Redevelopment50,627 sqm
8%
Dining & LeisureGreenfield / Brownfield
32,044 sqm5%
Dining & Leisure Extension / Renovation /
Redevelopment31,323 sqm
5%
Offices271,268 sqm
42%
Hotels106,130 sqm
16%
Residential87,386 sqm
14%
URW TIC
(€3,770 Mn)
GLA
(645,457 sqm)

49
4. PROPERTY PORTFOLIO AND NET ASSET VALUE AS AT JUNE 30, 2021
URW’s NRV amounted to €162.40 per share as at June 30, 2021, a decrease of -€4.40 per share (-2.6%) compared to
the NRV as at December 31, 2020 (€166.80 per share).
The NRV includes €6.66 per share of goodwill not justified by the fee businesses or tax optimisations and which is
mainly related to the Westfield acquisition. Net of this goodwill, the NRV would be €155.74 per share.
URW’s NDV amounted to €107.50 per share as at June 30, 2021, a decrease of -€3.00 per share (-2.7%) compared to
the NDV as at December 31, 2020 (€110.50 per share). URW’s NDV does not include any goodwill.
Material Valuation Uncertainty due to COVID-19
For the valuation as at June 30, 2020, the appraisers in Europe and in the US included a material valuation uncertainty
statement in the appraisal reports. As from the valuation as at December 31, 2020, this statement was withdrawn from the
appraisal reports, except for the hotels. For the valuation as at June 30, 2021, this statement was withdrawn for the hotels as
well.
1. Property portfolio
Unless otherwise indicated, the data presented in the property portfolio are on a proportionate54 basis as at June 30,
2021, and comparisons are with values as at December 31, 2020.
The total GMV of URW’s portfolio55 amounted to €55.0 Bn (€56.3 Bn), a decrease of -2.4%. On a like-for-like basis,
the GMV decreased by -2.3% (or -€1,094 Mn).
Total real estate investment volumes in Continental Europe56 remained in line with the 10-year average levels with €83.4 Bn
transacted in H1-2021, down -24% from €110.0 Bn in H1-2020. In the UK, total investment volumes56 amounted to €27.2 Bn
in H1-2021, up +11% from €24.6 Bn in H1-2020.
Continental Europe – Shopping Centres
Total retail investment volumes56 in Continental Europe were €7.4 Bn, down -49%, including shopping centre transactions
accounting for 37% of this amount.
URW’s Shopping Centre GMV decreased by -1.7% on a like-for-like basis. This decrease was the result of a yield impact of
-1.6% and a rent impact of -0.2%. Following the URW’s sale of stakes in Shopping City Süd and Aupark at or close to
December 2020 valuation, the appraisers have decided to keep the Exit Cap Rates (ECR) relatively stable for most of prime
shopping centres in Continental Europe.
United Kingdom – Shopping Centres
Total retail investment volumes56 in the UK were €2.7 Bn, up +13%, including shopping centre transactions accounting for
19% of this amount.
Although there was still little transactional evidence in the segment of prime shopping centres, appraisers further reduced the
like-for-like GMV of the Group’s UK shopping centres by -9.1%. This is explained by -7.1% of yield impact and -2.0% of
rent impact. This decrease reflects the appraisers’ concerns about the retail market in the UK following the COVID-19 crisis.
United States – Shopping Centres
US retail investment volumes saw a -6.6% year-on-year decline in May YTD, with total transactions reported by Real Capital
Analytics of $15.9 Bn. For shopping centres, the decrease in deal volume was -8.9%.
54 The sum of the GMV for the assets fully consolidated, the ownership at share of the GMV of assets jointly controlled accounted for
using the equity method and the equity values for assets not controlled by URW (Zlote Tarasy, Gropius Passagen, Foncière Crossroads,
and the Blum/Centennial and Starwood Ventures entities). 55 Including the Group’s services business, the airport activities, the Westfield trademark, transfer taxes and transaction costs. Does not
include the goodwill not justified by the fee business nor the impact of the application of IFRS 16. 56 Source: Cushman & Wakefield, estimates as at July 6, 2021.

50
The value of the Group’s US shopping centres decreased by -3.0% on a like-for-like basis, of which -1.6% for the Flagships
and -10.6% for the Regionals. This decrease is driven by a negative rent impact (-3.1%), partly offset by a positive yield
impact (+0.1%).
Offices & Others
The value of URW’s Offices & Others portfolio increased by +3.6% on a like-for-like basis, thanks to a positive yield impact
(+3.2%) and a positive rent impact (+0.4%) in line with the Group’s recent transactions.
Convention & Exhibition
The Convention & Exhibition portfolio value decreased by -1.4% on a like-for-like basis. This decrease is mainly driven by
an increase of the Weighted Average Cost of Capital (WACC) to reflect uncertainty around the recovery of C&E’s activities.
1.1. URW’s portfolio
Figures may not add up due to rounding.
(a) On a proportionate basis, including transfer taxes and transaction costs (see §1.6 for IFRS and Group share figures). The portfolio valuation includes:
- The appraised or at cost value of the entire property portfolio, whether fully consolidated or under joint operation (for URW’s share);
- The value of the Westfield trademark; - The equity value of URW’s investments in assets not controlled by URW (Zlote Tarasy, Gropius Passagen, Foncière Crossroads, and the Blum/Centennial
and Starwood Ventures entities). The equity value of URW’s share investments in assets not controlled by URW amounted to €1,172 Mn (€1,189 Mn).
The valuations consider the negative cash-flows related to rents paid on concessions or leaseholds, which are accounted for as financial debt in the consolidated statement of financial position.
The portfolio neither includes €1.2 Bn of goodwill not justified by the fee business, nor financial assets such as the €2,835 Mn of cash and cash equivalents
on the Group’s consolidated statement of financial position as at June 30, 2021.
(b) Excluding the currency effect, investment properties under construction, assets not controlled by URW and changes in the scope (including acquisitions,
disposals and deliveries of new projects) through June 30, 2021. Changes in scope consist mainly of the: - Acquisition of the 47.4% remaining stake in the JVs holding two assets in the US: Westfield Palm Desert and Westfield Trumbull;
- Disposal of a 60% stake in Aupark in Slovakia;
- Disposal of the SHiFT, Village 3, Village 4, Village 6 and Le Blériot office buildings in France; - Disposal of an office building in Täby Centrum in Sweden;
- Foreclosure57 of four assets in the US: Westfield Broward, Westfield Citrus Park, Westfield Countryside and Westfield Sarasota; and
- Delivery of Westfield Mall of the Netherlands, Westfield Annapolis Restructuring, Westfield Garden State Plaza Restructuring and La Maquinista Fashion Pavilion.
The like-for-like change in the portfolio valuation is calculated excluding the changes described above.
57 The action of a lender seeking to take the collateral on a loan when loan payments are not made, leading to a transfer of the asset and
the extinction of the corresponding mortgage debt.
Asset portfolio valuation
(including transfer taxes) (a)
€ Mn % € Mn % € Mn %
Shopping Centres 47,265 86% 1,068 - -2.5% 47,905 85%
Offices & Others 3,770 7% 71 3.6% 4,409 8%
Convention & Exhibition 2,657 5% 37 - -1.4% 2,701 5%
Services 1,274 2% 60 - -4.7% 1,299 2%
Total URW 54,966 100% 1,094 - -2.3% 56,314 100%
Proportionate
June 30, 2021
Like-for-like change net of
investment -
H1-2021 (b)
Dec. 31, 2020

51
Figures may not add up due to rounding.
(a) Non like-for-like assets include IPUC valued at cost or at fair value, (e.g. projects such as the Gaîté offices, the hotel project at Gaîté Montparnasse, Les
Ateliers Gaîté, Westfield Topanga Restructuring, Westfield Milano and the Nouveau Forum project at Westfield Forum des Halles) and assets delivered in
H1-2021 such as Westfield Mall of the Netherlands, Westfield Annapolis Restructuring, Westfield Garden State Plaza Restructuring and La Maquinista Fashion Pavilion.
(b) Revaluation of the shares in companies holding the assets not controlled by URW (Zlote Tarasy, Gropius Passagen, Foncière Crossroads, and the
Blum/Centennial and Starwood Ventures entities). (c) Includes the acquisition of the 47.4% remaining stake in the JVs holding Westfield Palm Desert and Westfield Trumbull.
(d) Value as at December 31, 2020, of the assets disposed or foreclosed. Mainly includes the SHiFT, Village 3, Village 4, Village 6, Täby Q-Huset and Le
Blériot office buildings, the 60% stake in Aupark and the four foreclosed assets in the US. (e) Currency impact of +€561 Mn, including +€403 Mn in the US and +€179 Mn in the UK, partly offset by -€21 Mn in the Nordics, before offsets from
foreign currency debt and hedging programs.
Appraisers
In March 2021, as part of the rotation recommended by RICS, URW signed new appraisal mandates with two international
and qualified appraisal firms, Cushman & Wakefield and Jones Lang LaSalle, to value its Shopping Centre and Offices &
Others portfolio. In Continental Europe, URW rotated the assets appraised by these two firms: in H1-2021, the appraisers
were rotated for Central Europe, Spain, Nordics, France Offices & Others and The Netherlands and in H2-2021, URW
expects to rotate appraisers for France Shopping Centres, Germany and Austria.
URW has allocated properties across independent appraisers by region for comparison and benchmarking purposes. The
valuation process has a centralised approach, intended to ensure that capital market views on the Group’s portfolio are taken
into account. Assets are appraised twice a year (in June and December), except services companies, which are externally
appraised once a year. However, URW has done an interim internal appraisal of the services business in H1-2021 to take into
account the impact of COVID-19 crisis.
Figures may not add up due to rounding.
(a) The Group’s UK Shopping Centre portfolio was valued by Cushman & Wakefield and Avison Young.
(b) PwC assesses the Convention & Exhibition venues as well as the Westfield trademark.
Fees paid to appraisers are determined prior to the valuation process and are independent from the value of properties
appraised. A detailed report, dated and signed, is produced for each appraised property. None of the appraisers have received
fees from URW representing more than 10% of their turnover.
URW Valuation as at Dec. 31, 2020 (€ Mn) 56,314
Like-for-like revaluation 1,094 -
Revaluation of non like-for-like assets 6 - (a)
Revaluation of shares 16 - (b)
Capex / Acquisitions / Transfers 607 (c)
Disposals 1,400 - (d)
Constant Currency Effect 561 (e)
URW Valuation as at June 30, 2021 (€ Mn) 54,966
Proportionate
Appraiser% of total
portfolio
Cushman & Wakefield 48%
Jones Lang LaSalle 31%
Duff & Phelps 8%
PwC(b) 6%
Other appraisers 2%
6%
100%
France / Nordics / Spain / UK(a)
/ US
Property location
France / Germany / Central Europe / The Netherlands / Austria / Italy
At cost, under sale agreement or internal
US
France
Central Europe / US
Proportionate

52
Valuation methodology
Appraisal methods used by appraisers are compliant with international standards and guidelines as defined by RICS, IVSC
(“International Valuation Standards Council”) and FSIF (“Fédération des Sociétés Immobilières et Foncières”).
Independent appraisers determine the fair market value based on the results of two methods: the discounted cash-flow
(“DCF”) methodology and/or the yield methodology. Furthermore, the resulting valuations are cross-checked against the
initial yield, value per square metre and the fair market values established through actual market transactions.
Appraisers have been given access to all information relevant for valuations, such as the Group’s confidential rent rolls,
including information on vacancy, break options, expiry dates and lease incentives, performance indicators (e.g. footfall and
sales where available), letting evidence and the Group’s cash-flow forecasts from annually updated detailed asset business
plans. Appraisers make their independent assessments of current and forward-looking cash-flow profiles and usually reflect
risk either in the cash-flow forecasts (e.g. future rental levels, growth, investment requirements, void periods and incentives),
in the applied required returns or discount rates and in the yield applied to capitalise the exit rent to determine an exit value.
The yield and rent impacts are used to explain and split the revaluation into two parts. The yield impact indicator is very
sensitive to any change in the assumptions made for the asset which complicates its interpretation. It is calculated as the
change in potential yield, excluding capex, to eliminate the impact of vacancy. Therefore, if the NRI is projected to grow
faster than the value of the asset net of capex, there will be a negative yield impact. In addition, the potential yield expands
and therefore generates a negative yield impact in case of defensive capex or eviction costs or an increase in the ERV of
vacant units. The rent impact is mechanically obtained by deducting the yield impact from the like-for-like revaluation.
As the value of the assets is based on cash-flows and ECR, the Net Initial Yield (“NIY”) may be lower than the ECR for
several reasons, including the vacancy as at the valuation date, which the appraisers assume will be rented, and the reversion
which will be captured in the cash-flows. The NIY is an output rather than an input.
Valuation scope
94% of URW’s portfolio was appraised by independent appraisers as at June 30, 2021.
Investment Properties Under Construction (“IPUC”) for which a value could be reliably determined are required to be
accounted for at fair value and were assessed by external appraisers.
IPUC are taken at fair value once management considers that a substantial part of the project’s uncertainty has been
eliminated, such that a reliable fair value can be established. URW uses its long-standing guidelines to establish the residual
level of risk, focusing notably on uncertainty remaining in construction and leasing. IPUC were valued using a discounted
cash-flow or yield method approach as deemed appropriate by the independent appraisers. In some cases, both methods were
combined to validate and cross-check critical valuation parameters.
The Gaîté offices have been carried at fair value since June 30, 2019 and Les Ateliers Gaîté since December 31, 2019. The
Nouveau Forum project at Westfield Forum des Halles was assessed at fair value for the first time as at June 30, 2021.
Since and as a result of the acquisition accounting for the Westfield transaction, the main projects in the US, the UK and Italy
were carried at fair value as at June 30, 2021.
Refer to the table in the Section “Development projects as at June 30, 2021” for the valuation method used for each
development project in the Group’s pipeline.
The remaining assets of the portfolio (6%) were valued as follows:
▪ At cost for IPUC for which a reliable value could not yet be established. These include assets under development:
Garbera extension and Westfield Hamburg - Überseequartier, as well as most development projects included in the
“Controlled” category (see Section “Development projects as at June 30, 2021” for more details);
▪ Internal valuations were performed by URW as at June 30, 2021, for the services activities to take into account the
impact of the COVID-19 crisis on these activities, and for a few minor Regional and Office assets in the US.
The total value of the IPUC amounts to €3.4 Bn, of which €1.8 Bn is valued at fair value and €1.6 Bn is valued at cost (75%
of the value at cost has been tested with an external valuation as at June 30, 2021).
Unless otherwise indicated, valuation changes and references to asset values include transfer taxes and transaction costs.

53
Figures may not add up due to rounding.
1.2. Shopping Centre portfolio
The value of URW’s Shopping Centre portfolio is the value of each individual asset as determined by the Group’s appraisers,
except as noted above.
The Westfield trademark is split by region in which the Group operates Westfield branded shopping centres and is included
within the Flagships category valuation.
Evolution of URW’s Shopping Centre portfolio valuation
The value of URW’s Shopping Centre portfolio58 amounted to €47,265 Mn (€47,905 Mn).
Figures may not add up due to rounding.
(a) Non like-for-like assets include IPUC valued at cost or at fair value, (e.g. projects such as Les Ateliers Gaîté, Westfield Topanga Restructuring, Westfield
Milano and the Nouveau Forum project at Westfield Forum des Halles) and assets delivered in H1-2021, mainly Westfield Mall of the Netherlands, Westfield Annapolis Restructuring, Westfield Garden State Plaza Restructuring and La Maquinista Fashion Pavilion.
(b) Revaluation of the shares in companies holding the assets not controlled by URW (Zlote Tarasy, Gropius Passagen, Foncière Crossroads and the
Blum/Centennial and Starwood Ventures entities). (c) Includes the acquisition of the 47.4% remaining stake in the JVs holding Westfield Palm Desert and Westfield Trumbull.
(d) Value as at December 31, 2020, of the assets disposed or foreclosed. Mainly includes the 60% stake in Aupark and the four foreclosed assets in the US.
(e) Currency impact of +€495 Mn, including the US (+€385 Mn) and the UK (+€130 Mn), partly offset by the Nordics (-€20 Mn) before offsets from foreign currency debt and hedging programs.
58 Including airport activities and the Westfield trademark.
Appraiser Sector June 30, 2021 Dec. 31, 2020
Cushman & Wakefield Shopping Centres/Offices & Others 19,071 20,408
Jones Lang LaSalle Shopping Centres/Offices & Others 17,097 16,202
PwC Shopping Centres/C&E 2,815 2,812
Other appraisers Shopping Centres 3,210 3,363
Impact of the assets valued by two appraisers Shopping Centres 2,389 - 2,512 -
Assets valued at cost and/or not appraised Shopping Centres/Offices & Others 1,496 2,254
41,302 42,527
Cushman & Wakefield Shopping Centres/Offices & Others 6,929 7,168
Duff & Phelps Shopping Centres/Offices & Others 4,545 4,612
PwC Shopping Centres 250 580
Other appraisers Shopping Centres 351 60
Internal valuation Shopping Centres/Offices & Others 195 -
Assets valued at cost and/or not appraised Shopping Centres/Offices & Others 120 68
12,390 12,487
1,274 1,299
54,966 56,314
Services
Total URW
Proportionate
Valuation including transfer
taxes in € Mn
Total Europe
Total US
URW Valuation as at Dec. 31, 2020 (€ Mn) 47,905
Like-for-like revaluation 1,068 -
Revaluation of non like-for-like assets 16 - (a)
Revaluation of shares 16 - (b)
Capex / Acquisitions / Transfers 475 (c)
Disposals 509 - (d)
Constant Currency Effect 495 (e)
URW Valuation as at June 30, 2021 (€ Mn) 47,265
Proportionate

54
Based on an asset value excluding estimated transfer taxes and transaction costs, the Shopping Centre division’s NIY is stable
compared to December 31, 2020, at 4.5%.
The Potential Yield including the leasing of vacant space at ERV is stable compared to December 31, 2020, at 5.0%.
For the US, the decrease in Potential Yield from 4.9% to 4.8% is mainly due to the foreclosure of the four assets in H1-2021
which had a higher Potential Yield than the average US shopping centres. The US Potential Yield as at December 31, 2020,
restated for these four assets would have been at 4.7% (6.8% for the US Regionals).
Figures may not add up due to rounding.
(a) Annualised contracted rent (including indexation) and other incomes for the next 12 months, net of operating expenses, divided by the asset value net of
estimated transfer taxes and transaction costs. Shopping centres under development or not controlled by URW, the Westfield trademark and the airport activities are not included in the calculation of NIY.
(b) Annualised contracted rent (including indexation) and other incomes for the next 12 months, net of operating expenses + the ERV of vacant space,
divided by the asset value net of estimated transfer taxes and transaction costs. Shopping centres under development or not controlled by URW, the Westfield trademark and the airport activities are not included in the calculation of Potential Yield.
The following table shows the further breakdown for the US Shopping Centre portfolio which is significantly impacted by a
positive currency impact of +€385 Mn:
Figures may not add up due to rounding.
(a) Annualised contracted rent (including indexation) and other incomes for the next 12 months, net of operating expenses, divided by the asset value net of estimated transfer taxes and transaction costs. Shopping centres under development or not controlled by URW, the Westfield trademark and the airport
activities are not included in the calculation of NIY.
(b) Annualised contracted rent (including indexation) and other incomes for the next 12 months, net of operating expenses + the ERV of vacant space, divided by the asset value net of estimated transfer taxes and transaction costs. Shopping centres under development or not controlled by URW, the Westfield
trademark and the airport activities are not included in the calculation of Potential Yield.
(c) The airport activities and the Westfield trademark for the US are included in the valuation of the US Flagships for a total amount of €553 Mn as at June 30, 2021 and for a total amount of €580 Mn as at December 31, 2020.
In USD, the valuation including transfer taxes of the US Shopping Centre portfolio decreased by -4.0% from $14,993 Mn to
$14,396 Mn.
Valuation
excluding
estimated transfer
taxes
Valuation
excluding
estimated transfer
taxes
€ Mn € Mn € Mn € Mn
France 13,605 13,113 4.5% 4.7% 13,563 13,066 4.4% 4.6%
Central Europe 4,711 4,669 5.1% 5.5% 5,059 5,014 5.1% 5.4%
Spain 3,563 3,483 4.6% 5.0% 3,596 3,514 4.6% 4.9%
Nordics 3,053 2,992 4.2% 4.7% 3,095 3,034 4.1% 4.5%
Germany 3,333 3,163 4.8% 5.2% 3,447 3,269 4.7% 5.0%
Austria 2,264 2,253 4.6% 4.7% 2,290 2,279 4.6% 4.8%
The Netherlands 1,775 1,640 5.1% 5.6% 1,658 1,560 5.3% 6.2%
Subtotal Continental Europe 32,305 31,313 4.6% 4.9% 32,707 31,736 4.6% 4.9%
UK & Italy 2,856 2,717 5.6% 6.5% 2,994 2,848 5.2% 6.1%
Subtotal Europe 35,160 34,030 4.7% 5.1% 35,700 34,585 4.6% 5.0%
US 12,104 11,998 3.9% 4.8% 12,205 12,099 4.2% 4.9%
Total URW 47,265 46,028 4.5% 5.0% 47,905 46,683 4.5% 5.0%
Proportionate
Potential Yield (b)
Shopping Centre portfolio by
region
June 30, 2021 Dec. 31, 2020
Valuation
including transfer
taxesNet Initial Yield
(a)Potential Yield (b)
Valuation
including transfer
taxesNet Initial Yield
(a)
Valuation
including transfer
taxes
Valuation
excluding
estimated transfer
taxes
Valuation
including transfer
taxes
Valuation
excluding
estimated transfer
taxes
€ Mn € Mn € Mn € Mn
Flagships US (c) 10,247 10,143 3.5% 4.3% 10,066 9,962 3.7% 4.3%
Regionals US 1,858 1,854 5.9% 7.2% 2,139 2,137 6.1% 7.7%
Total US 12,104 11,998 3.9% 4.8% 12,205 12,099 4.2% 4.9%
Proportionate
June 30, 2021 Dec. 31, 2020
Potential Yield (b) Potential Yield (b)
US Shopping Centre portfolio by
category Net Initial Yield
(a)
Net Initial Yield
(a)

55
The following table shows the bridge of the US Shopping Centre portfolio in USD from December 31, 2020, to June 30,
2021, with the split by category:
Figures may not add up due to rounding.
(a) Non like-for-like assets include IPUC valued at cost or at fair value, (e.g. projects such as Westfield Topanga Restructuring) and assets delivered in H1-
2021, mainly Westfield Garden State Plaza Restructuring.
(b) Revaluation of the shares in companies holding the assets not controlled by URW (the Blum/Centennial and Starwood Ventures entities). (c) Includes the acquisition of the 47.4% remaining stake in JVs holding Westfield Palm Desert and Westfield Trumbull.
(d) Value as at December 31, 2020, of the assets disposed or foreclosed. Includes the four foreclosed assets.
Sensitivity
A change of +25 bps in NIY, the main output of the appraisal models, would result in a downward adjustment of -€2,386 Mn
(or -5.3%) on URW’s Shopping Centre portfolio value (excluding assets under development, the Westfield trademark and
the airport activities).
A change of +25 bps in DR would have a negative impact of -€747 Mn (or -1.7%) on URW’s Shopping Centre portfolio
value (excluding assets under development, the Westfield trademark, the airport activities and the assets not controlled by
URW).
A change of +10 bps in ECR would have a negative impact of -€667 Mn (or -1.5%) on URW’s Shopping Centre portfolio
value (excluding assets under development, the Westfield trademark, the airport activities and the assets not controlled by
URW).
A decrease of -5% in appraisers’ ERV assumptions for the leases to be signed during the model period would have a negative
impact of -€1,545 Mn (or -3.5%) on URW’s Shopping Centre portfolio value (excluding assets under development, the
Westfield trademark, the airport activities and the assets not controlled by URW).
Total US Flagships US Regionals US
URW Valuation as at Dec. 31, 2020 ($ Mn) 14,993 12,352 2,641
Like-for-like revaluation 398 - 173 - 225 -
Revaluation of non like-for-like assets 89 - 47 - 42 - (a)
Revaluation of shares 21 - - 21 - (b)
Capex / Acquisitions / Transfers 169 45 124 (c)
Disposals 259 - - 259 - (d)
URW Valuation as at June 30, 2021 ($ Mn) 14,396 12,177 2,219
Proportionate

56
Like-for-like analysis
On a like-for-like basis, the value of URW’s Shopping Centre portfolio, after accounting for works, capitalised financial
expenses and eviction costs, decreased by -€1,068 Mn (-2.5%). This decrease was the result of a yield impact of -1.5% and
a rent impact of -1.0%.
This decrease is in line with URW’s sale of stakes in Aupark and Shopping City Süd59.
Figures may not add up due to rounding.
(a) Like-for-like change net of investments from December 31, 2020, to June 30, 2021, excluding assets not controlled by URW.
(b) Yield impact calculated using the change in potential yields (to neutralise changes in vacancy rates) and taking into account key money.
The 53 Flagship shopping centres represent 90% of URW’s retail exposure (excluding assets under development, the airport
activities and the Westfield trademark).
Figures may not add up due to rounding.
(a) Like-for-like change net of investments from December 31, 2020, to June 30, 2021, excluding assets not controlled by URW. (b) Yield impact calculated using the change in potential yields (to neutralise changes in vacancy rates) and taking into account key money.
59 Previously announced, which closed in July 21.
H1-2021LfL change in
€ Mn
LfL change in
%
LfL change -
Rent impact
LfL change -
Yield impact (b)
France 112 - -0.9% 0.2% -1.1%
Central Europe 93 - -2.4% 0.3% -2.7%
Spain 48 - -1.5% -0.3% -1.2%
Nordics 42 - -1.4% 2.3% -3.7%
Germany 142 - -4.6% -1.2% -3.4%
Austria 59 - -2.6% -3.0% 0.4%
The Netherlands 1 - -0.1% -3.1% 3.0%
Subtotal Continental Europe 497 - -1.7% -0.2% -1.6%
UK & Italy 242 - -9.1% -2.0% -7.1%
Subtotal Europe 738 - -2.3% -0.4% -2.0%
US 330 - -3.0% -3.1% 0.1%
Total URW 1,068 - -2.5% -1.0% -1.5%
Shopping Centres - Like-for-like (LfL) change (a)
Proportionate
H1-2021LfL change in
€ MnLfL change in %
LfL change -
Rent impact
LfL change -
Yield impact
(b)
Flagships Continental Europe 472 - -1.8% -0.3% -1.5%
Flagships UK & Italy 240 - -9.1% -2.1% -6.9%
Subtotal European Flagships 712 - -2.4% -0.5% -1.9%
Flagships US 143 - -1.6% -1.8% 0.2%
Subtotal Flagships 855 - -2.2% -0.8% -1.4%
Regionals (Europe and US) 214 - -5.0% -2.5% -2.5%
Total URW 1,068 - -2.5% -1.0% -1.5%
Proportionate
Shopping Centres - Like- for-like (LfL) change by category (a)

57
The following table shows the further breakdown for the US:
Figures may not add up due to rounding.
Non like-for-like analysis
The value of URW’s non like-for-like Shopping Centre portfolio, after accounting for works, capitalised financial expenses
and eviction costs, decreased by -€16 Mn (-0.4%), mainly due to -€14 Mn for the shopping centre projects at fair value
including a negative impact on Westfield Milano, partly compensated by an increase in Westfield Topanga restructuring,
-€11 Mn for the depreciation on projects valued at cost, -€6 Mn for the Airports business and the Westfield trademark, partly
compensated by +€15 Mn from the standing shopping centres undergoing extension, delivered (mainly Westfield Mall of the
Netherlands and La Maquinista Fashion Pavilion) or acquired in H1-2021.
1.3. Offices & Others portfolio
Evolution of URW’s Offices & Others portfolio valuation
The Offices & Others portfolio includes the offices, the hotels (except the hotels at Porte de Versailles), the residential
building Palisade at Westfield UTC and the residential projects.
The total value of URW’s Offices & Others portfolio amounted to €3,770 Mn (€4,409 Mn).
Figures may not add up due to rounding.
(a) Non like-for-like assets include IPUC valued at cost or at fair value, projects such as the Gaîté offices, the hotel project at Gaîté Montparnasse. (b) Value as at December 31, 2020, of the assets disposed. Includes the SHiFT, Village 3, Village 4, Village 6, Täby Q-Huset and Le Blériot office buildings.
(c) Currency impact of +€30 Mn in total, including the UK (+€22 Mn) and the US (+€9 Mn), partly offset by the Nordics (-€1 Mn), before offsets from
foreign currency debt and hedging programs.
H1-2021LfL change in
€ MnLfL change in %
LfL change -
Rent impact
LfL change -
Yield impact
(b)
Flagships US 143 - -1.6% -1.8% 0.2%
Regionals US 187 - -10.6% -7.2% -3.4%
Total US 330 - -3.0% -3.1% 0.1%
Proportionate
Shopping Centres - Like- for-like (LfL) change by category (a)
URW Valuation as at Dec. 31, 2020 (€ Mn) 4,409
Like-for-like revaluation 71
Revaluation of non like-for-like assets 30 (a)
Capex / Acquisitions / Transfers 121
Disposals 890 - (b)
Constant Currency Effect 30 (c)
URW Valuation as at June 30, 2021 (€ Mn) 3,770
Proportionate

58
The split by region of the total Offices & Others portfolio is the following:
Figures may not add up due to rounding.
For occupied offices and based on an asset value excluding estimated transfer taxes and transaction costs, the Offices &
Others division’s NIY increased by +23 bps to 5.1%. This increase is mainly due to the disposals of the SHiFT, Village 3,
Village 4 and Village 6 office buildings which had a lower NIY than the other assets of the Offices & Others portfolio.
Figures may not add up due to rounding.
(a) Valuation of occupied office space as at June 30, 2021, based on the appraiser’s allocation of value between occupied and vacant spaces. (b) Annualised contracted rent (including latest indexation) and other incomes for the next 12 months, net of operating expenses, divided by the value of
occupied space net of estimated transfer taxes and transaction costs. Assets under development are not included in this calculation.
Sensitivity
A change of +25 bps in NIY, the main output of the appraisal models, would result in a downward adjustment of -€126 Mn
(-6.0%) on URW’s Offices & Others portfolio value (occupied and vacant spaces, excluding assets under development).
€ Mn % € Mn %
France 2,331 62% 3,025 69%
Nordics 163 4% 179 4%
Other countries 487 13% 462 10%
Subtotal Continental Europe 2,981 79% 3,666 83%
UK & Italy 504 13% 460 10%
Subtotal Europe 3,485 92% 4,126 94%
US 286 8% 283 6%
Total URW 3,770 100% 4,409 100%
Proportionate
Valuation of Offices & Others
portfolio
(including transfer taxes)
June 30, 2021 Dec. 31, 2020
Valuation
including
transfer taxes
(a)
Valuation
excluding
estimated
transfer taxes
(a)
Valuation
including
transfer taxes
(a)
Valuation
excluding
estimated
transfer taxes
(a)
€ Mn € Mn € Mn € Mn
France 1,043 997 5.0% 1,744 1,683 4.5%
Nordics 132 130 6.9% 143 139 8.0%
Other countries 132 129 6.6% 131 129 6.6%
Subtotal Continental Europe 1,307 1,256 5.4% 2,018 1,950 4.9%
UK & Italy 78 73 n.m. 74 70 n.m.
Subtotal Europe 1,385 1,329 5.3% 2,092 2,020 4.9%
US 233 225 3.9% 193 187 5.1%
Total URW 1,618 1,554 5.1% 2,285 2,208 4.9%
Proportionate
Valuation of occupied office
space
June 30, 2021 Dec. 31, 2020
Net Initial Yield
(b)
Net Initial Yield
(b)

59
Like-for-like analysis
The value of URW’s Offices & Others portfolio, after accounting for the impact of works and capitalised financial expenses,
increased by +€71 Mn (+3.6%) on a like-for-like basis due to a yield impact of +3.2% and a rent impact of +0.4%. This
increase is mainly due to the increase in value of the 7 Adenauer office building in France60, supported by the agreement
signed on July 8, 2021, and the increase in value of the Nordics portfolio, supported by the disposal of an office building in
Täby on June 3, 2021.
Figures may not add up due to rounding.
(a) Like-for-like change net of investments from December 31, 2020, to June 30, 2021. (b) Yield impact calculated using the change in potential yields (to neutralise changes in vacancy rates).
60 Still included in the like-for-like perimeter as at June 30, 2021.
H1-2021LfL change in
€ Mn
LfL change in
%
LfL change -
Rent impact
LfL change -
Yield impact
(b)
France 65 4.9% 0.9% 3.9%
Nordics 13 11.9% 3.3% 8.6%
Other countries 2 1.5% 2.8% -1.3%
Subtotal Continental Europe 81 5.0% 1.3% 3.7%
UK & Italy 0 0.0% 1.0% -1.0%
Subtotal Europe 81 4.8% 1.3% 3.5%
US -10 -3.8% -4.7% 0.9%
Total URW 71 3.6% 0.4% 3.2%
Proportionate
Offices & Others - Like-for-like (LfL) change (a)

60
1.4. Convention & Exhibition portfolio
Valuation methodology
The valuation methodology adopted by PwC for the venues is mainly based on a discounted cash-flow model applied to the
total net income projected over the life of the concession or leasehold (net of the amounts paid for the concession or leasehold)
if it exists, or otherwise over a 10-year period, with an estimate of the asset value at the end of the given time period, based
either on the residual contractual value for concessions or on capitalised cash-flows over the last year, including the remaining
capital expenditures to be spent on Porte de Versailles (€201 Mn).
Evolution of the Convention & Exhibition valuation
The value of URW’s Convention & Exhibition venues, including transfer taxes and transaction costs, amounted to €2,657 Mn
(€2,701 Mn).
Figures may not add up due to rounding.
(a) Excluding the Convention & Exhibition space in Carrousel du Louvre and CNIT, 100%-owned by URW, the valuation for Viparis (including Palais des
Sports, Les Boutiques du Palais and the hotels at Porte de Versailles) was €2,584 Mn. (b) Excluding the Convention & Exhibition space in Carrousel du Louvre and CNIT, 100%-owned by URW, the valuation for Viparis (including Palais des
Sports, Les Boutiques du Palais and the hotels at Porte de Versailles) was €2,544 Mn.
On a like-for-like basis, net of investments, the value of Convention & Exhibition venues decreased by -€37 Mn (-1.4%).
This decrease is mainly driven by the increase in Weighted Average Cost of Capital (WACC) to reflect the uncertainty on
the recovery of C&E’s activities with the extension of restrictions in H1-2021.
1.5. Services
The Services portfolio is composed of URW’s French, German, UK and US property services companies.
URW’s Services portfolio is appraised annually by PwC as at each year-end to include all significant fee business activities
in the portfolio at their market value for the calculation of URW’s NAV. In URW’s Consolidated statement of financial
position, intangible assets are not revalued but recognised at cost less amortisation charges and/or impairment losses booked.
As at June 30, 2021, URW’s services portfolio was appraised internally by URW to take into account the impact of the
COVID-19 crisis on these activities, as it was done in H1-2020.
Figures may not add up due to rounding.
(a) Currency impact of +€35 Mn in total, including the UK (+€27 Mn) and the US (+€9 Mn), before offsets from foreign currency loans and hedging programs.
The negative like-for-like revaluation was mainly impacted by the decrease of the Property Management Fee business in the
US and the UK and the Design, Development & Construction business in the UK.
URW Valuation as at Dec. 31, 2020 (€ Mn) 2,701 (a)
Like-for-like revaluation 37 -
Revaluation of non like-for-like assets 19 -
Capex / Acquisitions / Transfers 11
URW Valuation as at June 30, 2021 (€ Mn) 2,657 (b)
Proportionate
URW Valuation as at Dec. 31, 2020 (€ Mn) 1,299
Like-for-like revaluation 60 -
Constant Currency Effect 35 (a)
URW Valuation as at June 30, 2021 (€ Mn) 1,274
Proportionate

61
1.6. Proportionate, IFRS and Group share figures for the property portfolio
The figures presented previously in the chapter are on a proportionate basis.
The following tables also provide the IFRS GMV and the Group share level (in GMV) for URW’s assets:
Figures may not add up due to rounding.
(a) Annualised contracted rent (including indexation) and other incomes for the next 12-months, net of operating expenses, divided by the asset value net of estimated transfer taxes and transaction costs. Shopping centres under development and shopping centres not controlled by URW (Zlote Tarasy, Gropius
Passagen, Foncière Crossroads, and the Blum/Centennial and Starwood Ventures entities) are not included in the calculation. Shopping centres held by
companies accounted for using the equity method are not included in the calculation of IFRS and Group share but are included in the proportionate. (b) Annualised contracted rent (including latest indexation) and other incomes for the next 12-months, net of operating expenses, divided by the value of
occupied space net of estimated transfer taxes and transaction costs. Offices under development are not included in the calculation. Offices held by companies
accounted for using the equity method are not included in the calculation of IFRS and Group share but are included in the proportionate.
Figures may not add up due to rounding.
URW Asset portfolio valuation -
June 30, 2021€ Mn % € Mn % € Mn %
Shopping Centres 47,265 86% 45,287 86% 41,172 87%
Offices & Others 3,770 7% 3,579 7% 3,560 8%
Convention & Exhibition 2,657 5% 2,657 5% 1,385 3%
Services 1,274 2% 1,274 2% 1,195 3%
Total URW 54,966 100% 52,798 100% 47,311 100%
URW Asset portfolio valuation -
Dec. 31, 2020€ Mn % € Mn % € Mn %
Shopping Centres 47,905 85% 45,948 85% 41,799 86%
Offices & Others 4,409 8% 4,241 8% 4,223 9%
Convention & Exhibition 2,701 5% 2,703 5% 1,410 3%
Services 1,299 2% 1,299 2% 1,218 3%
Total URW 56,314 100% 54,192 100% 48,649 100%
URW Like-for-like change - net of
Investments - H1-2021€ Mn % € Mn % € Mn %
Shopping Centres 1,068 - -2.5% 696 - -2.0% 659 - -2.2%
Offices & Others 71 3.6% 66 3.7% 65 3.7%
Convention & Exhibition 37 - -1.4% 37 - -1.4% 21 - -1.5%
Services 60 - -4.7% 60 - -4.7% 59 - -4.8%
Total URW 1,094 - -2.3% 728 - -1.8% 673 - -1.9%
URW Like-for-like change - net of
Investments - H1-2021 - Split
rent/yield impact
Rent impact % Yield impact % Rent impact % Yield impact % Rent impact % Yield impact %
Shopping Centres -1.0% -1.5% -1.0% -1.1% -1.2% -1.0%
Offices & Others 0.4% 3.2% 2.4% 1.3% 2.3% 1.4%
URW Net Initial Yield June 30, 2021 Dec. 31, 2020 June 30, 2021 Dec. 31, 2020 June 30, 2021 Dec. 31, 2020
Shopping Centres (a) 4.5% 4.5% 4.5% 4.5% 4.5% 4.5%
Offices & Others - occupied space (b) 5.1% 4.9% 5.4% 4.9% 5.4% 4.9%
Proportionate IFRS Group share
Bridge between Proportionate and IFRS as at June 30, 2021
€Mn
Asset portfolio
valuation (including
transfer taxes)
Total URW on a proportionate basis 54,966
(-) Assets joint-controlled on a proportionate basis 9,399 -
(+) Share investments in assets joint-controlled 7,232
Total URW under IFRS 52,798

62
1.7. Additional Valuation parameters - IFRS 13
URW complies with the IFRS 13 fair value measurement and the position paper61 on IFRS 13 established by EPRA, the
representative body of the publicly listed real estate industry in Europe.
Considering the limited public data available, the complexity of real estate asset valuations, as well as the fact that appraisers
use in their valuations the non-public rent rolls of the Group’s assets, URW believes it is appropriate to classify its assets
under Level 3. In addition, unobservable inputs, including appraisers’ assumptions on growth rates and ECR, are used by
appraisers to determine the fair value of URW’s assets.
In addition to the disclosures provided above, the following tables provide quantitative data in order to assess the fair
valuation of the Group’s assets.
Shopping Centres
All shopping centres are valued using the discounted cash-flow and / or yield methodologies using compound annual growth
rates as determined by the appraisers.
NIY, DR and ECR weighted by GMV. Vacant assets, assets considered at bid value and assets under restructuring are not included in Min and Max
calculation. Assets under development or not controlled by URW, the Westfield trademark and the airport activities are not included in this table. (a) Average annual rent (MGR + SBR) per asset per sqm.
(b) Rate used to calculate the net present value of future cash-flows.
(c) Rate used to capitalise the exit rent to determine the exit value of an asset. (d) CAGR of NRI determined by the appraiser (between 6 and 10 years depending on duration of DCF model used).
61 EPRA Position Paper on IFRS 13 - Fair value measurement and illustrative disclosures, February 2013.
Max 7.3% 870 9.5% 8.2% 17.2%
Min 2.3% 156 5.7% 4.0% 2.2%
Weighted average 4.5% 564 6.0% 4.3% 4.3%
Max 7.2% 577 8.4% 8.5% 4.0%
Min 4.6% 132 6.8% 5.0% 2.2%
Weighted average 5.1% 371 7.1% 5.3% 3.2%
Max 8.3% 530 11.5% 8.0% 4.3%
Min 4.2% 127 6.9% 4.5% 2.7%
Weighted average 4.6% 346 7.3% 4.8% 3.6%
Max 5.5% 413 8.5% 5.5% 5.5%
Min 3.8% 184 6.4% 4.3% 3.7%
Weighted average 4.2% 341 6.7% 4.6% 4.8%
Max 7.9% 448 8.5% 7.4% 4.1%
Min 4.1% 148 6.1% 4.4% 2.2%
Weighted average 4.8% 280 6.6% 4.9% 3.4%
Max 4.8% 381 6.3% 4.5% 2.7%
Min 4.4% 341 6.2% 4.4% 2.5%
Weighted average 4.6% 360 6.3% 4.4% 2.6%
Max 8.4% 371 8.1% 7.3% 5.3%
Min 4.3% 154 5.6% 4.5% 2.8%
Weighted average 5.1% 271 6.3% 5.1% 4.2%
Max 10.0% 1,669 11.5% 9.0% 15.7%
Min 3.0% 188 5.8% 4.3% 0.9%
Weighted average 3.9% 517 6.7% 5.0% 6.0%
Max 6.2% 648 7.8% 6.5% 2.1%
Min 5.2% 592 7.5% 6.2% 1.4%
Weighted average 5.6% 617 7.6% 6.4% 1.8%
The Netherlands
US
UK & Italy
Germany
Austria
France
Central Europe
Spain
Exit
Capitalisation
Rate
(c)
CAGR of
NRI
(d)
Shopping Centres -
June 30, 2021
Nordics
Net Initial
Yield
Rent in €
per sqm (a)
Discount Rate
(b)

63
The data for The Netherlands are positively impacted by the delivery of Westfield Mall of the Netherlands which is now
included in the table.
The data for the US are positively impacted by the foreclosure of the four assets. In addition, the positive currency effect had
a positive impact on the rent in € per sqm of +3.2% for the US and of +4.7% for the UK.
For the US, the split between Flagships and Regionals is as follows:
NIY, DR and ECR weighted by GMV. Vacant assets, assets considered at bid value and assets under restructuring are not included in Min and Max
calculation. Assets under development or not controlled by URW, the Westfield trademark and the airport activities are not included in this table.
(a) Average annual rent (MGR + SBR) per asset per sqm. (b) Rate used to calculate the net present value of future cash-flows.
(c) Rate used to capitalise the exit rent to determine the exit value of an asset.
(d) CAGR of NRI determined by the appraiser (10 years).
The CAGR of NRI is based on 2021 NRI, which is impacted by the COVID-19 crisis. Compared to 2019, the average CAGR
of NRI assumed by appraisers has decreased from 3.4% in the December 2019 valuations to 2.5% in the December 2020
valuations and 2.3% in the June 2021 valuations including reductions in all regions in particular in the US and the UK, partly
compensated by a slight NRI growth in The Netherlands following the Westfield Mall of the Netherlands delivery.
(a) Impacted by the delivery of Westfield Mall of the Netherlands.
The NRI of the exit year used by appraisers in June 2021 valuations remains stable in Continental Europe (+0.2%) compared
to the exit year NRI of the December 2020 valuations and is decreasing in the US (-2.0%) and in the UK (-7.1%).
Max 7.8% 1,669 8.8% 7.0% 8.1%
Min 3.0% 239 5.8% 4.3% 0.9%
Weighted average 3.5% 664 6.3% 4.7% 5.8%
Max 10.0% 553 11.5% 9.0% 15.7%
Min 3.0% 188 7.3% 6.0% 2.2%
Weighted average 5.9% 317 8.7% 6.7% 6.5%
Exit
Capitalisation
Rate
(c)
CAGR of
NRI
(d)
US Flagships
Shopping Centres -
June 30, 2021
Net Initial
Yield
US Regionals
Rent in €
per sqm (a)
Discount Rate
(b)
Valuations as at Dec.
31, 2019
Shopping CentresCAGR of NRI -
Starting from
June 30, 2021
CAGR of NRI -
Starting from
Dec. 31, 2019
CAGR of NRI -
Starting from Dec.
31, 2020
CAGR of NRI -
Starting from Dec.
31, 2019
CAGR of NRI -
Starting from Dec.
31, 2019
France 4.3% 3.0% 3.8% 3.0% 3.7%
Central Europe 3.2% 1.8% 2.7% 1.9% 2.5%
Spain 3.6% 2.1% 5.1% 2.2% 3.1%
Nordics 4.8% 2.7% 4.7% 3.0% 3.4%
Germany 3.4% 2.1% 3.2% 2.3% 2.8%
Austria 2.6% 1.6% 2.5% 1.7% 2.5%
The Netherlands(a) 4.2% 4.3% 2.6% 2.2% 3.2%
US Flagships 5.8% 2.9% 4.4% 3.1% 4.2%
US Regionals 6.5% 1.9% 3.8% 2.2% 3.6%
UK & Italy 1.8% 0.9% 4.2% 1.6% 3.0%
Average URW 4.2% 2.3% 3.8% 2.5% 3.4%
Valuations as at June 30, 2021 Valuations as at Dec. 31, 2020

64
2. EPRA Net Asset Value metrics calculation
The EPRA measures62 are calculated by adjusting the equity attributable to the holders of the Stapled Shares, as shown in the
Consolidated statement of financial position (under IFRS), for the items as described below. These apply differently to each
metric.
2.1. Equity attributable to the holders of the Stapled Shares
As at June 30, 2021, the Equity attributable to the holders of the Stapled Shares (which excludes both the Hybrid securities
and the External non-controlling interests) came to €17,222.8 Mn.
The Equity attributable to the holders of the Stapled Shares incorporated the net recurring profit in the period of €472.0 Mn
and the net negative impact in the period of -€892.8 Mn as a result of negative valuation movements and the negative mark-
to-market of financial instruments.
2.2. Revaluation to fair value of investment properties, development properties held for investment and other non-
current investments
The appraisal of the operating asset of URW (7 Adenauer, Paris 16th), held at cost under IAS 16, gave rise to an unrealised
capital gain of +€86 Mn (supported by the sale agreement signed on July 8, 2021), which was thus added back for the purpose
of the EPRA NRV, EPRA NTA and EPRA NDV calculation.
2.3. Deferred tax in relation to fair value movements in investment property
In the Group’s IFRS consolidated accounts, deferred tax on property assets was calculated in accordance with accounting
standards as at June 30, 2021.
As a result, and consistent with the EPRA methodology, for the purpose of the EPRA NRV calculation, deferred taxes
(€1,900 Mn) were added back for the calculation of EPRA NRV, and for the calculation of the EPRA NTA. For the EPRA
NTA calculation, -€950 Mn of effective deferred taxes were then deducted. The EPRA NDV was not adjusted.
2.4. Fair value of financial instruments
The fair value adjustment of financial instruments recorded in the IFRS consolidated statement of financial position was
added back by URW for the EPRA NRV and EPRA NTA calculation for a total amount of €692 Mn (excluding exchange
rate hedging), and remained at the IFRS value for the EPRA NDV.
Fair value movements of foreign currency hedging instruments (fair value hedges or net investment hedges) recorded in the
balance sheet and associated with foreign exchange retranslation remains in all three NAV metrics (NRV, NTA, and NDV)
to offset the movement in the underlying investment being hedged.
2.5. Goodwill as a result of deferred taxes
Goodwill booked on the balance sheet as a result of deferred taxes of -€177 Mn as at June 30, 2021, was excluded from the
EPRA NRV, EPRA NTA and EPRA NDV.
2.6. Other Goodwill as per the IFRS Balance Sheet
Goodwill booked on the balance sheet (which is mainly related to the Westfield acquisition) of -€1,049 Mn was deducted
from the EPRA NTA and EPRA NDV (net of the goodwill resulting from deferred taxes already deducted).
62 Refer to the EPRA website for more detail:
https://www.epra.com/application/files/3115/7287/4349/EPRA_BPR_Guidelines_241019.pdf.
65
2.7. Intangibles as per the IFRS Balance Sheet
Intangible assets of -€872 Mn have been deducted from the EPRA NTA.
2.8. Fair value of fixed interest rate debt
The value of the fixed rate debt on the balance sheet of the Group is equal to the nominal value of the UR debt and the fair
value of the Westfield debt at the accounting combination date (May 31, 2018). Taking fixed rate debt at its fair value would
have a negative impact of -€1,117 Mn as at June 30, 2021. This impact was taken into account in the EPRA NDV calculation.
2.9. Revaluation of intangibles to fair value
When the fair value of an intangible asset can reliably be determined and is not already included within goodwill or otherwise
recorded on the balance sheet, it is added to the EPRA NRV. The basis of valuation is disclosed. URW uses an external
valuer at least annually to determine the valuation of such intangible assets and discloses the name of the firms undertaking
the valuations. Care is taken that no double counting takes place with the Goodwill on the balance sheet.
The appraisal of property services companies in France, the US, the UK and Germany, the airport activities (excluding LAX
and Chicago), the Westfield trademark and of the operations (“fonds de commerce”) of Viparis Porte de Versailles, Paris
Nord Villepinte, Palais des Congrès de Paris and Palais des Congrès d’Issy-les-Moulineaux, meet the criteria of this
adjustment and have been so valued. This gave rise to an unrealised capital gain of +€1,106 Mn, which was added only for
the purpose of the EPRA NRV calculation.
2.10. Real estate transfer tax
As at June 30, 2021, the transfer taxes and costs deducted from asset values in the statement of financial position (in
accordance with IFRS) amounted to €1,800 Mn. For the purpose of the EPRA NRV calculation, this amount was added back.
For the purpose of the EPRA NTA calculation, the Group used the optimised net property value. Transfer taxes and
transaction costs are estimated after taking into account the likely disposal scenario: sale of the asset or of the company that
owns it. As at June 30, 2021, these estimated transfer taxes and other transaction costs compared to transfer taxes and costs
already deducted from asset values on the statement of financial position (in accordance with IFRS) came to a positive net
adjustment of +€508 Mn.
2.11. Fully diluted number of shares
Dilution from securities giving access to share capital as at June 30, 2021, was computed for such instruments “in the money”
and having fulfilled the performance conditions.
In accordance with IFRS, financial instruments and the ORNANEs63 were recorded on URW’s statement of financial position
at their fair value with the impact of the change in fair value included in the income statement and thus in the equity
attributable to the holders of the Stapled Shares.
The ORNANEs issued in 2014 and 2015 were not restated for the EPRA measures calculation as they were “out of the
money” as at June 30, 2021, and therefore had no impact on the number of shares.
The exercise of “in the money” stock-options and performance shares with the performance conditions fulfilled as at June
30, 2021, would have led to a rise in the number of shares by +442,561, without any impact on the equity attributable to the
holders of the Stapled Shares as they relate only to performance shares.
As at June 30, 2021, the fully-diluted number of shares taken into account for the EPRA measures calculations was
139,559,639.
63 Net share settled bonds convertible into new and/or existing shares (ORNANE) – see Financial resources note.

66
2.12. URW’s EPRA NRV
URW’s EPRA NRV stood at €22,667 Mn or €162.40 per share (fully-diluted) as at June 30, 2021. The EPRA NRV per share
decreased by -€4.40 (or -2.6%) compared to December 31, 2020.
The decrease of -€4.40 compared to December 31, 2020, was the sum of: (i) -€1.92 per share of changes in Equity attributable
to the holders of the Stapled Shares representing the sum of: (a) -€7.14 per share representing the revaluation of investment
properties, the impairment of goodwill and intangible assets and the capital gains on disposals, (b) the Recurring Earnings
Per Share of +€3.41, and (c) other effects of +€1.81 per share (mainly related to a positive FX impact); and (ii) -€2.48 per
share of changes due to NAV adjustments representing the sum of: (a) -€1.70 per share of impact of fair value of financial
instruments adjustment, (b) -€0.88 per share of impact of deferred taxes on Balance sheet, (c) the revaluation of the operating
asset (7 Adenauer) of URW for +€0.23 per share, and (d) -€0.13 per share of other effects.
2.13. URW’s EPRA NTA
URW’s EPRA NTA stood at €17,399 Mn or €124.70 per share (fully-diluted) as at June 30, 2021. The EPRA NTA per share
decreased by -€3.40 (or -2.7%) compared to December 31, 2020.
The decrease of -€3.40 compared to December 31, 2020, was the sum of: (i) -€1.92 per share of changes in Equity attributable
to the holders of the Stapled Shares representing the sum of: (a) -€7.14 per share representing the revaluation of investment
properties, the impairment of goodwill and intangible assets and the capital gains on disposals, (b) the Recurring Earnings
Per Share of +€3.41, and (c) other effects of +€1.81 per share (mainly related to a positive FX impact); and (ii) -€1.48 per
share of changes due to NAV adjustments representing the sum of: (a) -€1.70 per share of impact of fair value of financial
instruments adjustment, (b) -€0.44 per share of impact of deferred taxes on Balance sheet and effective deferred taxes, (c) the
revaluation of the operating asset (7 Adenauer) of URW for +€0.23 per share, and (d) +€0.43 per share of other effects.
2.14. URW’s EPRA NDV
URW’s EPRA NDV stood at €15,003 Mn or €107.50 per share (fully-diluted) as at June 30, 2021. The EPRA NDV per share
decreased by -€3.00 (or -2.7%) compared to December 31, 2020.
The decrease of -€3.00 compared to December 31, 2020, was the sum of: (i) -€1.92 per share of changes in Equity attributable
to the holders of the Stapled Shares representing the sum of: (a) -€7.14 per share representing the revaluation of investment
properties, the impairment of goodwill and intangible assets and the capital gains on disposals, (b) the Recurring Earnings
Per Share of +€3.41, and (c) other effects of +€1.81 per share (mainly related to a positive FX impact); and (ii) -€1.08 per
share of changes due to NAV adjustments representing the sum of: (a) -€1.81 per share of impact of fair value adjustment of
fixed interest rate debt, (b) the revaluation of the operating asset (7 Adenauer) of URW for +€0.23 per share, and (c) +€0.50
per share of other effects.

67
3. EPRA Net Asset Value metrics table
Figures may not add up due to rounding.
(1) Difference between development property held on the balance sheet at cost and fair value of that development property.
(2) Revaluation of intangibles are presented under adjustment (x). Revaluation of Intangibles to fair value is not under this line item. (3) Difference between finance lease receivables held on the balance sheet at amortised cost and the fair value of those finance lease receivables.
(4) Difference between trading properties held on the balance sheet at cost (IAS 2) and the fair value of those trading properties.
(5) Deferred tax adjustment for NTA calculated in line with the EPRA guidelines. (6) Real estate transfer taxes were adjusted in accordance with the EPRA guidelines.
* “Include” indicates that an asset (whether on or off balance sheet) should be added to the shareholders’ equity, whereas a liability should be deducted.
* “Exclude” indicates that an asset (part of the balance sheet) is reversed, whereas a liability (part of the balance sheet) is added back.
EPRA NRV EPRA NTA EPRA NDV
Equity attributable to the holders of the Stapled Shares (IFRS) 17,223 17,223 17,223
Include / Exclude*:
i) Hybrid instruments 36 36 36
Diluted NAV 17,259 17,259 17,259
Include*:
ii.a) Revaluation of IP (if IAS 40 cost option is used) 86 86 86
ii.b) Revaluation of IPUC(1)
(if IAS 40 cost option is used) 0 0 0
ii.c) Revaluation of other non-current investments(2) 0 0 0
iii) Revaluation of tenant leases held as finance leases(3) 0 0 0
iv) Revaluation of trading properties(4) 0 0 0
Diluted NAV at Fair Value 17,345 17,345 17,345
Exclude*:
v) Deferred tax in relation to fair value gains of IP(5)
detailled below:
v.a) Reversal of deferred taxes on Balance sheet 1,900 1,900 -
v.b) Effective deferred taxes on capital gains - 950 - -
vi) Fair value of financial instruments 692 692 -
vii) Goodwill as a result of deferred tax 177 - 177 - 177 -
viii.a) Goodwill as per the IFRS balance sheet (net of vii)) - 1,049 - 1,049 -
viii.b) Intangibles as per the IFRS balance sheet - 872 - -
Include*:
ix) Fair value of fixed interest rate debt - - 1,117 -
x) Revaluation of intangibles to fair value 1,106 - -
xi) Real estate transfer tax(6) 1,800 508 -
NAV 22,667 17,399 15,003
Fully diluted number of shares 139,559,639 139,559,639 139,559,639
NAV per share €162.40 €124.70 €107.50
June 30, 2021

68
Figures may not add up due to rounding.
(1) Difference between development property held on the balance sheet at cost and fair value of that development property. (2) Revaluation of intangibles are presented under adjustment (x). Revaluation of Intangibles to fair value is not under this line item.
(3) Difference between finance lease receivables held on the balance sheet at amortised cost and the fair value of those finance lease receivables.
(4) Difference between trading properties held on the balance sheet at cost (IAS 2) and the fair value of those trading properties. (5) Deferred tax adjustment for NTA calculated in line with the EPRA guidelines.
(6) Real estate transfer taxes were adjusted in accordance with the EPRA guidelines.
* “Include” indicates that an asset (whether on or off balance sheet) should be added to the shareholders’ equity, whereas a liability should be deducted. * “Exclude” indicates that an asset (part of the balance sheet) is reversed, whereas a liability (part of the balance sheet) is added back.
EPRA NRV EPRA NTA EPRA NDV
Equity attributable to the holders of the Stapled Shares (IFRS) 17,394 17,394 17,394
Include / Exclude*:
i) Hybrid instruments - - -
Diluted NAV 17,394 17,394 17,394
Include*:
ii.a) Revaluation of IP (if IAS 40 cost option is used) 54 54 54
ii.b) Revaluation of IPUC(1)
(if IAS 40 cost option is used) 0 0 0
ii.c) Revaluation of other non-current investments(2) 0 0 0
iii) Revaluation of tenant leases held as finance leases(3) 0 0 0
iv) Revaluation of trading properties(4) 0 0 0
Diluted NAV at Fair Value 17,447 17,447 17,447
Exclude*:
v) Deferred tax in relation to fair value gains of IP(5)
detailled below:
v.a) Reversal of deferred taxes on Balance sheet 2,023 2,023 -
v.b) Effective deferred taxes on capital gains - 1,011 - -
vi) Fair value of financial instruments 929 929 -
vii) Goodwill as a result of deferred tax 200 - 200 - 200 -
viii.a) Goodwill as per the IFRS balance sheet (net of vii)) - 1,049 - 1,049 -
viii.b) Intangibles as per the IFRS balance sheet - 876 - -
Include*:
ix) Fair value of fixed interest rate debt - - 865 -
x) Revaluation of intangibles to fair value 1,113 - -
xi) Real estate transfer tax(6) 1,836 522 -
NAV 23,148 17,785 15,334
Fully diluted number of shares 138,786,602 138,786,602 138,786,602
NAV per share €166.80 €128.10 €110.50
Dec. 31, 2020

69
Figures may not add up due to rounding.
(1) Difference between development property held on the balance sheet at cost and fair value of that development property.
(2) Revaluation of intangibles are presented under adjustment (x). Revaluation of Intangibles to fair value is not under this line item.
(3) Difference between finance lease receivables held on the balance sheet at amortised cost and the fair value of those finance lease receivables.
(4) Difference between trading properties held on the balance sheet at cost (IAS 2) and the fair value of those trading properties.
(5) Deferred tax adjustment for NTA calculated in line with the EPRA guidelines.
(6) Real estate transfer taxes were adjusted in accordance with the EPRA guidelines. * “Include” indicates that an asset (whether on or off balance sheet) should be added to the shareholders’ equity, whereas a liability should be deducted.
* “Exclude” indicates that an asset (part of the balance sheet) is reversed, whereas a liability (part of the balance sheet) is added back.
June 30, 2021 Dec. 31, 2020 June 30, 2020
Equity attributable to the holders of the Stapled Shares (IFRS) 17,223 17,394 21,539
Include / Exclude*:
i) Hybrid instruments 36 - -
Diluted NAV 17,259 17,394 21,539
Include*:
ii.a) Revaluation of IP (if IAS 40 cost option is used) 86 54 54
ii.b) Revaluation of IPUC(1)
(if IAS 40 cost option is used) 0 0 0
ii.c) Revaluation of other non-current investments(2) 0 0 0
iii) Revaluation of tenant leases held as finance leases(3) 0 0 0
iv) Revaluation of trading properties(4) 0 0 0
Diluted NAV at Fair Value 17,345 17,447 21,593
Exclude*:
v) Deferred tax in relation to fair value gains of IP(5)
detailled below:
v.a) Reversal of deferred taxes on Balance sheet 1,900 2,023 2,156
v.b) Effective deferred taxes on capital gains - - -
vi) Fair value of financial instruments 692 929 1,154
vii) Goodwill as a result of deferred tax 177 - 200 - 205 -
viii.a) Goodwill as per the IFRS balance sheet (net of vii)) - - -
viii.b) Intangibles as per the IFRS balance sheet - - -
Include*:
ix) Fair value of fixed interest rate debt - - -
x) Revaluation of intangibles to fair value 1,106 1,113 703
xi) Real estate transfer tax(6) 1,800 1,836 1,962
EPRA NRV 22,667 23,148 27,362
Fully diluted number of shares 139,559,639 138,786,602 138,882,932
EPRA NRV per share €162.40 €166.80 €197.00
% of change over six months -2.6% -15.3% -13.9%
% of change over one year -17.6% -27.1% -
EPRA NRV

70
Figures may not add up due to rounding.
(*) Revaluation of property assets is -€7.64 per share on a like-for-like basis, of which -€4.19 due to the yield effect and -€3.45 due to the rent effect.
EPRA NRV EPRA NTA EPRA NDV
As at December 31, 2020, per share €166.80 €128.10 €110.50
Recurring Net Result 3.41 3.41 3.41
Revaluation of Investment Properties * 7.72 - 7.72 - 7.72 -
Shopping Centres 8.00 -
Offices & Others 0.55
Convention & Exhibition 0.27 -
Depreciation or impairment of intangibles 0.16 - 0.16 - 0.16 -
Impairment of goodwill - - -
Capital gain on disposals 0.73 0.73 0.73
Subtotal revaluations, impairments and capital gain on disposals 7.14 - 7.14 - 7.14 -
Mark-to-market of debt and financial instruments 0.22 0.22 0.22
Taxes on non-recurring result 0.53 0.53 0.53
Other non-recurring result 0.01 - 0.01 - 0.01 -
Subtotal non-recurring financial expenses, taxes and other 0.75 0.75 0.75
Distribution - - -
Other changes in Equity attributable to the holders of the Stapled Shares 1.07 1.07 1.07
Total changes in Equity attributable to the holders of the Stapled Shares 1.92 - 1.92 - 1.92 -
Impact of potential issuance of Stock Options and number of shares 0.26 0.26 0.26
Revaluation of Investment Properties (operating assets) 0.23 0.23 0.23
Impact of deferred taxes on Balance sheet and effective deferred taxes 0.88 - 0.44 - -
Impact of fair value of financial instruments adjustment 1.70 - 1.70 - -
Impact of impairment or changes in goodwill as per the IFRS balance sheet 0.16 0.16 0.16
Impact of real estate transfer tax 0.26 - 0.10 - -
Impact from intangible assets 0.05 - 0.03 -
Impact of fair value adjustment of fixed interest rate debt - - 1.81 -
Impact of change in the number of fully diluted Stapled Shares 0.26 - 0.06 0.07
Total changes due to NAV adjustments 2.48 - 1.48 - 1.08 -
As at June 30, 2021, per share (fully diluted) €162.40 €124.70 €107.50
Evolution of EPRA NRV, EPRA NTA and EPRA NDV - per share (fully diluted)

71
5. FINANCIAL RESOURCES
In H1-2021, market sentiment started to improve with the accelerated vaccine roll-out and some positive signs towards a
global economic recovery, thanks to the gradual easing of restrictions/lockdowns and the support from governments and
Central Banks.
This context supported credit markets although issuance volumes were below last year’s historically high levels.
URW took advantage of the favourable market conditions to raise €4,600 Mn64 of medium to long-term funds in the bond
and bank markets including credit facility extensions. As at June 30, 2021, the Group had €12.5 Bn of cash on hand and
undrawn credit lines (€12.7 Bn on a proportionate basis).
As the Group’s financial covenants are calculated in accordance with IFRS, unless otherwise indicated, the financial
information in this section is presented in accordance with IFRS. The Group also provides such information on a
proportionate basis (see comparative table in section 5).
Unless otherwise indicated, comparisons to ratios, debt outstanding, average cost of debt, the amount of undrawn credit lines
and cash on hand relate to December 31, 2020.
As at June 30, 202165:
▪ The Interest Coverage Ratio66 (“ICR”) was 2.9x67 (3.5x68);
▪ The Funds From Operations (FFO)69 to Net Financial Debt Ratio (“FFO/NFD”) was 4.3%70 (4.8%71);
▪ 72The Loan-to-Value (“LTV”) ratio was 44.4 73% (44.7%).
These ratios have been impacted by the COVID-19 restrictions. In view of these circumstances, URW’s lending banks
granted waivers on covenants under which a potential breach may have been triggered either at the Group level for the
corporate debt or at the asset level for mortgage financings.
The average cost of debt for the period was 1.9% (1.7%), representing the blended average cost of 1.4% for Euro and SEK
denominated debt and 3.9% for USD and GBP denominated debt.
1. Debt structure as at June 30, 2021
URW’s gross financial debt74 was €26,162 Mn (€26,385 Mn).
The gross financial debt includes €603 Mn of net share settled bonds convertible into new and/or existing URW stapled
shares (ORNANE) issued in June 2014 (€103 Mn maturing on July 1, 2021) and in April 2015 (€500 Mn maturing on January
1, 2022).
The net financial debt was €23,467 Mn (€24,248 Mn), excluding partners' current accounts and taking into account cash on
hand of €2,695 Mn75 (€2,138 Mn), following the additional funds raised by the Group.
64 On IFRS basis. 65 Hybrid securities are accounted for as equity. The hybrid securities are deeply subordinated perpetual instruments with a coupon deferral
option and are required to be classified as equity under IFRS. Details on the hybrid securities are available at:
https://images-urw.azureedge.net/-/media/Corporate~o~Sites/Unibail-Rodamco-Corporate/Files/Homepage/INVESTORS/Financing-
Activity/Bond-Issues/Prospectuses-Hybrid/20180423-2018-Prospectus-Hybrid_onlyEN.ashx?revision=035329ae-9e2d-4980-a5c7-
97b97e3f2fd1 66 Recurring EBITDA / Recurring Net Financial Expenses (including capitalised interest). Recurring EBITDA is calculated as total
recurring operating result and other income minus general expenses, excluding depreciation and amortisation. 67 2.7x on a proportionate basis. 68 3.1x on a proportionate basis. 69 Funds From Operations: on an annualised basis, the recurring EBITDA minus (i) recurring net financial expenses and (ii) tax on recurring
operating result. 70 3.9% on a proportionate basis. 71 4.4% on a proportionate basis. 72 Net financial debt as shown on the Group’s balance sheet, after the impact of derivative instruments on debt raised in foreign currencies
/ total assets, including transfer taxes (46.0% excluding transfer taxes). The proportionate LTV ratio as at June 30, was 46.0% (47.8%
excluding transfer taxes). 73 Excluding €1,106 Mn of goodwill not justified by fee business as per the Group’s European bank debt leverage covenants. 74 After impact of derivative instruments on debt raised in foreign currencies. Excluding financial leases accounted as debt under IFRS 16. 75 €2,835 Mn on a proportionate basis.

72
Pro-forma for the receipt of the proceeds from the disposal of the 45% stake in Shopping City Süd and the full disposal of
the 7 Adenauer office building, the net financial debt would be €22,979 Mn76.
In H1-2021, the decrease in net debt is primarily a result of:
▪ the completion of disposals mainly SHiFT, the Les Villages 3, 4 and 6 office buildings and the 60% stake in Aupark;
▪ the foreclosure of four US assets previously fully consolidated (Westfield Sarasota, Westfield Citrus Park, Westfield
Broward and Westfield Countryside), following which URW will not own the assets and will not be liable for the $411 Mn
non-recourse mortgage debt secured by these assets;
▪ retained cashflow over the period;
partly offset by:
▪ the full consolidation of JV entities debt following the acquisition of the JV partners’ 47% stake in two US assets
(Westfield Palm Desert and Westfield Trumbull);
▪ capital expenditures spent over the period;
▪ foreign exchange evolution on the debt raised in USD and GBP (impact of €171 Mn) 77 78.
1.1. Debt breakdown
URW’s gross financial debt as at June 30, 202179:
IFRS
(€ Mn) Proportionate
(€ Mn)
EMTN 18,618 18,618
Rule 144A and other Regulation S bonds 4,719 4,719
ORNANE 603 603
Short term paper 720 720
Bank loans and overdrafts 235 236
Mortgage loans in Europe 700 1,666
Mortgage loans in the US 567 1,579
Total 26,162 28,141
The medium to long-term corporate debt issued by the various URW entities is cross guaranteed.
No loans are subject to prepayment clauses linked to the Group’s credit ratings80.
On a proportionate basis, the Group’s gross financial debt stood at €28,141 Mn81 (€28,324 Mn) and the net financial debt at
€25,306 Mn (€26,054 Mn), after taking into account the cash on hand.
Pro-forma for the receipt of the proceeds from the disposal of the 45% stake in Shopping City Süd and the full disposal of
the 7 Adenauer office building, the net financial debt would be €24,818 Mn.
76 As Shopping City Süd will remain fully consolidated, the €351 Mn non-recourse debt raised by the JV entity that owns the asset (which
is 55% owned by URW), is fully consolidated at 100% in URW’s IFRS and proportionate debt. 77 Based on following exchange rates as at June 30, 2021: EUR/USD 1.1884, EUR/GBP 0.8581 and EUR/SEK 10.111 vs. exchange rates
as at December 31, 2020: EUR/USD 1.2271, EUR/GBP 0.8990 and EUR/SEK 10.0343. 78 On a proportionate basis: €222 Mn. 79 Figures may not add up due to rounding. 80 Barring exceptional circumstances (change in control). 81 The sum of: (i) IFRS debt, and (ii) the Group’s share of debt at joint ventures accounted for using the equity method under IFRS, most
of which is secured by assets held in joint ventures.

73
The Group’s financing sources are as follows:
The split of the gross financial debt by currency is as follows:82
82 Figures may not add up due to rounding.
€23,337 Mn
89%
€603 Mn
2%
€720 Mn
3%
€1,502 Mn
6%
IFRS DEBT
€23,337 Mn
83%
€603 Mn
2%
€720 Mn
3%
€3,481 Mn
12%
PROPORTIONATE DEBT
€20,629 Mn
79%
€932 Mn
3%
€247 Mn
1%
€4,353 Mn
17%
IFRS DEBT
€21,158 Mn
75%
€1,369 Mn
5%
€247 Mn
1%
€5,366 Mn
19%
PROPORTIONATE DEBT
€26,162 Mn €28,141 Mn
€26,162 Mn €28,141 Mn

74
1.2. Funds Raised
Bond market:
Despite the challenging market conditions, the Group secured additional liquidity and increased83 its debt maturity, through
the following public EMTN Bonds issued on May 25, 2021:
✓ €650 Mn with a 0.75% coupon and 7-year and 5-month maturity;
✓ €600 Mn with a 1.375% coupon and 12-year maturity.
In total, €1,250 Mn of bonds were issued with a weighted average maturity of 9.6 years and a weighted average coupon of
1.05%.
Short to medium term paper:
URW also accessed the money markets by issuing short-term paper.
The average outstanding amount of short-term paper84 in H1-2021 was €822 Mn (€1,364 Mn on average in 2020).
Credit facility and cash:
Furthermore, the signing of €3,350 Mn of credit facilities were completed in H1-2021, including:
▪ A €250 Mn bilateral credit facility with a maturity of three years;
▪ The largest sustainability-linked revolving credit facility for a REIT in Europe, for an amount of €3,100 Mn, with a five-
year maturity. The credit facility replaces €1,600 Mn of credit lines that were scheduled to mature in 2021 and €800 Mn
due to mature in 2022, 2023 and 2024. It includes new funding for an amount of €700 Mn either from new banks or
existing banks increasing their exposure to URW.
As at June 30, 2021, the total amount of undrawn credit lines85 came to €9,832 Mn (€9,240 Mn) as a result of the signing of
the €3,350 Mn credit facilities offset by maturing credit facilities. The undrawn credit lines include a $3,200 Mn (c.
€2,693 Mn) multi-currency revolving credit facility.
The average residual maturity of these undrawn credit lines stands at 2.7 years.
The cash on hand amounts to €2,695 Mn (€2,138 Mn), which will be used to repay debt maturities coming due in the next
12-months. It was placed on bank current accounts or deposit accounts.
Mortgage debt:
- Westfield Sarasota, Westfield Citrus Park, Westfield Broward and Westfield Countryside (US)
Following the foreclosure of four US assets, the asset values and the debt attached were deconsolidated as URW will not
own nor be liable for the debt of $411 Mn on these assets.
- Westfield Palm Desert and Westfield Trumbull (US)
As at December 31, 2020, Westfield Palm Desert and Westfield Trumbull assets and non-recourse mortgage debts were not
consolidated in URW’s IFRS accounts and were accounted at 53% in URW’s proportionate assets and debts.
In May 2021, the Group acquired the 47% JV partner’s stake in these two US assets.
As at June 30, 2021, these properties and their related non-recourse mortgage debt were fully consolidated in URW’s
accounts, corresponding to a total debt amount of $277 Mn.
- Centrum Ursynów (Europe)
In May 2021, following the Group purchase of its JV partner’s share (40%) in Centrum Ursynów, the Group’s stake in this
Polish asset has increased from 10% to 50%. As the Group retains joint control of the asset, the non-recourse debt is not
consolidated in URW’s IFRS debt and is accounted at 50% (€19 Mn) in URW’s proportionate debt.
- Aupark (Europe)
The entity which acquired Aupark raised a non-recourse mortgage loan of €229.5 Mn with a 5-year maturity. As the Group
retains, through its 40% stake in this entity, joint control of the asset, this non-recourse debt is not consolidated in URW’s
IFRS debt and is accounted at 40% (€92 Mn) in URW’s proportionate debt.
83 Taking into account the undrawn credit lines and cash on hand. 84 Neu CP. 85 Subject to covenants.

75
- Westfield Arkadia (Europe)
On June 30, 2021, the Group fully prepaid a mortgage loan held by Westfield Arkadia for an amount of €200 Mn maturing
in December 2021, financed with the available cash.
- Shopping City Süd (Europe)
In the context of the disposal of a 45% stake in Shopping City Süd, a non-recourse mortgage loan was put in place in July 21,
2021, for a total amount of €351 Mn with a 7-year maturity at a current cost of 1.39%.
This debt will be fully consolidated in URW’s accounts86.
1.3. Debt maturity
The average maturity of the Group’s debt as at June 30, 2021, taking into account the undrawn credit lines87 and cash on
hand, stood at 8.7 years.
The following chart illustrates the split of URW’s net financial debt as at June 30, 2021, by maturity date, after the allocation
of the undrawn part of the credit lines and based on the residual life of its facilities.
100% of the debt had a maturity of more than three years as at June 30, 2021 (after taking into account undrawn credit lines
and cash on hand).
86 As Shopping City Süd will remain fully consolidated, the €351 Mn non-recourse debt raised by the JV, held at 55% by URW and owning
the asset, is fully consolidated at 100% in URW’s IFRS and proportionate debt. 87 Subject to covenants.
0% 0% 0%
8%
23%
69%
0
2
4
6
8
10
12
14
16
18
-1 Y 1-2 Y 2-3 Y 3-4 Y 4-5 Y More than 5Y
€B
n

76
The average maturity of the Group’s debt as at June 30, 2021, without taking into account the undrawn credit lines and cash
on hand, stood at 7.6 years.
The following chart illustrates URW’s gross financial debt as at June 30, 2021, by maturity date without taking into account
cash on hand and available credit lines.
Liquidity needs
URW’s debt repayment needs for the next 12-months (€2,693 Mn)88 are fully covered by the cash on hand (€2,695 Mn)89
and available undrawn credit lines90 (€9,832 Mn). These debt repayment needs have been reduced by €200 Mn of early
repayment completed in 2021 (Arkadia mortgage loan).
The amount of bonds, ORNANE, mortgage and bank loans outstanding as at June 30, 2021, and maturing or amortising
within one year is €1,962 Mn (including €1,696 Mn of bonds and ORNANE). The amount of short term paper maturing in
the next 12-months is €720 Mn.
The credit facilities maturing over the next 12-months stands at €3,724 Mn including:
▪ EUR denominated credit facilities for an amount of €858 Mn;
▪ SEK denominated credit facilities for an amount of SEK1,750 Mn;
▪ USD denominated credit facility for an amount of $3,200 Mn with a total one-year extension option for URW.
URW is contemplating the opportunities to extend or renew part of these lines.
88 Including short term paper (€720 Mn) and overdrafts (€10 Mn) and excluding mortgage debt under foreclosure in the US. 89 To be noted that the cash on hand and net debt does not include €488 Mn proceeds from the disposal of the 45% stake in Shopping City
Süd and the full disposal of the 7 Adenauer office building. 90 Subject to covenants.
10%
3%5%
12%
8%
61%
0
2
4
6
8
10
12
14
16
18
-1 Y 1-2 Y 2-3 Y 3-4 Y 4-5 Y More than 5Y
€B
n

77
1.4. Average cost of debt
The average cost of debt as at June 30, 2021, was 1.9% (1.7%), representing the blended average cost of 1.4% for Euro and
SEK denominated debt and 3.9% for USD and GBP denominated debt.
This average cost of debt results from:
▪ The low coupon levels the Group achieved on its fixed rate debt;
▪ The level of margins on existing borrowings;
▪ The hedging instruments in place;
▪ The cost of carry of the undrawn credit lines and cash raised to improve the Group’s liquidity position;
▪ The cost of debt to finance the Westfield acquisition;
▪ Higher base rates in the US and the UK and debt issued by Westfield prior to completion of the acquisition;
▪ The impact of rating downgrade in 2020 and 2021 on the cost of its credit lines and its financing.
2. Ratings
URW has a solicited rating from both Standard & Poor’s (S&P) and Moody’s.
On March 4, 2021, Moody’s downgraded URW’s long-term rating from “Baa1” to “Baa2” and changed the outlook from
“rating under review for downgrade” to “stable”.
On May 14, 2021 S&P published a credit update confirming the “BBB+” long term rating of the Group and its “Negative”
outlook.
3. Market risk management
Market risks can generate losses resulting from fluctuations in interest rates, exchange rates, raw material prices and share
prices. URW's risk mainly relates to interest rate fluctuations on the debt it has taken out to finance its investments and
maintain the cash position it requires and exchange rate fluctuations due to the Group’s activities in countries outside the
Eurozone, in particular in the US and the UK. The Group, through its activities, may be exposed to market risks which can
generate losses as a result of fluctuations in stock markets. The Group is either: (i) directly exposed to fluctuations in stock
prices due to the ownership of shares or financial instruments, or, (ii) indirectly exposed to fluctuations in stock prices, due
to the ownership of funds, investment instruments or share based derivatives which are directly correlated with the price of
the asset underlying such derivatives.
URW's interest risk management policy aims to limit the impact of interest rate fluctuations on results, while minimising the
overall cost of debt. To achieve these objectives, the Group uses derivatives, mainly caps and swaps, to hedge its interest rate
exposure through a macro hedging policy.
URW’s exchange rate policy objective is to have a LTV ratio that is broadly consistent91 currency by currency. Thus, the
Group raises debt in local currency, uses derivatives and buys or sells foreign currencies at spot or forward rates.
Due to its use of derivatives, the Group is exposed to potential counterparty defaults. The counterparty risk is the risk of
replacing the derivative transactions at current market rates in the case of default. The Group implemented IFRS 13 for the
mark-to-market calculations of its derivative transactions.
3.1. Interest rate risk management
The following two bonds issued in H1-2021 were swapped to a floating rate:
▪ €650 Mn with a 0.75% coupon and 7-year and 5-month maturity;
▪ €600 Mn with a 1.375% coupon and 12-year maturity.
Based on its current disposal and investment plans, the existing debt92 and the debt the Group expects to raise in the coming
years are fully hedged.
91 On a proportionate basis. 92 On a proportionate basis.

78
The graph above shows:
▪ The part of the debt kept at a fixed rate;
▪ The hedging instruments used to hedge the variable rate debt and the fixed rate debt immediately converted into variable
rate debt, through the Group’s macro hedging policy.
URW in general does not classify its financial hedging instruments as cash flow hedges. As a result, any fair value changes
in these instruments are recognised in the Group’s income statement.
Measuring interest rate exposure
The interest rate cost of outstanding debt was fully hedged as at June 30, 2021, through both:
▪ Debt kept at a fixed rate; and
▪ Hedging in place as part of URW’s macro hedging policy.
Based on the estimated average proportionate debt position of URW in H2-2021, if interest rates (Euribor, Libor, Stibor or
Pribor) were to rise by an average of +50 bps93 during the H2-2021, the estimated negative impact on financial expenses
would be €22.9 Mn, decreasing the H2-2021 recurring net result by a broadly similar amount:
▪ Euro financial expenses would increase by €22.9 Mn;
▪ No impact on Dollar financial expenses;
▪ No impact on Sterling financial expenses.
An additional +50 bps would increase financial expenses by a further €22.7 Mn.
In total, a +100 bps increase in interest rates during H2-2021 would have a net negative impact on financial expenses of
€45.6 Mn.
A -50 bps drop in interest rates would have a positive impact on the financial expenses of €22.9 Mn, increasing the recurring
net profit in H2-2021 by a broadly equivalent amount:
▪ Euro financial expenses would decrease by €22.9 Mn;
▪ No impact on Dollar financial expenses;
▪ No impact on Sterling financial expenses.
93 The impact on exchange rates due to this theoretical increase of +50 bps in interest rates is not taken into account. The theoretical impact
of a rise or decrease in interest rates is calculated relative to the applicable rates as at June 30, 2021: 3m Euribor (-0.542%), 3m USD Libor
(0.146%) and 3m GBP Libor (0.078%).
€0 Bn
€5 Bn
€10 Bn
€15 Bn
€20 Bn
€25 Bn
€30 Bn
€35 Bn
H2 2021 2022 2023 2024 2025
Annual projection of average hedging amounts and fixed rate debt up to 2025
(€ Bn - as at June 30, 2021)
Total macro hedges incl. swaps and caps Total debt kept at fixed rate

79
3.2. Foreign exchange risk management
The Group is active in countries outside the Eurozone. When converted into euros, the income and value of the Group’s
investments may be influenced by fluctuations in exchange rates against the euro. The Group’s policy objective is to apply a
broadly consistent LTV by currency allowing it to match part of the foreign currency asset value and income with debt and
financial expenses in the same currency, thus reducing the exchange rate effects on the Group’s balance sheet and earnings.
Foreign exchange risk can be hedged by either matching investments in a specific currency with debt in the same currency
or using derivatives to achieve the same risk management goal.
In millions* Euros94 USD GBP Total eq. EUR
Assets95 37,956 13,756 2,804 52,798
Net Financial Debt 18,282 5,068 789 23,467
LTV 96 48.2% 36.8% 28.1% 44.4%
*In local currencies
On a proportionate basis, the Group’s LTV was 46.0% as at June 30, 2021.
Currency risk during the building period of pipeline investments is covered as early as possible after signing the actual
building contract.
Measure of exposure to foreign exchange risks (€ Mn)97
Currency Assets Liabilities Net exposure Hedging
Instruments
Exposure
net of hedges
USD 11,626 -5,509 6,117 0 6,117
GBP 2,783 -1,169 1,614 0 1,614
SEK 2,605 -732 1,874 0 1,874
Others 523 -598 -76 441 365
Total 17,538 -8,008 9,530 441 9,970
The main exposures kept are in USD, GBP and SEK. A change of 10% of EUR/USD, EUR/GBP or EUR/SEK (i.e. a +10%
increase of EUR against the USD, GBP or SEK in H2-2021) would have an impact on shareholders’ equity and on the
recurring net result as follows:
Impact on
in € Mn Shareholder's Equity Recurring Net Result
+10% in EUR/USD -556.1 -5.8
+10% in EUR/GBP -146.7 -3.4
+10% in EUR/SEK -170.3 -3.9
The impact on the recurring net result (or conversely a positive impact in case of a decrease of EUR vs. these currencies)
would be fully offset by the FX hedging that the Group has put in place against EUR/USD, EUR/GBP, EUR/SEK
fluctuations.
94 Including SEK. 95 Including transfer taxes and excluding €1,106 Mn of goodwill not justified by fee businesses. 96 The LTV per currency, on a proportionate basis, is 48.6%, 41.4%, 35.2% in EUR, USD and GBP, respectively. 97 Liabilities include, but are not limited to, the debt raised in the given currencies and deferred tax liabilities.

80
As at June 30, 2021, the SEK1,750 Mn credit line signed in December 2017 and the $3,200 Mn revolving credit facility
signed in June 2018 are undrawn.
4. Financial structure
As at June 30, 2021, the GMV of the Group’s assets was €52,798 Mn (€54,966 Mn on a proportionate basis).
4.1. LTV ratio
The LTV ratio was 44.4%98 (44.7%). The LTV decrease is mainly due to:
▪ the impact of disposals mainly SHiFT, the Les Villages 3, 4 and 6 office buildings and of the 60% stake in Aupark;
▪ the foreclosure of four US assets (Westfield Sarasota, Westfield Citrus Park, Westfield Broward and Westfield
Countryside);
▪ the retained cash flow net of the capital expenditure over the period.
partly offset by:
▪ lower valuations;
▪ the full consolidation of JV entities following the acquisition of the JV partners’ shares in two US assets (Westfield
Palm Desert and Westfield Trumbull).
Pro-forma for the receipt of the proceeds from the disposal of a 45% stake in Shopping City Süd and the full disposal of the
7 Adenauer office building:
▪ the LTV would go down to 43.7% on an IFRS basis;
▪ the LTV would go down to 45.4% on a proportionate basis.
Upon completion of the disposal of the 45% stake in Shopping City Süd and the full disposal of the 7 Adenauer office
building, the Group will have completed €1.7 Bn of its €4.0 Bn disposal plan in Europe, bringing the total disposals since
June 2018 to €6.5 Bn.
4.2. Interest coverage ratio
The ICR for the period stood at 2.9x99 (3.5x).
This decrease results from (i) a decrease in EBITDA that is mainly due to the impact of COVID-19 and (ii) an increase in
the cost of debt due in particular to the cost of carry of liquidity.
Financial ratios June 30, 2021 Dec. 31, 2020
LTV 44.4% 44.7%
ICR 2.9x 3.5x
4.3. Net debt/ EBITDA ratio
Although it is not part of URW’s corporate debt covenants, the Group has set itself a Net debt/EBITDA target of 9x.
The Net debt/EBITDA100 stands at 16.6x (14.6x) as a result of the significant impact of COVID-19 in H2-2020 and H1-2021
EBITDA.
98 Excluding €1,106 Mn of goodwill not justified by fee businesses as per the Group’s European leverage covenants. 99 Proportionate ICR: 2.7x. 100 On last 12-months basis.
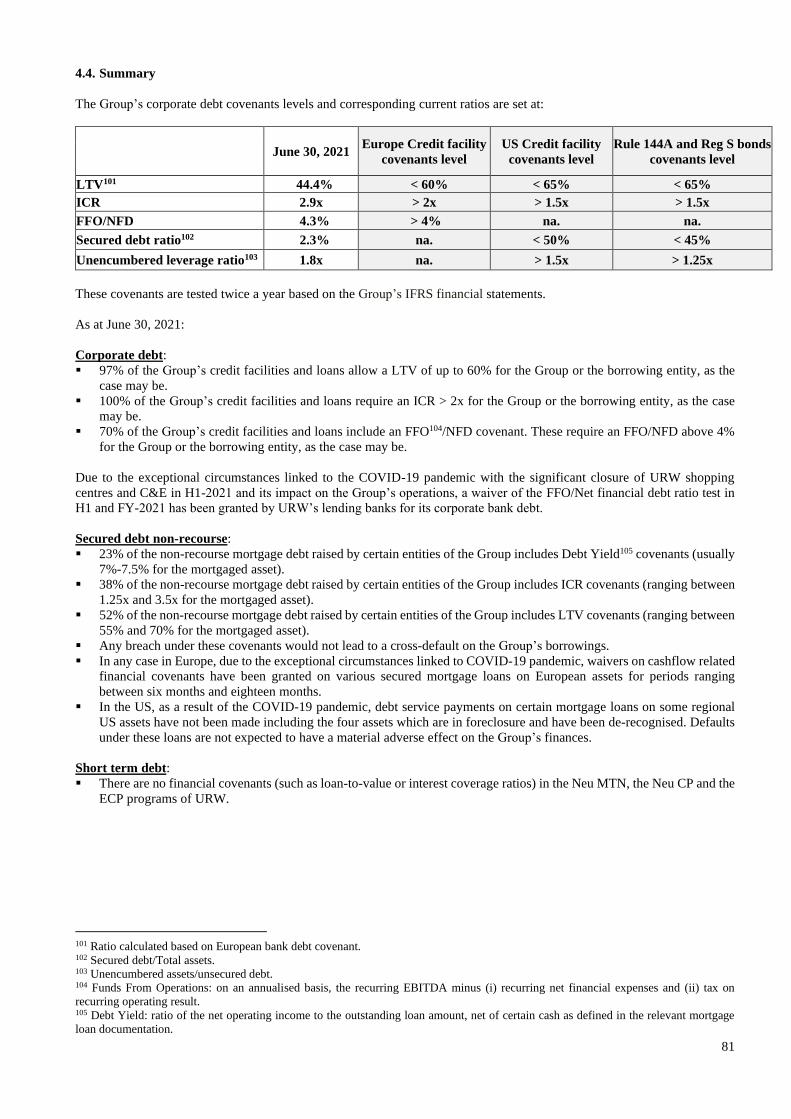
81
4.4. Summary
The Group’s corporate debt covenants levels and corresponding current ratios are set at:
June 30, 2021 Europe Credit facility
covenants level
US Credit facility
covenants level
Rule 144A and Reg S bonds
covenants level
LTV101 44.4% < 60% < 65% < 65%
ICR 2.9x > 2x > 1.5x > 1.5x
FFO/NFD 4.3% > 4% na. na.
Secured debt ratio102 2.3% na. < 50% < 45%
Unencumbered leverage ratio103 1.8x na. > 1.5x > 1.25x
These covenants are tested twice a year based on the Group’s IFRS financial statements.
As at June 30, 2021:
Corporate debt:
▪ 97% of the Group’s credit facilities and loans allow a LTV of up to 60% for the Group or the borrowing entity, as the
case may be.
▪ 100% of the Group’s credit facilities and loans require an ICR > 2x for the Group or the borrowing entity, as the case
may be.
▪ 70% of the Group’s credit facilities and loans include an FFO104/NFD covenant. These require an FFO/NFD above 4%
for the Group or the borrowing entity, as the case may be.
Due to the exceptional circumstances linked to the COVID-19 pandemic with the significant closure of URW shopping
centres and C&E in H1-2021 and its impact on the Group’s operations, a waiver of the FFO/Net financial debt ratio test in
H1 and FY-2021 has been granted by URW’s lending banks for its corporate bank debt.
Secured debt non-recourse:
▪ 23% of the non-recourse mortgage debt raised by certain entities of the Group includes Debt Yield105 covenants (usually
7%-7.5% for the mortgaged asset).
▪ 38% of the non-recourse mortgage debt raised by certain entities of the Group includes ICR covenants (ranging between
1.25x and 3.5x for the mortgaged asset).
▪ 52% of the non-recourse mortgage debt raised by certain entities of the Group includes LTV covenants (ranging between
55% and 70% for the mortgaged asset).
▪ Any breach under these covenants would not lead to a cross-default on the Group’s borrowings.
▪ In any case in Europe, due to the exceptional circumstances linked to COVID-19 pandemic, waivers on cashflow related
financial covenants have been granted on various secured mortgage loans on European assets for periods ranging
between six months and eighteen months.
▪ In the US, as a result of the COVID-19 pandemic, debt service payments on certain mortgage loans on some regional
US assets have not been made including the four assets which are in foreclosure and have been de-recognised. Defaults
under these loans are not expected to have a material adverse effect on the Group’s finances.
Short term debt:
▪ There are no financial covenants (such as loan-to-value or interest coverage ratios) in the Neu MTN, the Neu CP and the
ECP programs of URW.
101 Ratio calculated based on European bank debt covenant. 102 Secured debt/Total assets. 103 Unencumbered assets/unsecured debt. 104 Funds From Operations: on an annualised basis, the recurring EBITDA minus (i) recurring net financial expenses and (ii) tax on
recurring operating result. 105 Debt Yield: ratio of the net operating income to the outstanding loan amount, net of certain cash as defined in the relevant mortgage
loan documentation.

82
5. Comparative table of main financial data and ratios in IFRS and proportionate, as at June 30, 2021
Financial ratios IFRS Proportionate
Gross debt €26,162 Mn €28,141 Mn
Net debt €23,467 Mn €25,306 Mn
LTV 44.4% 46.0%
ICR 2.9x 2.7x
Net debt/EBITDA 16.6x 17.3x
FFO/Net debt 4.3% 3.9%

83
6. LTV reconciliation with the Balance Sheet (B/S)
a) Under IFRS:
Figures may not add up due to rounding.
(1) Adjustment of goodwill according to bank covenants.
€ MnJune 30, 2021
IFRS
Dec. 31, 2020
IFRS
June 30, 2020
IFRS
Amounts accounted for in B/S 51,507.5 52,759.8 57,173.3
Investment properties at fair value 39,054.7 39,623.6 42,591.0
Investment properties at cost 1,367.9 1,324.1 1,237.6
Shares and investments in companies accounted for using the equity method 8,404.2 8,370.3 9,907.4
Other tangible assets 128.9 279.2 330.5
Goodwill 1,225.1 1,248.1 2,119.4
Intangible assets 871.8 876.3 922.8
Properties or shares held for sale 454.9 1,038.2 64.6
Adjustments 1,290.6 1,431.7 731.5
Transfer taxes 1,807.3 1,842.7 1,956.5
Goodwill not justified by fee business (1)
-1,105.9 -1,128.8 -1,364.8
Revaluation intangible and operating assets 1,495.0 1,454.2 946.5
IFRS adjustments, including -905.8 -736.4 -806.7
Financial leases -994.1 -828.8 -848.4
Other 88.3 92.4 41.7
Total assets, including Transfer Taxes (=A) 52,798.1 54,191.5 57,904.8
Total assets, excluding Transfer Taxes (=B) 50,990.8 52,348.8 55,948.3
Amounts accounted for in B/S
Net share settled bonds convertible into new and/or existing shares (ORNANE) 602.4 600.3 589.1
Non current bonds and borrowings 24,688.3 24,310.5 23,354.4
Current borrowings and amounts due to credit institutions 2,140.6 2,584.1 4,855.5
Liabilities directly associated with properties or shares classified as held for sale 0.0 203.5 0.0
Total financial liabilities 27,431.4 27,698.4 28,799.0
Adjustments
Mark-to-market of debt 20.4 47.3 28.4
Current accounts with non-controlling interests -1,318.7 -1,269.2 -1,342.1
Impact of derivative instruments on debt raised in foreign currency -16.2 -8.7 -59.8
Accrued interest / issue fees 45.2 -82.5 19.6
Total financial liabilities (nominal value) 26,162.1 26,385.1 27,445.1
Cash & cash equivalents -2,695.4 -2,137.6 -3,405.7
Net financial debt (=C) 23,466.6 24,247.5 24,039.4
LTV ratio including Transfer Taxes (=C/A) 44.4% 44.7% 41.5%
LTV ratio excluding Transfer Taxes (=C/B) 46.0% 46.3% 43.0%

84
b) On a proportionate basis:
Figures may not add up due to rounding.
(1) Adjustment of goodwill according to bank covenants.
€ MnJune 30, 2021
Proportionate
Dec. 31, 2020
Proportionate
June 30, 2020
Proportionate
Amounts accounted for in B/S 53,458.1 54,659.5 59,401.0
Investment properties at fair value 48,095.2 48,579.4 53,249.1
Investment properties at cost 1,431.7 1,382.0 1,314.7
Shares and investments in companies accounted for using the equity method 1,172.3 1,188.7 1,308.5
Other tangible assets 131.8 280.0 331.4
Goodwill 1,300.7 1,314.7 2,209.9
Intangible assets 871.5 876.5 922.8
Properties or shares held for sale 454.9 1,038.2 64.6
Adjustments 1,507.5 1,654.4 949.3
Transfer taxes 2,030.0 2,069.9 2,214.2
Goodwill not justified by fee business (1)
-1,181.4 -1,195.4 -1,455.3
Revaluation intangible and operating assets 1,492.4 1,453.2 945.6
IFRS adjustments, including -833.4 -673.2 -755.2
Financial leases -1,002.9 -837.3 -857.7
Other 169.5 164.1 102.5
Total assets, including Transfer Taxes (=A) 54,965.6 56,314.0 60,350.3
Total assets, excluding Transfer Taxes (=B) 52,935.7 54,244.1 58,136.1
Amounts accounted for in B/S
Net share settled bonds convertible into new and/or existing shares (ORNANE) 602.4 600.3 589.1
Non current bonds and borrowings 26,641.5 26,211.0 25,337.7
Current borrowings and amounts due to credit institutions 2,158.8 2,614.2 5,140.4
Liabilities directly associated with properties or shares classified as held for sale 0.0 203.5 0.0
Total financial liabilities 29,402.7 29,629.0 31,067.2
Adjustments
Mark-to-market of debt 31.1 61.3 45.5
Current accounts with non-controlling interests -1,318.7 -1,269.2 -1,342.1
Impact of derivative instruments on debt raised in foreign currency -16.2 -8.7 -59.8
Accrued interest / issue fees 42.1 -88.0 15.1
Total financial liabilities (nominal value) 28,140.9 28,324.2 29,725.9
Cash & cash equivalents -2,835.2 -2,270.3 -3,491.2
Net financial debt (=C) 25,305.7 26,053.9 26,234.7
LTV ratio including Transfer Taxes (=C/A) 46.0% 46.3% 43.5%
LTV ratio excluding Transfer Taxes (=C/B) 47.8% 48.0% 45.1%

85
6. EPRA PERFORMANCE MEASURES
In compliance with the EPRA106 Best Practices Recommendations107, URW summarises the Key Performance measures of
H1-2021, H1-2020 and 2020 below.
1. EPRA earnings
EPRA earnings are defined as “recurring earnings from core operational activities” and are equal to the Group’s definition
of recurring earnings.
a) Synthesis
b) Bridge between Earnings per IFRS Statement of income and EPRA Recurring Earnings
Figures may not add up due to rounding.
106 EPRA: European Public Real estate Association. 107 Best Practices Recommendations. See www.epra.com
H1-2021 H1-2020 2020
EPRA Earnings € Mn 472.0 667.5 1,056.6
EPRA Earnings / share € / share 3.41 4.82 7.63
Growth EPRA Earnings / share % -29.3% -27.2% -40.0%
Recurring Earnings per shareH1-2021
IFRS
H1-2020
IFRS
2020
IFRS
Net Result of the period attributable to the holders of the Stapled Shares (€ Mn) (420.7) (3,525.9) (7,212.6)
Adjustments to calculate EPRA Recurring Earnings, exclude:
(738.0) (2,207.5) (4,837.2)
101.2 (46.4) (86.3)
- - -
(iv) Tax on profits or losses on disposals 0.0 0.0 0.0
(v) Impairment of goodwill - (736.4) (1,596.1)
30.8 (680.3) (569.1)
(0.9) (21.5) (83.4)
(viii) Deferred tax in respect of EPRA adjustments 78.7 167.5 301.0
(432.5) (922.4) (1,958.9)
67.9 253.6 560.8
EPRA Recurring Earnings 472.0 667.5 1,056.6
Average number of shares and ORA 138,495,491 138,401,778 138,437,274
EPRA Recurring Earnings per Share (REPS) €3.41 €4.82 €7.63
EPRA Recurring Earnings per Share growth -29.3% -27.2% -40.0%
(x) External non-controlling interests in respect of the above
(ix) Adjustments (i) to (viii) above in respect of joint ventures (unless already included under
proportional consolidation)
(i) Changes in value of investment properties, development properties held for investment and other
interests
(ii) Profits or losses on disposal of investment properties, development properties held for investment
and other interests
(iii) Profits or losses on sales of trading properties including impairment charges in respect of trading
properties
(vi) Changes in fair value of financial instruments and associated close-out costs
(vii) Acquisition costs on share deals and non-controlling joint venture interests

86
2. EPRA NRV, NTA and NDV:
For a more detailed description of the EPRA NRV, NTA and NDV new metrics, please see the “Property portfolio and Net
Asset Value” section, included in this report.
a) Synthesis
b) Detailed calculation as at June 30, 2021
Figures may not add up due to rounding.
(1) Difference between development property held on the balance sheet at cost and fair value of that development property.
(2) Revaluation of intangibles are presented under adjustment (x). Revaluation of Intangibles to fair value is not under this line item.
(3) Difference between finance lease receivables held on the balance sheet at amortised cost and the fair value of those finance lease receivables. (4) Difference between trading properties held on the balance sheet at cost (IAS 2) and the fair value of those trading properties.
(5) Deferred tax adjustment for NTA calculated in line with the EPRA guidelines.
(6) Real estate transfer taxes were adjusted in accordance with the EPRA guidelines. * “Include” indicates that an asset (whether on or off balance sheet) should be added to the shareholders’ equity, whereas a liability should be deducted.
* “Exclude” indicates that an asset (part of the balance sheet) is reversed, whereas a liability (part of the balance sheet) is added back.
EPRA BPR June 30, 2021 Dec. 31, 2020Change 06/21
vs. 12/20June 30, 2020
Change 06/21
vs. 06/20
EPRA NRV € / share 162.40 166.80 -2.6% 197.00 -17.6%
EPRA NTA € / share 124.70 128.10 -2.7% 153.90 -19.0%
EPRA NDV € / share 107.50 110.50 -2.7% 145.50 -26.1%
EPRA NRV EPRA NTA EPRA NDV
Equity attributable to the holders of the Stapled Shares (IFRS) 17,223 17,223 17,223
Include / Exclude*:
i) Hybrid instruments 36 36 36
Diluted NAV 17,259 17,259 17,259
Include*:
ii.a) Revaluation of IP (if IAS 40 cost option is used) 86 86 86
ii.b) Revaluation of IPUC(1)
(if IAS 40 cost option is used) 0 0 0
ii.c) Revaluation of other non-current investments(2) 0 0 0
iii) Revaluation of tenant leases held as finance leases(3) 0 0 0
iv) Revaluation of trading properties(4) 0 0 0
Diluted NAV at Fair Value 17,345 17,345 17,345
Exclude*:
v) Deferred tax in relation to fair value gains of IP(5)
detailled below:
v.a) Reversal of deferred taxes on Balance sheet 1,900 1,900 -
v.b) Effective deferred taxes on capital gains - 950 - -
vi) Fair value of financial instruments 692 692 -
vii) Goodwill as a result of deferred tax 177 - 177 - 177 -
viii.a) Goodwill as per the IFRS balance sheet (net of vii)) - 1,049 - 1,049 -
viii.b) Intangibles as per the IFRS balance sheet - 872 - -
Include*:
ix) Fair value of fixed interest rate debt - - 1,117 -
x) Revaluation of intangibles to fair value 1,106 - -
xi) Real estate transfer tax(6) 1,800 508 -
NAV 22,667 17,399 15,003
Fully diluted number of shares 139,559,639 139,559,639 139,559,639
NAV per share €162.40 €124.70 €107.50
June 30, 2021

87
c) Detailed calculation as at December 31, 2020
Figures may not add up due to rounding.
(1) Difference between development property held on the balance sheet at cost and fair value of that development property.
(2) Revaluation of intangibles are presented under adjustment (x). Revaluation of Intangibles to fair value is not under this line item. (3) Difference between finance lease receivables held on the balance sheet at amortised cost and the fair value of those finance lease receivables.
(4) Difference between trading properties held on the balance sheet at cost (IAS 2) and the fair value of those trading properties.
(5) Deferred tax adjustment for NTA calculated in line with the EPRA guidelines.
(6) Real estate transfer taxes were adjusted in accordance with the EPRA guidelines.
* “Include” indicates that an asset (whether on or off balance sheet) should be added to the shareholders’ equity, whereas a liability should be deducted.
* “Exclude” indicates that an asset (part of the balance sheet) is reversed, whereas a liability (part of the balance sheet) is added back.
EPRA NRV EPRA NTA EPRA NDV
Equity attributable to the holders of the Stapled Shares (IFRS) 17,394 17,394 17,394
Include / Exclude*:
i) Hybrid instruments - - -
Diluted NAV 17,394 17,394 17,394
Include*:
ii.a) Revaluation of IP (if IAS 40 cost option is used) 54 54 54
ii.b) Revaluation of IPUC(1)
(if IAS 40 cost option is used) 0 0 0
ii.c) Revaluation of other non-current investments(2) 0 0 0
iii) Revaluation of tenant leases held as finance leases(3) 0 0 0
iv) Revaluation of trading properties(4) 0 0 0
Diluted NAV at Fair Value 17,447 17,447 17,447
Exclude*:
v) Deferred tax in relation to fair value gains of IP(5)
detailled below:
v.a) Reversal of deferred taxes on Balance sheet 2,023 2,023 -
v.b) Effective deferred taxes on capital gains - 1,011 - -
vi) Fair value of financial instruments 929 929 -
vii) Goodwill as a result of deferred tax 200 - 200 - 200 -
viii.a) Goodwill as per the IFRS balance sheet (net of vii)) - 1,049 - 1,049 -
viii.b) Intangibles as per the IFRS balance sheet - 876 - -
Include*:
ix) Fair value of fixed interest rate debt - - 865 -
x) Revaluation of intangibles to fair value 1,113 - -
xi) Real estate transfer tax(6) 1,836 522 -
NAV 23,148 17,785 15,334
Fully diluted number of shares 138,786,602 138,786,602 138,786,602
NAV per share €166.80 €128.10 €110.50
Dec. 31, 2020

88
3. EPRA Net Initial Yields
The following table provides the Group yields according to the EPRA Net Initial Yield definitions per segment for URW’s
Net Initial Yields (on a proportionate basis):
a) Synthesis
Figures may not add up due to rounding.
Notes:
1) EPRA topped-up yield: EPRA Net Initial Yield adjusted in respect of the expiration of rent free periods (or other unexpired lease
incentives such as discounted rent periods and step rents).
2) EPRA Net Initial Yield: annualised rental income based on the cash rents passing at the balance sheet date, less non-recoverable property
operating expenses, divided by the Gross Market Value of the portfolio.
3) Assets under development or not controlled by URW, the trademark and the airport activities are not included in the calculation.
b) Detailed calculation
Note:
1) Assets under development or not controlled by URW, the trademark and the airport activities are not included in the calculation.
Unibail-Rodamco-Westfield yields 4.5% 5.1% 4.5% 4.9%
Effect of vacant units 0.0% -1.2% 0.0% -1.1%
Effect of EPRA adjustments on NRI 0.1% 0.0% 0.1% 0.0%
Effect of estimated transfer taxes and transaction costs -0.1% -0.1% -0.1% -0.1%
EPRA topped-up yields (1) 4.5% 3.8% 4.5% 3.7%
Effect of lease incentives -0.2% -0.5% -0.2% -0.9%
EPRA Net Initial Yields (2) 4.3% 3.3% 4.4% 2.8%
June 30, 2021 Dec. 31, 2020
Retail (3)
Offices &
Others (3) Retail
(3)Offices &
Others (3)
Shopping
Centres (1)
Offices &
Others (1)
Shopping
Centres (1)
Offices &
Others (1)
EPRA topped-up NRI (A) € Mn 1,952 79 1,983 107
Valuation including transfer taxes (B) € Mn 43,627 2,079 43,843 2,876
EPRA topped-up yields (A/B) % 4.5% 3.8% 4.5% 3.7%
EPRA NRI (C) € Mn 1,874 68 1,914 81
Valuation including transfer taxes (B) € Mn 43,627 2,079 43,843 2,876
EPRA Net Initial Yields (C/B) % 4.3% 3.3% 4.4% 2.8%
June 30, 2021 Dec. 31, 2020

89
4. EPRA Vacancy rate
The EPRA vacancy rate is defined as the ERV of vacant spaces divided by the ERV of total space (let plus vacant).
a) Synthesis
b) Detail per region
EPRA Vacancy Rate - Total URW June 30, 2021 Dec. 31, 2020 June 30, 2020
Estimated Rental Value of vacant space (A) 294.4 295.5 234.7
Estimated Rental Value of the whole portfolio (B) 3,028.2 3,170.0 3,312.0
EPRA Vacancy rate (A/B) 9.7% 9.3% 7.1%
EPRA Vacancy Rate - per region June 30, 2021 Dec. 31, 2020 June 30, 2020
Shopping Centres - Continental Europe
France 3.6% 3.7% 3.2%
Central Europe 5.6% 5.5% 3.1%
Spain 6.0% 4.4% 4.1%
Nordics 8.0% 9.3% 6.9%
Austria 1.6% 2.6% 2.0%
Germany 6.6% 5.2% 4.6%
The Netherlands 8.0% 9.7% 8.1%
Total Shopping Centres - Continental Europe 5.0% 4.9% 3.9%
United Kingdom 12.2% 9.7% 8.6%
Total Shopping Centres - Europe 6.1% 5.6% 4.7%
Offices & Others
France 33.8% 30.6% 8.2%
Total Offices & Others - Continental Europe 29.0% 27.2% 8.7%
United States - Shopping Centres 14.0% 13.1% 10.1%
US Flagships 14.1% 12.5% 9.3%
US Regionals 14.0% 14.3% 12.3%
United States - Offices & Others 38.8% 28.4% 33.5%
Total US 14.6% 13.6% 10.6%
Total Shopping Centres 8.9% 8.3% 6.8%
Total Offices & Others 31.1% 27.4% 14.4%
Total URW 9.7% 9.3% 7.1%

90
5. EPRA Cost ratios
Figures may not add up due to rounding.
Note:
1) The calculation is based on the EPRA recommendations and is applied on Shopping Centres and Offices & Others sectors.
H1-2021 H1-2020 2020
Include:
(i-1) General expenses -105.1 -112.2 -215.8
(i-2) Development expenses -0.3 -0.7 -2.6
(i-3) Operating expenses -198.3 -254.3 -514.1
(ii) Net service charge costs/fees -43.1 -29.8 -66.4
(iii) Management fees less actual/estimated profit element 0.0 0.0 0.0
(iv) Other operating income/recharges intended to cover overhead expenses 0.0 0.0 0.0
(v) Share of Joint Ventures expenses -5.2 -8.1 -28.8
Exclude (if part of the above):
(vi) Investment Property Depreciation 0.0 0.0 0.0
(vii) Ground rents costs 0.0 0.0 0.0
(viii) Service charge costs recovered through rents but not separately invoiced 100.6 127.8 206.1
EPRA Costs (including direct vacancy costs) (A) -251.5 -277.3 -621.6
(ix) Direct vacancy costs -43.1 -29.8 -66.4
EPRA Costs (excluding direct vacancy costs) (B) -208.4 -247.5 -555.2
(x) Gross Rental Income (GRI) less ground rents 1,028.7 1,334.5 2,368.4
(xi) Less: service fee and service charge costs component of GRI (if relevant) -100.6 -127.8 -206.1
(xii) Add Share of Joint Ventures (Gross Rental Income less ground rents) 52.4 41.2 102.3
Gross Rental Income (C) 980.5 1,247.9 2,264.6
EPRA Cost Ratio (including direct vacancy costs) (A/C) 25.7% 22.2% 27.5%
EPRA Cost Ratio (excluding direct vacancy costs) (B/C) 21.3% 19.8% 24.5%
EPRA
references
Proportionate

91
6. Capital Expenditure
Figures may not add up due to rounding.
Notes:
1) No acquisition in H1-2021.
2) In H1-2021, includes mainly the capital expenditures related to investments in the Les Ateliers Gaîté extension and Westfield Topanga
refurbishment and extension projects and to the Westfield Hamburg and Triangle new development projects.
3) In H1-2021, includes mainly the capital expenditures related to Westfield Mall of the Netherlands, La Part-Dieu, Westfield Les 4 Temps
and Shopping City Süd. Capital expenditure on the like-for-like portfolio includes capital expenditure spent on extension and works on
standing assets or refurbishments recently delivered. In H1-2021, URW spent €26.5 Mn on replacement capex, Group share. The fitting
out contributions paid to tenants amounted to €52.9 Mn in H1-2021.
4) In H1-2021, includes eviction costs and tenant incentives, external letting fees (internal letting fees are included in Administrative
expenses), capitalised interest relating to projects and other capitalised expenses of €11.7 Mn, €4.7 Mn, €27.5 Mn and €9.1 Mn, respectively
(amounts in Group share).
100% Group share 100% Group share 100% Group share
Acquisitions (1) - 0.0 14.0 14.0 16.0 15.7
Development (2) 208.4 209.0 340.4 329.7 704.2 681.1
Like-for-like portfolio (3) 207.5 189.9 148.2 130.6 328.4 283.9
Other (4) 60.1 53.0 58.1 54.0 121.4 111.3
Total Capital Expenditure 476.0 451.9 560.8 528.3 1,170.1 1,092.1
Conversion from accruals to cash basis 111.5 102.9 116.7 100.0 124.6 111.8
Total Capital Expenditure on cash basis 587.4 554.8 677.5 628.4 1,294.7 1,203.9
H1-2020
Proportionatein € Mn
H1-2021 2020
92
OTHER INFORMATION:
1. Group consolidated data p 93
2. List of H1-2021 government restrictions p 96
3. Main government support schemes p 98
4. Glossary p 99

93
1. GROUP CONSOLIDATED DATA
Leasing activity - Shopping Centres
Figures may not add up due to rounding.
Net Rental Income (“NRI”) by segment
Figures may not add up due to rounding.
Net Rental Income (“NRI”) - Shopping Centres
Figures may not add up due to rounding.
€ Mn % € Mn %
Continental Europe 589 244,145 77.0 1.5 - -2.2% 0.8 2.2%
UK 74 35,823 29.3 0.8 - -2.7% 0.3 - -1.3%
Total Europe 663 279,968 106.3 2.3 - -2.4% 0.4 0.8%
US 555 174,323 56.7 8.2 - -12.9% 0.5 2.9%
Total URW 1,218 454,292 163.0 10.4 - -6.5% 1.0 1.3%
Lettings / re-lettings / renewals excluding Pipeline
MGR uplift on deals above 3
years firm duration
Regionnb of leases
signedsqm
MGR
(€ Mn)
MGR uplift
H1-2021 H1-2020 Change (%)Like-for like
change (%)
Shopping Centres 753.2 1,007.8 -25.3% -21.8%
Offices & Others 31.9 41.9 -23.9% -1.0%
Convention & Exhibition 0.4 14.9 -97.1% -97.1%
Total URW 785.5 1,064.6 -26.2% -22.4%
Segment
Net Rental Income (€Mn)
H1-2021 H1-2020 %
NRI - Continental Europe 454.5 680.7 -33.2%
NRI UK 43.7 50.0 -12.6%
Total NRI - Europe 498.2 730.7 -31.8%
NRI US 255.0 277.1 -8.0%
Total NRI - URW 753.2 1,007.8 -25.3%
Region
Net Rental Income (€Mn)

94
Figures may not add up due to rounding.
Figures may not add up due to rounding.
Net Rental Income (“NRI”) – Offices & Others
Figures may not add up due to rounding.
H1-2021 H1-2020 %
Lfl NRI - Continental Europe 395.7 573.1 -31.0%
Lfl NRI UK 43.3 48.2 -10.1%
Total Lfl NRI - Europe 439.0 621.3 -29.3%
Lfl NRI US 214.6 214.6 0.0%
Total Lfl NRI - URW 653.6 835.9 -21.8%
Region
Net Rental Income (€Mn)
Like-for-like
Renewals,
relettings net
of departures
& indexation
COVID-19
rent discounts
Doubtful
debtorsOther Total
Lfl NRI - Continental Europe -3.8% -21.0% -4.1% -2.0% -31.0%
Lfl NRI UK -20.7% -28.9% 21.0% 18.5% -10.1%
Total Lfl NRI - Europe -5.1% -21.6% -2.2% -0.4% -29.3%
Lfl NRI US -12.5% -8.4% 20.5% 0.4% 0.0%
Total Lfl NRI - URW -7.0% -18.2% 3.7% -0.2% -21.8%
Region
H1-2021 H1-2020 Change (%)Like-for like
change (%)
France 18.6 26.5 -29.8% 11.8%
Nordics 5.5 4.9 10.7% 11.3%
Other countries 4.2 3.9 8.8% 6.8%
Total NRI - Europe 28.3 35.4 -19.9% 10.8%
NRI US 3.6 6.5 -45.4% -40.3%
Total NRI - URW 31.9 41.9 -23.9% -1.0%
Region
Net Rental Income (€Mn)

95
Vacancy - Shopping Centres
Figures may not add up due to rounding.
Lease expiry schedule
Figures may not add up due to rounding.
€Mn %
Continental Europe 80.6 5.0% 5.4% 4.9%
UK 35.3 12.2% 12.6% 9.7%
Total Europe 115.9 6.1% 6.5% 5.6%
US 141.6 14.0% 13.4% 13.1%
Total URW 257.5 8.9% 8.8% 8.3%
Region June 30, 2021%
Dec. 31, 2020
Vacancy
%
Mar. 31, 2021
MGR (€Mn)
at date of next
break option
As a % of
total
MGR (€Mn)
at expiry date
As a % of
total
Expired 42.0 2.1% 42.0 2.1%
2021 130.5 6.7% 107.6 5.5%
2022 377.2 19.3% 229.5 11.7%
2023 340.9 17.4% 194.4 10.0%
2024 283.0 14.5% 180.2 9.2%
2025 206.3 10.6% 217.6 11.1%
2026 162.7 8.3% 177.4 9.1%
2027 93.8 4.8% 160.6 8.2%
2028 90.2 4.6% 148.2 7.6%
2029 53.8 2.8% 115.0 5.9%
2030 54.0 2.8% 113.2 5.8%
2031 38.9 2.0% 80.3 4.1%
Beyond 80.6 4.1% 187.8 9.6%
Total 1,953.8 100% 1,953.8 100%
Total URW
(Shopping
Centres +
Offices &
Others)
Lease expiry schedule

96
2. LIST OF H1-2021 GOVERNMENT RESTRICTIONS
The H1-2021 government restrictions are summarised in the table below:
Country Non-essential retail closed Other restrictions
Austria 1/1/2021 to 7/2/2021
1/4/2021 to 2/5/2021
F&B (takeaway allowed) and Entertainment
remained closed throughout Q1, re-opening May
19 (but only with a negative test or proof of
vaccination).
Czech Republic 1/1/2021 to 10/5/2021 F&B (takeaway allowed) and Entertainment
remained closed throughout Q1, with outdoor
dining re-opening May 17 (but only with a
negative test or proof of vaccination) and indoor
dining and cinemas on May 31 (a negative test or
proof of vaccination is required for F&B/leisure).
Denmark 1/1/2021 to 20/4/2021 F&B (takeaway allowed) and Entertainment
remained closed throughout Q1 and re-opened on
April 21, for restaurants and bars and May 6, for
gyms and cinemas subject to having a negative test
or proof of vaccination.
France 31/1/2021 to 19/5/2021
(initially for shopping centres over 20,000
sqm, afterwards shopping centres over
10,000 sqm and from April 3 all non-essential
retail throughout the whole country)
F&B (takeaway allowed) and Entertainment
remained closed throughout Q1, re-opening on
May 19, for outdoor terraces and on June 9, for
gyms and indoor dining. Cinemas were able to
operate with 35% capacity from May 19,
increasing to 65% on June 9, and 100% on June 30.
Germany 1/1/2021 to March (date dependant on
region) centres were closed completely. In
March/April shops could receive customers
by appointment only. From May 21,
depending on the region, shops were open
without appointment but subject to having a
negative COVID test/proof of vaccination
and outdoor dining was generally allowed,
with these rules easing at various dates
depending on the state / local region rules.
F&B (takeaway allowed) and Entertainment
remained closed throughout Q1 and re-opened for
outdoor and then indoor dining at various dates
after May 21, depending on the state / region rules
(subject to negative test / proof of vaccination).
The Netherlands 1/1/2021 to 2/3/2021
From 3/3/2021, only shopping by
appointment (needs to be made four hours in
advance).
From 28/4/2021, appointments are no longer
required.
F&B and Entertainment remained closed
throughout Q1, with outdoor Terraces reopened
on April 28, and indoor dining and leisure venues
allowed from June 5, subject to restrictions on
capacity / distancing.
Poland 1/1/2021 to 31/1/2021
15/3/2021 to 4/5/2021
F&B (takeaway allowed) and Entertainment
remained closed throughout Q1, with outdoor
dining reopened from May 15. Indoor dining and
Cinemas reopened with 50% capacity on May 28.
Slovakia 1/1/2021 to 18/4/2021 F&B (takeaway allowed) closed throughout Q1,
reopening on May 17.
Spain 7/1/2021 to 28/2/2021 for centres in the
Catalonia region.
F&B closed in malls in the Catalonia region in Q1.
Capacity restrictions for F&B in other regions.

97
Sweden No formal closures of centres, however a
government recommendation to shop alone
applied until June 1.
Capacity restrictions for stores and significant
limitations for F&B and Entertainment (including
recommendation to eat alone & limits on people
per table). Cinema’s remained closed until June 1
(from which maximum 50 people per screening
allowed).
UK 1/1/2021 to 11/4/2021 F&B and Entertainment remained closed
throughout Q1. On April 12 restrictions for
outdoor F&B were lifted, with indoor F&B
reopened on May 17.
US No formal closure of centres. Operations of F&B, Entertainment, Fitness and
Salons have been restricted in most states and
counties in which URW is active, until between
February / March. From mid-June, all of the
Group’s centres are able to open all categories and
all capacity limits have been withdrawn.

98
3. MAIN GOVERNMENT SUPPORT SCHEMES
Austria Turnover subsidies from January until June 2021 up to 30% of turnover in case of at least 40%
turnover drop compared to comparable months in 2019, capped at €60,000 per month and €800,000
in total. In addition, there is a fixed costs compensation up to €800,000 cap in case of at least 40%
turnover drop compared to comparable months in 2019, needs to be offset against turnover
subsidies.
Czech Republic 60% of uncovered costs to be compensated provided that the retailer’s turnover decreased by more
than 50% compared to the same period in 2019, capped at €1.5 Mn per applying retailer.
Denmark Compensation for fixed cost of up to 100%, depending on the percentage turnover drop.
Germany Fixed costs compensation in a certain range possible in case of at least 30% turnover drop
compared to comparable months in 2019, but with cap of €1.5 Mn per month per applying retailer.
France Turnover compensation granted under turnover loss condition, either €10,000 or turnover
compensation at 15% or 20% depending on monthly turnover drop, capped at €200,000 per month
and per group retailer.
EBITDA compensation granted under monthly turnover level and loss conditions, EBITDA loss
compensation at 70% or 90% depending on company size, capped at €10 Mn for 2021 per group
retailer.
The French support scheme is currently subject to EU review and final details are yet to be
confirmed.
The Netherlands Compensation for fixed cost up to 85% in Q1 and 100% in Q2 for retailers with a turnover drop of
over 30%, capped at €550,000 (SME) or €600,000 (non-SME) per retailer. Additional
compensation of 21% of the revenue loss to indemnify unused stock, capped at €300,000 per
retailer for Q1 only.
Slovakia Rental discount top-up mechanism: if 50% discount is provided by the landlord, the government
pays the remaining 50%. If a discount of less than 50% is agreed, the government will pay the
same percentage, with the remaining amount to be paid to the landlord within 48 months.
Sweden Compensation for fixed costs in relation to turnover drop for companies with a turnover drop over
30% (limitations and caps apply) and a rent support scheme for limited time periods compensating
landlords for 50% of rent discount granted to tenants within specified sectors (capped at €800,000
per retailer including rent support from 2020).
UK Business rates holiday for the retailers until the end of June 2021.
US The US Small Business Administration (SBA) is offering low interest loans through their Paycheck
Protection Program (PPP) that can be forgiven if 60% of funds are used on payroll costs and
payroll/compensational levels are maintained.
SBA is also offering direct assistance grants to qualified restaurant and food service tenants
(Restaurant Revitalization Program). In addition, various other State programs and Federal payroll
tax credits are available.

99
4. GLOSSARY
Average cost of debt: recurring financial expenses (excluding the ones on financial leases and the ones related to partners’
current accounts) + capitalised financial expenses (excluding non-recurring financial expenses such as mark-to-market and
termination costs of financial instruments including bonds repurchased, currency impact) / average net debt over the period.
Average rental spread: for the US portfolio, the rental spread reflects the trailing 12-months average increase in total rents,
including common area maintenance charges, for specialty stores (excluding lease extensions, deals with zero prior rent and
deals for less than 12 months).
Buyer’s Net Initial Yield: annualised contracted rent (including indexation) and other incomes for the next 12 months, net
of operating expenses, divided by the TAC.
Committed projects: projects for which URW owns the land or building rights and has obtained all necessary administrative
authorisations and permits, approvals of JV partners (if applicable), approvals of URW’s internal governing bodies to start
superstructure construction works and on which such works have started.
Controlled projects: projects in an advanced stage of studies, for which URW controls the land or building rights, and all
required administrative authorisations have been filed or are expected to be filed shortly. There can be no assurance these
will become “Committed” projects, as this will be subject to having obtained all required administrative approvals, as well
as those of JV partners (if applicable), and of URW’s internal governing bodies to start superstructure works.
Debt Yield: Ratio of the net operating income to the outstanding loan amount, net of certain cash as defined in the relevant
mortgage loan documentation.
Discount Rate (DR): the Discount Rate is the rate used in a Discounted Cash Flow model to calculate the present value of
future cash flows (positive or negative) that is to say converting such future cash-flows in today’s monetary value.
EBITDA-Viparis: “Net rental income“ and “On site property services operating result” + “Recurring contribution of
affiliates” of Viparis venues.
EPRA Net Reinstatement Value (“NRV”): assumes that entities never sell assets and aims to represent the value required
to rebuild the entity.
EPRA Net Tangible Assets (“NTA”): assumes that entities buy and sell assets, thereby crystallising certain levels of
unavoidable deferred tax.
EPRA Net Disposal Value (“NDV”): represents the shareholder’s value under a disposal scenario, where deferred tax,
financial instruments and other certain adjustments are calculated to the full extent of their liability, net of any resulting tax.
EPRA NIY: annualised rental income based on the cash rents passing at the balance sheet date, less non-recoverable property
operating expenses, divided by the Gross Market Value of the portfolio. For a reconciliation of URW’s NIY with the EPRA
Net Initial Yield definitions, refer to the EPRA Performance Measures.
EPRA topped-up yield: EPRA Net Initial Yield adjusted in respect of the expiration of rent free periods (or other unexpired
lease incentives such as discounted rent periods and step rents).
EPRA vacancy rate: Estimated Rental Value (ERV) of vacant spaces divided by ERV of total space (let + vacant).
Exit Cap Rate (ECR): the rate used to estimate the resale value of a property at the end of the holding period. The expected
Net Rental Income (NRI) per year is divided by the ECR (expressed as a percentage) to get the terminal value.
Flagships: assets of a certain size and / or with footfall in excess of 10 million per year, substantial growth potential for the
Group based on their appeal to both retailers and visitors, iconic architecture or design and a strong footprint in their area.
Financial statements under IFRS: the Group’s consolidated financial statements are prepared in accordance with
International Financial Reporting Standards (IFRS) as applicable in the European Union as at closing date.

100
Financial statements on a proportionate basis: they are prepared based on the financial statements under IFRS, except for
the joint-controlled entities, which are consolidated on a proportionate basis, instead of being accounted for using the equity
method (as applicable under IFRS). Unibail-Rodamco-Westfield believes that these financial statements on a proportionate
basis give to stakeholders a better understanding of the underlying operations of URW and the joint-controlled entities, as
they represent a significant part of the Group’s operations in the US and the UK.
Foreclosure: the action of a lender seeking to take the collateral on a loan when loan payments are not made, leading to a
transfer of the asset and the extinction of the corresponding mortgage debt.
Funds From Operations (FFO): on an annualised basis, the recurring EBITDA minus (i) recurring net financial expenses
and (ii) tax on recurring operating result.
Group Share: the part that is attributable to the Group after deduction of the parts attributable to the minority interests.
Interest Cover Ratio (ICR): Recurring EBITDA / Recurring Net Financial Expenses (including capitalised interest);
Recurring EBITDA is calculated as total recurring operating results and other income less general expenses, excluding
depreciation and amortisation.
Like-for-like Net Rental Income (Lfl NRI): Net Rental Income excluding acquisitions, divestments, transfers to and from
pipeline (extensions, brownfields or redevelopment of an asset when operations are stopped to enable works), all other
changes resulting in any change to the square meters and currency exchange rate differences in the periods analysed.
Loan-to-Value (LTV): net financial debt, excluding current accounts with non-controlling interests / total assets (whether
under IFRS or on a proportionate basis), including or excluding transfer taxes and excluding goodwill not justified by fee
business.
Minimum Guaranteed Rent uplift (MGR uplift): difference between new MGR and indexed old MGR. Indicator
calculated on renewals and relettings only.
NNNAV (triple net asset value): corresponds to the former EPRA NNNAV.
Net Disposal Price (NDP): Total Acquisition Cost incurred by the acquirer minus all transfer taxes and transaction costs.
Net Initial Yield (NIY): annualised contracted rent (including indexation) and other incomes for the next 12 months, net of
operating expenses, divided by the asset value net of estimated transfer taxes and transaction costs.
Net Operating Income (NOI): Net Operating Income before management fees, termination/settlement income and straight-
line adjustments.
Non-recurring activities: non-recurring activities include valuation movements, disposals, mark-to-market and termination
costs of financial instruments, bond tender premiums, impairment of goodwill or recognition of negative goodwill,
amortisation of fair value of assets and liabilities recorded for the purpose of purchase price allocation, as well as costs
directly incurred during a business combination and other non-recurring items.
Occupancy Cost Ratio (OCR): (rental charges + service charges including marketing costs for tenants, all including VAT)
/ (tenants’ sales, including VAT). As tenant turnover is not known for all tenants for The Netherlands, no reliable OCR can
be calculated for this country. Primark sales are estimates.
ORNANE (Obligations Convertibles ou Échangeables en Actions Nouvelles ou Existantes): net share settled bonds
convertible into new and/or existing shares.
Potential Yield: annualised contracted rent (including indexation) and other incomes for the next 12 months, net of operating
expenses + the ERV of vacant space, divided by the asset value net of estimated transfer taxes and transaction costs.
Replacement capital expenditure (Replacement Capex): replacement Capex relates to works either on equipment or the
structure of a standing asset. The primary purpose of Replacement Capex is to ensure that the asset is in good working order
and / or to make minor improvements. These investments can be triggered by obsolescence, maintaining technical
performance at market levels or compliance with regulatory requirements.
Rotation rate: (number of re-lettings and number of assignments and renewals with new concepts) / number of stores. Short
term leases are excluded.
SBR: Sales Based Rent.

101
SIIC: Société d’Investissement Immobilier Cotée (in France).
Specialty tenant: specialty stores <10k sq. ft. (c. 929 sqm).
Tenant sales: performance in URW’s shopping centres (excluding The Netherlands) in operation, including extensions of
existing assets, but excluding deliveries of new brownfield projects, acquisition of new assets and assets under heavy
refurbishment.
Total Acquisition Cost (TAC): the total amount a buyer shall pay to acquire an asset or a company. TAC equals the price
agreed between the seller and the buyer plus all transfer taxes and transaction costs.
Total Investment Cost (TIC): Total Investment Cost equals the sum of: (i) all capital expenditures from the start of the
project to the completion date and includes: land costs, construction costs, study costs, design costs, technical fees, tenant
fitting-out costs paid for by the Group, letting fees and related costs, eviction costs and vacancy costs for renovations or
redevelopments of standing assets; and (ii) opening marketing expenses. It excludes: (i) step rents and rent-free periods; (ii)
capitalised financial interests; (iii) overhead costs; (iv) early or lost Net Rental Income; and (v) IFRS adjustments.
Yield on cost: URW share of the expected stabilised Net Rental Income divided by the URW Total Investment Cost increased
by rent incentives (step rents and rent free periods), and for redevelopment project only, the Gross Market Value of the
standing asset at the launch of the project.