PRESS RELEASE INFORMATION PRESSE
31
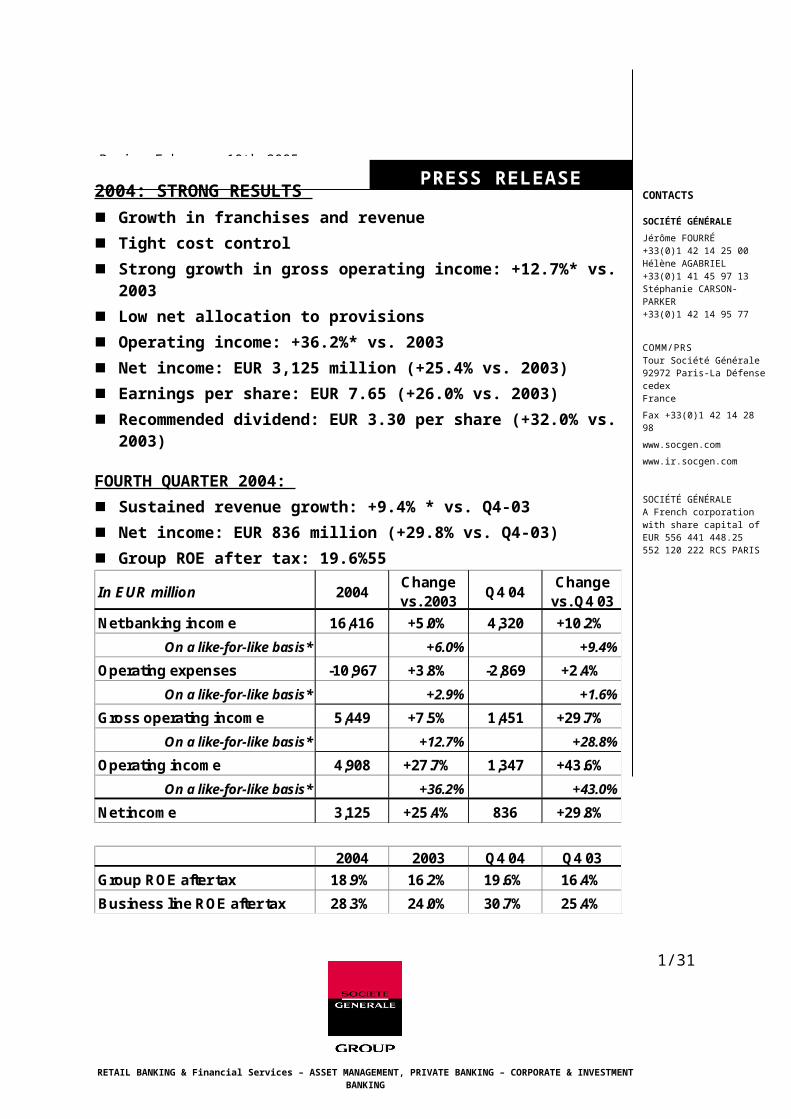
Paris, February 10th 2005 2004: STRONG RESULTS Growth in franchises and revenue Tight cost control Strong growth in gross operating income: +12.7%* vs. 2003 Low net allocation to provisions Operating income: +36.2%* vs. 2003 Net income: EUR 3,125 million (+25.4% vs. 2003) Earnings per share: EUR 7.65 (+26.0% vs. 2003) Recommended dividend: EUR 3.30 per share (+32.0% vs. 2003) FOURTH QUARTER 2004: Sustained revenue growth: +9.4% * vs. Q4-03 Net income: EUR 836 million (+29.8% vs. Q4-03) Group ROE after tax: 19.6%55 RETAIL BANKING & Financial Services – ASSET MANAGEMENT, PRIVATE BANKING – CORPORATE & INVESTMENT BANKING 1/31 PRESS RELEASE INFORMATION PRESSE CONTACTS SOCIÉTÉ GÉNÉRALE Jérôme FOURRÉ +33(0)1 42 14 25 00 Hélène AGABRIEL +33(0)1 41 45 97 13 Stéphanie CARSON- PARKER +33(0)1 42 14 95 77 COMM/PRS Tour Société Générale 92972 Paris-La Défense cedex France Fax +33(0)1 42 14 28 98 www.socgen.com www.ir.socgen.com SOCIÉTÉ GÉNÉRALE A French corporation with share capital of EUR 556 441 448.25 552 120 222 RCS PARIS In E UR million 2004 C hange vs.2003 Q 4 04 C hange vs.Q 4 03 N etbanking incom e 16,416 +5.0% 4,320 +10.2% On a like-for-like basis* +6.0% +9.4% O perating expenses -10,967 +3.8% -2,869 +2.4% On a like-for-like basis* +2.9% +1.6% G ross operating incom e 5,449 +7.5% 1,451 +29.7% On a like-for-like basis* +12.7% +28.8% O perating incom e 4,908 +27.7% 1,347 +43.6% On a like-for-like basis* +36.2% +43.0% Netincom e 3,125 +25.4% 836 +29.8% 2004 2003 Q 4 04 Q 4 03 G roup R O E aftertax 18.9% 16.2% 19.6% 16.4% B usiness line R O E aftertax 28.3% 24.0% 30.7% 25.4%
-
Upload
samanthafox -
Category
Documents
-
view
451 -
download
0
description
Transcript of PRESS RELEASE INFORMATION PRESSE
Paris, February 10th 2005
2004: STRONG RESULTS Growth in franchises and revenue
Tight cost control
Strong growth in gross operating income: +12.7%* vs. 2003
Low net allocation to provisions
Operating income: +36.2%* vs. 2003
Net income: EUR 3,125 million (+25.4% vs. 2003)
Earnings per share: EUR 7.65 (+26.0% vs. 2003)
Recommended dividend: EUR 3.30 per share (+32.0% vs. 2003)
FOURTH QUARTER 2004:
Sustained revenue growth: +9.4% * vs. Q4-03
Net income: EUR 836 million (+29.8% vs. Q4-03)
Group ROE after tax: 19.6%55
* When adjusted for changes in Group structure, at constant exchange rates and, with respect to the comparison of nine-month figures, excluding the capital gain of EUR 187 million on the disposal of property booked under NBI in Q1 03.
RETAIL BANKING & Financial Services – ASSET MANAGEMENT, PRIVATE BANKING – CORPORATE & INVESTMENT BANKING
1/22
PRESS RELEASE INFORMATION
PRESSE
CONTACTS
SOCIÉTÉ GÉNÉRALE
Jérôme FOURRÉ+33(0)1 42 14 25 00 Hélène AGABRIEL+33(0)1 41 45 97 13Stéphanie CARSON-PARKER+33(0)1 42 14 95 77
COMM/PRSTour Société Générale92972 Paris-La Défense cedexFrance
Fax +33(0)1 42 14 28 98
www.socgen.com
www.ir.socgen.com
SOCIÉTÉ GÉNÉRALEA French corporation with share capital of EUR 556 441 448.25 552 120 222 RCS PARIS
The Group’s results are presented in accordance with the new management structure arising from the establishment of the securities business (SG GSSI). All historical data for the business lines have been adjusted accordingly.
When adjusted for changes in Group structure, at constant exchange rates and, with respect to the comparison of twelve-month figures, excluding the capital gain of EUR 187 million on the disposal of property booked under NBI in Q1 03.
As of this quarter the Group’s results are presented in accordance with the new management structure arising from the establishment of the securities business (SG GSSI) in 2004. All historical data for the business lines have been adjusted accordingly.
In EUR million 2004Change vs. 2003
Q4 04Change
vs. Q4 03
Net banking income 16,416 +5.0% 4,320 +10.2%
On a like-for-like basis* +6.0% +9.4%
Operating expenses -10,967 +3.8% -2,869 +2.4%
On a like-for-like basis* +2.9% +1.6%
Gross operating income 5,449 +7.5% 1,451 +29.7%
On a like-for-like basis* +12.7% +28.8%
Operating income 4,908 +27.7% 1,347 +43.6%
On a like-for-like basis* +36.2% +43.0%
Net income 3,125 +25.4% 836 +29.8%
2004 2003 Q4 04 Q4 03
Group ROE after tax 18.9% 16.2% 19.6% 16.4%
Business line ROE after tax 28.3% 24.0% 30.7% 25.4%

/
At the meeting of the Board of Directors of Société Générale on February 9th 2005, the Board examined the results at December 31st 2004, which confirmed the Group’s capacity for growth. The Board of Directors will recommend a dividend payment of EUR 3.30 per share, representing a 32% increase on 2003, to the Annual General Meeting.
1. GROUP CONSOLIDATED RESULTS
2004 saw strong economic growth worldwide but an uncertain economic environment in Europe, a lack of clear-cut trends in the equity markets and a decline in interest rates and the dollar. The volume of deals by European corporates remained limited, notably on the equity capital markets. However the credit risk environment proved very favourable.
In this context the Group recorded strong results. Gross operating income stood at EUR 5,449 million for the year, up sharply by 12.7%1, compared to 2003, while net income rose by 25.4% to EUR 3,125 million.
The fourth quarter of 2004 was marked by sustained revenue growth, stable operating expenses and continued low risk provisioning. Net income was up 29.8% compared to the fourth quarter of 2003.
Net banking income
Net banking income for the year stood at EUR 16,416 million. In relation to 2003, this represented a 6.0%1 increase (+5.0% in absolute terms). Revenue in the Corporate & Investment Banking arm was stable in relation to 2003, which represented a high base; revenue in all the other businesses was up, particularly in the Group’s growth drivers – Retail Banking outside France, Financial Services and Global Investment Management & Services.
In the fourth quarter of 2004, Group net banking income stood at EUR 4,320 million, up sharply by 9.4% (+10.2% in absolute terms).
These results underscored the Group’s ability to deliver strong growth throughout the business cycle, thanks to its well-balanced business mix and the dynamic contribution made by its growth drivers.
Operating expenses
Operating expenses rose by 2.9% compared to 2003, reflecting continued emphasis on investment and tight cost control.
1 When adjusted for changes in Group structure and at constant exchange rates and excluding the capital gain of EUR 187 million on the disposal of property booked under NBI in Q1 03.When adjusted for changes in Group structure and at constant exchange rates
2/22
/
The Group’s 2004 cost/income ratio stood at 66.8%, down from 68,4%1 in 2003. The Group’s cost/income ratio stood at 66.4% for the quarter, compared to 71.5% in the fourth quarter of 2003.
Operating income
Gross operating income rose by 12.7%2 to EUR 5,449 million compared to 2003. Gross operating income in the fourth quarter of 2004 rose by 28.8%.
In the fourth quarter, risk provisioning remained low for the fifth quarter running, reflecting a favourable credit environment and specific factors within the Group, namely: systematic diversification of the credit portfolio, improved risk management and conservative provisioning of risk exposure. In 2004, the cost of risk in the French Networks stood at 32bps of risk-weighted assets, thereby confirming the structural improvement in the Group’s risk profile. For the third consecutive quarter, Corporate & Investment Banking booked a net write-back which stood at EUR 37 million in the fourth quarter (net write-back of EUR 60 million for the year as a whole), achieved exclusively through the write-back of specific provisions on loans redeemed or sold, with no write-back from the general credit risk reserve.
Group operating income in 2004 stood at EUR 4,908 million, up 36.2% compared to 2003 (+27.7% in absolute terms).
Operating income for the quarter stood at EUR 1,347 million, up sharply by 43.0%
(43.6% in absolute terms).
Net income
In a stock market environment lacking clear-cut trends, and in the absence of major deals, net income from long-term investments stood at EUR 119 million over the year. After goodwill amortisation, corporate income tax (effective annual tax rate of 28%) and minority interests, net income totalled EUR 3,125 million for the quarter, up 25.4% on 2003. Group ROE after tax stood at 18.9% for the year, compared to 16.2% last year.
Over the quarter, net income rose by 29.8% to EUR 836 million. Group ROE after tax stood at 19.6%, up sharply compared to the fourth quarter of 2003 (16.4%).
2. CAPITAL BASE
Group shareholders’ equity stood at EUR 18.6 billion at December 31st 2004, representing a book value per share of EUR 45.5. The Tier 1 ratio stood at 8.54% at
1 Excluding the capital gain of EUR 187 million on the disposal of property booked under NBI in Q1 03.2 When adjusted for changes in Group structure and at constant exchange rates and excluding the capital gain of EUR 187 million on the disposal of property booked under NBI in Q1 03.
3/22

/December 31st 2004. Risk-weighted assets increased by 8,7% over the year (9.9% in absolute terms).
As part of its policy aimed at cancelling out the dilutive impact of capital increases reserved for employees and stock option plans, Société Générale bought back 10.4 million shares (net of disposals) in 2004 at an average price of EUR 67.6. At December 31st 2004, the Group held 39.3 million of its own shares (excluding those held as part of its trading activities), representing 8.8% of its total share capital. Furthermore the Board of Directors decided to cancel 11 million shares representing non-allocated treasury stock (i.e. 2.5% of the Group’s capital).
The Group is rated AA- by Standard & Poor’s and AA- by Fitch. On January 6th 2005, Moody’s upgraded the Group to Aa2, emphasising in particular the Group’s consistent control of operating expenses and risk management. Société Générale ranks amongst the highest rated banking groups.
4/22

/
3. RETAIL BANKING AND FINANCIAL SERVICES
French Networks
Réseaux de détail en FranceThe environment for the domestic retail banking business remained lacklustre in 2004, due to sluggish economic growth and stiff competition underpinned by 9 national networks, excluding post office branches. There was no improvement in the last quarter. Interest rates reached record lows at the end of the year, and continued to weigh on net interest income.
Notwithstanding this context, the Société Générale and Crédit du Nord networks successfully pursued the expansion of their franchises and maintained revenue growth.
Regarding individual customers, the number of current accounts increased by +124,000 over the year, i.e. + 2.2%, despite a nationwide banking penetration rate of almost 100%. The increase stood at +27,000 during the fourth quarter.
216 million contacts were recorded in 2004 (+20% in relation to 2003), representing a 20% increase on 2003, of which 95 million via Internet (+45%). The Société générale and Crédit du Nord networks continue to record stronger demand for remote channels than major competing brands 1.
Life assurance represented the main priority in terms of savings and investments, with new inflows of EUR 7.3 billion, i.e. +17.5%, compared to an overall market increase of +13%. 75,000 PERP accounts were opened during the year, representing high quality production (average unit amounts of EUR 700). New mortgage loans stood at 12.8 billion euros, up by 8% over the landmark level achieved in 2003, and representing a twofold increase over 2000. The fierce competition required close scrutiny in terms of volume and interest margin. Between early 2000 and the end of
1 Source: OPBERBAC 2004.
5/22
In EUR million 2004Change vs. 2003
Q4 04Change
vs. Q4 03
Net banking income 5,865 +3.9% 1,515 +3.5%
Operating expenses -4,042 +3.2% -1,027 +3.7%
Gross operating income 1,823 +5.4% 488 +3.0%
Net allocation to provisions -291 -12.1% -75 -25.0%
Operating income 1,532 +9.5% 413 +10.4%
Net income 965 +9.9% 264 +11.9%
2004 2003 Q4 04 Q4 03
ROE after tax 20.3% 19.7% 21.7% 20.7%

/the second quarter 2004 (the latest data published by Banque de France), the combined outstanding loans of the Group’s two brands increased at an annualised rate of 10.4%, above the rate of growth of the market (+8.4%).
The above comment also applies to short-term credit facilities to individual customers: over the same period, the outstanding amount of the latter increased by 7.2% on an annualised basis, versus 5.0% for the market.
Comparable sales dynamism underpinned our drive for business customers. The two networks maintained their market share in terms of lending, which has also increased since January 2000. Outstanding loans rose by 2.4% on 2003, against a backdrop of weak demand for investment loans and reduced use of short-term corporate credit facilities, reflecting the favourable cash position of most counterparties.
In financial terms, the two networks recorded a 3.9% increase in NBI in relation to 2003, and 3.5% between the 4th quarter of 2004 and the same period in 2003.
Net interest income increased moderately in 2004 (+1% compared to 2003). The positive impact of the strong increase in sight deposits (+7.1%) was consistently offset quarter after quarter by the erosion of the interest margin on deposits due to the continued decline in long-term interest rates.
Commission income increased by 8.1% in 2004, with a sharp rise in financial commissions (+13.1%). The increase in service commissions (+6.5%) includes a small price effect, lower than inflation. Both networks are seeking to maintain the competitive fee structure widely recognised in public surveys.
A tight rein was kept on growth in operating expenses (+3.2% over the year), notwithstanding continued investment – in line with objectives – aimed at improving productivity (consolidation of regional middle and back-office platforms in the Société Générale network) and controlled growth in the number of sales outlets. The increase stood at +3.7% over the quarter compared to the fourth quarter of 2003, including a provision for early retirements scheduled in 2005.
The cost/income ratio declined to 68.9% in 2004, versus 69.4% in 2003.
Gross annual operating income stood at EUR 1,823 million, up 5.4% compared to 2003.
The annual cost of risk declined and stood at 32 basis points in relation to outstanding credits, against 37bps in 2003.
Net income stood at EUR 965 million in 2004, up 9.9% over 2003. It stood at EUR 264 million in the fourth quarter, up 11.9%.
ROE after tax stood at 20.3% in 2004, versus 19.7% in 2003. It stood at 21.7% in the last quarter, compared to 20.7% for the same period in 2003.
6/22

/
Retail Banking outside France
Retail Banking outside France is one of the Group’s main growth drivers. Development of this business rests on four underlying principles: investment and/or acquisitions in countries where the local banking market offers strong growth potential, distribution networks suited to local market conditions, with emphasis on long-term customer loyalty, strict risk management, and a well-balanced geographical presence in order to ensure diversification of risk.
In 2004, the main geographical emphasis of this business continued to shift towards Europe: 70% of the arm’s 2004 revenue was generated by subsidiaries in member states of the European Union or candidates for EU entry.
External growth continued in 2004, notably with the acquisition of a 50.01% stake in General Bank of Greece and the increase in the stake in the BRD (Development Bank of Romania) to 58.3%. Conversely, disposal of the retail banking business in Argentina, a non-strategic market for the Group, was launched.
Organic growth plans were pursued, with particular emphasis on the European subsidiaries (Czech Republic, Romania, Bulgaria), as well as Russia and Egypt.
The franchise continued to record sustained growth: the arm now provides services to 5.4 million individual customers, of which 3.5 million in Europe. The net increase in 2004 stood at 458,000 when adjusted for changes in group structure (i.e. +10% in relation to end 2003), of which +292,000 in Europe. Outstanding deposits and loans were up sharply by 9.1% and 13.4% respectively, with a particularly strong increase for individual customers.
This strong sales momentum was accompanied by emphasis on quality of service: Komercni Banka was awarded the “Bank of the Year” Award at the MasterCard Bank of the Year contest in the Czech Republic.
7/22
In EUR million 2004Change vs. 2003
Q4 04Change
vs. Q4 03
Net banking income 1,979 +16.3% 540 +20.0%On a like-for-like basis & at constant exchange rates +7.3% +5.3%
Operating expenses -1,213 +16.7% -331 +20.4%On a like-for-like basis & at constant exchange rates +3.1% +4.8%
Gross operating income 766 +15.5% 209 +19.4%On a like-for-like basis & at constant exchange rates +13.6% +6.1%
Net allocation to provisions -161 +0.0% -41 +0.0%
Operating income 605 +20.5% 168 +25.4%
Net income 265 +23.8% 74 +34.5%
2004 2003 Q4 04 Q4 03
ROE after tax 33.0% 32.1% 33.3% 33.0%

/
Revenue rose sharply by 7.3% between 2003 and 2004 (+16.3% in absolute terms). The annual NBI of the arm stood at EUR 1,979 million, representing 12% of Group NBI, versus 6% in 2000. Over the quarter, the arm’s revenue rose by 5.3% (+20.0% in absolute terms).
Operating expenses increased moderately (+3.1% in relation to 2003), notwithstanding major investment aimed at further growth and productivity (opening of new branches, pooling of IT and electronic payment infrastructure).
Although temporarily penalized by the integration of the new Greek subsidiary, the cost/income ratio remained stable at 61.3% over the year.
The cost of risk was again low, and stood at EUR 161 million in 2004.
Operating income rose by 20.5% over the year.
Net income increased by 23.8% in relation to 2003. ROE after tax was stable at a high level (33.0% in 2004, 33.3% over the quarter).
8/22

/
Financial Services
The Group’s Financial Services activities are mainly comprised of two business lines: Specialised Financing and Life Insurance.
Similarly to Retail Banking outside France, Specialised Financing represents a major area of development for the Group.
Following a series of acquisitions and investments in organic growth pursued in 2004, the business line has become a major diversified player in Europe, undergoing constant expansion. More than 60% of revenue is generated outside France. The three Specialised Financing businesses aimed at corporate customers rank among the top players in Europe.
The Group’s consumer credit business has achieved a significant size. Average annual revenue growth has been in excess of 26% since 2000. Despite the hesitant trend of the French market, new loan issuance increased by 10% compared to 2003, with particularly good performance at Franfinance and Fiditalia. Low interest rates underpinned margins on new loans. Outstanding loans increased by 16% for the year. There were two major highlights during the year, namely
― the launch of the business in Russia, and
― the agreement in principle for the acquisition in the last quarter of a 75% stake in Hanseatic Bank, the banking subsidiary of OTTO, the German mail order company ; the integration of Hanseatic Bank, the fourth largest specialist player in the German consumer credit market, will double the Group’s outstanding consumer loans in Germany.
9/22
In EUR million 2004Change vs. 2003
Q4 04Change
vs. Q4 03
Net banking income 1,841 +12.7% 512 +8.5%On a like-for-like basis & at constant exchange rates +9.0% +4.5%
Operating expenses -1,091 +6.0% -302 -1.9%On a like-for-like basis & at constant exchange rates +2.1% -5.1%
Gross operating income 750 +24.2% 210 +28.0%On a like-for-like basis & at constant exchange rates +20.8% +21.8%
Net allocation to provisions -137 -11.6% -31 -29.5%
Operating income 613 +36.5% 179 +49.2%
Net income 385 +35.1% 113 +46.8%
2004 2003 Q4 04 Q4 03
ROE after tax 15.6% 13.4% 17.8% 14.3%

/Regarding the vendor and equipment finance business, the production of SG Equipment Finance in Europe slightly increased in 2004, as strong performance in Eastern Europe offset weak demand in Western Europe. The cost of risk remained favourable. SG Equipement Finance pursued its growth strategy over the year, with the acquisition of the leasing and factoring businesses of Elcon Finans, the leading Norwegian player.
In operational vehicle leasing and fleet management, ALD Automotive pursued the expansion of its international network in 2004, with the establishment of entities in Switzerland, Ukraine, Russia, Romania, Croatia, Slovenia, the Baltic countries and Egypt. In the last quarter, ALD acquired FleetPartner Nordic, a Swedish company managing a fleet of 2,300 vehicles. With a fleet of 558,000 vehicles at end 2004 (+10% compared to end 2003), ALD International ranks as the third largest European player (n°2 in terms of outstandings).
The production of ECS, the leading European player in IT asset leasing and management, was up 6% in relation to 2003, driven by its overseas business, particularly in Spain, where ECS acquired the local subsidiary of the Parsys Group.
Overall, revenue generated by the Specialised Financing business line rose by 7%
in relation to 2003. ROE after tax stood at 18.7% for the year.
In the Life Insurance business, SOGECAP recorded a 17% increase in premium income in relation to 2003, which already represented a high base, above the average increase for the bancassurance sector in France (+14.4%). Its share of the bancassurance market therefore stood at 14.3% in terms of sales. Annual net banking income of the Life Insurance business rose by 26% compared to 2003.
Overall, the Financial Services arm notched up 36.5% growth in annual operating income. Its ROE after tax stood at 15.6% in 2004, versus 13.4% in 2003.
Over the quarter, the arm’s operating income rose by 49.2% and ROE after tax stood at 17.8% versus 14.3% for the same period in 2003.
10/22
/
4. GLOBAL INVESTMENT MANAGEMENT & SERVICES
The Global Investment Management & Services arm includes asset management (SG AM), private banking (SG Private Banking), as well as securities businesses (SG GSSI) and on-line brokerage (Boursorama).
The arm displayed strong growth momentum: net inflows stood at a record level of EUR 24.8 billion over the year, i.e. more than double the level achieved last year. At December 31st 2004, assets under management stood at EUR 315 billion; this outstanding amount does not include assets managed by Lyxor Asset Management (EUR 43.3 billion at December 31 2004), whose results are consolidated under the Equity and Advisory business line, nor the assets of customers managed directly by the French networks (approximately EUR 70 billion held by customers with investible assets exceeding EUR 150,000). Assets under custody at SG GSSI stood at EUR 1,115 million at December 31 2004, up 9% over the year. The number of lots handled by Fimat rose sharply in 2004 to 600 million contracts (+23% compared to 2003).
The arm’s financial results also showed a sharp improvement, with operating income up 36.6% on 2003 (+36.6% in absolute terms), and the cost/income ratio down sharply by over 4 points at 72.0%. Net income stood at EUR 392 million, up 35.2%. Over the quarter, net income rose by 30.0% to stand at EUR 117 million.
11/22
In EUR million 2004Change vs. 2003
Q4 04Change
vs. Q4 03
Net banking income 2,266 +14.3% 629 +11.3%On a like-for-like basis & at constant exchange rates +15.7% +13.8%
Operating expenses -1,631 +7.9% -441 +9.7%On a like-for-like basis & at constant exchange rates +9.8% +12.2%
Operating income 627 +36.6% 191 +22.4%On a like-for-like basis & at constant exchange rates +36.6% +25.0%
Net income 392 +35.2% 117 +30.0%
In EUR billion 2004 2003 Q4 04 Q4 03
Net new money over period 24.8 10.3 3.7 2.2
Assets under management (at end of period)
315 284 315 284

/Asset Management
SG AM is a global player with a strong positioning in the world’s four main investment regions.
In 2004, SG AM pursued its growth strategy based on the development of an innovative offering (notably in alternative management and high alpha products), and the harnessing of growth drivers in the form of partnerships: in Asia, SG AM strengthened its presence through the acquisition of Resona AM, the investment management subsidiary of the 5th largest Japanese banking group and joint-venture agreements with IBK the Korean group and State Bank of India, India’s largest banking group; overall, with its presence in China, SG AM has direct access to 350 million potential new individual clients in Asia.
SGAM’s expertise is recognised and it was designated best Asset Manager by institutional investors for the second year running1.
Net inflows of new money for 2004 tripled in relation to 2003, to stand at EUR 19.9 billion, with EUR 6.7 billion of this total invested in equity and diversified funds and EUR 3.2 billion invested in alternative management vehicles; TCW made a particularly strong contribution (EUR 9.4 billion). Cross-selling between the various platforms accounted for EUR 6.7 billion. In the fourth quarter, net inflows stood at EUR 2.8 billion, up EUR 1.3 billion over the fourth quarter of 2003.
Overall, assets under management at SGAM stood at almost EUR 267 billion at end 2004, versus EUR 239 billion at end 2003, despite negative currency impact of EUR 6.9 billion.
Net banking income was up sharply by 18.8% on 2003.
The rise in operating expenses compared to 2003 (+13.9%) remained well below that of revenue.
Annual operating income rose by 28.2% on 2003. Over the quarter the increase stood at 33.0%.
Private Banking
The business line continued its sustained sales drive with strong asset gathering over the period: EUR +4.9 billion over 2004 (representing growth in new money equivalent to 11% of assets under management). Over the quarter, net inflows stood at EUR 0.9 billion, up EUR 0.2 billion over the fourth quarter of 2003.
Overall, assets under management stood at EUR 48.4 billion 2 at end 2004, versus EUR 45.1 billion at end 2003, despite negative currency impact of EUR 1.3 billion. Structured products recorded strong growth in assets under management.
1 Source : Amadeis.2 Excluding assets of customers managed directly by the French networks (approximately EUR 70 billion held by customers with investible assets exceeding EUR 150,000).
12/22

/
The business line recorded a sharp increase in net banking income over the year (+15.8% over 2003). Despite the impact of additions to the sales teams and IT projects in Switzerland and Asia, operating expenses rose moderately in 2004 (+8.7% compared to 2003).
Operating income recorded a strong increase (+30.1% on 2003). The increase in operating income over the quarter stood at 12.0% in relation to the fourth quarter of 2003.
SG GSSI and Boursorama
Despite a relatively unfavourable market environment, client-driven activity continued to record sustained growth. The brokerage arm of SG GSSI confirmed its strong positioning (global market share of 5.1% 1 in execution and clearing on listed derivative products in the fourth quarter). The number of funds administered by the Investor sub-division of SG GSSI rose by 13% over one year. Boursorama successfully implemented its diversification strategy aimed at collecting savings, particularly via UCITS.
Net banking income in the business line rose by 11.5% on 2003.
Operating expenses increased less than revenue (+6.5% on 2003), despite non-recurrent expenses due to rationalisation.
Operating income doubled compared to 2003. Over the quarter, operating income was down 13.3%, but up sharply excluding non-recurrent expenses.
1 On major derivatives exchanges of which FIMAT is a member.
13/22

/
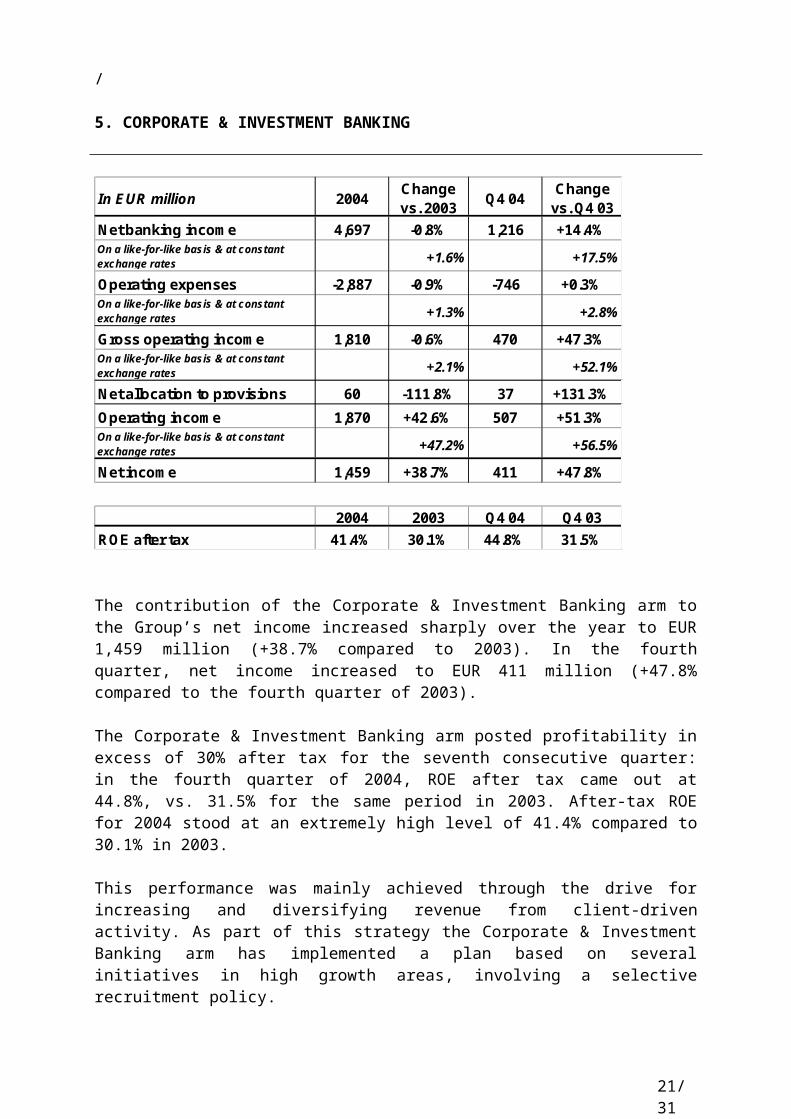
5. CORPORATE & INVESTMENT BANKING
The contribution of the Corporate & Investment Banking arm to the Group’s net income increased sharply over the year to EUR 1,459 million (+38.7% compared to 2003). In the fourth quarter, net income increased to EUR 411 million (+47.8% compared to the fourth quarter of 2003).
The Corporate & Investment Banking arm posted profitability in excess of 30% after tax for the seventh consecutive quarter: in the fourth quarter of 2004, ROE after tax came out at 44.8%, vs. 31.5% for the same period in 2003. After-tax ROE for 2004 stood at an extremely high level of 41.4% compared to 30.1% in 2003.
This performance was mainly achieved through the drive for increasing and diversifying revenue from client-driven activity. As part of this strategy the Corporate & Investment Banking arm has implemented a plan based on several initiatives in high growth areas, involving a selective recruitment policy.
These results also reflect the strong performance of the Corporate & Investment Banking arm:
― worldwide: the performance of the equity derivatives business in 2004 was recognised by three major awards from The Banker, IFR and Risk Magazine; the business again won the Trade Finance magazine award for best global arranger in export finance and number one structured financing arranger worldwide in commodity finance;
14/22
In EUR million 2004Change vs. 2003
Q4 04Change
vs. Q4 03
Net banking income 4,697 -0.8% 1,216 +14.4%On a like-for-like basis & at constant exchange rates +1.6% +17.5%
Operating expenses -2,887 -0.9% -746 +0.3%On a like-for-like basis & at constant exchange rates +1.3% +2.8%
Gross operating income 1,810 -0.6% 470 +47.3%On a like-for-like basis & at constant exchange rates +2.1% +52.1%
Net allocation to provisions 60 -111.8% 37 +131.3%
Operating income 1,870 +42.6% 507 +51.3%On a like-for-like basis & at constant exchange rates +47.2% +56.5%
Net income 1,459 +38.7% 411 +47.8%
2004 2003 Q4 04 Q4 03
ROE after tax 41.4% 30.1% 44.8% 31.5%

/― and in Europe, with strengthened leadership in its target businesses (No.5 in the
euro debt market and No.1 in Spain, number three project finance arranger in Europe), and in France where SG CIB ranks as the top player in debt and equity capital markets and number 1 for equity research (Extel).
In a more challenging market environment than in 2003, the Corporate and Fixed Income business recorded a moderate 3.1% decline in revenue compared to 2003, representing a high base. Activity was strong in structured finance, debt capital markets and client-driven deals in the Corporate and Fixed Income business. This partially offset the expected decline in revenue from the treasury business which nonetheless remained satisfactory.
The results of the Equity and Advisory arm were up sharply in 2004 (+8.8% on 2003). The Equity derivatives business recorded outstanding performance, up on 2003 both in client-driven and proprietary business. Cash Equity and Advisory business was also satisfactory in the primary market and there was a pick-up in average secondary market volume in 2004 despite the impact of weakness in the convertible bond market in France and in Europe compared to 2003. Fourth quarter revenue includes the positive impact of the disposal of the Private Equity Europe portfolio (EUR 37 million).
Overall, the net banking income of the Corporate & Investment Banking arm was up 1.6% on 2003. Net banking income rose sharply over the quarter, (+17.5%
compared to the fourth quarter of 2003), with all segments contributing to the increase.
The division’s operating expenses increased by 1.3% compared to 2003: this increase reflects the full impact of cost-cutting plans completed in 2003 and cost control, while the division pursued targeted investment in line with its strategy. Over the quarter the division’s operating expenses increased by 2.8% compared to the fourth quarter of 2003.
The cost/income ratio came out at a low level of 61.5% in 2004, i.e. the same as 2003, and at 61.3% in the fourth quarter.
Consequently gross operating income rose by 2.1% on 2003. Over the quarter, this increase came out at 52.1% compared to the fourth quarter of 2003.
In a very favourable credit risk environment, the Corporate & Investment Banking arm booked a net write-back of provisions of EUR 60 million for the year and EUR 37 million over the quarter. Very few provisions were booked on new loans; a write-back was booked on specific provisions, either due to favourable developments in counterparties’ financial position, or because the credit was repaid or sold under the bank’s policy of actively managing its loan book. No write-back was booked on general credit risk reserves in the United States and in Europe.
A tight rein was kept on market risks: average VaR remained at a moderate level of EUR 24.5 million over the year, vs. EUR 23.7 million in 2003, and EUR 21.4 million over the quarter (vs. EUR 24.3 million in the fourth quarter of 2003).
15/22

/
6. CORPORATE CENTRE
The Corporate Centre made a negative contribution of EUR 341 million in 2004, after recognising a goodwill amortisation charge of EUR 186 million.
The policy of reducing the industrial equity portfolio was pursued in 2004. At December 31st 2004, the net book value of the portfolio stood at EUR 1.6 billion (vs. EUR 2.6 billion at December 31st 2003), representing an unrealised capital gain of EUR 0.3 billion.
Schedule for publication of results under IAS standards
On September 27 2004, the Group made a presentation on the schedule for changeover to IFRS standards.
2004 financial statements audited under IFRS standards will be released on March 10 2005.
Results for the first quarter of 2005 and the opening balance sheet at January 1 2005 will be released under IFRS standards (including IAS 32 and 39) on May 25 2005.
This document contains a number of forecasts and comments relating to the targets and strategies of the Société Générale Group.
These forecasts are based on a series of assumptions, both general and specific. As a result, there is a risk that these projections will not be met. Readers are therefore advised not to rely on these figures more than is justified as the Group’s future results are liable to be affected by a number of factors and may therefore differ from current estimates.
Readers are advised to take into account factors of uncertainty and risk when basing their investment decisions on information provided in this document.
16/22

/
SUPPLEMENTS
17/22
2004 2003Change
04/032004 2003
ChangeQ4/Q4
Retail Banking & Financial Services 1,615 1,377 17.3% 451 368 +22.6%
o.w. French Networks 965 878 9.9% 264 236 +11.9%o.w. Financial Services 385 285 35.1% 113 77 +46.8%o.w. Retail Banking outside France 265 214 23.8% 74 55 +34.5%
Global Investment Management 392 290 35.2% 117 90 +30.0%
o.w. Asset Management 234 188 24.5% 83 61 +36.1%o.w. Private Banking 92 67 37.3% 21 19 +10.5%o.w. GSSI + Boursorama 66 35 88.6% 13 10 +30.0%
Corporate & Investment Banking 1,459 1,052 38.7% 411 278 +47.8%
o.w. Equity & Advisory 483 374 29.1% 112 36 NMo.w. Corporate Banking & Fixed Income 976 678 44.0% 299 242 +23.6%
CORE BUSINESSES 3,466 2,719 27.5% 979 736 +33.0%
Corporate Centre (341) (227) 50.3% (143) (92) +55.6%
GROUP 3,125 2,492 25.4% 836 644 +29.8%
NET INCOME AFTER TAX BY CORE BUSINESS(in millions of euros)
Full year Fourth quarter
2004 2003 2004 2003
Net banking income 16,416 15,637 5.0% +4.7%(*) 4,320 3,920 +10.2% +9.4%(*)
Operating expenses (10,967) (10,568) 3.8% +2.9%(*) (2,869) (2,801) +2.4% +1.6%(*)
Gross operating income 5,449 5,069 7.5% +8.4%(*) 1,451 1,119 +29.7% +28.8%(*)
Net allocation to provisions (541) (1,226) -55.9% -56.3%(*) (104) (181) -42.5% -45.2%(*)
Operating income 4,908 3,843 27.7% +29.3%(*) 1,347 938 +43.6% +43.0%(*)
Net income from long-term investments 119 397 -70.0% (27) 125 N/S
Net income from companies accounted for by the equity method
42 43 -2.3% 15 15 +0.0%
Exceptional items (20) (150) -86.7% 0 0 N/S
Amortisation of goodwill (186) (217) -14.3% (43) (72) -40.3%
Income tax (1,398) (1,161) 20.4% (355) (288) +23.3%
Net income before minority interests 3,465 2,755 25.8% 937 718 +30.5%
Minority interests (340) (263) 29.3% (101) (74) +36.5%
Net income 3,125 2,492 25.4% 836 644 +29.8%
Annualised Group ROE after tax (%) 18.9% 16.2% 19.6% 16.4%
Tier-one ratio at end of period 8.5% 8.7% 8.5% 8.7%
(*) When adjusted for changes in Group structure and at constant exchange rates.
Change 04/03CONSOLIDATED INCOME STATEMENT(in millions of euros) Change Q4/Q4
Full year Fourth quarter
NM
NM

/QUARTERLY RESULTS BY CORE BUSINESS
18/22
(in millions of euros) Q1 Q2 Q3 Q4 Q1 Q2 Q3 Q4 Q1 Q2 Q3 Q4
Net banking income 2,116 2,051 2,086 2,194 2,113 2,241 2,240 2,386 2,277 2,427 2,414 2,567Operating expenses -1,435 -1,422 -1,392 -1,443 -1,465 -1,487 -1,458 -1,573 -1,519 -1,595 -1,572 -1,660Gross operating income 681 629 694 751 648 754 782 813 758 832 842 907Net allocation to provisions -165 -151 -149 -184 -134 -157 -171 -185 -151 -154 -137 -147Operating income 516 478 545 567 514 597 611 628 607 678 705 760Net income from long-term investments 1 -7 29 -2 -2 3 2 3 27 -3 4 5Net income from companies accounted for by the equity method 3 7 4 0 4 4 3 2 2 2 1 0Income tax -177 -161 -192 -193 -175 -205 -209 -216 -218 -233 -241 -263Net income before minority interests 343 317 386 372 341 399 407 417 418 444 469 502Minority interests -42 -40 -52 -41 -44 -46 -48 -49 -53 -58 -56 -51Net income 301 277 334 331 297 353 359 368 365 386 413 451Average allocated capital 6,779 6,752 6,782 6,817 7,120 7,229 7,354 7,388 7,619 7,885 8,073 8,293
o.w. French networks
Net banking income 1,321 1,358 1,335 1,400 1,349 1,413 1,419 1,464 1,436 1,465 1,449 1,515Operating expenses -947 -961 -943 -955 -971 -982 -972 -990 -1,006 -1,018 -991 -1,027Gross operating income 374 397 392 445 378 431 447 474 430 447 458 488Net allocation to provisions -64 -73 -72 -88 -66 -76 -89 -100 -71 -76 -69 -75Operating income 310 324 320 357 312 355 358 374 359 371 389 413Net income from long-term investments 0 0 7 5 1 4 0 4 7 -2 4 9Net income from companies accounted for by the equity method 0 1 1 0 1 1 0 1 1 0 0 1Income tax -107 -115 -109 -127 -109 -126 -125 -133 -128 -130 -137 -147Net income before minority interests 203 210 219 235 205 234 233 246 239 239 256 276Minority interests -12 -10 -9 -9 -11 -11 -8 -10 -12 -10 -11 -12Net income 191 200 210 226 194 223 225 236 227 229 245 264
Average allocated capital 4,292 4,275 4,264 4,285 4,368 4,463 4,548 4,568 4,649 4,747 4,812 4,871
o.w. Financial Services
Net banking income 353 301 342 362 376 395 390 472 423 452 454 512Operating expenses -220 -221 -207 -233 -244 -246 -231 -308 -254 -265 -270 -302Gross operating income 133 80 135 129 132 149 159 164 169 187 184 210Net allocation to provisions -38 -31 -30 -36 -33 -39 -39 -44 -37 -37 -32 -31Operating income 95 49 105 93 99 110 120 120 132 150 152 179Net income from long-term investments 0 0 19 0 0 0 0 -1 0 0 0 -1Net income from companies accounted for by the equity method 0 0 0 0 0 0 0 0 0 0 0 0Income tax -36 -17 -46 -33 -36 -40 -43 -43 -48 -54 -54 -64Net income before minority interests 59 32 78 60 63 70 77 76 84 96 98 114Minority interests 1 -2 0 -2 -3 1 0 1 -1 -2 -3 -1Net income 60 30 78 58 60 71 77 77 83 94 95 113
Average allocated capital 1,844 1,851 1,896 1,907 2,086 2,118 2,153 2,153 2,294 2,335 2,425 2,534
o.w. Retail Banking outside France
Net banking income 442 392 409 432 388 433 431 450 418 510 511 540Operating expenses -268 -240 -242 -255 -250 -259 -255 -275 -259 -312 -311 -331Gross operating income 174 152 167 177 138 174 176 175 159 198 200 209Net allocation to provisions -63 -47 -47 -60 -35 -42 -43 -41 -43 -41 -36 -41Operating income 111 105 120 117 103 132 133 134 116 157 164 168Net income from long-term investments 1 -7 3 -7 -3 -1 2 0 20 -1 0 -3Net income from companies accounted for by the equity method 3 6 3 0 3 3 3 1 1 2 1 -1Income tax -34 -29 -37 -33 -30 -39 -41 -40 -42 -49 -50 -52Net income before minority interests 81 75 89 77 73 95 97 95 95 109 115 112Minority interests -31 -28 -43 -30 -30 -36 -40 -40 -40 -46 -42 -38Net income 50 47 46 47 43 59 57 55 55 63 73 74
Average allocated capital 643 626 622 625 666 648 653 667 676 803 836 888
Retail Banking & Financial Services
20032002 2004

/
19/22
Q1 Q2 Q3 Q4 Q1 Q2 Q3 Q4 Q1 Q2 Q3 Q4
Global Investment Management & Services
Net banking income 498 510 470 503 439 478 501 565 545 551 541 629Operating expenses -374 -383 -361 -363 -355 -368 -386 -402 -394 -399 -397 -441Gross operating income 124 127 109 140 84 110 115 163 151 152 144 188Net allocation to provisions -1 0 -1 -13 0 -6 0 -7 0 -5 -6 3Operating income 123 127 108 127 84 104 115 156 151 147 138 191Net income from long-term investments 0 0 -1 -8 -1 0 -1 -8 0 1 -2 3Net income from companies accounted for by the equity method 0 0 0 0 0 0 0 0 0 0 0 0Income tax -40 -40 -36 -37 -25 -33 -34 -46 -45 -44 -43 -61Net income before minority interests 83 87 71 82 58 71 80 102 106 104 93 133Minority interests -5 -4 -2 -2 1 -5 -5 -12 -10 -7 -11 -16Net income 78 83 69 80 59 66 75 90 96 97 82 117Average allocated capital 495 565 558 540 552 607 659 685 718 806 858 809
o.w. Asset M anagement
Net banking income 254 253 220 260 200 211 222 278 230 239 253 326Operating expenses -166 -169 -151 -156 -140 -139 -143 -161 -148 -152 -157 -182Gross operating income 88 84 69 104 60 72 79 117 82 87 96 144Net allocation to provisions 0 0 0 -8 0 0 0 -2 0 0 -5 5Operating income 88 84 69 96 60 72 79 115 82 87 91 149Net income from long-term investments -1 0 -1 -8 -1 0 -1 -9 0 1 -1 -2Net income from companies accounted for by the equity method 0 0 0 0 0 0 0 0 0 0 0 0Income tax -30 -28 -23 -30 -20 -25 -26 -36 -28 -30 -30 -50Net income before minority interests 57 56 45 58 39 47 52 70 54 58 60 97Minority interests -6 -5 -2 -2 -1 -5 -5 -9 -6 -6 -9 -14Net income 51 51 43 56 38 42 47 61 48 52 51 83
Average allocated capital 195 234 227 227 224 226 248 250 264 329 370 337
o.w. Private Banking
Net banking income 86 85 81 85 80 80 103 112 122 114 109 118Operating expenses -66 -68 -65 -70 -63 -65 -75 -87 -82 -81 -81 -88Gross operating income 20 17 16 15 17 15 28 25 40 33 28 30Net allocation to provisions 0 0 -5 -3 0 0 0 0 0 -4 -2 -2Operating income 20 17 11 12 17 15 28 25 40 29 26 28Net income from long-term investments 0 0 0 0 0 0 0 0 0 0 -1 0Net income from companies accounted for by the equity method 0 0 0 0 0 0 0 0 0 0 0 0Income tax -4 -3 -3 -1 -3 -2 -5 -4 -8 -5 -5 -5Net income before minority interests 16 14 8 11 14 13 23 21 32 24 20 23Minority interests 0 0 0 0 0 0 -2 -2 -2 -1 -2 -2Net income 16 14 8 11 14 13 21 19 30 23 18 21
Average allocated capital 150 151 154 151 157 164 182 219 232 250 265 266
o.w. GSSI & Boursorama
Net banking income 158 172 169 158 159 187 176 175 193 198 179 185Operating expenses -142 -146 -145 -137 -152 -164 -168 -154 -164 -166 -159 -171Gross operating income 16 26 24 21 7 23 8 21 29 32 20 14Net allocation to provisions -1 0 4 -2 0 -6 0 -5 0 -1 1 0Operating income 15 26 28 19 7 17 8 16 29 31 21 14Net income from long-term investments 1 0 0 0 0 0 0 1 0 0 0 5Net income from companies accounted for by the equity method 0 0 0 0 0 0 0 0 0 0 0 0Income tax -6 -9 -10 -6 -2 -6 -3 -6 -9 -9 -8 -6Net income before minority interests 10 17 18 13 5 11 5 11 20 22 13 13Minority interests 1 1 0 0 2 0 2 -1 -2 0 0 0Net income 11 18 18 13 7 11 7 10 18 22 13 13
Average allocated capital 150 180 177 162 171 217 229 216 222 227 223 206
200420032002

/
20/22
Q1 Q2 Q3 Q4 Q1 Q2 Q3 Q4 Q1 Q2 Q3 Q4
Corporate and Investment Banking
Net banking income 1,171 1,263 883 1,047 1,091 1,364 1,216 1,063 1,174 1,104 1,203 1,216Operating expenses -812 -845 -669 -813 -675 -763 -731 -744 -705 -681 -755 -746Gross operating income 359 418 214 234 416 601 485 319 469 423 448 470Net allocation to provisions -154 -164 -191 -211 -186 -201 -139 16 -48 34 37 37Operating income 205 254 23 23 230 400 346 335 421 457 485 507Net income from long-term investments -2 -25 3 48 0 1 2 24 2 -1 2 13Net income from companies accounted for by the equity method 0 6 0 12 1 6 2 8 1 10 3 14Income tax -42 -53 39 -1 -39 -95 -74 -87 -102 -111 -114 -122Net income before minority interests 161 182 65 82 192 312 276 280 322 355 376 412Minority interests -3 -6 -6 -5 -1 -3 -2 -2 -2 -1 -2 -1Net income 158 176 59 77 191 309 274 278 320 354 374 411Average allocated capital 3,634 3,590 3,646 3,698 3,605 3,612 3,609 3,529 3,524 3,581 3,620 3,666
o.w. Equity and Advisory
Net banking income 491 524 226 341 369 562 505 428 435 511 555 498Operating expenses -411 -422 -288 -397 -281 -342 -358 -348 -306 -320 -364 -326Gross operating income 80 102 -62 -56 88 220 147 80 129 191 191 172Net allocation to provisions 0 0 -5 -13 0 -10 0 -27 -31 0 -1 -14Operating income 80 102 -67 -69 88 210 147 53 98 191 190 158Net income from long-term investments 0 -12 0 -4 -2 0 0 0 0 -2 0 0Net income from companies accounted for by the equity method 0 0 0 0 0 0 0 0 0 0 0 1Income tax -24 -27 37 47 -16 -59 -30 -17 -19 -47 -40 -47Net income before minority interests 56 63 -30 -26 70 151 117 36 79 142 150 112Minority interests 0 0 0 0 0 0 0 0 0 0 0 0Net income 56 63 -30 -26 70 151 117 36 79 142 150 112
Average allocated capital 492 483 466 426 407 407 403 404 428 445 434 378
o.w. Corporate Banking and Fixed Income
Net banking income 680 739 657 706 722 802 711 635 739 593 648 718Operating expenses -401 -423 -381 -416 -394 -421 -373 -396 -399 -361 -391 -420Gross operating income 279 316 276 290 328 381 338 239 340 232 257 298Net allocation to provisions -154 -164 -186 -198 -186 -191 -139 43 -17 34 38 51Operating income 125 152 90 92 142 190 199 282 323 266 295 349Net income from long-term investments -2 -13 3 52 2 1 2 24 2 1 2 13Net income from companies accounted for by the equity method 0 6 0 12 1 6 2 8 1 10 3 13Income tax -18 -26 2 -48 -23 -36 -44 -70 -83 -64 -74 -75Net income before minority interests 105 119 95 108 122 161 159 244 243 213 226 300Minority interests -3 -6 -6 -5 -1 -3 -2 -2 -2 -1 -2 -1Net income 102 113 89 103 121 158 157 242 241 212 224 299
Average allocated capital 3,142 3,107 3,180 3,272 3,198 3,205 3,206 3,125 3,096 3,136 3,186 3,288
Corporate CentreNet banking income -81 28 -118 -48 106 23 -95 -94 -38 -21 -81 -92Operating expenses -45 -69 -21 -79 -24 -34 -21 -82 -38 -30 -13 -22Gross operating income -126 -41 -139 -127 82 -11 -116 -176 -76 -51 -94 -114Net allocation to provisions 34 28 16 5 -10 -13 -28 -5 1 -1 -7 3Operating income -92 -13 -123 -122 72 -24 -144 -181 -75 -52 -101 -111Net income from long-term investments 68 -99 -268 -36 -109 235 142 106 166 -13 -37 -48Net income from companies accounted for by the equity method -4 -10 19 11 5 2 1 5 1 1 6 1Exceptional items -2 -2 -4 -3 0 -150 0 0 -20 0 0 0Amortisation of goodwill -39 -62 -45 -38 -40 -60 -45 -72 -41 -63 -39 -43Income tax 53 56 101 74 20 -25 21 61 -1 56 53 91Net income before minority interests -16 -130 -320 -114 -52 -22 -25 -81 30 -71 -118 -110Minority interests -10 -30 4 -10 -12 -11 -13 -11 -10 -17 -12 -33Net income -26 -160 -316 -124 -64 -33 -38 -92 20 -88 -130 -143Average allocated capital 4,186 4,408 4,330 4,001 3,501 3,561 3,833 4,111 4,183 4,116 4,193 4,320
2002 2003 2004
/
QUARTERLY NET INCOME BY CORE BUSINESS
21/22
(in millions of euros) Q1 Q2 Q3 Q4 Q1 Q2 Q3 Q4 Q1 Q2 Q3 Q4
301 277 334 331 297 353 359 368 365 386 413 451
French Networks 191 200 210 226 194 223 225 236 227 229 245 264Financial Services 60 30 78 58 60 71 77 77 83 94 95 113Retail Banking outside France 50 47 46 47 43 59 57 55 55 63 73 74
GIMS 78 83 69 80 59 66 75 90 96 97 82 117
Asset management 51 51 43 56 38 42 47 61 48 52 51 83Private Banking 16 14 8 11 14 13 21 19 30 23 18 21GSSI + Boursorama 11 18 18 13 7 11 7 10 18 22 13 13
158 176 59 77 191 309 274 278 320 354 374 411
Equity & Advisory 56 63 -30 -26 70 151 117 36 79 142 150 112Corporate Banking & Fixed Income 102 113 89 103 121 158 157 242 241 212 224 299
CORE BUSINESSES 537 536 462 488 547 728 708 736 781 837 869 979
Corporate Centre -26 -160 -316 -124 -64 -33 -38 -92 20 -88 -130 -143
GROUP 511 376 146 364 483 695 670 644 801 749 739 836
2004
Corporate & Investment Banking
2002 2003
Retail Banking & Financial Services
Q1 Q2 Q3 Q4 Q1 Q2 Q3 Q4 Q1 Q2 Q3 Q4
GROUPNet banking income 3,704 3,852 3,321 3,696 3,749 4,106 3,862 3,920 3,958 4,061 4,077 4,320Operating expenses -2,666 -2,719 -2,443 -2,698 -2,519 -2,652 -2,596 -2,801 -2,656 -2,705 -2,737 -2,869Gross operating income 1,038 1,133 878 998 1,230 1,454 1,266 1,119 1,302 1,356 1,340 1,451Net allocation to provisions -286 -287 -325 -403 -330 -377 -338 -181 -198 -126 -113 -104Operating income 752 846 553 595 900 1,077 928 938 1,104 1,230 1,227 1,347Net income from long-term investments 67 -131 -237 2 -112 239 145 125 195 -16 -33 -27
Net income from companies accounted for by the equity method -1 3 23 23 10 12 6 15 4 13 10 15Exceptional items -2 -2 -4 -3 0 -150 0 0 -20 0 0 0Amortisation of goodwill -39 -62 -45 -38 -40 -60 -45 -72 -41 -63 -39 -43Income tax -206 -198 -88 -157 -219 -358 -296 -288 -366 -332 -345 -355Net income before minority interests 571 456 202 422 539 760 738 718 876 832 820 937Minority interests -60 -80 -56 -58 -56 -65 -68 -74 -75 -83 -81 -101Net income 511 376 146 364 483 695 670 644 801 749 739 836Average allocated capital 15,094 15,315 15,316 15,056 14,778 15,009 15,455 15,713 16,044 16,388 16,744 17,088
2002 2003 2004

/QUARTERLY NET INCOME BY CORE BUSINESS
22/22
(%) Q1 Q2 Q3 Q4 Q1 Q2 Q3 Q4 Q1 Q2 Q3 Q4
17.8% 16.4% 19.7% 19.4% 16.7% 19.5% 19.5% 19.9% 19.2% 19.6% 20.5% 21.8%
French Networks 17.8% 18.7% 19.7% 21.1% 17.8% 20.0% 19.8% 20.7% 19.5% 19.3% 20.4% 21.7%
Financial Services 13.0% 6.5% 16.5% 12.2% 11.5% 13.4% 14.3% 14.3% 14.5% 16.1% 15.7% 17.8%
Retail Banking outside France 31.1% 30.0% 29.6% 30.1% 25.8% 36.4% 34.9% 33.0% 32.5% 31.4% 34.9% 33.3%
GIMS 63.0% 58.8% 49.5% 59.3% 42.8% 43.5% 45.5% 52.6% 53.5% 48.1% 38.2% 57.8%
Asset Management 104.6% 87.2% 75.8% 98.7% 67.9% 74.3% 75.8% 97.6% 72.7% 63.2% 55.1% 98.5%
Private Banking 42.7% 37.1% 20.8% 29.1% 35.7% 31.7% 46.2% 34.5% 51.6% 37.0% 27.2% 31.6%
GSSI + Boursorama 29.3% 40.0% 40.7% 32.1% 16.4% 20.3% 12.2% 18.5% 32.4% 38.8% 23.3% 25.2%
17.4% 19.6% 6.5% 8.3% 21.2% 34.2% 30.4% 31.5% 36.3% 39.5% 41.3% 44.8%
Equity & Advisory 45.5% 52.2% -25.8% -24.4% 68.8% 148.4% 116.1% 35.6% 73.8% 127.6% 138.2% 118.5%
Corporate Banking & Fixed Income13.0% 14.5% 11.2% 12.6% 15.1% 19.7% 19.6% 31.0% 31.1% 27.0% 28.1% 36.4%
CORE BUSINESSES 19.7% 19.7% 16.8% 17.7% 19.4% 25.4% 24.4% 25.4% 26.3% 27.3% 27.7% 30.7%
GROUP 13.5% 9.8% 3.8% 9.7% 13.1% 18.5% 17.3% 16.4% 20.0% 18.3% 17.7% 19.6%
2004
Corporate & Investment Banking
2002 2003
Retail Banking & Financial Services