
PRESS-IN PILING: THE INFLUENCE OF PLUGGING … · (1996), and Eslami & Fellenius (1997). Recent...
12
1 1 PhD student, Cambridge University, Cambridge, UK 2 MEng student, Cambridge University, Cambridge, UK 3 Reader, Cambridge University, Cambridge, UK 4 Engineer, Giken Seisakusho Ltd., Kochi, Japan PRESS-IN PILING: THE INFLUENCE OF PLUGGING ON DRIVEABILITY David J. White 1 , Haramrita. K. Sidhu 2 , Tim C. R. Finlay 2 , Malcolm D. Bolton 3 , Teruo Nagayama 4 1 Introduction 1.1 Urban construction of deep foundations The decreasing availability of land in urban areas, and the increasing demand for urban development is leading to the construction of taller and heavier buildings at increasingly marginal sites. Such structures usually require founding at depth and modern construction methods are making the economics of piled foundations ever more attractive (Salgado, 1995). However, the urban environment is not suited to pile driving. Conventional dynamic installation techniques (i.e. drop hammer or vibro-piling) induce vibrations and settlement in a zone close to the pile, and cause noise and dust pollution. Damage to existing structures resulting from pile driving vibrations is not uncommon (Tomlinson, 1986). 1.2 Press-in pile driving Press-in pile driving machines provide an alternative method for installing pre-formed tubular or sheet piles. These machines use hydraulic rams to press piles into the ground using the negative shaft friction of previously-driven piles to provide reaction force (fig. 1.1). This technique eliminates the vibration, hammering and noise pollution associated with dynamic installation methods. Table 1.1 compares the noise created during installation of steel sheet piles using dynamic and press-in methods. The press-in method is particularly suited for retrofit renewal of existing structures where the disruption of existing services must be avoided. Press-in pilers are capable of operating alongside live railways for embankment pile stabilisation and beneath bridge structures for pier strengthening. Installation method Observed noise level Distance of observation Press-in piler 1 61 dB 7 m Vibratory 2 (medium freq.) 90 dB 1 m Drop hammer 2 98-107dB 7 m Light diesel hammer 2 97 dB 18 m 1 Giken Seisakusho 100 tonne 'Silent Piler'. 2 Tomlinson, 1986 Table 1.1: Noise developed during pile installation using various methods Figure 1.1: A press-in pile driver Appropriate selection of machinery is more critical to operators of press-in pilers than conventional pile driving equipment. The driving load of a press- 8th International Conference of the Deep Foundations Institute, New York. pp 299-310
Transcript of PRESS-IN PILING: THE INFLUENCE OF PLUGGING … · (1996), and Eslami & Fellenius (1997). Recent...

1
1PhD student, Cambridge University, Cambridge, UK2MEng student, Cambridge University, Cambridge, UK3Reader, Cambridge University, Cambridge, UK4Engineer, Giken Seisakusho Ltd., Kochi, Japan
PRESS-IN PILING: THE INFLUENCE OF PLUGGING ON DRIVEABILITY
David J. White1, Haramrita. K. Sidhu2, Tim C. R. Finlay2, Malcolm D. Bolton3, Teruo Nagayama4
1Introduction
1.1 Urban construction of deepfoundations
The decreasing availability of land in urban areas,and the increasing demand for urban developmentis leading to the construction of taller and heavierbuildings at increasingly marginal sites. Suchstructures usually require founding at depth andmodern construction methods are making theeconomics of piled foundations ever more attractive(Salgado, 1995).
However, the urban environment is not suited topile driving. Conventional dynamic installationtechniques (i.e. drop hammer or vibro-piling) inducevibrations and settlement in a zone close to the pile,and cause noise and dust pollution. Damage toexisting structures resulting from pile drivingvibrations is not uncommon (Tomlinson, 1986).
1.2 Press-in pile drivingPress-in pile driving machines provide analternative method for installing pre-formed tubularor sheet piles. These machines use hydraulic rams topress piles into the ground using the negative shaftfriction of previously-driven piles to providereaction force (fig. 1.1). This technique eliminatesthe vibration, hammering and noise pollutionassociated with dynamic installation methods. Table1.1 compares the noise created during installation ofsteel sheet piles using dynamic and press-inmethods.
The press-in method is particularly suited forretrofit renewal of existing structures where thedisruption of existing services must be avoided.Press-in pilers are capable of operating alongside
live railways for embankment pile stabilisation andbeneath bridge structures for pier strengthening.
Installationmethod
Observednoise level
Distance ofobservation
Press-in piler1 61 dB 7 m
Vibratory2
(medium freq.)90 dB 1 m
Drop hammer2 98-107dB 7 m
Light dieselhammer2
97 dB 18 m
1 Giken Seisakusho 100 tonne 'Silent Piler'.2 Tomlinson, 1986Table 1.1: Noise developed during pileinstallation using various methods
Figure 1.1: A press-in pile driver
Appropriate selection of machinery is more criticalto operators of press-in pilers than conventionalpile driving equipment. The driving load of a press-
8th International Conference of the Deep Foundations Institute, New York. pp 299-310

2
in pile is limited by the force capacity of thehydraulic rams. If unexpected resistance is metwhen driving with an undersized pile hammer orvibrator, penetration will be slowed, but totalrefusal is rare. In contrast, if the unexpectedresistance exceeds the force capacity of the press-inpiler, penetration is impossible.
1.3 Driving load predictionWhen using dynamic installation methods,appropriate pile driving equipment is selected bypredicting penetration resistance through dynamicanalysis or an energy method (eg. Hiley, 1925). Incontrast, since press-in pile installation applies aquasi-static load to the pile, static equilibriumanalysis can be carried out to select an appropriatesize of machine. Driving load can be predicted inthe same manner as ultimate load by summing shaftfriction and base resistance.
A variety of methods exist for this purpose, notablyBustamante & Gianeselli (1982), Kraft (1990),Toolan et al (1990), API RP2a (1993), Fleming etal (1992), Randolph (1994), Jardine & Chow(1996), and Eslami & Fellenius (1997). Recentreviews of these methods are presented by Hossain& Briaud (1993), Bandini & Salgado (1998), andChow (1997). A common observation (Brucy et al,1991; Hight et al, 1996; Randolph et al, 1994; DeNicola & Randolph, 1997) is that the pluggingbehaviour of tubular piles is not satisfactorilycaptured by existing design guidelines.
1.4 Plugging of tubular pilesAn open-ended tubular pile can penetrate in anunplugged or a plugged manner. During unpluggedpenetration, the pile moves downwards relative tothe internal soil column, in the manner of a samplertube (fig. 1.2a). Penetration is resisted by shaftfriction on the inside (Qsi) and outside (Qso) of thepile and by base resistance on the annulus of pilewall (Qw). During plugged penetration the internalsoil column is dragged downwards (fig. 1.2b), andthe pile assumes the characteristics of a closed-ended pile (Paikowsky et al, 1989). Penetration isresisted by shaft friction on the outside of the shaft(Qso) and by base resistance on the pile wall (Qw)and the soil plug (Qp).
Qunplugged = Qso + Qsi + Qw (1)Qplugged = Qso + Qw + Qp - Wp (2)
When a tubular pile is being installed by the press-in method, (or is being loaded to failure- these
events are analogous), penetration will occur bywhichever mechanism is the weakest (Raines et al,1992). If the shaft friction on the inside of the pile(Qsi) (plus the weight of the soil column) is greaterthan the base resistance of the soil column (Qp), thepile will penetrate in a plugged manner. Hence,when predicting the driving load in order to selecta machine type, the profiles of both unplugged andplugged penetration resistance with depth should beestimated. The lower bound of these twomechanisms will form the driving load.
Figure 1.2: Alternative penetrationmechanisms: unplugged and plugged
This paper presents the results of a series of fieldtests which shed light on the issues of driving loadprediction and plugging. Two instrumented pileswere used to observe the development of a soil plugduring press-in installation and measure the stressesin the internal soil column.

3
A procedure for predicting the driving load andhence selecting an appropriate machine type isoutlined. In conclusion, two novel constructiontechniques for optimising the use of press-in pilersare proposed in the light of this field data.
2 Analysis of tubular pilesWhen selecting a press-in machine, or predictingultimate load, the task is to calculate the continuousprofile of pile capacity (or driving load) from theground surface to the installed depth. A simpleexample of this analysis is presented below, for a800mm diameter tubular pile with 15mm wallthickness, installed at a hypothetical site consistingof uniform medium dense sand (fig. 2.2).
The driving load of a tubular pile is the sum of theshaft friction and the base resistance and is thelower bound of Qunplugged and Qplugged (eqn 1,2)(ignoring the weight of the pile). The profile withdepth of each component of these loads iscalculated below.
Conventional design practice is to predict baseresistance (Qw, Qp) using a correlation with eitherfriction angle and relative density (API RP2a, 1993;Fleming et al, 1992; Berezantzev et al, 1961), CPTresistance (Bustamante & Gianeselli, 1982; Jardine& Chow, 1996) or through a cavity expansionanalysis (Randolph et al, 1994). In this example, thevariation of base resistance with depth is illustratedusing a simple correlation with CPT resistance.
Local shaft friction, τs, is generally predicted usingthe Coulomb equation (eqn 3). To find the totalexternal shaft friction, (Qso), equation 3 is integratedover the pile surface area (eqn 4). It is often assumedthat the earth pressure coefficient, K, and pile-soilangle of friction, δ, remain constant along the lengthof the pile (Fleming et al, 1992; API RP2a, 1993)with limiting values of τs applying. Appropriatevalues from the API RP2a are used in this example.
τs = σh’ tan δ = K σ’v tan δ (3)Qso = I τs πD dz (4)
Recent methods for predicting the capacity ofdriven piles (Toolan et al, 1990; Lings, 1997;Randolph et al, 1994; Jardine & Chow, 1996)include 'friction fatigue', to describe a progressivedecrease in earth pressure coefficient and hencelocal shaft friction at a given soil horizon as the pilepenetrates further. This effect can be attributed to
compaction of the soil under the high cyclicloading caused by driving. There is evidence thatfriction fatigue is less significant when the pile isinstalled by jacking (Chow, 1997; De Nicola &Randolph, 1997), and it has been ignored in thissimple analysis.
Internal shaft friction, Qsi is the most difficultcomponent of pile capacity to evaluate. API RP2a(1993) assumes that the internal and external shaftfriction profiles are equal. However, since the soilcolumn is dragged downwards on all sides, 'arching'occurs. This is analogous to the arching within silosfirst described by Janssen (1894). Equilibriumanalysis of a horizontal slice of soil shows thatvertical stress increases exponentially with depth(eqns 5,6) (fig. 2.1).
Figure 2.1: Equilibrium of a horizontal slice ofsoil within a tubular pile
dσv' / dz = γ' + 4 K σv' tanδ / D (5)σv' = γ'D (e4Kh tanδ / D
- 1) / 4K tanδ (6)
The total internal shaft friction can be found byintegrating equation 5 over the height of the soilcolumn, h, (eqn 6), and considering the overallequilibrium of the column (eqn 7):
Qsi = σv' πD2/4 - Wp = (γ'D3π/16K tanδ)(e4Kh tanδ / D
- 1) - γ'h πD2/4 (7)
This analysis adopts the following recommendeddesign variables for medium dense sand; K = 0.8(API RP2a, 1993; De Nicola & Randolph, 1997)and δ = 25° (API RP2a 1993).
4
Qsi
Qw
Qso
0
1
2
3
4
5
6
0 5 10
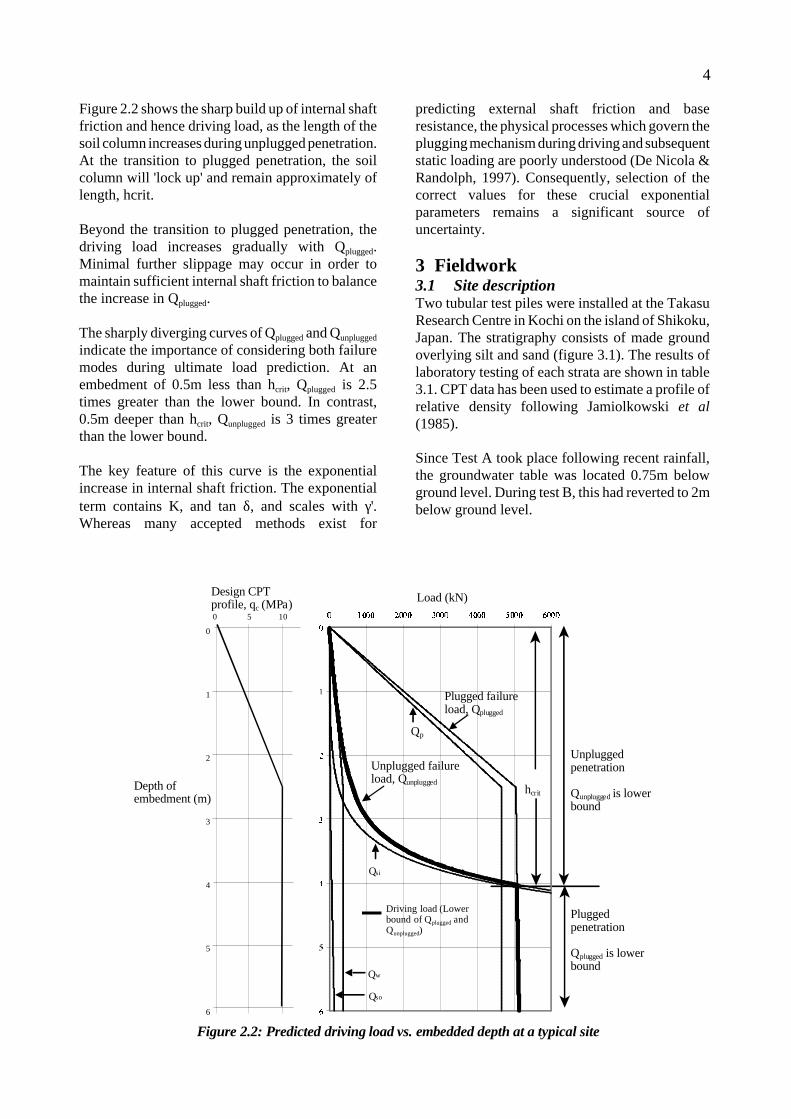
Figure 2.2: Predicted driving load vs. embedded depth at a typical site
Depth ofembedment (m)
Driving load (Lowerbound of Qplugged andQunplugged)
Load (kN)Design CPTprofile, qc (MPa)
Plugged failureload, Qplugged
Qp
Unplugged failureload, Qunplugged
hcrit
Unpluggedpenetration
Qunplugged is lowerbound
Pluggedpenetration
Qplugged is lowerbound
Figure 2.2 shows the sharp build up of internal shaftfriction and hence driving load, as the length of thesoil column increases during unplugged penetration.At the transition to plugged penetration, the soilcolumn will 'lock up' and remain approximately oflength, hcrit.
Beyond the transition to plugged penetration, thedriving load increases gradually with Qplugged.Minimal further slippage may occur in order tomaintain sufficient internal shaft friction to balancethe increase in Qplugged.
The sharply diverging curves of Qplugged and Qunpluggedindicate the importance of considering both failuremodes during ultimate load prediction. At anembedment of 0.5m less than hcrit, Qplugged is 2.5times greater than the lower bound. In contrast,0.5m deeper than hcrit, Qunplugged is 3 times greaterthan the lower bound.
The key feature of this curve is the exponentialincrease in internal shaft friction. The exponentialterm contains K, and tan δ, and scales with γ'.Whereas many accepted methods exist for
predicting external shaft friction and baseresistance, the physical processes which govern theplugging mechanism during driving and subsequentstatic loading are poorly understood (De Nicola &Randolph, 1997). Consequently, selection of thecorrect values for these crucial exponentialparameters remains a significant source ofuncertainty.
3 Fieldwork3.1 Site descriptionTwo tubular test piles were installed at the TakasuResearch Centre in Kochi on the island of Shikoku,Japan. The stratigraphy consists of made groundoverlying silt and sand (figure 3.1). The results oflaboratory testing of each strata are shown in table3.1. CPT data has been used to estimate a profile ofrelative density following Jamiolkowski et al(1985).
Since Test A took place following recent rainfall,the groundwater table was located 0.75m belowground level. During test B, this had reverted to 2mbelow ground level.

5
0 2 4 6 8 10 12
1
2
3
4
5
6
7
CPT qc (MPa)
Depth (m)
0
1
2
3
4
5
6
7
Borehole log
Made ground(A)
1.60 m
2.30 m
Silt(B)
Sand and gravel(C)3.00 m
5.20 m
Silty sand(D)
9.40 m
0 20 40 60 80 100
1
2
3
4
5
6
7
Relative density, IR (%)
Sand(E)
Figure 3.1: Site stratigraphy and CPT profile
Stratum φφcrit D10 (mm) D50 (mm)
A: Madeground
- - -
B: Silt 39E - -
C: Sand &gravel
44E 0.22 1
D: Silty sand 39E 0.047 0.18
E: Sand 42E 0.18 0.3Table 3.1: Soil properties
3.2 Pile and piler descriptionThe dimensions of the two test piles are shown intable 3.2.
Testpile
Douter(mm)
Wallthickness
t (mm)
Wall area,Awall (mm)
Plug area,Aplug (mm)
A 318.5 6.9 9731 72918B 162.5 5.0 5450 18265
Table 3.2: Dimensions of test piles
A specially modified press-in piler was used toinstall the test piles. Continuous calculation ofdriving load was achieved by measurement of theoil pressure in the hydraulic rams. Embedded depthwas measured using a displacement potentiometerattached to the head of the pile. The level of the soilcolumn within the pile was measured using adisplacement potentiometer attached to a weightedfollower within the pile.
The piles were installed in a series of 700mmstrokes at a rate of approximately 50mm/sec. Apause of 15 seconds between strokes occurredwhilst the rams were retracted.
3.3 Pile instrumentationThe aim of these tests was to investigate thephenomenon of plugging, and shed light on thedistribution of stress within the plug. The internalshaft friction is governed by the horizontal stress onthe pile wall, as well as the pile/soil interface angleof friction. Previous pile tests using closed-endtubular piles have measured horizontal stress usingdelicate total pressure cells embedded in the pilewall (eg. Coop, 1987; Chow, 1997).

6
σho
D’o
DiσhiDiFboltF
(Measured)Bolted connection
Welded connection
σhoop = (σhi Di - σho D’o) / 2t (8)F = σhoop t L (9)σhi = (2 F/L + σho D’o) / Di (10)
L = longitudinalbolt separation
Figure 3.2: Calculation of internal horizontalstress from bolt force
Pile tip
50 mm
Not to scale
300 mm
300 mm
300 mm
300 mm
Bolt 3
Bolt 5
Bolt 4
Bolt 1
Bolt 2
Pile wall
Figure 3.3: Location ofinstrumented bolts
However, since external shaft friction (and hencehorizontal stress) is very much lower than internalshaft friction, a differential pressure is createdacross the wall of a tubular pile. This differentialpressure causes a hoop stress within the pile wall(figure 3.2). This hoop stress is much larger than thehorizontal stress within the soil. Consequently it ispreferable to use instrumentation which infers thehorizontal stress from the hoop stress takingadvantage of the increased signal size.
The relative magnitudes of the external and internalhorizontal stresses can be estimated by comparingdesign method profiles for external shaft frictionwith the results of equation (6) which predicts thedistribution of internal shaft friction. Even whenexternal shaft friction is conservatively assumed toincrease sharply close to the pile toe (eg. Randolphet al, 1994), the external horizontal stress in thiszone is typically only 2-5% of the internalhorizontal stress. Hence, the hoop stress induced inthe pile wall is almost entirely due to the internalhorizontal stress. During analysis of theinstrumented bolt data, the minor correction forexternal horizontal stress depicted in equation 10has been carried out assuming external shaft frictionvaries as predicted by API RP2a. Pore pressures areassumed to be hydrostatic.
Each test pile was split longitudinally and the twosections were re-assembled using strain-gaugedbolts at 300mm intervals (figure 3.3). Whereas thedetection of horizontal stress using a total pressure
cell requires careful manufacture of the device andconsideration of cell action effects, theinstrumented bolts are relatively cheap and quick tomanufacture.
4 Driving load and pluggingmeasurements
Figure 4.1 shows the measured profiles of drivingload and soil column length with embedded depth.Measurement of soil column length failed at 5mdepth during the installation of pile B; the test wasrepeated using an uninstrumented pile to obtaintrace C.
The driving load follows the trend of the CPT databy increasing at depths of 2.3m and 5.5m. At theend of each 700mm press-in stroke, a drop indriving load can be detected. This could beattributed to pore pressure dissipation at the baseleading to a reduction in base resistance.
Whereas the hypothetical example shown in figure2.2 predicted a single transition from unplugged toplugged penetration, the field data shows thatmultiple transitions can occur in layered soil. Afteran initial period of unplugged penetration, the soilcolumn becomes sufficiently long to form a plug atapproximately 0.8m depth. Penetration continues ina plugged manner (with a brief period of slippageduring Test A between 1.4 and 1.7m) until the hardlayer at 2.3m depth is reached.
Upon reaching a hard layer, plugged resistanceincreases sharply since base resistance follows theCPT profile. In contrast, unplugged resistance is

7
Test BD = 162.5mm
Test AD = 318.5mm
Test CD = 162.5mm
Test AD = 318.5mm
Test BD = 162.5mm
Embeddeddepth (m)
Driving load (kN) Soil column length (m)0 100 200 300 400 500
0
1
2
3
4
5
6
7
0
1
2
3
4
5
6
7
0 0.25 0.5 0.75 1 1.25 1.5 1.75 2
Plugged
PluggedPlugged
Plugged
Plugged
Figure 4.1: Driving load and soil column length vs. embedded depth
less influenced by a hard layer. Hence, the lowerbound mechanism reverts to unplugged penetration.This causes the soil column to increase in length,accompanied by an exponential increase in internalshaft friction. At approximately 2.7m depth thisincrease in internal shaft friction causes the lowerbound mechanism to revert back to pluggedpenetration. On reaching the sand layer at 5.2mdepth, penetration again becomes unplugged.
5 Measurement of stresses in soilcolumn
The output from the instrumented bolts wasconverted to internal horizontal stress (σ'hi)according to the calculation method shown inequations 8-10. Fig. 5.1 shows the variation ofhorizontal stress with embedded depth at each boltlocation. The quantity s/D indicates the distance ofeach bolt from the pile toe (s) normalised with pile
diameter (D).
The similarity between the profiles of horizontalstress with the variation of soil column length withdepth is notable. Changes in soil column length areassociated with large increases in horizontal stressat a given bolt location. These profiles of horizontalstress are converted to plug force (Qsi + Wp) byintegration over the length of the pile (fig. 5.2).
The measured curves of plug force closely matchdesign predictions found using arching theory (eqn
7) with input parameters, K and tan δ, chosen asproposed by De Nicola & Randolph (1997). Theseguidelines are derived from centrifuge test data ofjacked model piles. The correlation with these full-scale results is remarkable, particularly since theexponential curve is very sensitive to the inputparameters.

8
Bolt 1, s/D= 0.3Bolt 2, s/D= 2.1Bolt 3, s/D= 4Bolt 4, s/D= 5.9
Bolt 1: s/D= 0.2Bolt 2: s/D= 1.1Bolt 3: s/D=2.0Bolt 4: s/D= 3.0Bolt 5: s/D= 3.9 s = distance frompile tip
Pile BD = 162.5mm
Pile AD = 318.5mm
Internal horizontal stress, σ’hi (kPa)0 250 500 750 10000
1
2
3
4
5
6
7Embedded depth (m)
0
1
2
3
4
5
6
7Embedded depth (m)
Internal horizontal stress, σ’hi (kPa)0-250 250 500 750 1000 1250 1500 1750 2000
Figure 5.1: Variation of internal horizontal stress, σσ’hi with embedded depth
The analysis of dynamically-installed piles oftenassumes that a pile plug consists of a 'wedged' and'unwedged' zone (Murff et al, 1990; Randolph et al,1991). The 'unwedged' zone is considered not tomobilise shaft friction and act only as surcharge onthe lower 'wedged' zone. The physical explanationfor this phenomenon is that the cyclic loadingcreated during installation will loosen the top of thesoil column. Since press-in installation ismonotonic, this loosening will not occur. Thedesign predictions shown on figure 5.2 consider thatthe entire plug is 'wedged'.
If further research confirms that arching theoryprovides a robust technique for predicting internalshaft friction, this will provide a valuable technique
for estimating the strength of pressed-in piles.Reliance on empirical methods for prediction ofplugging can be eliminated.
6 Implications for the press-inconstruction technique
6.1 Sensitivity of plug capacityThe exponential build of internal horizontal stressobserved during these field tests and predicted byarching theory indicates the sensitivity of internalshaft friction (Qsi) to the governing parameters K,tan δ and γ' in equation (7). This phenomenon couldbe exploited to improve the driveability of pressed-in piles.

9
Test B
Test A
De Nicola &Randolph (1997)
Plug force (Qsi + Wp) (kN)0 50 100 150 200 250
0
0.5
1
1.5
2Plug length (m)
K = ID / 100
Figure 5.2: Variation of plug force (Qsi + Wp)with plug length
Horizontalextension
Kaσv'
A
B
C
φ' σ'vA, σ'vB, σ'vCσ'hC σ'hBσ'hA
'σ'
τ'
σ' hC = Ka σ' vCKa = (1- sin φ) / (1- sin φ)
Figure 6.1: Hypothesised stress changes due todriving shoe
The field data shows that internal shaft frictionaccounts for more than 60% of the driving load ofpile A beyond depths of 3m. A constructionprocedure which reduces any of the controllingvariables, K, tan δ or γ', could dramatically reducethe driving load of pressed-in piles. For laterallyloaded piles, this decrease in axial capacity is notcritical. If the adjustment can be recovered, axiallyloaded piles of significantly greater capacity thanthe strength of the press-in piler could also beinstalled. Two possible construction variations arediscussed below.
6.2 Driving shoe to reduce KThe use of a driving shoe can provide relief ofinternal horizontal stress by reducing the earthpressure coefficient, K (De Nicola & Randolph,1997). Field tests have indicated that dynamicdriving resistance can be significantly reducedthrough the use of a driving shoe (Raines et al,1992).
The physical mechanism by which K is reduced ishypothesised in figure 6.1. As an element of soilpasses through the shoe, the large decrease in
horizontal confinement causes a reduction inhorizontal stress. The vertical stress remains high,governed by the internal shaft friction of the upperpart of the soil column.
Consequently, the lower bound value of K isgoverned by the active failure criterion (eqn 11). Inthe case of the field data presented above, thiswould represent a reduction of K from 0.8 to 0.4 inthe dense sand strata.
Kactive = (1 - sinφ) / (1 + sinφ) (11)
This change in K leads to a dramatic reduction ofinternal shaft friction. This is best illustrated byplotting the stress at the base of the soil column dueto internal shaft friction and the weight of the soil,(Qsi+Wp)/Ap, against depth (figure 6.2).
If (Qsi+Wp)/Ap is lower than base resistance, qb, anunplugged mechanism will form the lower bound,plugging will be avoided, unplugged penetrationwill occur, and consequently driving load will bereduced.

10
Figure 6.2: Effect of reducing K on plugforce
Figure 6.3: Effect of reducing γγ’ on plug force
6.3 Water injection to reduce γγ'A drawback of reducing driving load by using ashoe is that the change in capacity is difficult torecover. An alternative method to ease driving is toinject water close to the base of the soil columnwhich then flows up the column creating an upwardhydraulic gradient. This upward hydraulic gradientreduces the buoyant weight of the soil column, witha consequent reduction of internal shaft friction.
Figure 6.3 demonstrates how varying γ' couldreduce internal shaft friction with a resultingreduction in driving load. The soil column need notbe fully liquefied. Following installation, the porepressures will return to hydrostatic and the lostinternal shaft friction will become available.
Field testing is required to confirm this hypothesis,and to ensure than long term external shaft frictionand base resistance are not adversely affected by thewater injection.
A further method of improving plug strength post-installation to increase the ultimate capacity beyondthe driving load is described by Randolph et al(1991). Placing a relatively small surcharge onto thesoil plug after installation leads to a dramaticincrease of internal shaft friction. Equation 6 can berewritten as shown in equation 12 to calculate theincrease in vertical stress within the soil plugcaused by a surcharge, p, applied to the top of thesoil plug.
σv' = p + (p + γ'D / 4K tanδ) (e4Kh tanδ / D - 1) (12)
7 ConclusionsThe novel installation technique used by press-inpile drivers allows construction to proceed withoutthe environmental problems associated withdynamic pile installation methods. However thedeployment of press-in pile drivers is currentlylimited to sites where the static load capacity of themachine is above the maximum expected resistance.

11
Predicting this resistance remains particularlyproblematic when installing tubular piles.Conventional design methods either ignore internalshaft friction, or use an empirical correlation todetermine the critical failure mode; plugged, orunplugged. A more robust analysis technique is toevaluate driving load as the lower bound of pluggedand unplugged failure loads.
Field tests on two pressed-in instrumented tubularpiles indicate that internal shaft friction is wellpredicted by arching theory (Janssen, 1894). Designvalues of K derived from centrifuge test data (DeNicola & Randolph, 1997) closely fit the fieldresults.
If further field tests confirm these results over awider range of ground conditions and pile types,arching theory will provide a valuable tool forpredicting the strength of pressed-in piles based onstatic analysis, without recourse to empiricalrelationships to understand plugging behaviour.
Since internal shaft friction evolves according to anexponential relationship, large reductions can beachieved through only a small change in thegoverning parameters, K, tan δ and γ'. It ishypothesised that novel construction techniqueswhich take advantage of this phenomenon couldlead to wider applications of pressed-in piles.
The use of a driving shoe is proposed as a techniquefor permanently reducing internal shaft friction bydecreasing the horizontal earth pressure coefficientwithin the internal soil column. Water injection isproposed as a technique of temporarily reducing thebuoyant weight of the soil within the pile duringinstallation. The resulting loss of internal shaftfriction would be recoverable after installation.
Field testing is required to assess the viability ofthese techniques. Little quantitative research hasbeen previously conducted into the influence ofdriving shoes and water injection.
The field tests described in this paper were carriedout in sand. The field data was analysed under theassumption that the press-in installation took placeunder drained conditions, with pore pressuresremaining hydrostatic. Any error would be minimalsince typical increases in pore pressure induced bypile installation would not significantly alter thelarge stresses measured within the soil plug.
However, further investigation of the pore pressuresgenerated during press-in installation is needed toassess whether the shaft friction and base resistanceencountered during driving are different to theultimate values.
8 AcknowledgementsThe first, second and third authors are grateful toGiken Seisakusho Ltd for the financial supportprovided by their scholarships. The field testing wascarried out at Giken Seisakusho’s Takasu test site inKochi, Japan, as part of a research collaborationwith Cambridge University.
9 References
American Petroleum Institute (API) (1993) RP2A:Recommended practice of planning, designing andconstructing fixed offshore platforms- Workingstress design, 20th edition, Washington 59-61
Bandani & Salgado (1998) Methods of pile designbased on CPT and SPT results Geotechnical sitecharacterisation (eds. Robertson & Mayne),Balkema, Rotterdam 967-976
Berezantzev V. C., Kristoforov V. & Golubkov V.(1961) Load-bearing capacity and deformation ofpiled foundations Proceedings of the 4th
International Conference On Soil Mechanics &Foundation Engineering, Paris 2:11-12
Brucy F., Meunier J. & Nauroy J-F (1991)Behaviour of a pile plug in sandy soils during andafter driving Proceedings of the OffshoreTechnology Conference, Houston, Texas,OTC6514:145-154
Bustamante M. & Gianaselli L. (1982) Pile bearingcapacity by means of static penetrometer CPTProceedings of the 2nd European Symposium onPenetration Testing, Amsterdam,493-500
Chow F. C. (1997) Investigations into the behaviourof displacement piles for offshore foundations PhDthesis, University of London (Imperial College)
Coop M. R. (1987) The axial capacity of drivenpiles in clay DPhil thesis, Oxford University
De Nicola A. & Randolph M. F. (1997) Theplugging behaviour of driven and jacked piles insand Geotechnique 47(4):841-856

12
Eslami & Fellenius (1997) Pile capacity by directCPT and CPTu methods applied to 102 casehistories Canadian Geotechnical Journal (34): 886-904
Fleming W. G. K., Weltman A. J., Randolph M. F.& Elson W. K. (1992) Piling Engineering Blackie(Halsted Press), Glasgow
Hight D. W., Lawrence D. M., Farquhar G. B.,Milligan G. W. E., Gue S. S. & Potts D. M. (1996)Evidence for scale effects in the end bearingcapacity of open-ended piles in sand Proceedings ofthe Offshore Technology Conference, HoustonOTC7975: 181-192
Hiley A. (1925) A rational pile-driving formula andits application in piling practice explainedEngineering (London) (119): 657,721
Hossain M. K. & Briaud J-L (1993) Improved soilcharacterisation for pipe piles in sand in API RP2aProceedings of the Offshore TechnologyConference, Houston OTC7193: 637-654
Jamiolkowski M., Ladd C. C., Germaine J. T.,Lancelotta R. (1985) New developments in field andlaboratory testing of soils Proceedings of the 11th
Conference on Soil Mechanics and FoundationEngineering (1): 57-156
Janssen H. A. (1894) Versuche uber getreidedruckin Silozollen, Aeitschrift, Verein DeutscherIngenieure (39):1045-1049
Jardine R. J. & Chow F. C. (1996) New designmethods for offshore piles MTD Publication96/103, Marine Technology Directorate, London
Kraft L. M. (1990) Computing axial pile capacity insands for offshore conditions MarineGeotechnology 9:61-72
Lings M. L. (1997) Predicting the shaft resistance ofdriven pre-formed piles in sand Proceedings of theInstitution of Civil Engineers, GeotechnicalEngineering 125(April):71-84
Murff J. D., Raines R. D. & Randolph M. F. (1990)Soil plug behaviour of piles in sand Procedings ofthe Offshore Technology Conference, HoustonOTC6421: 25-32
Paikowsky S. G., Whitman R. V. & Baligh M. M.(1989)A new look at the phenomenon of offshorepile plugging Marine Geotechnology (8) 213-230
Raines D. R., Ugaz O. G. & O'Neill M. W. (1992)Driving characteristics of open-toe piles in densesand ASCE Journal of Geotechnical Engineering118(1): 72-88
Randolph M. F., Leong E. C., & Houlsby G. T.(1991) One-dimensional analysis of soil plugs inpipe piles Geotechnique 41(4): 587-598
Randolph M. F., Dolwin J. & Beck R. (1994)Design of driven piles in sand Geotechnique44(3):427-448
Salgado R. (1995) Design of piles in sands based onCPT results Proceedings of the 10th Pan-AmericanConference on Soil Mechanics & FoundationEngineering, Guadalajara (3): 1261-1274
Tomlinson M. J. (1986) Foundation design andconstruction. Pitman, London
Toolan F. E., Lings M. L. & Mirza U. A. (1990) Anappraisal of API RP2A recommendations fordetermining skin friction of piles in sandProceedings of the 22nd Offshore TechnologyConference, Houston, Texas OTC6422 4:33-42