President’s Report Faculty Senate Meeting November 20, 2014 President's Report1.
Upload
tabitha-jenkinsCategory
view
215download
0
President’s Report to the Faculty
January 14, 2010

Historic Moments!
• January 3, 2010: RFP issued for architects’ proposals for concept design on the new Trinity Academic Center
• Planning discussions underway for addition of the allied health professions
• TrinityOnline will be reality by Fall 2010
• Fall enrollment at all-time high and spring enrollment looking equally strong

Trinity’s Fabulous Decade 2000-2009!
• Launch University• Trinity Center Created• Successful Centennial Campaign• Successful Accreditation• Launch Nursing• Engage Technology• 20,000 students served• 3,500 degrees awarded• $28 million gifts and grants
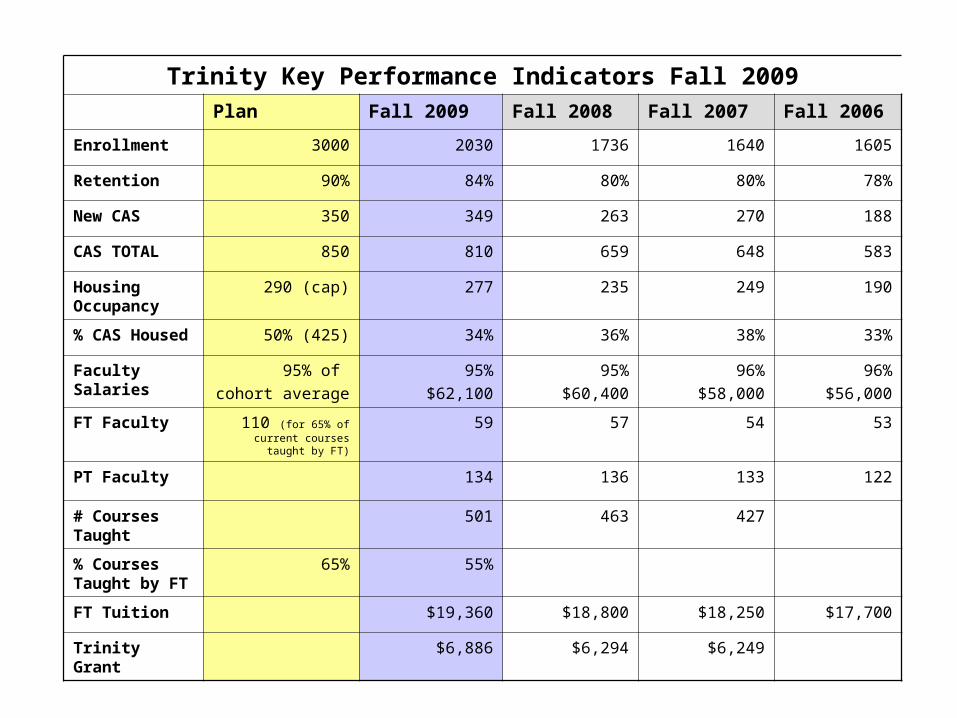
Trinity Key Performance Indicators Fall 2009Plan Fall 2009 Fall 2008 Fall 2007 Fall 2006
Enrollment 3000 2030 1736 1640 1605
Retention 90% 84% 80% 80% 78%
New CAS 350 349 263 270 188
CAS TOTAL 850 810 659 648 583
Housing Occupancy
290 (cap) 277 235 249 190
% CAS Housed 50% (425) 34% 36% 38% 33%
Faculty Salaries
95% of
cohort average
95%
$62,100
95%
$60,400
96%
$58,000
96%
$56,000
FT Faculty 110 (for 65% of current courses taught by FT)
59 57 54 53
PT Faculty 134 136 133 122
# Courses Taught
501 463 427
% Courses Taught by FT
65% 55%
FT Tuition $19,360 $18,800 $18,250 $17,700
Trinity Grant $6,886 $6,294 $6,249

ENROLLMENT HEADCOUNTS SINCE FALL 2000
421 423505 551 519 526 560 504
631572
640 600
810
382 409
476 404 472 436 352357
325292
312297
333512 495
664 682 668656 693
658
684701
784793
887
0100200300400500600700800900
100011001200130014001500160017001800190020002100
2000
2001
2002
2003
2004
2005
2006
SP07
Fall 07
SP08
FALL 08
SP09
FALL 09
CAS EDU SPS
1315 1327
1645 16371659
1618 16051519
16401565
17361690
NUMBER OF STUDENTS2030
53% increase in headcount since Fall 2001
17%
CAS 91%

Trinity Enrollments Showing Credit VolumeFall and Spring Enrollments, Fall 01 to SPRING 2009
57905660 7024
6566 75206893 7112
7077 73246636 7372
6885 87128053 9302
833211415
313 276 158357
235163
206249
176203
210
27992959
34613299 3223
3031 31383214
29593215 2936
2844
31823274
3897
3899
4709
372 408
7861131
1963
1967 17971790
21002267 2409
2216
2104
2002
2052
2092
2176
2680 3047
28483342
25612958 3093 3494
2818 3172 2338
2728
19142059
2087
2190
1981
306 321
306 307255 336
0
5000
1000
0
1500
0
2000
0
2500
0
FALL 01 SPRING
02
FALL 02 SPRING
03
FALL 03 SPRING
04
FALL 04 SPRING
05
FALL 05 SPRING
06
Fall 06 Spring 07 Fall 07 SPRING
08
FALL 08 SPRING
09
FALL 09
CAS CR FT CAS CR PT SPS CR UG SPS CR GR EDU CR
11,94712,395
14,425 14,645
15,522 15,185 15,493 15,851 15,359 15,647 15,345
14,797
16,11815,637
17,51416,716
NUMBER OF CREDITS
20,491
72% increase in credit generation since Fall 2001
17%

Trinity 2010-2015
• Develop/Build Trinity Academic Center
• Second Century Campaign

Trinity 2010 Agenda

Operational Goals for 2010
1.Fall 2010: Minimum 2300 Headcount2.Surplus Budgets FY2010 + 20113. Implement 4-School Paradigm Completely4.Launch TrinityOnline (RN-MSN + EDAD)5.Concept Design on the Academic Center6.Housing Proposals7.Draft Periodic Review Report for Middle States8.Strategic Plan Update9.Continue Faculty Improvements – Size,
Assessment (Rubrics Project), Faculty Handbook10. Launch $30 million Capital Campaign

STRATEGICENROLLMENT
GOAL(Goal 1)
BASELINE5-YEAR
FINANCIAL MODEL(Goal 2)
CAPITALCAMPAIGN
PLAN(Goal 2)
PROGRAMS(Goal 3)
TECHNOLOGY(Goal 4)
PEOPLECAPACITY(Goals 5-6)
SERVICEREPUTATION
INTELLECTUAL OUTPUT
(Goals 7-8-9)
FACILITIES(Goal 10)
STRATEGIC PLANNING DESIGN
Enrollment Drivers Financial Drivers

COLLEGE OFARTS & SCIENCES--------------------------------------------• WOMEN’S COLLEGE• WEEKDAY/FULL-TIME• LIBERAL ARTS • BACCALAUREATE•ATHLETICS •CO-CURRICULAR LEARNING PROGRAMS
SCHOOL OFEDUCATION-------------------------------------------------•TEACHER PREP, SCHOOL ADMIN AND COUNSELING PROGRAMS•COEDUCATIONAL•EVENING AND WEEKEND•POSTGRADUATE PROFESSIONAL DEVELOPMENT PROGRAMS
SCHOOL OF PROFESSIONALSTUDIES -----------------------------------•PROFESSIONAL PROGRAMS FOR WORKING STUDENTS•COEDUCATIONAL•EVENING AND WEEKEND•ON AND OFF-SITE•ONLINE AND CLASSROOM
SCHOOL OF NURSING AND HEALTH PROFESSIONS________________________
•COED
•NURSING BAC + MASTERS
•OT, PT, OTHER
TRINITY STRATEGIC PARADIGM 2010 EACH POINT OF INTERSECTION ON THE VENN DIAGRAM SIGNIFIES A CROSS-UNIT POINT OF COLLABORATION

0
500
1000
1500
2000
2500
3000
19001901190219031914191719191920195119521953195419551956195719581959196019611962196319641965196619671968196919701971197219731974197519761977197819791980198119821983198419851986198719881989199019911992199319941995199619971998199920002001200220032004200520062007200820092010201120122013
CAS NHP EDU SPS NHP TOL
TRINITY HISTORIC ENROLLMENT (FALL HEADCOUNTS) 1900-2009
810
333
887
550
850
1000
300
300
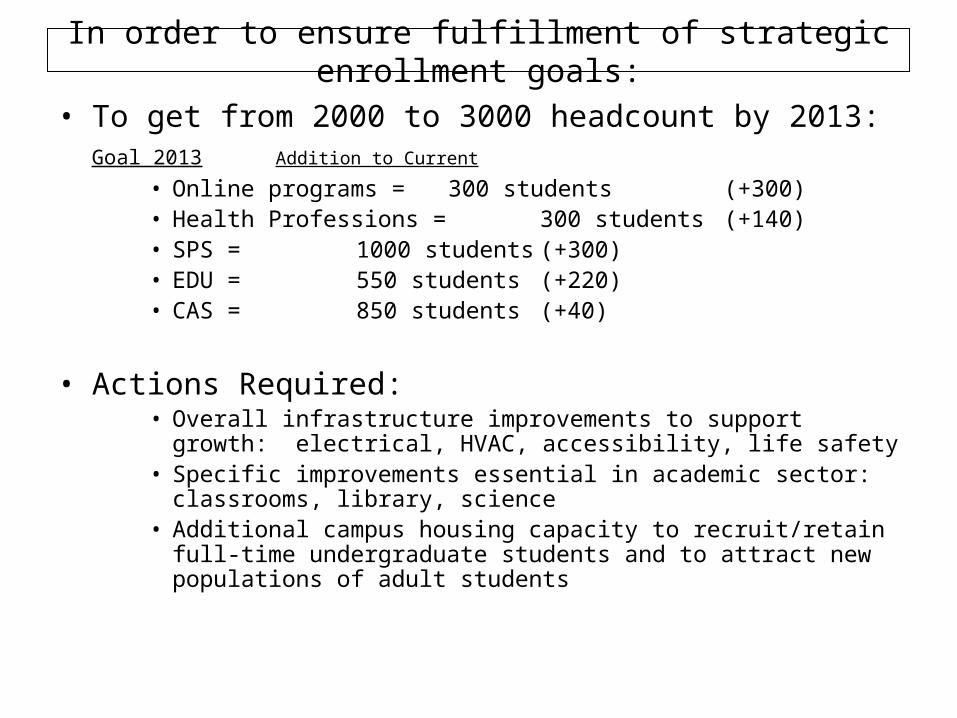
In order to ensure fulfillment of strategic enrollment goals:
• To get from 2000 to 3000 headcount by 2013:Goal 2013 Addition to
Current
• Online programs = 300 students (+300)• Health Professions = 300 students (+140)• SPS = 1000 students (+300)• EDU = 550 students (+220)• CAS = 850 students (+40)
• Actions Required:• Overall infrastructure improvements to support growth: electrical,
HVAC, accessibility, life safety• Specific improvements essential in academic sector: classrooms,
library, science• Additional campus housing capacity to recruit/retain full-time
undergraduate students and to attract new populations of adult students

Priorities for 2010
A. Buildings and Campaign1. Concept Design for the Academic Center2. Renovations of Main Hall3. New Campus Housing4. Notre Dame Chapel
5. Prepare/Launch $30 Million Campaign6. Continued Focus on Managing to Improve Debt
Capacity
Note: these concepts include the interface of goals for technology and human resources as well as enrollment
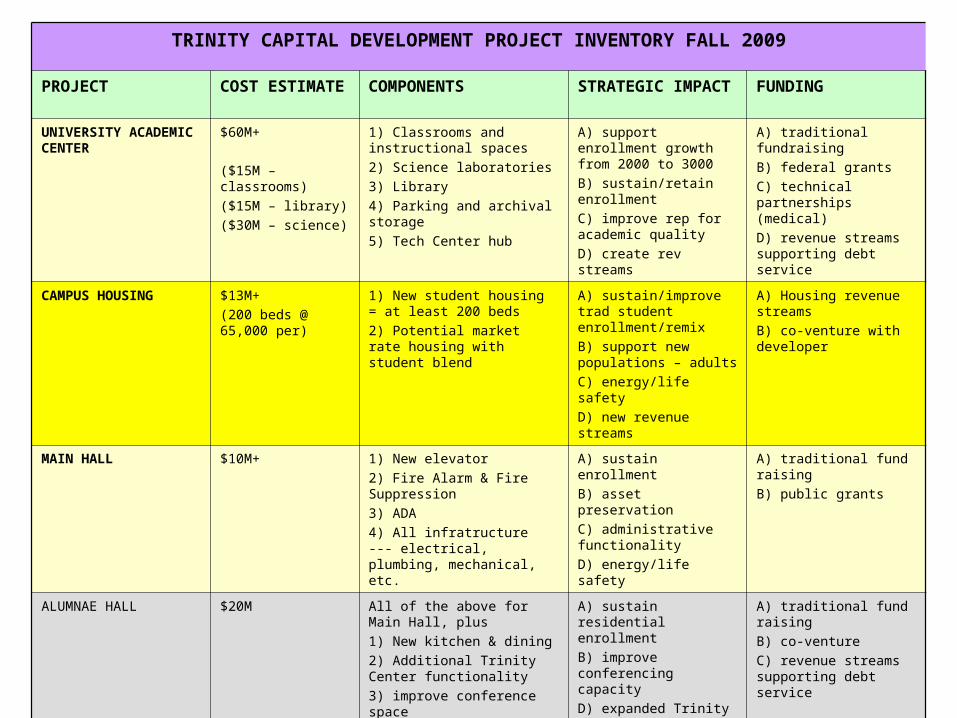
TRINITY CAPITAL DEVELOPMENT PROJECT INVENTORY FALL 2009
PROJECT COST ESTIMATE COMPONENTS STRATEGIC IMPACT FUNDING
UNIVERSITY ACADEMIC CENTER
$60M+
($15M – classrooms)
($15M – library)
($30M – science)
1) Classrooms and instructional spaces
2) Science laboratories
3) Library
4) Parking and archival storage
5) Tech Center hub
A) support enrollment growth from 2000 to 3000
B) sustain/retain enrollment
C) improve rep for academic quality
D) create rev streams
A) traditional fundraising
B) federal grants
C) technical partnerships (medical)
D) revenue streams supporting debt service
CAMPUS HOUSING $13M+
(200 beds @ 65,000 per)
1) New student housing = at least 200 beds
2) Potential market rate housing with student blend
A) sustain/improve trad student enrollment/remix
B) support new populations – adults
C) energy/life safety
D) new revenue streams
A) Housing revenue streams
B) co-venture with developer
MAIN HALL $10M+ 1) New elevator
2) Fire Alarm & Fire Suppression
3) ADA
4) All infratructure --- electrical, plumbing, mechanical, etc.
A) sustain enrollment
B) asset preservation
C) administrative functionality
D) energy/life safety
A) traditional fund raising
B) public grants
ALUMNAE HALL $20M All of the above for Main Hall, plus
1) New kitchen & dining
2) Additional Trinity Center functionality
3) improve conference space
A) sustain residential enrollment
B) improve conferencing capacity
D) expanded Trinity Center capacity
A) traditional fund raising
B) co-venture
C) revenue streams supporting debt service
NOTRE DAME CHAPEL $5M+ More than you want to know… Asset preservation Goubeau Trust says its assets cannot sustain this project. Need to investigate alternative sources.

Priorities for 2010
B. Academic Programs1. Launch NHP with Dean & Plan
A) Create/Launch Allied Health Programs
2. Launch TrinityOnline3. Build Programs/Services in SPS
A) Graduate Programs – MBA, MSA, etc.B) Reform of UG CoreC) Social Work, Intelligence Studies, CommunicationD) THEARC and expansion of AA studies
4. Rethink Teacher Education in EDU5. Enlarge CAS Gen Ed/Program Reviews
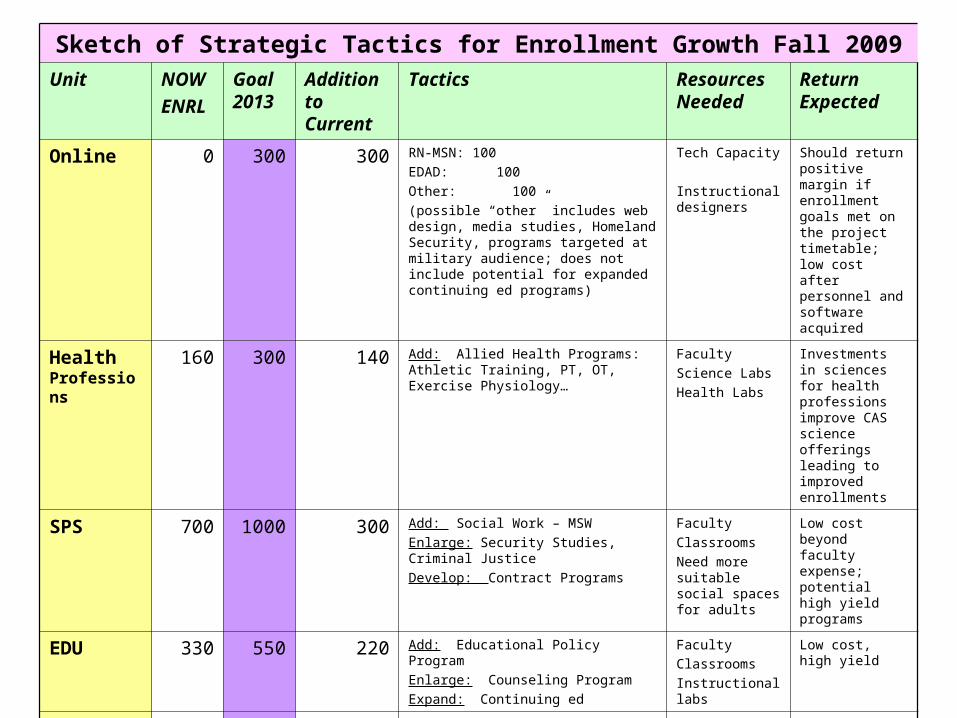
Sketch of Strategic Tactics for Enrollment Growth Fall 2009Unit NOW
ENRL
Goal 2013
Addition to Current
Tactics Resources Needed
Return Expected
Online 0 300 300 RN-MSN: 100
EDAD: 100
Other: 100
(possible “other” includes web design, media studies, Homeland Security, programs targeted at military audience; does not include potential for expanded continuing ed programs)
Tech Capacity
Instructional designers
Should return positive margin if enrollment goals met on the project timetable; low cost after personnel and software acquired
Health Professions
160 300 140 Add: Allied Health Programs: Athletic Training, PT, OT, Exercise Physiology…
Faculty
Science Labs
Health Labs
Investments in sciences for health professions improve CAS science offerings leading to improved enrollments
SPS 700 1000 300 Add: Social Work – MSW
Enlarge: Security Studies, Criminal Justice
Develop: Contract Programs
Faculty
Classrooms
Need more suitable social spaces for adults
Low cost beyond faculty expense; potential high yield programs
EDU 330 550 220 Add: Educational Policy Program
Enlarge: Counseling Program
Expand: Continuing ed
Faculty
Classrooms
Instructional labs
Low cost, high yield
CAS 810 850 40 Add: Housing Capacity
Enlarge: Criminal Justice, Psych
Strengthen: Sciences
Res Halls
Labs
Classrooms
Social spaces
FT students= greatest yield Retention key to sustaining goals

Priorities for 2010
C. Accreditation
1. Middle States Periodic Review Report
2. EDU NCATE Report and SPA reports
3. CCNE Report

MSA: FINANCE report underway in annual strategic ratio analysis and updatesMSA: FINANCE report underway in annual strategic ratio analysis and updates
NCATE Visit MAR/April 2011NCATE Visit MAR/April 2011
MSA: DEC 2010 TO APRIL 2010 SECOND DRAFT AND FINALIZE PRR
MSA: DEC 2010 TO APRIL 2010 SECOND DRAFT AND FINALIZE PRR
MSA: DEC 2010 ongoing… finalize Program Review and Student outcomes drafts….
MSA: DEC 2010 ongoing… finalize Program Review and Student outcomes drafts….
MSA: Summer 2010 draft Faculty portion of MSA PRRMSA: Summer 2010 draft Faculty portion of MSA PRR
NCATE: SELF-STUDY REPORT PREP – BY SEPTEMBER 2010NCATE: SELF-STUDY REPORT PREP – BY SEPTEMBER 2010
MSA: BY END OF SP 2010 GEN ED REVIEW DONE START WRITING CHAPTER
MSA: BY END OF SP 2010 GEN ED REVIEW DONE START WRITING CHAPTER
MSA: Spring 2010 start drafting reports on Program Reviews, Student Outcomes…
MSA: Spring 2010 start drafting reports on Program Reviews, Student Outcomes…
MSA: Faculty Handbook Revisions and Faculty Assessment Reformed and UnderwayMSA: Faculty Handbook Revisions and Faculty Assessment Reformed and Underway
MSA: GEN ED ASSESSMENTS UNDERWAYMSA: GEN ED ASSESSMENTS UNDERWAY
NCATE: PREPARATION OF 8 SPA REPORTS DUE BY FEBRUARY 1, 2010NCATE: PREPARATION OF 8 SPA REPORTS DUE BY FEBRUARY 1, 2010
Overview: Accreditation TimetableOverview: Accreditation Timetable
Fall 2009 Spring 2010 Summer 2010 Fall 2010 Spring 2011 Fall 2011Fall 2009 Spring 2010 Summer 2010 Fall 2010 Spring 2011 Fall 2011
Middle StatesPeriodic Review
Report DueJune 1, 2011
Middle StatesPeriodic Review
Report DueJune 1, 2011
MSA: PROGRAM REVIEWS ON A NEW SCHEDULE AND UNDERWAY
MSA: PROGRAM REVIEWS ON A NEW SCHEDULE AND UNDERWAY
CCNECCNE
MSA: Review Annual Management Plans and Begin Data Collection for Assessments in SP2010
MSA: Review Annual Management Plans and Begin Data Collection for Assessments in SP2010
MSA: BY END OF SP 2010 SECOND ROUND OF MANAGEMENT REPORTS
MSA: BY END OF SP 2010 SECOND ROUND OF MANAGEMENT REPORTS
MSA: SUMMER 2010 TO DECEMBER 2010 – FIRST DRAFT MATERIALS FOR PRR
MSA: SUMMER 2010 TO DECEMBER 2010 – FIRST DRAFT MATERIALS FOR PRR

BENCHMARKS
This material is provided for information purposes only for Trustees. We will not discuss this specifically at this board meeting, but all are welcome to request additional background on this data or other data sets. We will provide
dashboard updates at the next board meeting.

Classroom Usage and Courses Fall 2009

FALL 09 CLASSROOMS ACTUAL ENROLLED ALL CLASSES
671 649
579 559
514 496
496 463 430
424 408 397
339
339 326 308
268 242
237
232 213
207
207 174 144 116 98
47 43 41 32 27 18 17 16
0
50100
150200
250
300350
400450
500
550600
650700
750
M234
M230
M240
M236
SC
I114
M232
SC
I111
LSE
M
MB
4
MU
101
M260
M259
M235
SC
I313
MU
200
SC
I214
SC
I204
M238
M251
LET
L
M242
LAU
D
M252
M244
M246
M248
SC
I213
SC
I310
TC
TR
MU
203
SC
I212
SC
I205
CP
UB
SC
I110
SC
I304

FALL 09 CLASSROOM ENROLLMENTS BY DAYS AND TIMES
0
50
100
150
200
250
300
350
400
450
500
M9
00
M1
03
0M
12
00
M1
30
M6
30
T9
00
T1
03
0T
12
00
T1
30
T3
00
T4
30
T6
30
T7
10
W9
00
W1
03
0W
12
00
W1
30
W4
30
W6
30
W7
10
TH
90
0T
H1
03
0T
H1
20
0T
H1
30
TH
30
0T
H4
30
TH
63
0T
H7
00
F9
00
F1
00
0F
10
30
F1
10
0F
12
00
F1
00
F5
00
F6
30
S9
00
S1
20
0S
13
0S
43
0
CAS
SPS
EDU
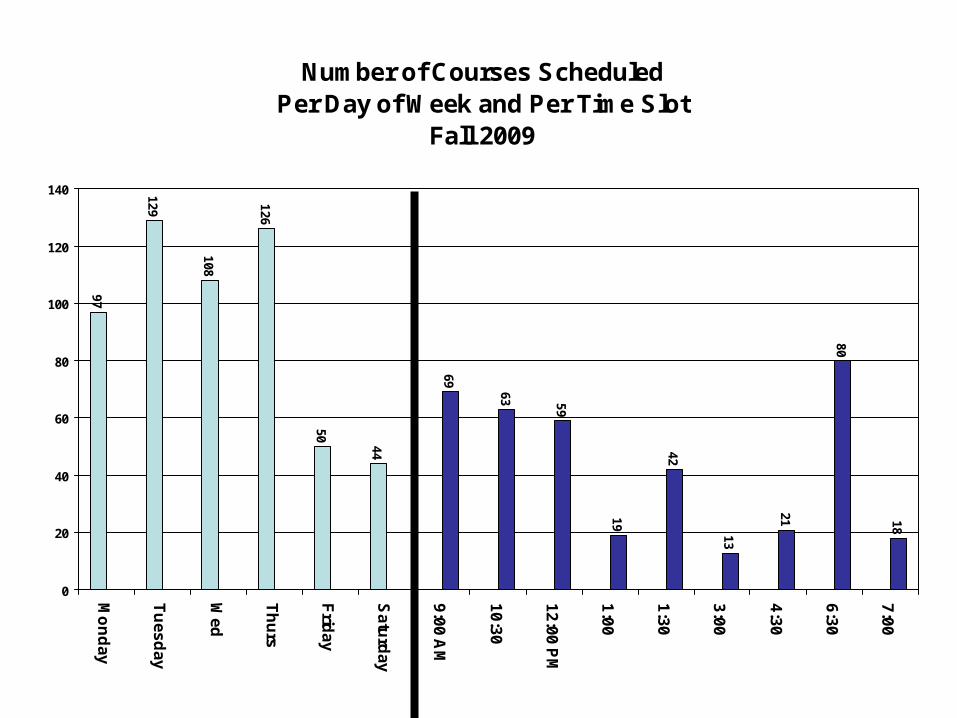
Number of Courses Scheduled Per Day of Week and Per Time Slot
Fall 2009
97
129
108
126
50
44
69
63 59
19
42
13
21
80
18
0
20
40
60
80
100
120
140
Mo
nd
ay
Tu
es
da
y
We
d
Th
urs
Frid
ay
Sa
turd
ay
9:0
0 A
M
10
:30
12
:00
PM
1:0
0
1:3
0
3:0
0
4:3
0
6:3
0
7:0
0
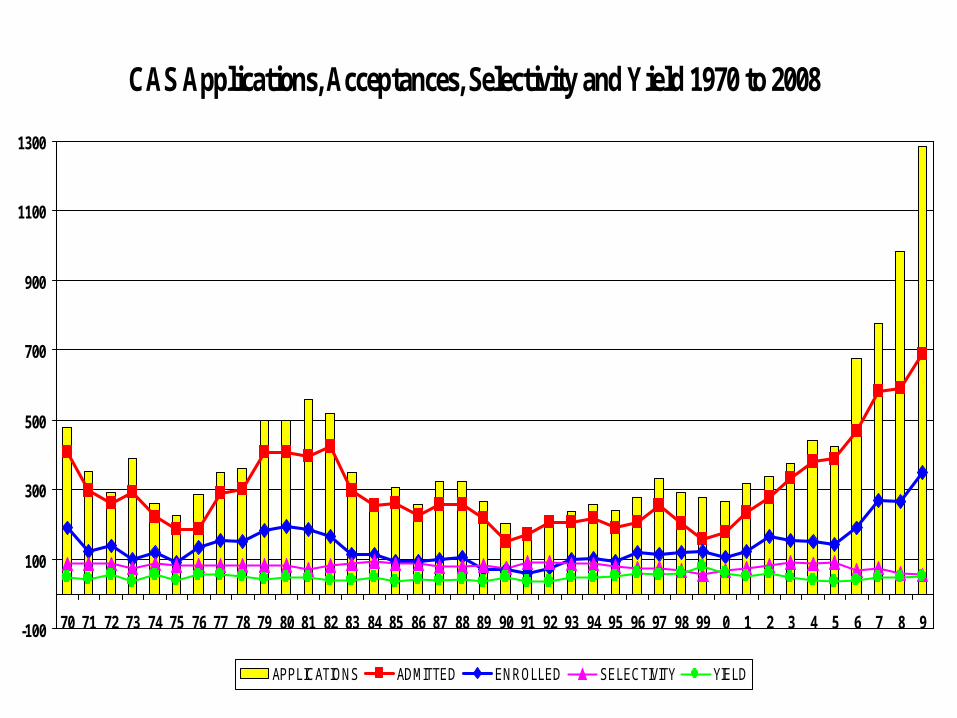
CAS Applications, Acceptances, Selectivity and Yield 1970 to 2008
-100
100
300
500
700
900
1100
1300
70 71 72 73 74 75 76 77 78 79 80 81 82 83 84 85 86 87 88 89 90 91 92 93 94 95 96 97 98 99 0 1 2 3 4 5 6 7 8 9
APPLICATIONS ADMITTED ENROLLED SELECTIVITY YIELD

RETENTION BY SEMESTER SINCE FALL 06
76%78% 80% 78%
88% 91%87% 88%80%75%80% 85%
78%80%85% 84%92%80%77%88%82%77%
87% 80% 88% 86% 86%82% 81% 85% 83% 82%
0%
10%
20%
30%
40%
50%
60%
70%
80%
90%
100%
CAS SPS UG SPS GR EDU OVERALL
PERC
ENT
RETA
INED
FALL 06 SPRING 07 FALL 07 SPRING 08 FALL 08 SPRING 09 FALL 09
SPRING TO FALL RETENTION RATES________________________________________________________________________________
FALL TO SPRING

SPRING-TO-FALL RETENTION SINCE FALL 06
76%78%
80%
78%
80%
75%
80%
85%
80%
77%
88%
82%
78%
82%81%
85%
83% 82%
65%
70%
75%
80%
85%
90%
CAS SPS UG SPS GR EDU OVERALL
PERC
ENT
RETA
INED
FALL 06 FALL 07 FALL 08 FALL 09
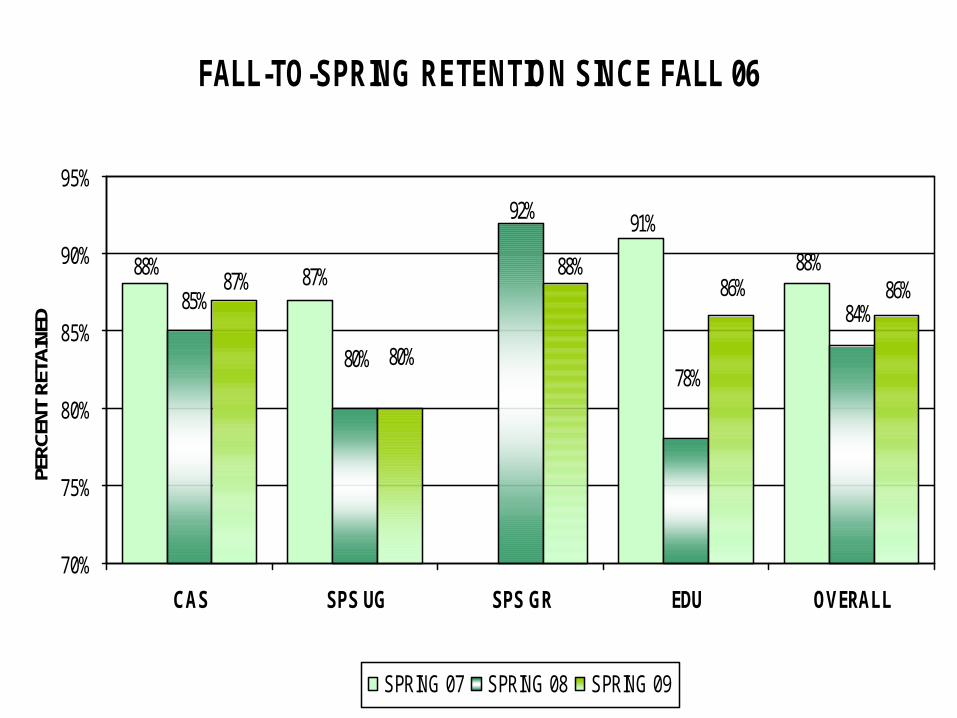
FALL-TO-SPRING RETENTION SINCE FALL 06
88%
91%
87%88%
78%80%
85% 84%
92%
87%
80%
88%86% 86%
70%
75%
80%
85%
90%
95%
CAS SPS UG SPS GR EDU OVERALL
PERC
ENT
RETA
INED
SPRING 07 SPRING 08 SPRING 09
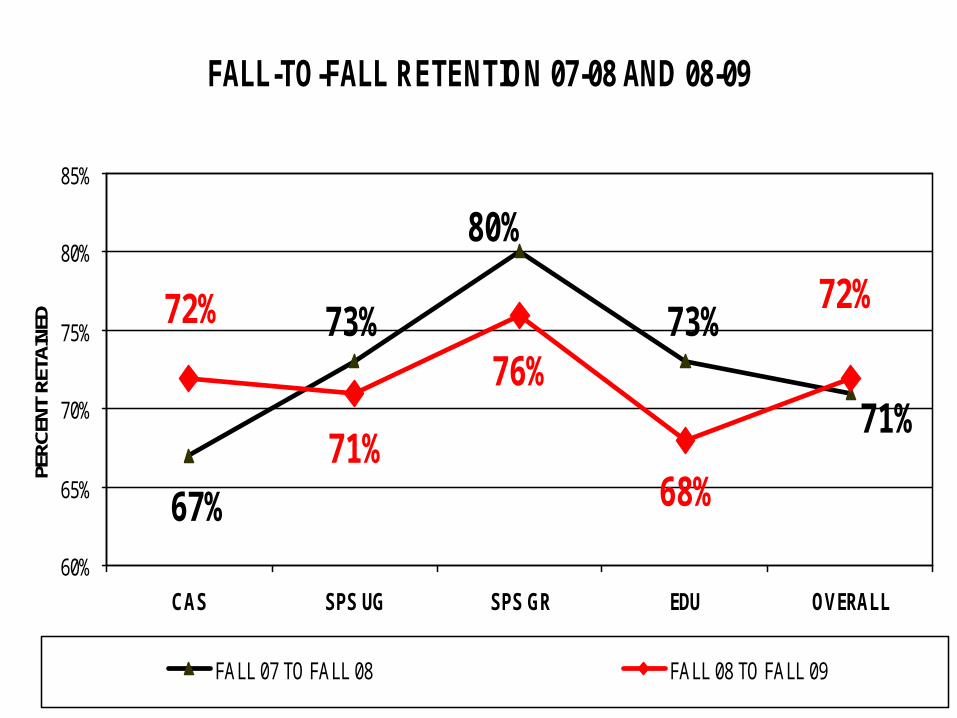
FALL-TO-FALL RETENTION 07-08 AND 08-09
67%
73%
80%
73%
71%
72%
71%
76%
68%
72%
60%
65%
70%
75%
80%
85%
CAS SPS UG SPS GR EDU OVERALL
PERC
ENT
RETA
INED
FALL 07 TO FALL 08 FALL 08 TO FALL 09
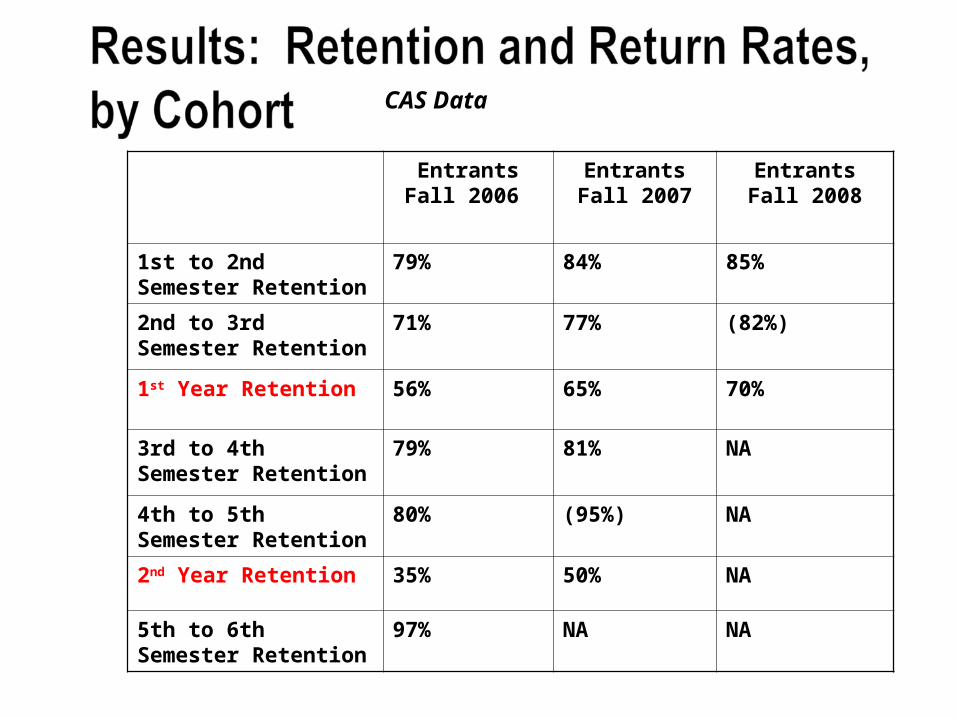
Entrants Fall 2006 Entrants Fall 2007
Entrants Fall 2008
1st to 2nd Semester Retention
79% 84% 85%
2nd to 3rd Semester Retention
71% 77% (82%)
1st Year Retention 56% 65% 70%
3rd to 4th Semester Retention
79% 81% NA
4th to 5th Semester Retention
80% (95%) NA
2nd Year Retention 35% 50% NA
5th to 6th Semester Retention
97% NA NA
CAS Data

Summary of Fall 2009 Workload
• 56 Full-time Faculty and Staff Teaching 3507 enrollments = 62 average student load (includes overloads)
• 51 Full-Time Faculty Teaching 2828 regular enrollments = 55 average student load before overloads
• 132 Adjuncts Teaching 3528 enrollments = 27 avg student load (includes multiple courses)

0
10
20
30
40
50
60
70
80
90
100
110
120
dasher
sarah
daffy
super
delta
comet
eloi
blitzen
popeye
barney
olive
lois
pluto
merry
sleepy
lane
beta
kent
bullwinkle
mickey
prancer
clark
dopey
george
obama
reed
flintstone
doc
bugs
jetsons
happy
esther
donna
psi
cupid
donner
spidey
alpha
fred
sigma
vixen
betty
rockey
theta
bashful
sonia
omega
minnie
merm
an
elroy
dancer
regular overload
AVG REGULAR STUDENT LOAD = 55
Full-Time Faculty Student Loads Showing Regular Loads and Overloads Fall 2009
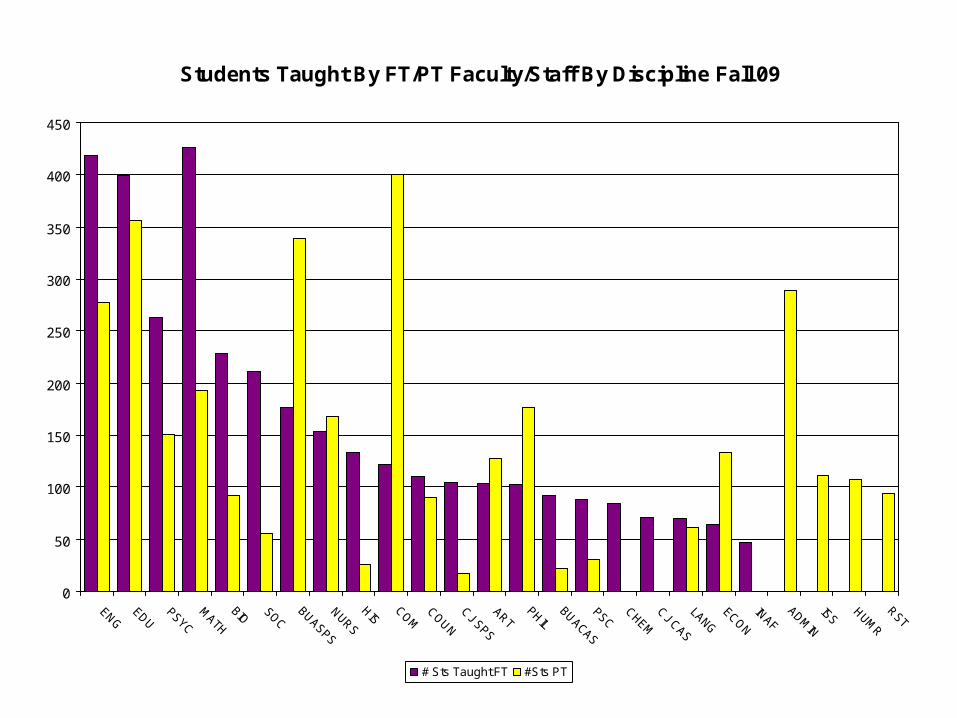
Students Taught By FT/PT Faculty/Staff By Discipline Fall 09
0
50
100
150
200
250
300
350
400
450
ENGEDU
PSYC
MATH
BIOSOC
BUASPS
NURS
HISCOM
COUN
CJ SPS
ARTPHIL
BUACAS
PSCCHEM
CJ CAS
LANGECON
INAFADM
IN
ISSHUM
R
RST
# Sts Taught FT #Sts PT