
Presenting data to growers
32
Presenting Data to Growers Dave Franzen NDSU Extension Soil Specialist, Fargo
Transcript of Presenting data to growers

Presenting Data to Growers
Dave Franzen
NDSU Extension Soil Specialist, Fargo

Our Purpose-
Conduct applied research relevant to grower needs and present results in an understandable manner.
When a need for change is evident, present results in a transformational manner.


Presentation of data is strongest whenstrong data has been generated.

Nitrogen rate example-
Mission is to see if N rate affects soybean yield-

Nitrogen rate example-
Mission is to see if N rate affects soybean yield-
Site locations must be low in residual N.
-If sites are high in residual N, it would be better not to conduct the study.

Weed control example-
Glyphosate control of lambsquarter.
-Site should be screened a year ahead for lambsquarter pressure. If pressure is low, look for another site.

Number of sites should be related to impact of the study-
Demonstration on spray drift effects- one or two sites probably enough.
Review P recommendations for corn- need many sites over several years.

Make sure that all relevant background data is taken-
If conducting an N trial and you have a low response to N even though residual N to 2 feet is low, taking soil samples to 4 feet to discover previously unseen deep N would be a good practice.

So, You have good data You have lots of good data You are really excited about this data
How should you present it?

First- Remember the objectives of the study and relate the data to the objectives.
Example- Objective- determine what effect different levels of field pea in beef cattle rations have on daily gain.
Data should clearly emphasize these effects. Any other data should be minimized, or not presented.
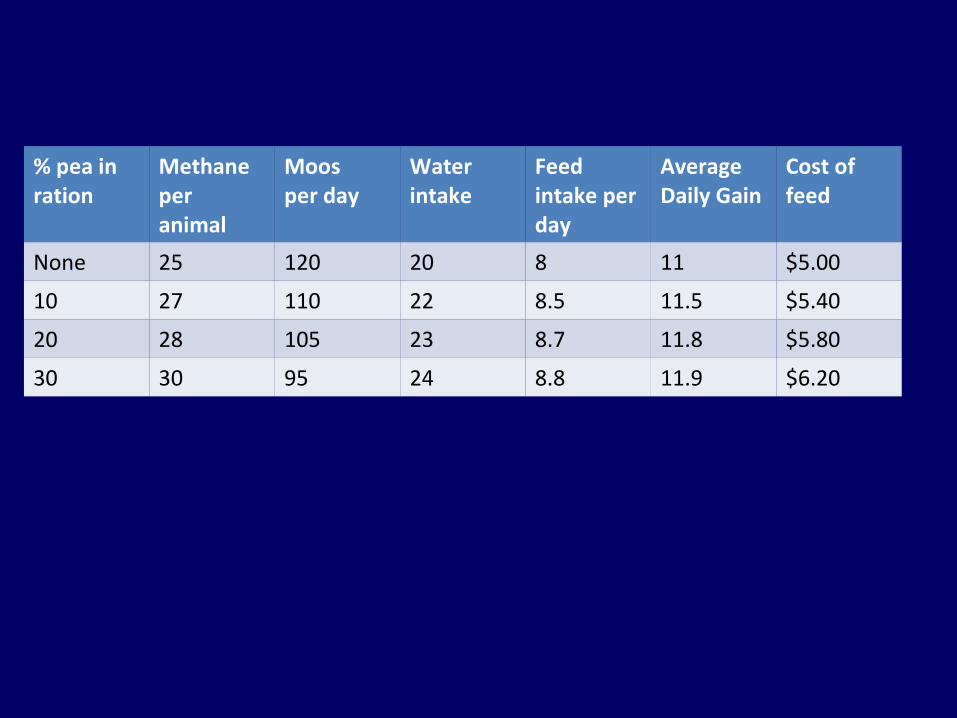
% pea in ration
Methane per animal
Moos per day
Water intake
Feed intake per day
AverageDaily Gain
Cost of feed
None 25 120 20 8 11 $5.00
10 27 110 22 8.5 11.5 $5.40
20 28 105 23 8.7 11.8 $5.80
30 30 95 24 8.8 11.9 $6.20

% pea in ration
Methane per animal
Moos per day
Water intake
Feed intake per day
AverageDaily Gain
Cost of feed
None 25 100 20 8 11 $5.00
10 27 110 22 8.5 11.5 $5.40
20 28 105 19 8.7 11.8 $5.80
30 30 95 23 8.8 11.9 $6.20
The data you present should be relevant to your audience
EPA?Water commission?Economic Analysis?Animal psychologist?

Your killer slide to growers should be-
% Pea In ration Average Daily GainNone 11.010 11.520 11.730 11.8

Treatment
Plant N5-leaf%
100 kernel weight
Plants/m2
Test weight
Moisture at harvest
Cob weight/20 plants
Yield,Bu/acre
Check 3.5 100 g 10 56 18 1.2 110
50 lb N 4.0 102 g 10.5 56.5 17 1.5 140
100 lb N 4.5 101 g 9.8 56.2 16 1.4 180

Treatment, N rate, lb/acre
Yield, bu/acre
Check 110
50 140
100 180


Most grower do not understand statistics (Figures lie, liars figure).They will not believe these differences are not real. Better to state-

There were no differences between the performance of products A, B and C on crop yield.
The average yield for the treatments was about 90 bu/acre.

These differences are insignificant. What should we say?

Displaying the data in this manner makes it easier to make a non-significant difference point. Don’t fall into the trap of saying “there appears to be a trend’..

13
13.5
14
14.5
15
untreated check
10 gal UAN 12 gal Coron 2 gal Coron
Irr Faller
Lebsock
average
2009 Carrington, ave. 2 sites, post-anthesis application for protein enhancement. Schatz
Faller yields over 100 bu/acre Slide courtesy of Greg Endres

Do not underestimate the power of the computer screen.

1
2

3
4
5
6
7
8

Don’t be embarrassed about success.
Celebrate it and challenge growers with it-

Spring wheat yields with N rate, Fortuna, 2009
N rate, lb/a Yield, bu/a0 6050 80100 102
Be excited about the yields, not apologetic!!!! Challenge growers to do better!

Summary-
-Do your homework and set up relevant experiments-Generate appropriate amounts of meaningful data-Display only the data the audience has the greatest interest in-Use charts and figures to illustrate trends if data are many-Use statistics as your bedrock and don’t disregard them when it’s inconvenient

Summary-
-Challenge growers and don’t be apologetic if your yields are greater than theirs.