
Presented to Maine Department of Transportation August 15 2005 John Dorrer, Director Labor Market...
25
Presented to Presented to Maine Department of Transportation Maine Department of Transportation August 15 2005 August 15 2005 John Dorrer, Director John Dorrer, Director Labor Market Information Services Labor Market Information Services Maine Department of Labor Maine Department of Labor [email protected] [email protected] 207-287-2271 207-287-2271 Maine Workforce Maine Workforce Challenges: Challenges: Demographic Trends Demographic Trends and Finding Skilled and Finding Skilled Workers Workers
-
Upload
jack-james -
Category
Documents
-
view
217 -
download
2
Transcript of Presented to Maine Department of Transportation August 15 2005 John Dorrer, Director Labor Market...

Presented toPresented to
Maine Department of Transportation Maine Department of Transportation August 15 2005August 15 2005
John Dorrer, Director John Dorrer, Director
Labor Market Information ServicesLabor Market Information Services
Maine Department of LaborMaine Department of Labor
[email protected]@Maine.Gov
207-287-2271207-287-2271
Maine Workforce Maine Workforce Challenges: Challenges: Demographic Trends Demographic Trends and Finding Skilled and Finding Skilled WorkersWorkers

Maine Economy
Demographics
Foreign Competition Technology
Values

Workforce DynamicsWorkforce Dynamics
Stocks and Flows Stocks and Flows
New Grads Maine’s Workforce
Foreign Immigrants
Domestic In-migrants
Disabled Populations
Dropouts
Emerging Workers Established Workers Senior Workers
Low Wage Workers
Senior Workers

If you want one year of prosperity, grow grain. If you want ten years of prosperity, grow trees. If you want a 100 years of prosperity, grow people
Old Chinese Proverb

Maine Workforce Maine Workforce DemographicsDemographics
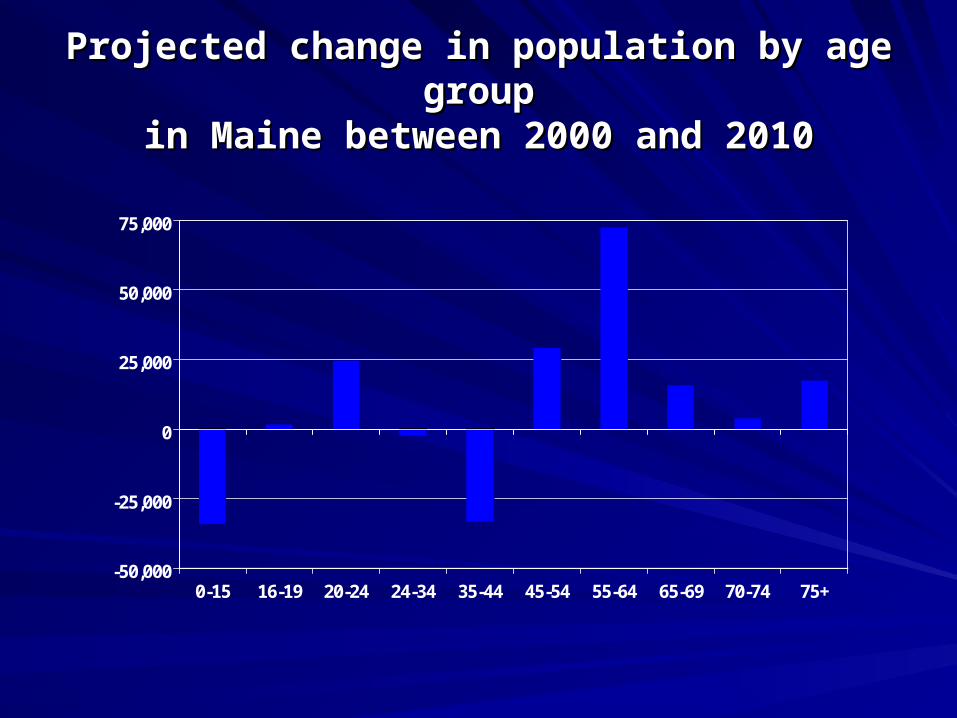
Projected change in population by age groupProjected change in population by age groupin Maine between 2000 and 2010in Maine between 2000 and 2010
-50,000
-25,000
0
25,000
50,000
75,000
0-15 16-19 20-24 24-34 35-44 45-54 55-64 65-69 70-74 75+

Average annual civilian labor force growthAverage annual civilian labor force growthin Maine by decade with 2000 to 2010 forecastin Maine by decade with 2000 to 2010 forecast
0.0%
0.5%
1.0%
1.5%
2.0%
2.5%
1970-80 1980-90 1990-00 2000-10

Maine’s Senior Workforce: The Maine’s Senior Workforce: The NumbersNumbers
(000)(000)
Age Cohort Age Cohort 20002000 20102010
M F TM F T M F M F TT
55-64 55-64 40 37 77 66 60 40 37 77 66 60 126 126
65+ 13 10 23 17 12 2965+ 13 10 23 17 12 29
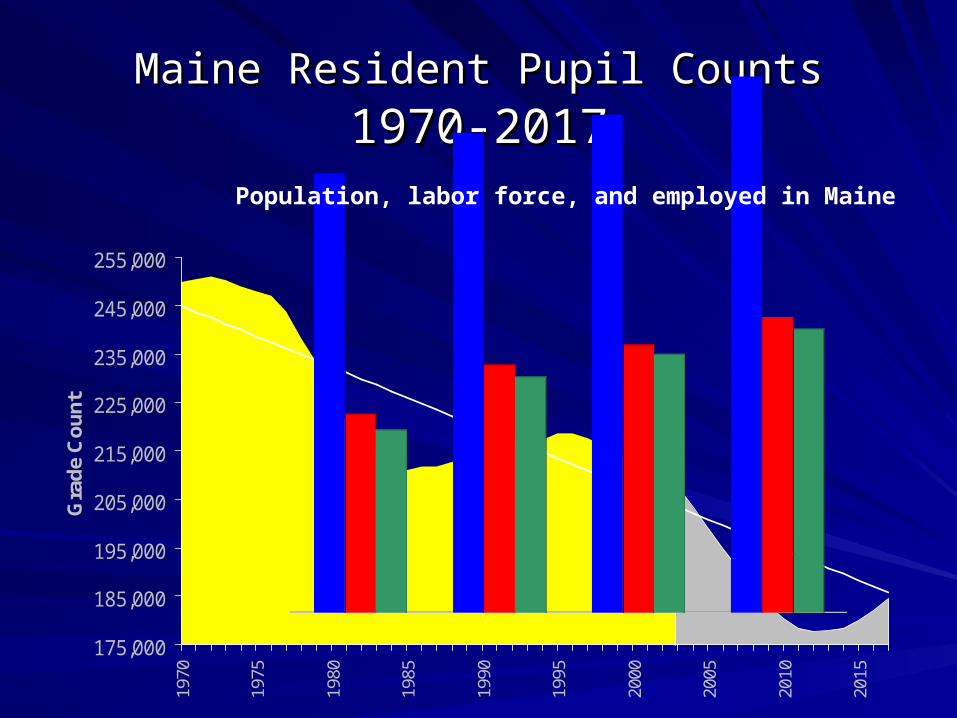
Maine Resident Pupil CountsMaine Resident Pupil Counts 1970-20171970-2017
175,000
185,000
195,000
205,000
215,000
225,000
235,000
245,000
255,000
1970
1975
1980
1985
1990
1995
2000
2005
2010
2015
Gra
de
Co
un
t
Population, labor force, and employed in Maine

Age
14-18 19-21 22-24 25-34 35-44 45-54 55-64 65-99
Female 0.7 % 1.4 % 2.8 % 12.2 % 15.1 % 13.4 % 6.3 % 1.2 %
Male 0.4 % 0.9 % 1.9 % 10.5 % 12.4 % 11.5 % 7.1 % 1.4 %
Professional, Scientific and Technical Services
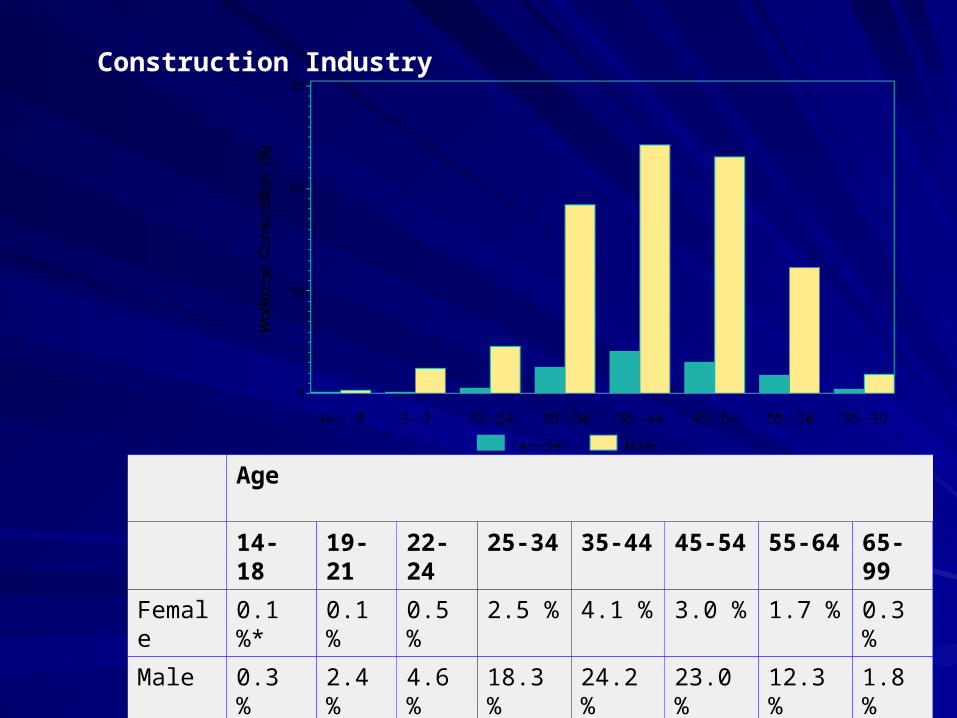
Age
14-18 19-21 22-24 25-34 35-44 45-54 55-64 65-99
Female 0.2 % 0.6 % 0.8 % 4.0 % 7.4 % 7.8 % 3.9 % 0.6 %
Male 0.4 % 1.7 % 2.7 % 12.4 % 21.8 % 22.8 % 10.8 % 1.2 %
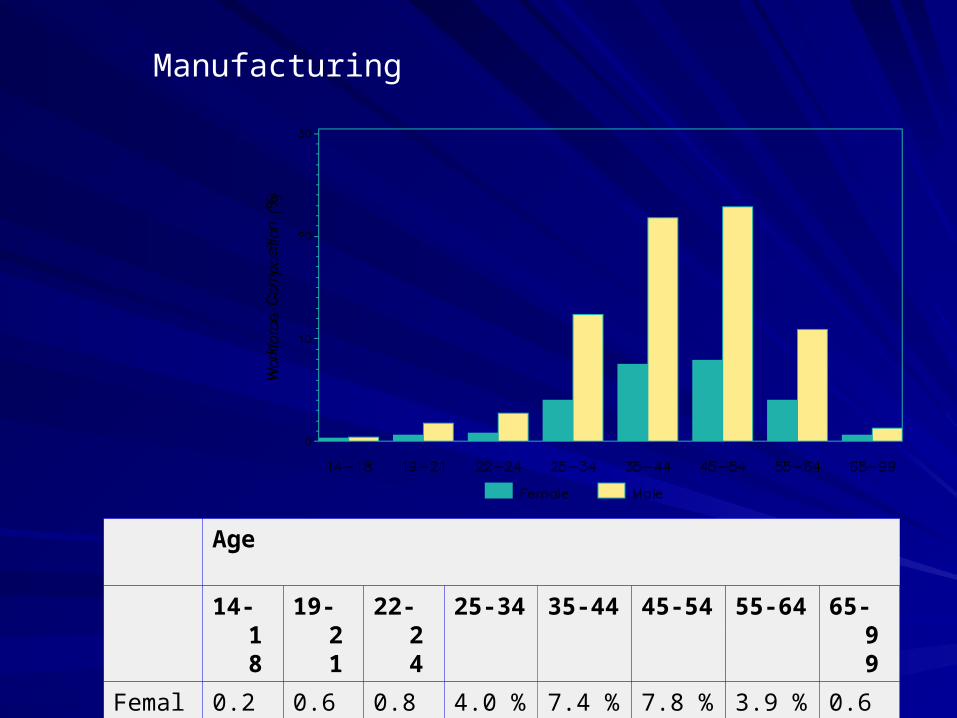
Manufacturing
Age
14-18 19-21 22-24 25-34 35-44 45-54 55-64 65-99
Female 0.1 %* 0.1 % 0.5 % 2.5 % 4.1 % 3.0 % 1.7 % 0.3 %
Male 0.3 % 2.4 % 4.6 % 18.3 % 24.2 % 23.0 % 12.3 % 1.8 %
*=Value significantly distorted to protect confidentiality
Construction Industry

Emerging Labor Force: Maine vs. U.SEmerging Labor Force: Maine vs. U.S..
Population Change 1990-2000Population Change 1990-2000% Persons under 5 years old % Persons under 5 years old % Persons 65+ years % Persons 65+ years % White% White% Black or African-American % Black or African-American % Asian % Asian % Latino or Hispanic Origin % Latino or Hispanic Origin % Foreign Born% Foreign Born% persons 18-64 with % persons 18-64 with Disability who are employed Disability who are employed (2002)(2002)
MaineMaine U.SU.S3.83.8 13.113.15.55.5 6.8 6.8
14.414.4 12.412.496.996.9 75.175.10.50.5 12.312.30.70.7 3.6 3.60.70.7 12.512.52.92.9 11.111.1
33.0 30.033.0 30.0

Emerging Labor Force: Risk Emerging Labor Force: Risk Factors 2004Factors 2004
% Teens (16-19) High School % Teens (16-19) High School DropoutsDropouts
% Teens (16-19) not in school % Teens (16-19) not in school
and not workingand not working % Children Living in Families % Children Living in Families where no parent has full time where no parent has full time
year round employmentyear round employment % Children in Poverty% Children in Poverty
% Young Adults (18-24) % Young Adults (18-24)
Disconnected* 2002Disconnected* 2002 * * Persons 18-24 not in school, are not Persons 18-24 not in school, are not
working and have no degree beyond working and have no degree beyond HSHS
Maine U.SMaine U.S 12 9 12 9
8 88 8
27 2527 25 13 1613 16
18 1518 15
Source: Maine Kids Count 2004Source: Maine Kids Count 2004

Table 1: In-Migration and Out-Migration in Northern Maine
and Southern Maine from 1995- 2000, Total and Among 18-24 Years Old
Age Group In-MigrationOut-
Migration Balance
All 5+
Maine 110,732 107,440 +3,292
Northern Maine 24,571 83,707 -59,136
Southern Maine 86,161 23,733 +62,428
18-24 Years Old
Maine 16,814 25,733 -8,919
Northern Maine 3,895 19,881 -15,986
Southern Maine 12,919 5,852 +7,067
Source: Public Use Micro Files (PUMS), 5%, Census 2000, U.S. Census Bureau, tabulations by Center for Labor Market Studies.

Maine Workforce Skills Maine Workforce Skills Requirements Requirements

Gross Product per Maine Manufacturing Gross Product per Maine Manufacturing Job Job
(Adjusted for Inflation)(Adjusted for Inflation)
1980 = $30,0001980 = $30,000
2000 = $60,0002000 = $60,000


MaineOccupationsMaineOccupations ForecastForecast
Top TenTop Ten2002-20122002-2012
Fastest Projected Rate of Job GrowthFastest Projected Rate of Job Growth
+Medical Assistants
+Social and Human Services Assistant
+Self-Enrichment Education Teachers
+Physician Assistants
+Medical Records and Health Information Techs.
+Personal and Home Care Aides
+Personal Financial Advisors
+Physical Therapy Assistants
+Massage Therapists
+Veterinary Technologists and Techs.

MaineOccupationsMaineOccupations ForecastForecast
Top TenTop Ten2002-20122002-2012
Jobs with the Most OpeningsJobs with the Most Openings+Cashiers +Cashiers +Retail Sales Persons+Retail Sales Persons+Food Prep and Service Workers+Food Prep and Service Workers+Waitpersons +Waitpersons +Registered Nurse+Registered Nurse+General and Operations Managers+General and Operations Managers+Home Care Aids+Home Care Aids+Food Preparation Workers+Food Preparation Workers+Janitors and Cleaners +Janitors and Cleaners +First Line Supervisors/Managers of Retail Sales Workers +First Line Supervisors/Managers of Retail Sales Workers

MaineOccupationsMaineOccupations ForecastForecast
Top TenTop Ten2002-20122002-2012
Occupations with the largest Employment Requiring a Occupations with the largest Employment Requiring a Bachelors Degree Bachelors Degree
General ManagersGeneral ManagersSecondary TeachersSecondary TeachersElementary TeachersElementary TeachersMiddle School Teachers Middle School Teachers Accountants and Auditors Accountants and Auditors LawyersLawyersFinancial ManagersFinancial ManagersSocial Workers Social Workers Insurance AgentsInsurance Agents

Employment Outlook U.S.Employment Outlook U.S.Highway Street and Bridge Highway Street and Bridge
ConstructionConstruction
2002 2012 Pct Change
344,400 363,800 5.0

Maine Employment TrendsMaine Employment TrendsHeavy and Civil Engineering Heavy and Civil Engineering
ConstructionConstruction1994-20041994-2004
1994 2004 Pct Change
3,300 3,700 12.0

Occupational Employment Outlook Occupational Employment Outlook Construction-Related in Maine Construction-Related in Maine
OccupationOccupation 20022002 20122012 Pct ChangePct Change Annual Annual OpeningsOpenings
Highway Highway Maintenance Maintenance Workers Workers
Operating Operating Engineers Engineers
First Line First Line SupervisorsSupervisors
(Constr)(Constr)
ConstructionConstruction
LaborersLaborers
20902090
16901690
32503250
39503950
22902290
17201720
33603360
41104110
1010
44
33
44
5050
5050
7070
7070

Occupational Employment OutlookOccupational Employment OutlookProfessionals and High Skilled Professionals and High Skilled
Occupation Occupation 20022002 20122012 Pct ChangePct Change AnnualAnnual
OpeningsOpenings
Civil Civil EngineersEngineers 11301130 11401140 -- 2020
Surveying Surveying and and Mapping Mapping Tech.Tech.
331331 400400 2121 2020
Civil Eng. Civil Eng. TechTech 520520 520520 -- 1010
Carpenters Carpenters and and ElectriciansElectricians
13,78013,780 14,27014,270 3.63.6 280280