Presented by Robi Robichaud
30
Wind Technologies and Innovation for Our Energy Future Evolving Opportunities Robi Robichaud Senior Engineer NREL EL is a national labora ratory ry of the U.S. S. Depart rtme ment of En Energ rgy Office ce of En Energ rgy Ef Effici ciency cy and Renewable En Energ rgy opera rated by the Al Alliance ce for Su Sust stainable En Energ rgy, LLC
-
Upload
doannguyet -
Category
Documents
-
view
226 -
download
3
Transcript of Presented by Robi Robichaud
Wind Technologies and Innovation for Our Energy Future Evolving Opportunities
Robi Robichaud Senior Engineer
NNRRELEL iiss aa nnaattiioonnaall llaabboorarattooryry ooff tthhee UU..S.S. DDeeppaartrtmemenntt ooff EnEneergrgyy OOffffiicece ooff EnEneergrgyy EfEfffiicicieenncycy aanndd RReenneewwaabbllee EnEneergrgyy ooppeeraratteedd bbyy tthhee AlAllliiaanncece ffoorr SuSuststaaiinnaabbllee EnEneergrgyy,, LLLLCC

kj
Opportunities for Wind Technology
• National Wind Technology Center – Research • Blades • Generators • Wind Resource
• Wind – Market Update • PTC • RPS
• Wind Technology Overview • Larger Rotors • Taller Towers • Improved Controls
• Wind Resource • Improved Assessment
2 Innova+on for Our Energy Future
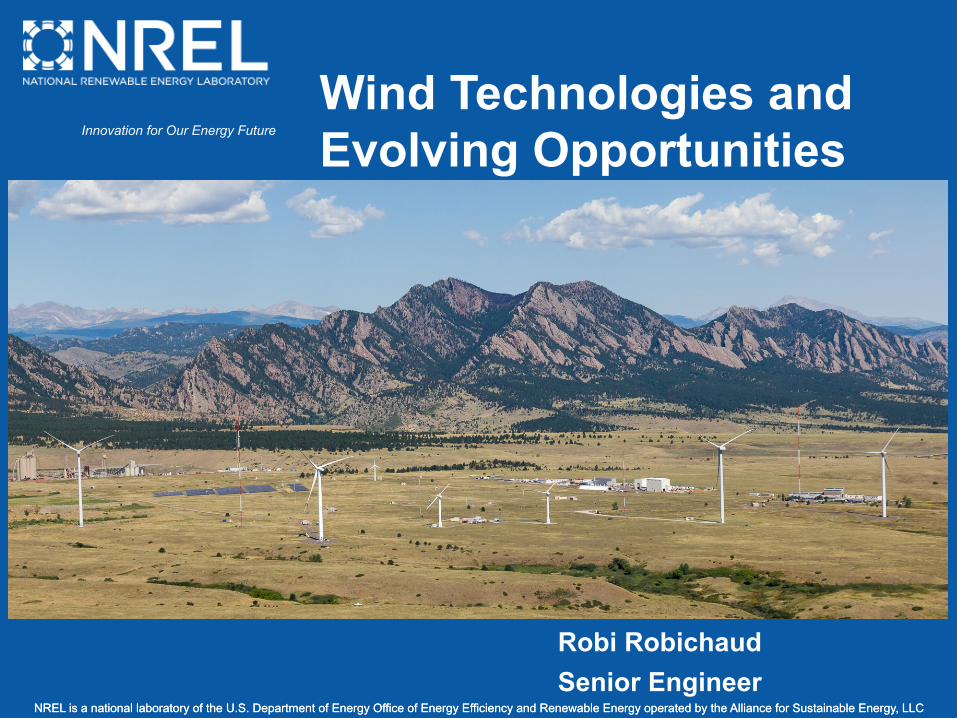
National Wind Technology Center - Research
Innova+on for Our Energy Future

National Wind Technology Center Overview
• Turbine testing since 1977 • Leader in development of
design and analysis codes • Pioneers in component
testing • Unique test facilities
• Blade Testing • Dynamometer • CART turbines
• Modern utility-scale turbines • Approx. 150 staff on-site • Budget approx. $35M • Many CRADAs with
industry • Leadership roles for
international standards
Innova+on for Our Energy Future
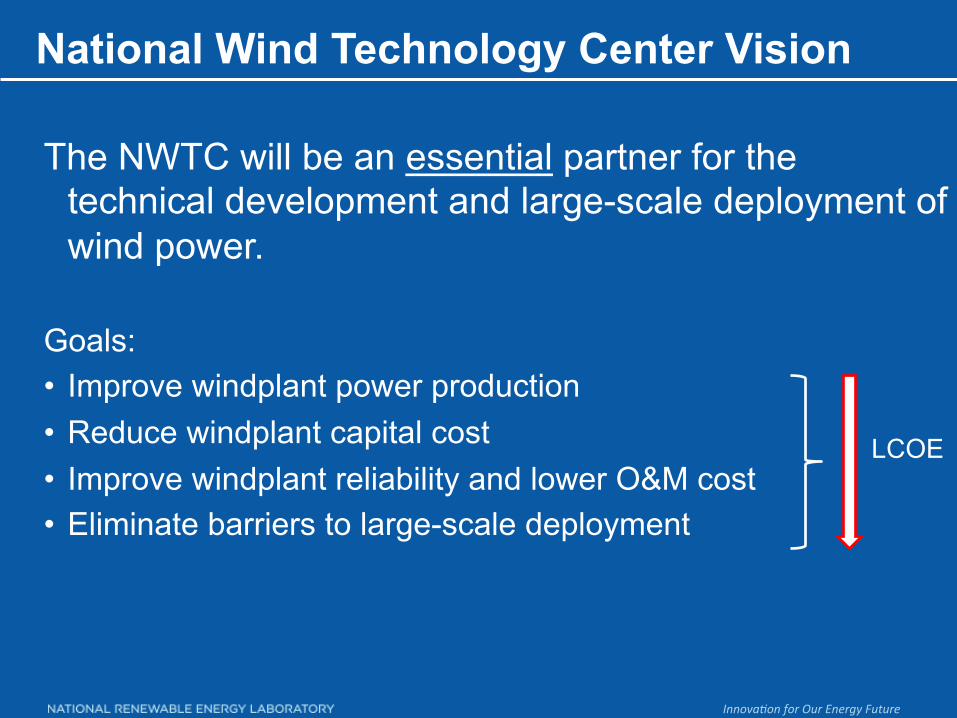
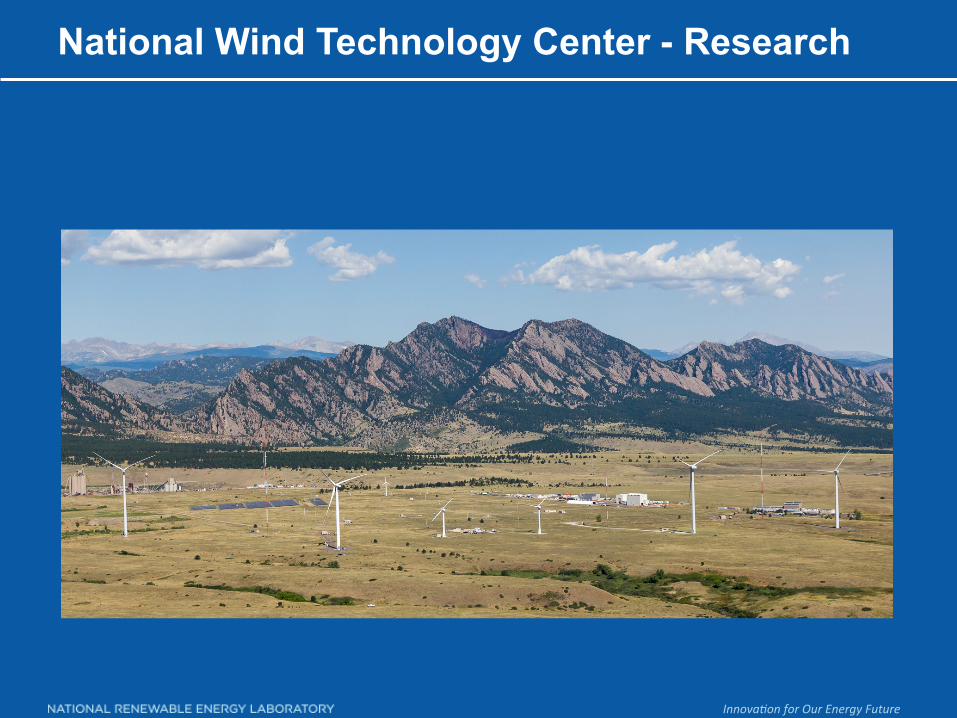
National Wind Technology Center Vision
The NWTC will be an essential partner for the technical development and large-scale deployment of wind power.
Goals: • Improve windplant power production • Reduce windplant capital cost LCOE • Improve windplant reliability and lower O&M cost • Eliminate barriers to large-scale deployment
Innova+on for Our Energy Future
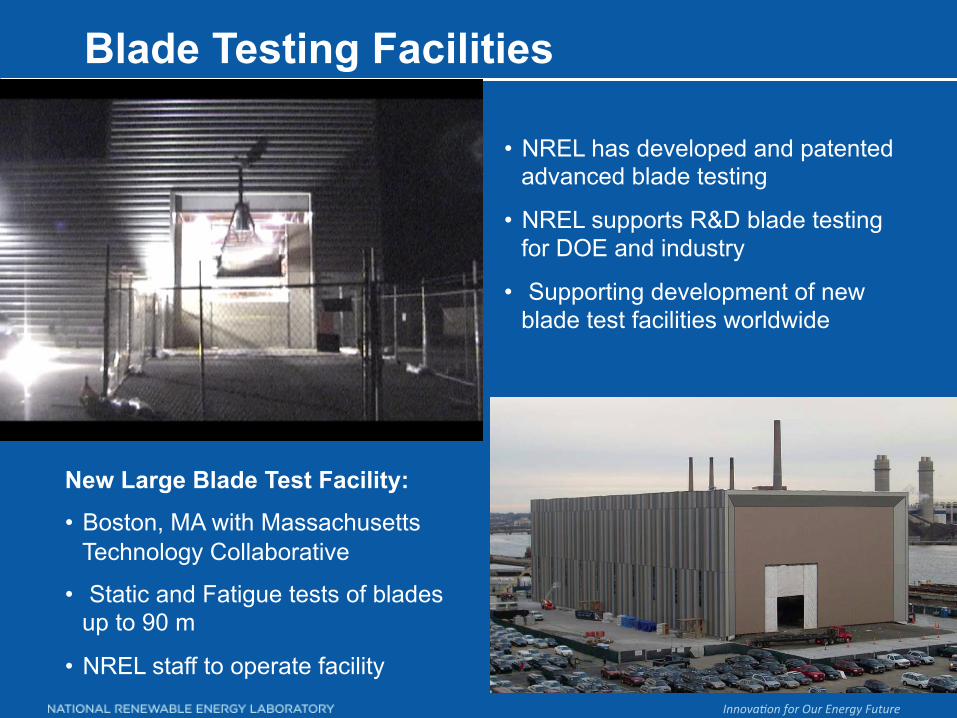
Blade Testing Facilities
New Large Blade Test Facility:
• Boston, MA with Massachusetts Technology Collaborative
• Static and Fatigue tests of blades up to 90 m
• NREL staff to operate facility
• NREL has developed and patented advanced blade testing
• NREL supports R&D blade testing for DOE and industry
• Supporting development of new blade test facilities worldwide
Innova+on for Our Energy Future

Drivetrain Testing
• 2.5 MW Dynamometer – Commissioned 1999
– Steady use by industry
– Used in R&D activities
– Key facility for Gearbox
Reliability Collaborative
– Basic shaft load capability
added in FY2010
• Dynamometer Upgrade – $10M Recovery Act funding
– New 5 MW driveline
– Robust shaft loading system
– Commissioniedin 2013
Innova+on for Our Energy Future

Windplant Aerodynamics Problem
Picture used by permission of Uni-Fly A/S.
Horn’s Rev • Power performance and reliability influenced reduced in arrays.
• Understanding inflow / array interaction is key.
• Computational models, control paradigms and hardware development will be required.
• Requires a detailed understanding of:
– Rotor Wake Interactions – PBL Characteristics – Inflow / Wind farm
Interaction
– Complex Terrain Effects
• Major “Grand Challenge””
Innova+on for Our Energy Future
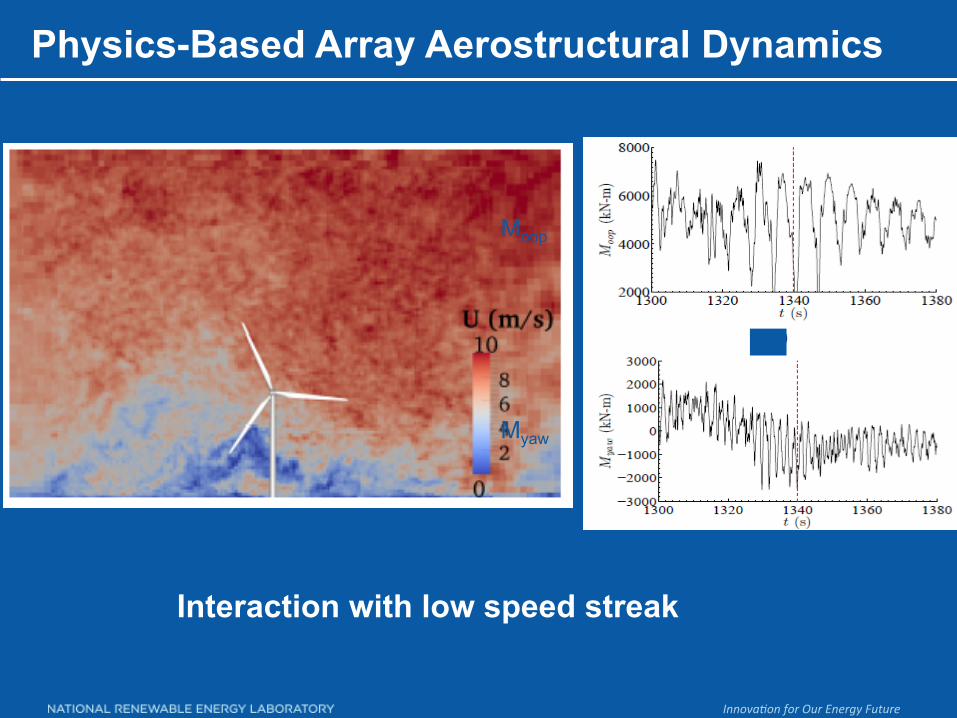
Physics-Based Array Aerostructural Dynamics
Moop
Myaw
Interaction with low speed streak
Innova+on for Our Energy Future 9

Wind – Market Trends
Innova+on for Our Energy Future

Wind –Market Update - Worldwide
Source: http://www.windpoweringamerica.gov/pdfs/workshops/2013_summit/wiser.pdf 2012 Wind Technologies Market Report Summary, WPA All-States Summit, May 8, 2013
Innova+on for Our Energy Future
Innova&on for Our Energy Future 12
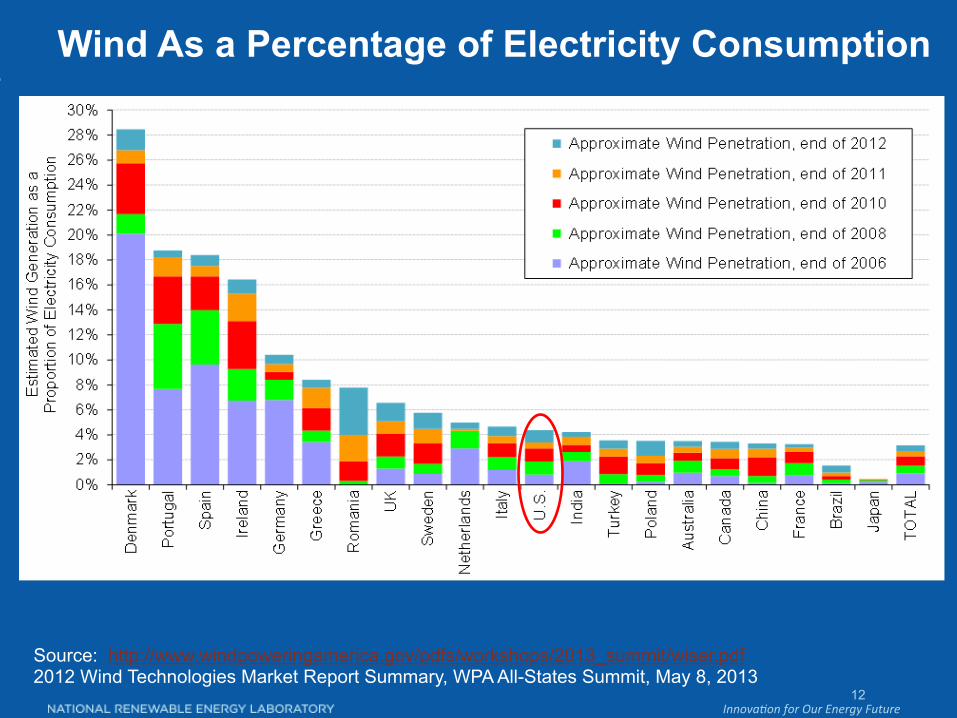
Wind As a Percentage of Electricity Consumption
Note: Figure only includes the countries with the most installed wind power capacity at the end of 2012
Source: http://www.windpoweringamerica.gov/pdfs/workshops/2013_summit/wiser.pdf 2012 Wind Technologies Market Report Summary, WPA All-States Summit, May 8, 2013
Innova&on for Our Energy Future 13
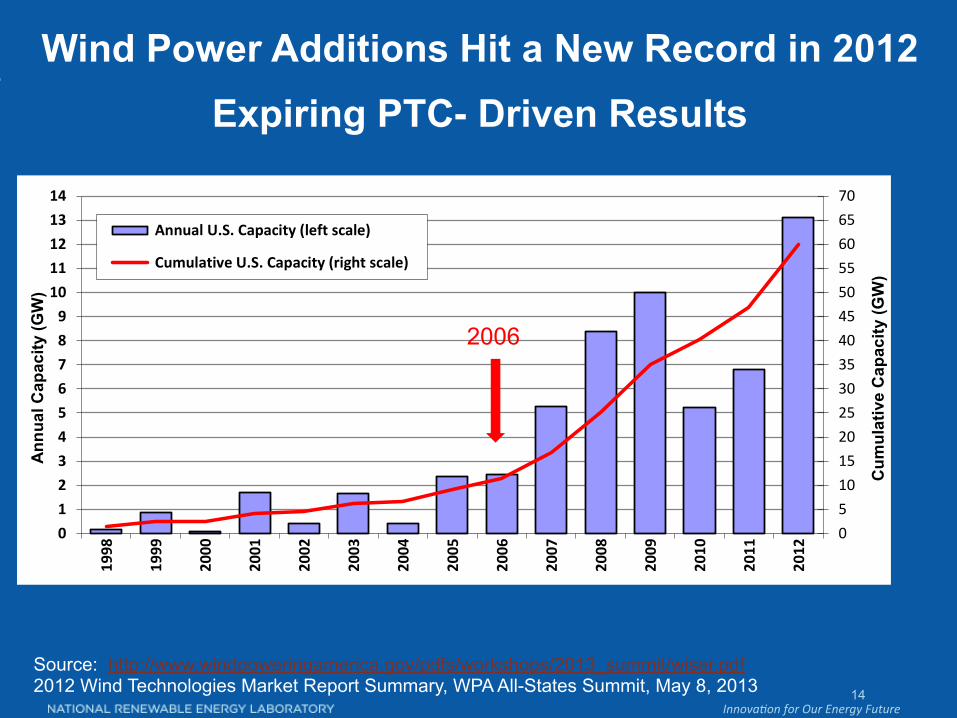
• 13.1 GW of wind added in 2012, more than 90% higher than 2011 • $25 billion invested in wind power project additions • Cumulative wind power capacity up by 28%, bringing total to 60 GW
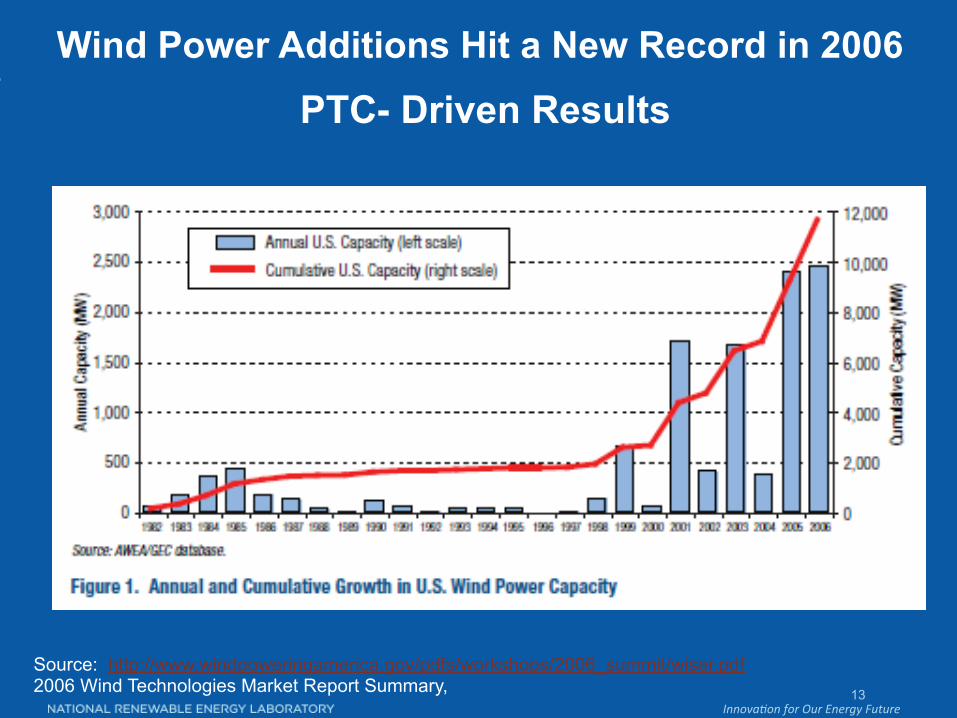
Wind Power Additions Hit a New Record in 2006
PTC- Driven Results
Source: http://www.windpoweringamerica.gov/pdfs/workshops/2006_summit/wiser.pdf 2006 Wind Technologies Market Report Summary,
Innova&on for Our Energy Future 14
• 13.1 GW of wind added in 2012, more than 90% higher than 2011 • $25 billion invested in wind power project additions • Cumulative wind power capacity up by 28%, bringing total to 60 GW
0510152025303540455055606570
01234567891011121314
1998
1999
2000
2001
2002
2003
2004
2005
2006
2007
2008
2009
2010
2011
2012
Annual U.S. Capacity (left scale)
Cumulative U.S. Capacity (right scale)
Cum
ulat
ive
Cap
acity
(GW
)
Ann
ual C
apac
ity (G
W)
Wind Power Additions Hit a New Record in 2012
Expiring PTC- Driven Results
Source: http://www.windpoweringamerica.gov/pdfs/workshops/2013_summit/wiser.pdf 2012 Wind Technologies Market Report Summary, WPA All-States Summit, May 8, 2013
2006
Innova&on for Our Energy Future
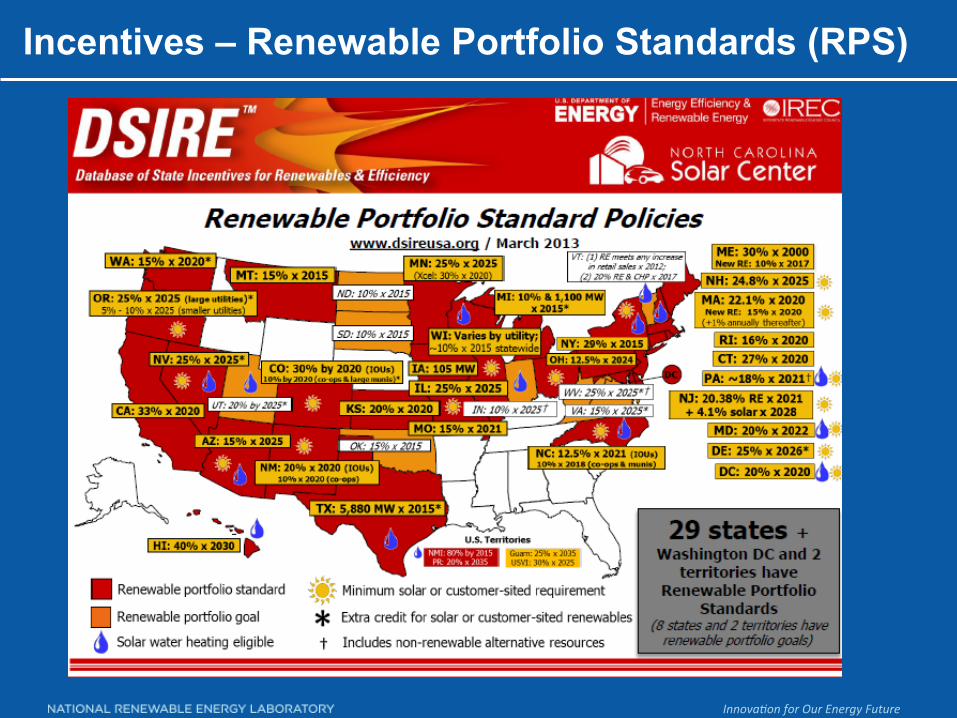
Incentives – Renewable Portfolio Standards (RPS)
Innova&on for Our Energy Future 16
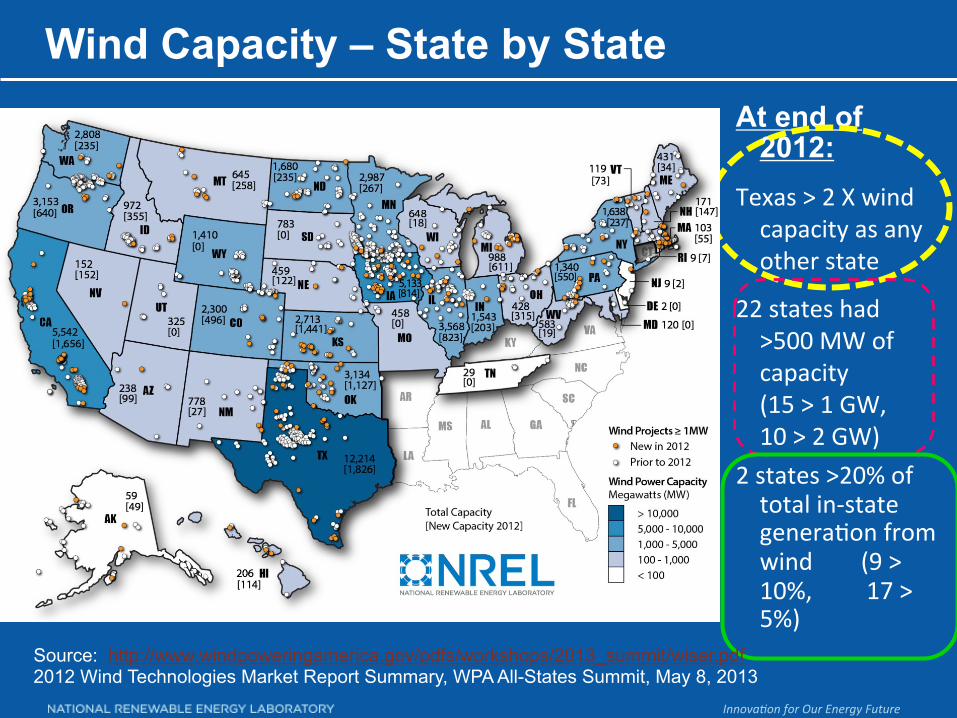
Wind Capacity – State by State At end of
2012: Texas > 2 X wind capacity as any other state
22 states had >500 MW of capacity (15 > 1 GW, 10 > 2 GW)
2 states >20% of total in-‐state generaLon from wind (9 > 10%, 17 > 5%)
Source: http://www.windpoweringamerica.gov/pdfs/workshops/2013_summit/wiser.pdf 2012 Wind Technologies Market Report Summary, WPA All-States Summit, May 8, 2013
Innova&on for Our Energy Future 17
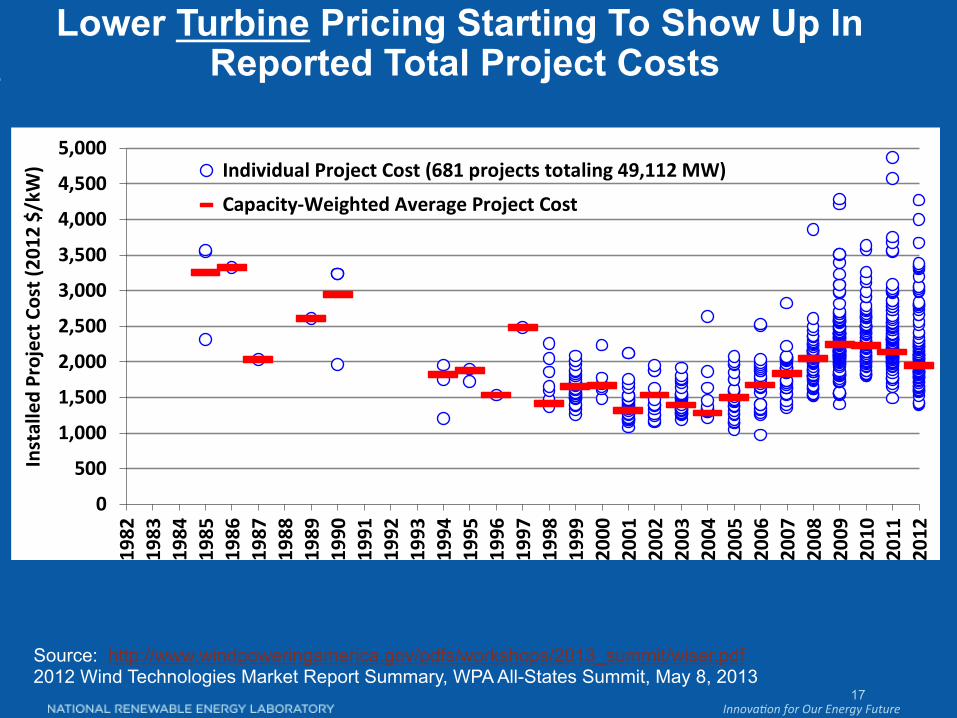
Lower Turbine Pricing Starting To Show Up In Reported Total Project Costs
0
500
1,000
1,500
2,000
2,500
3,000
3,500
4,000
4,500
5,0001982
1983
1984
1985
1986
1987
1988
1989
1990
1991
1992
1993
1994
1995
1996
1997
1998
1999
2000
2001
2002
2003
2004
2005
2006
2007
2008
2009
2010
2011
2012
Installed Project C
ost (20
12 $/kW) Individual Project Cost (681 projects totaling 49,112 MW)
Capacity-‐Weighted Average Project Cost
Source: LBNL
Source: http://www.windpoweringamerica.gov/pdfs/workshops/2013_summit/wiser.pdf 2012 Wind Technologies Market Report Summary, WPA All-States Summit, May 8, 2013
Innova&on for Our Energy Future 18
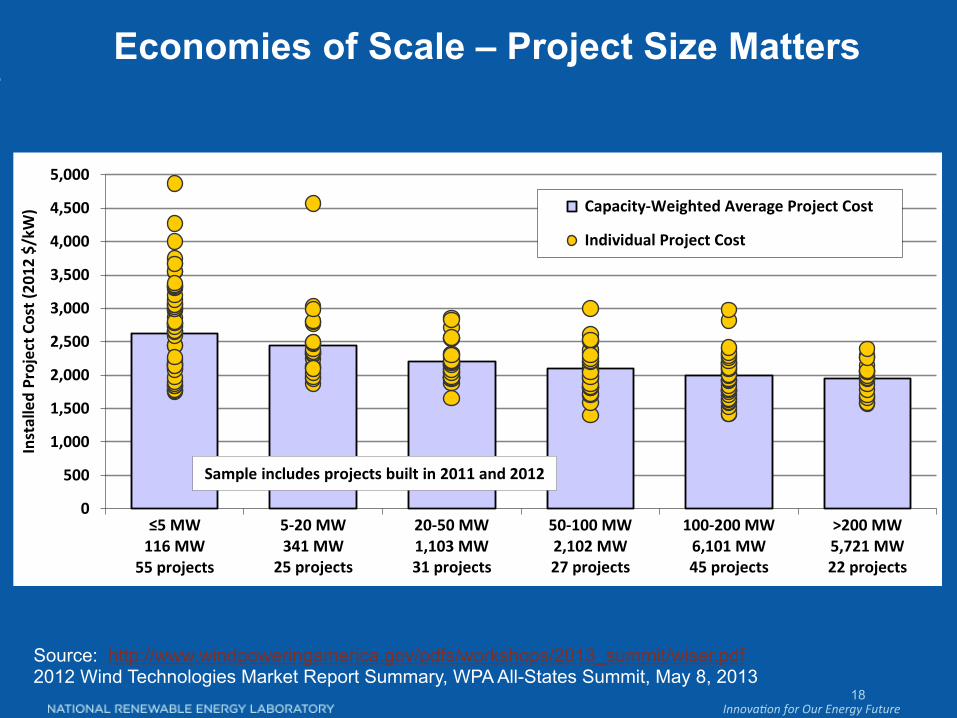
Economies of Scale – Project Size Matters
0
500
1,000
1,500
2,000
2,500
3,000
3,500
4,000
4,500
5,000
≤5 MW116 MW
55 projects
5-‐20 MW341 MW
25 projects
20-‐50 MW1,103 MW31 projects
50-‐100 MW2,102 MW27 projects
100-‐200 MW6,101 MW45 projects
>200 MW5,721 MW22 projects
Installed Project C
ost (20
12 $/kW) Capacity-‐Weighted Average Project Cost
Individual Project Cost
Sample includes projects built in 2011 and 2012
Source: http://www.windpoweringamerica.gov/pdfs/workshops/2013_summit/wiser.pdf 2012 Wind Technologies Market Report Summary, WPA All-States Summit, May 8, 2013

Innova&on for Our Energy Future
Domestic Manufacturing of Wind
Over 160 manufacturing plants capable of producing 12 GW/yr
Source: http://www.windpoweringamerica.gov/pdfs/workshops/2013_summit/wiser.pdf 2012 Wind Technologies Market Report Summary, WPA All-States Summit, May 8, 2013
20
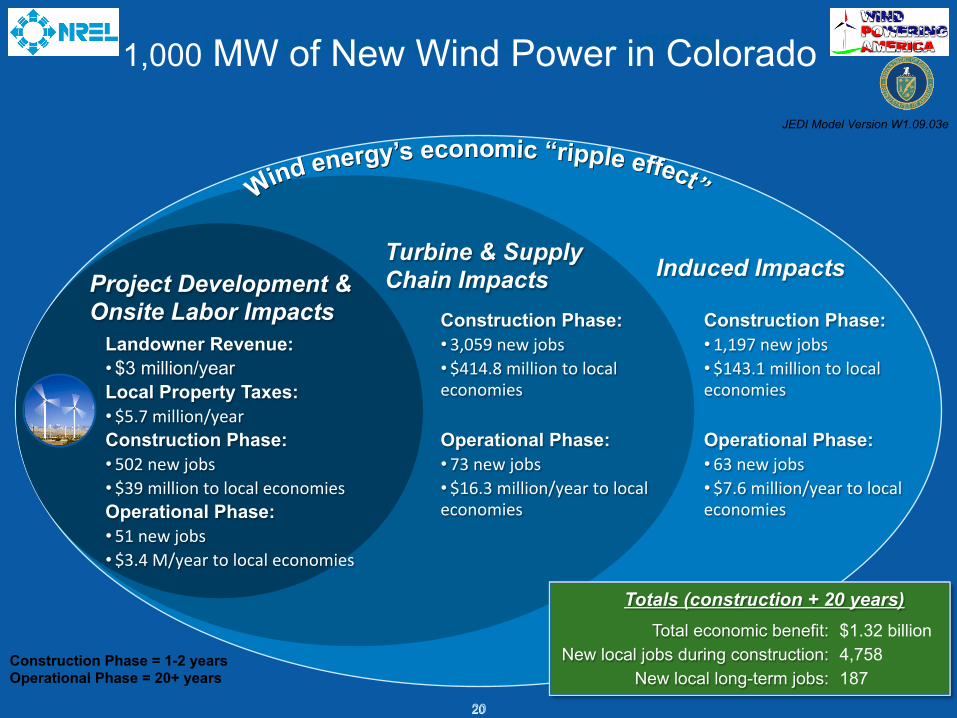
Landowner Revenue:
Project Development & Onsite Labor Impacts
Turbine & Supply Chain Impacts Induced Impacts
Local Property Taxes:
Construction Phase:
Operational Phase:
Construction Phase: Construction Phase:
Operational Phase: Operational Phase:
Jobs and Economic Impacts from the JEDI Model
Construction Phase = 1-2 years Operational Phase = 20+ years
Totals (construction + 20 years)
JEDI Model Version W1.09.03e
Total economic benefit: New local jobs during construction:
New local long-term jobs:
1,000 MW of New Wind Power in Colorado
• 73 new jobs
• $5.7 million/year
• 502 new jobs
• 51 new jobs
• $3 million/year • 3,059 new jobs • 1,197 new jobs
• 63 new jobs • $39 million to local economies
• $3.4 M/year to local economies
• $16.3 million/year to local economies
• $414.8 million to local economies
• $143.1 million to local economies
• $7.6 million/year to local economies
20
$1.32 billion 4,758 187

Innova&on for Our Energy Future
Wind – Technology Trends

Innova&on for Our Energy Future
Derived from K.E. = ½ mv2
P = A * ρ * V3 /2
o P = Power of the wind [Watts] o A = Windswept area of rotor (blades) = πD/4 = πr2 [ m2] o ρ = Density of the air [kg/m3 ] (at sea level at 15°C) o V = Velocity of the wind [m/s]
Wind energy is proportional to velocity cubed (V3): – 25% higher wind speed ≈ 2x’s the power available – If wind speed is doubled, power increases by a factor of eight (23 = 8)!
Small differences in average speed cause big differences in energy production!
Power in Wind Equa/on Wind energy is kinetic energy
-- mass and momentum D

Innova&on for Our Energy Future
This graph is of the GE 1.6-100 1.6 MW with 100m rotor (low wind speed turbine – suitable for Kaneohe) and 82.5m rotor (suitable for sites without extreme wind or turbulence). The enlarged rotor moves the power curve to the left so the turbine produces more power (and energy) at lower wind speeds. At 7 m/s, it might have produced ~500kW with 82.5m rotor, but with 100m rotor it will produce ~700kW – that is a 40% increase !! Over the course of a year, it really makes a difference.
GE 1.6 MW wind turbine

Innova&on for Our Energy Future
Effect of Tower Height
1.0
1.5
2.0
2.5
3.0
3.5
0 50 100 150 200 250Tower Height, ft
Incr
ease
Com
pare
d to
30
ft
Wind Power IncreaseWind Speed Increase
Wind power increase Wind speed increase
Wind Speed and Power Increase with Height Above the Ground

Innova&on for Our Energy Future
Wind – Wind Resource

Innova&on for Our Energy Future
Wind Resource Mapping: Wind Class at 50-m Height
50-m wind mapping (2001-2009)
• Culmination of long-term project that began in 2001; jointly funded by states and DOE/WPA
• Comprehensive validation of WPA maps using available measurement data
• Incorporated state maps by others to produce a national wind map (“patchwork quilt” evident in some regions)
• 50-m wind potential estimates to support U.S. 20% wind scenario study

Innova&on for Our Energy Future 27
Changes in Wind Maps Over Time – Kansas Example
Innova&on for Our Energy Future
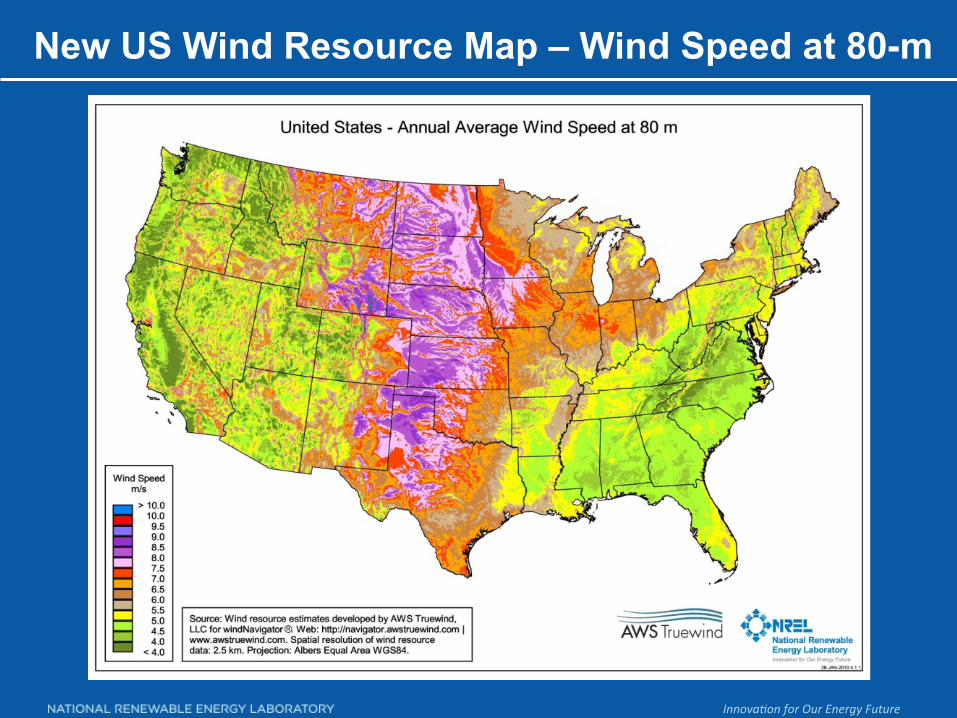
New US Wind Resource Map – Wind Speed at 80-m

Innova&on for Our Energy Future
Georgia – New Turbines Provide Greater Wind Potential
Increasing hub height from 80 to 100m: • Doubles the potential wind capacity in Georgia at sites with a 30% capacity factor from 200 to 400MW
• Quadruples potential wind capacity at 25% capacity factor sites from 500 to 2000 MW
Innova&on for Our Energy Future
• National Wind Technology Center – Research • Wind – Incentives & Markets • Wind Technology Improvements • Wind Resource Assessment Improvements
30
Opportunities for Wind Technology