Presented at ^uo,o the 100th Convention 1996 May 11-14 ...
59
Perceived Boundary Effects in an Automotive Vehicle Interior Preprint 4245 (O-6) Roger E. Shively & William N. House Harman-Motive, Inc, Martinsville, USA Presented at ^ uo,o the100th Convention 1996 May 11-14 Copenhagen Thispreprinthasbeen reproducedfromtheauthor'sadvance manuscript,withoutediting,correctionsorconsiderationbythe Review Board. TheAES takes no responsibility for the contents. Additionalpreprints may be obtainedby sendingrequestand remittancetotheAudioEngineeringSociety,60 East42ndSt., New York,New York 10165-2520, USA. All rightsreserved.Reproductionofthispreprint,or anyportion thereof,is not permittedwithoutdirectpermissionfromthe Journalof theAudioEngineeringSociety. AN AUDIO ENGINEERING SOCIETY PREPRINT
Transcript of Presented at ^uo,o the 100th Convention 1996 May 11-14 ...

Perceived Boundary Effects in an Automotive Vehicle Interior Preprint 4245 (O-6)
Roger E. Shively & William N. HouseHarman-Motive, Inc, Martinsville, USA
Presented at ^uo,othe 100th Convention1996 May 11-14Copenhagen
Thispreprinthas been reproducedfromthe author'sadvancemanuscript,withoutediting,correctionsorconsiderationby theReviewBoard. TheAES takesno responsibilityforthecontents.
Additionalpreprintsmay be obtainedby sendingrequestandremittanceto theAudioEngineeringSociety,60 East42ndSt.,New York,New York10165-2520, USA.
All rightsreserved.Reproductionof thispreprint,or any portionthereof,is not permittedwithoutdirectpermissionfromtheJournalof theAudioEngineeringSociety.
AN AUDIO ENGINEERING SOCIETY PREPRINT

Perceived Boundary Effects in an Automotive Vehicle Interior
Roger E. ShivelyWilliam N. House
Harman-Motive, Inc.1201 S. Ohio Street
Martinsville, IN 46151USA
.,t study was conducted to better understandthe perceived mid-to-high-fi_equencytimbraland spatial changes in a sound field due to the proximity to loudspeakers of reflective,semi-rigid surface boundaries similar to those of passenger vehicles. For the purpose ofthe study, a simple structure was mocked up to represent the interior boundaries of anautomotive vehicle. Adjustable and removable panels were used so the effects of differentpanel combinations and loudspea_r locations could be investigated. Objectiveparameter measurements and binaural recordings were made for each of thecombinations. Subjective tests were then performed to study listener impressions andcorrelate the results to the objective measurements.
0 INTRODUCTION
The results presented in this paper are from a general experiment aimed at understandingthe relationship between the perception of the soundfield in a vehicle interior and thepresence of nearby boundaries. It is postulated that an understanding such as this willbenefit us in describing the contribution of each loudspeaker location and boundarysurfac_ to the spatial and timbral aspects of the soundfield.
Past work by Beth [1],[2] Toole and O1ive[3],[4],[5] and Schuck et al [6] has illustratedthe effects of loudspeaker location on preference and timbre in listening rooms. Thepurpose of this paper is to investigate the application of their work to the smaller, morecomplicated boundaries of a vehicle interior. The results would then be related to thepractical aspect of sound system design and development for the vehicle environment.
I EXPERIMENTS
1.1 Preliminary Experiment
A preliminary experiment was run using rudimentary boundary representations of avehicle's interior: Windshield, instrument panel tiP) and front doors. In the preliminaryexperiment, the material used for the panels was 9.5 mm thick foam insulation board with
Page I

aluminum skin surfaces. It was light-weight for ease of manual manipulation, but rigidwith a smooth surface. A loudspeaker was mounted on the top of the instrument panel oneach side of the vehicle. The setup allowed us to modify the boundaries extensively, hearthe effects, make binaural recordings and verify that the effects were being recorded.Through the live listening and binaural recordings, we determined the basic contributionof each panel to the effects heard and determined the best program material for thegeneral experiment.
1.2 General Experiment
In the general experiment, the vehicle interior was represented by flat panels withappropriate damping characteristics for each of the chosen boundaries. Flat panels werechosen to simplify construction of the boundaries and to simplify analysis of interactionsbetween the boundaries and speakers. The materials were changed in this experimentfrom what was used in the preliminary experiment and this did effect the results. Thewindshield, IP, and upper door areas had a reflective surface similar to hard plastic orglass. The lower doors were covered with cloth and the roof was covered with a foam-backed cloth similar to what is found in a vehicle, and the floor was carpeted. The wallsof the room used for the experiment were treated to absorb as much low frequency energyas possible (100 - 200 Hz) so the room would not color the upper bass and midrange.The panels were removable, and any practical combinations of panels was possible. Theangle between the windshield and the IP was calibrated and adjustable, and theloudspeaker locations were also variable. The loudspeaker locations were either in thetop side locations of the IP or the mid or lower portion of the door. There wasconfirmation that the mocked up vehicle interior had similar acoustic properties to anactual vehicle. This was done through subjective listening, measurements and dimensioncomparison.
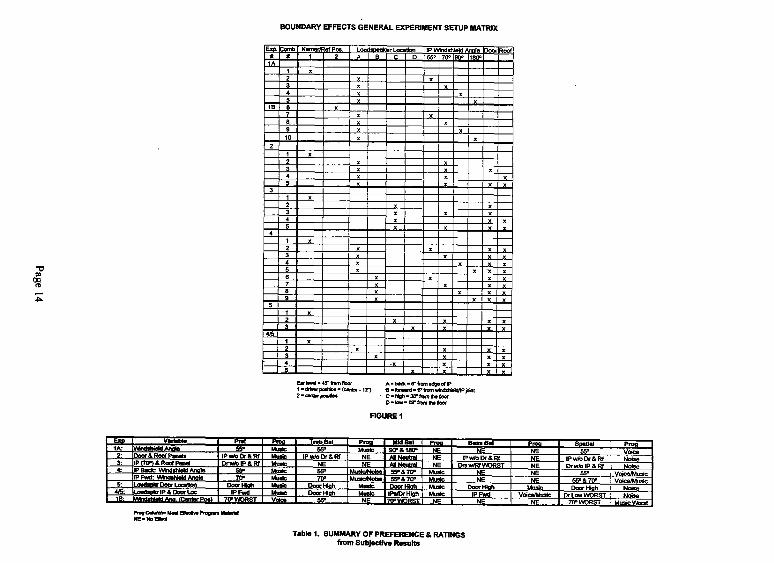
A matrix of all the useful panel and loudspeaker combinations was made to minimize thenumber of trials. [Figure I.] Based on our knowledge of vehicle interiors and the resultsof the preliminary experiment, the total experimental set 'was reduced considerably to amanageable number (28). From the preliminary experiment, we determined that bothdoor panels (left and right) would be used when the boundary variable being investigatedwas the door. Also, we decided to have no rear panel in all the experiments. Its primarycontribution was accentuated bass, not midrange/treble, and would only add confusion tothe timbral results and spatial judgments. In the preliminary experiment, we couldmodify the windshield angle instantaneously, and from that determined the angleincrements we would investigate (55 °, 70°, 90°, and 180°). We also determined from thatexploratory investigation that there was an "optimum" angle for the windshield wherespatially and timbral the soundfield was at its best. Later on we will illustrate that theoptimum angle was not what we determined from the preliminary experiment and that theangle increments could have been slightly different to be more meaningful. Thesedifferences can be attributed to the materials used for the boundary panels.
Page 2
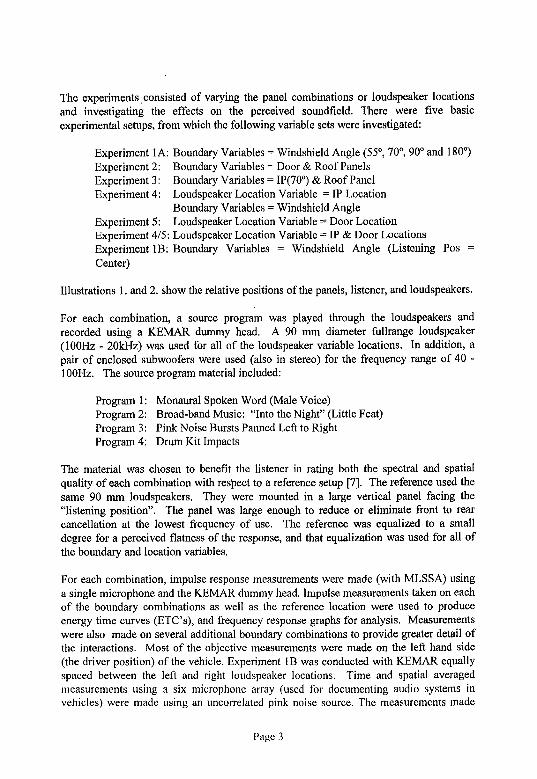
The experiments.consisted of varying the panel combinations or loudspeaker locationsand investigating the effects on the perceived soundfield. There were five basicexperimental setups, from which the following variable sets were investigated:
Experiment 1A: Boundary Variables = Windshield Angle (55 °, 70 °, 90 ° and 180°)Experiment 2: Boundary Variables = Door & Roof PanelsExperiment 3: Boundary Variables = IP(70 °) & Roof PanelExperiment 4: Loudspeaker Location Variable = IP Location
Boundary Variables = Windshield AngleExperiment 5: Loudspeaker Location Variable = Door LocationExperiment 4/5: Loudspeaker Location Variable = IP & Door LocationsExperiment lB: Boundary Variables = Windshield Angle (Listening Pos =Center)
Illustrations 1. and 2. show the relative positions of the panels, listener, and loudspeakers.
For each combination, a source program was played through the loudspeakers andrecorded using a KEMAR dummy head. A 90 mm diameter fullrange loudspeaker(100Hz - 20kHz) was used for all of the loudspeaker variable locations. In addition, apair of enclosed subwoofers were used (also in stereo) for the frequency range of 40 -100Hz. The source program material included:
Program 1: Monaural Spoken Word (Male Voice)Program 2: Broad-band Music: "Into the Night" (Little Feat)Program 3: Pink Noise Bursts Panned Left to RightProgram 4: Drum Kit Impacts
The material was chosen to benefit the listener in rating both the spectral and spatialquality of each combination with respect to a reference setup [7]. The reference used thesame 90 mm loudspeakers. They were mounted in a large vertical panel facing the"listening position". The panel was large enough to reduce or eliminate front to rearcancellation at the lowest frequency of use. The reference was equalized to a smalldegree for a perceived flatness of the response, and that equalization was used for all ofthe boundary and location variables.
For each combination, impulse response measurements were made (with MLSSA) usinga single microphone and the KEMAR dummy head. Impulse measurements taken on eachof the boundary combinations as well as the reference location were used to produceenergy time curves (ETC's), and frequency response graphs for analysis. Measurementswere also made on several additional boundary combinations to provide greater detail ofthe interactions. Most of the objective measurements were made on the left hand side(the driver position) of the vehicle. Experiment lB was conducted with KEMAR equallyspaced between the left and right loudspeaker locations. Time and spatial averagedmeasurements using a six microphone array (used for documenting audio systems invehicles) were made using an uncorrelated pink noise source. The measurements made
Page 3

with the six-microphone array corresponded well with the frequency responses derivedfrom MLSSA measurements and will not be discussed beyond that. The MLSSAfrequency responses were capable of providing more detail and were therefore used forcomparison and analysis.
Binaural recordings were made on RDAT and edited on a PC as *.wav files. The lengthof the edited sources were between 20 to 30 seconds. The edited recordings were
arranged into six different listening test sessions and played back from that PC's harddrive through a pair of binaural earphones. The listening tests were therefore blind.
Several trained listening subjects with known audiometric acuity were used to evaluatethe RDAT recordings. The benefit of trained listeners has been well established [7], [8].The listeners for these experiments were trained using the method established by Olive[7]. The subjects were given some instruction on the type of cues to listen for in thebinaural recordings to help relate the earphone listening experience to the live listeningexperience. The type of spatial errors which can occur are in-head localization and front-to-back reversals [9], [10]. The listeners were coached in these errors and the use ofloudness cues to relate in-head locations to external ones. The recordings were presentedto the listeners with the same programs for each trial, but randomized within each session.The subjects were asked to provide a preference rating (relative to the reference) for theselections presented to them in each trail. The subjects were then asked to rate both thetimbral and spectral nature of the soundfield, as well as provide written comments duringeach trial and verbal comments after each session.
The results of the listener testing were statistically analyzed using a multivariate repeated-measures analysis of variance (ANOVA) model. The model analyzes each factor(Listener, Boundary or Loudspeaker Location Variable, and Program) and theirinteractions to determine their effect on the Listeners' Preference rating, Timbral Balancerating, and Spatial Quality rating (the dependent variables).
Each of the dependent variables for each of the experiments was statistically analyzed asa separate model. The combined ANOVA tables for the experiments are shown at theend of the paper. [Tables 2 - 8.] The significance of the variation is listed for eachdependent variable by each Effect (i.e., source of variation). The results of the statisticalanalysis and effects of the subjective results are summarized in Table 1. Those results aredescribed in the following sections.
A comparison between listener preferences, ratings and comments and observations ofthe measured data is then made following the subjective results.
Page 4

2 EXPERIMENTAL RESULTS: BOUNDARY VARIABLES
2.1 Statistical Analysis & Effects of Subjective Results
2.1.1 Experiment lA: Boundary Variable = Windshield Angle
The loudspeaker location was in the IP, in the Back position (152 mm from to the edge ofthe IP).
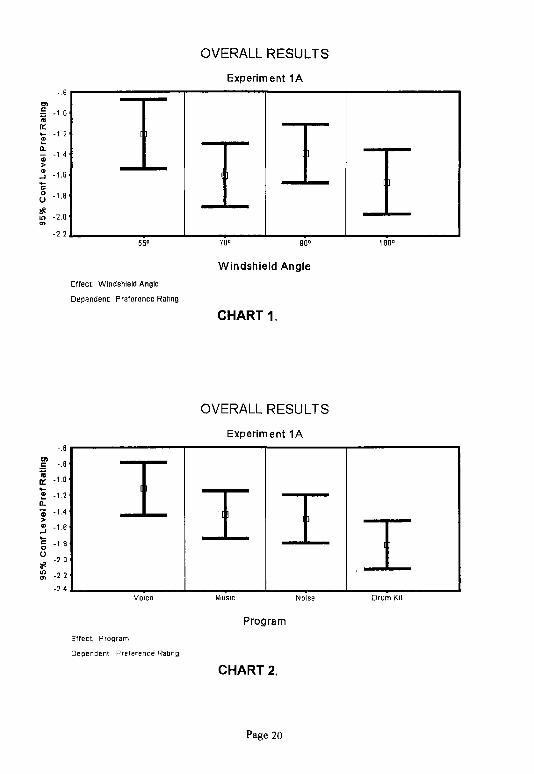
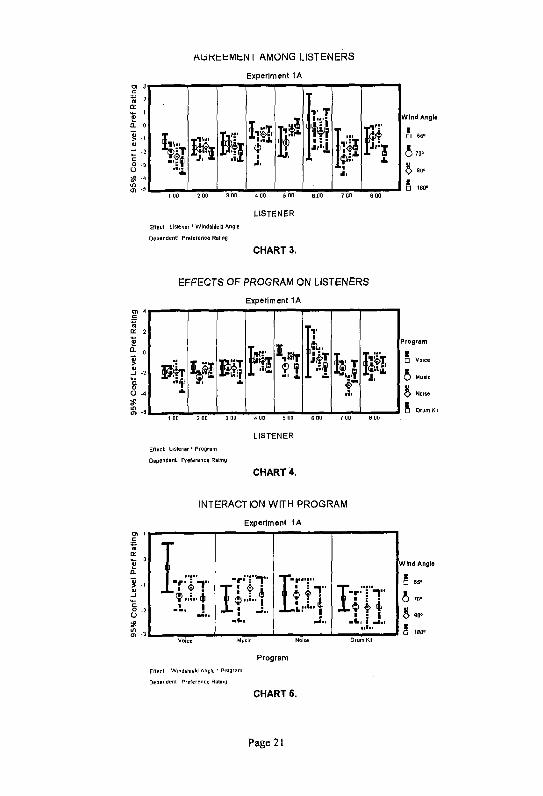
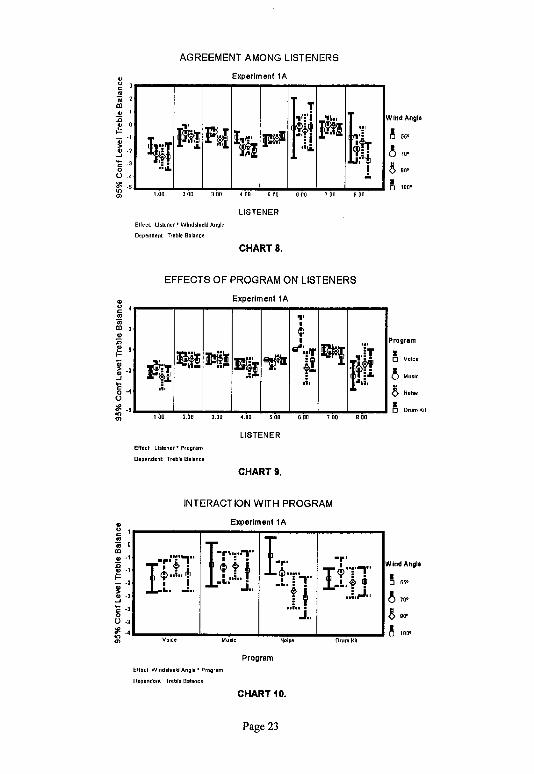
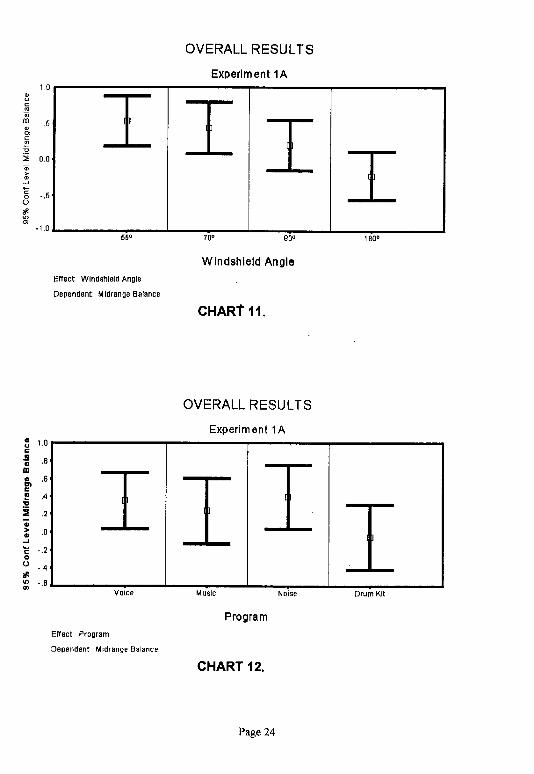
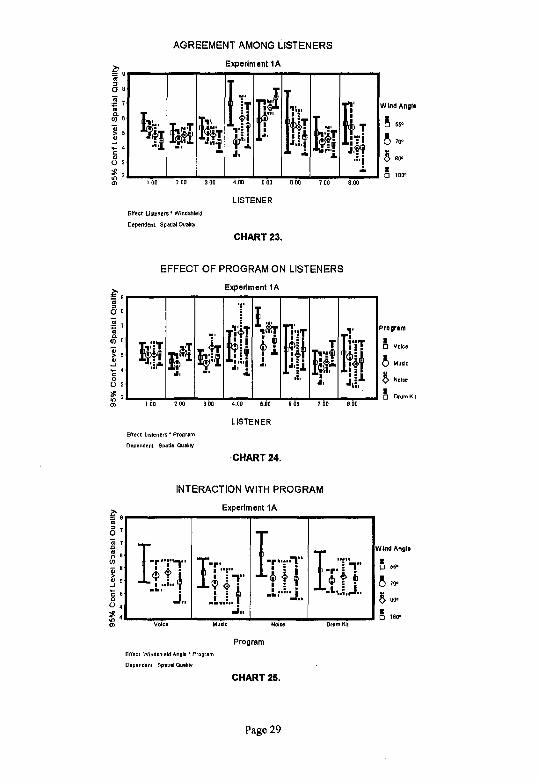
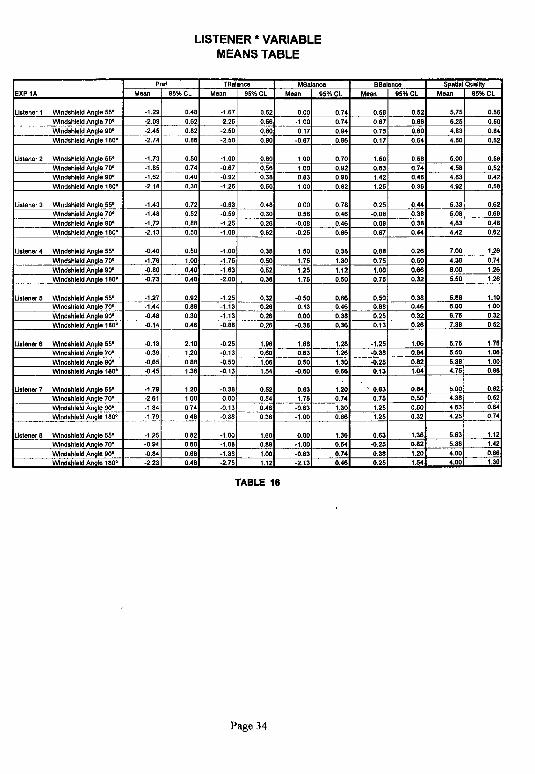
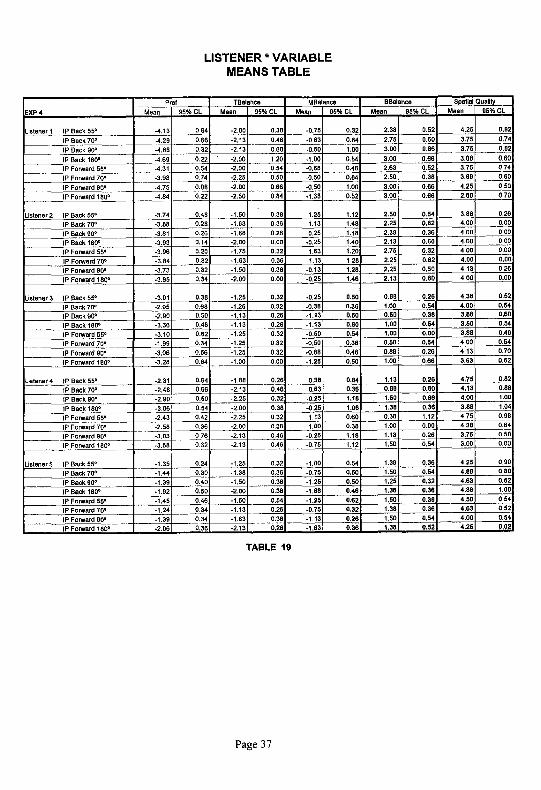
ANOVA Table 2 and Means Tables 9, 16, 23, and 30 indicate, and Means Charts 1 - 5(with 95% Confidence Levels) illustrate, that the 55° windshield angle was the largestfactor to contribute to variance in the listeners' responses for Preference Rating. Thelisteners individually had the greatest variance overall, but as can be seen in Chart 3 thelisteners agree in general that the 550 angle was preferred over the others. The 90 ° anglewas a close second in preference. The 55° angle also had the best Treble Balance (sameTables and Charts 6 - 10). The 90° & 1800 angles were the best in Midrange Balance(Charts 11 - 15). And the boundary variables had no effect on the Bass Balance (Charts16 - 20). The 55 ° angle was also considered to have the best Spatial Quality. (Charts 21-25).
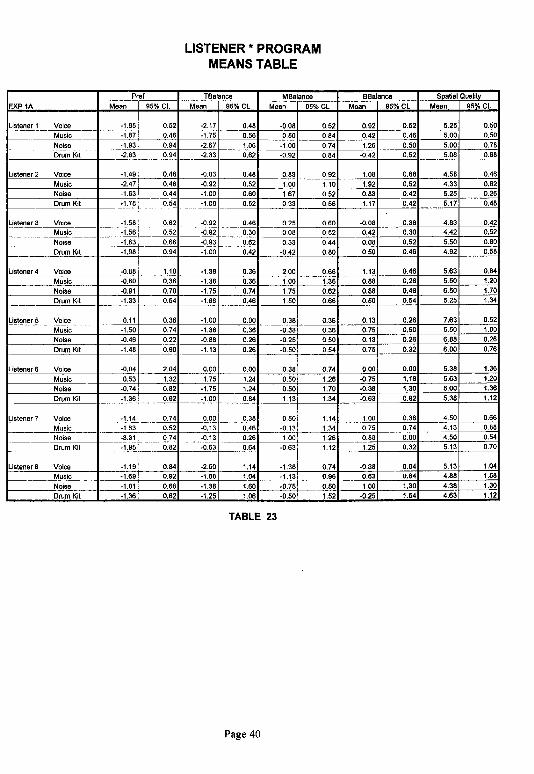
When comparing the overall effects of the Program material itself and its effects amongthe listeners, Voice and Music were the most useful in determining Preference. If therewas an effect in Timbre Balance, then music was the best in determining it. Voice was themost effective in determining Spatial and Music was the worst. It might be expected thatthe Noise would have been the best program for determining Timbral Balance, but theduration of each of the noise bursts was not long enough for the listener to make a goodjudgment.
The Means charts similar to the ones used to illustrate the effects in Experiment lA canbe generated from the values listed in the Means Tables. For the sake of brevity, thosecharts will not be displayed for every experiment. But they have been generated and usedby the authors to visually inspect the data for the interaction trends which are reported.
2.1.2 Experiment 2: Boundary Variable = Door & Roof Panels
The loudspeaker location was IP Back again.
It can be seen in ANOVA Table 2 and Means Tables 10, 17, 24, and 31 that the BoundaryVariable of IP w/o Door & Roof was the most preferred, and the addition of the Roofpanel was the most significant variable in the lowering the preference. The IP w/o Door& Roof also had the best Treble and Bass Balance, and the Roof also contributed most totile worst cases. The Boundary Variables had no effect on the Midrange Balance. The IP
Page 5

w/o Door & Roof also had the highest Spatial Quality rating, and the presence of theDoor lowered the quality the most; the lowest being with the Door & Roof present.
Music was again the most effective in distinguishing Preference. There was no Programeffects for the Timbral Balances. Noise was the most effective in determining SpatialQuality.
2.1.3 Experiment 3: Boundary Variables = IP(70 °) & Roof Panel
The loudspeaker location was in the Doors, High (762 mm from the floor).
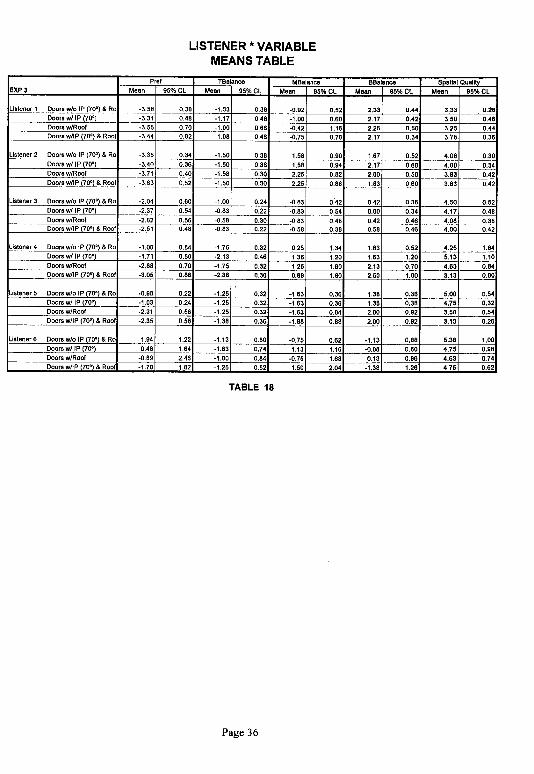
ANOVA Table 4 and Means Tables 11, 18, 25, and 32 indicate that the BoundaryVariable of Doors w/o the IP & Roof was the most preferred, and preference was loweredmost by the presence of the roof. The presence of the IP with windshield had no effect.There was no effect of the Boundary Variables on the Treble and Midrange Balance.Treble was all negative and the Midrange .was neutral. The only effect of the variables onthe Bass Balance was that the Doors w/Roof combination was the worst. The levels forBass Balance were consistent with Experiment 2's Doors w/ Roof and Doorscombinations. The Doors w/o IP and Roof Boundary Variable had the highest SpatialQuality rating, and the presence of the Roof lowered the quality ratings the most. Theratings were consistent with those of Experiment 2's IP w/Doors combinations.
Music was the most effective in distinguishing Preference. There was no Program effectsfor the Timbral Balances. Noise was the most effective in determining Spatial Quality.
2.2 Objective Measurements
For the following analysis, to simplify the interaetions_ only single ear and loudspeakercombinations are considered unless otherwise stated.
2.2.1 Experiment lA: Boundary Variable = Windshield Angle
Graphs 1 and 2 show the frequency response characteristics _mdGraphs 3 and 4 show theETC's for the different windshield angles and reference using KEMAR's left and rightears. The ETC's have been averaged to make overlays and viewing easier.
Comparing the frequency characteristics, it can be seen that there is a left-right proximitybias because the listener is not positioned an equal distance from each loudspeaker. Theright loudspeaker SPL is typically 2-4 dB less than the left loudspeaker due to the nearly2:1 distance from the ears. The high-frequency SPL is also greater for the left sidebecause the head is closer to and aligned more directly with the left loudspeaker. As thewindshield angle becomes smaller (< 75°), the mid- and high-frequency SPL increasesdue to reflections off the windshield. For angles less than 55°, which is typical of mostautomobiles, the left side high-frequency SPL (above 4 kHz) is greater than the right side.
Page 6

The response smoothness becomes quite irregular as the angle becomes smaller due to thecomb filtering effects. Also, there is a small (_ 2 dB) increase in the frequencies below400 Hz due to boundary reinforcement.
The ETC's show that as the windshield angle becomes smaller and more energy isreflected back toward the listener, the reflection amplitude gets larger and the separationbetween the direct and reflected energy peaks become smaller. Between 55° to 900 thereis a general broadening of the initial energy peak as multiple reflections are fusedtogether to form a bundle [11]. For angles less than 70°, the amplitude of the directenergy is smaller than that of the reflected energy. At 55°, the angle is so small that theinitial peak and first reflections are fused together to yield a more ideal looking impulsebut with a reduced decay envelope slope beyond 7 ms due to the increased reflectionenergy density. The time scale is reduced on this graph to depict greater detail.
2.2.2 Experiment 2: Boundary Variable = Door & Roof PanelsExperiment 3: Boundary Variables = IP(70 °) & Roof Panel
Graphs 5 through 8 show the results of adding individual boundaries around a single IPloudspeaker location. It can be seen that with the addition of each boundary, thefrequency response aberrations become larger in amplitude and more frequent.Compared to the reference there is a 2-3 dB increase in the bass level with the addition ofeach boundary, particularly the roof. The right side has slightly more high-frequencyoutput above 8 kHz and there is also some significant peaking in the midband regioncaused by the reflections.
The ETC's show that as additional boundaries are added, the initial energy peak becomes
broader as the reflections fuse together with the direct energy. There is also a substantialdecrease in the ETC slope with the addition of each boundary. It is interesting to notethat adding just the doors increases the ETC energy beyond the initial bundle more thanthe roof and/or door and roof together. This is because the roof is padded and absorbssome of the high frequency energy reflected by the windshield and doors. Graphs 9A and9B show the non averaged ETC's for the left and right ears with both the left and rightloudspeakers playing. Notice the comb filter spacing effects and long decay time.
2.3 Objective vs. Subjective Results
2.3.1 Experiment lA: Boundary Variable = Windshield Angle
Generally, there is good correlation between the objective and subjective results for thisportion of the experiment. In spectral terms, the ANOVA results show no significantchanges to tile bass balance as the windshield angle changed, although a slight bassincrease could be heard. There was signilicancc to the mid- and high-frequency balance
Page 7
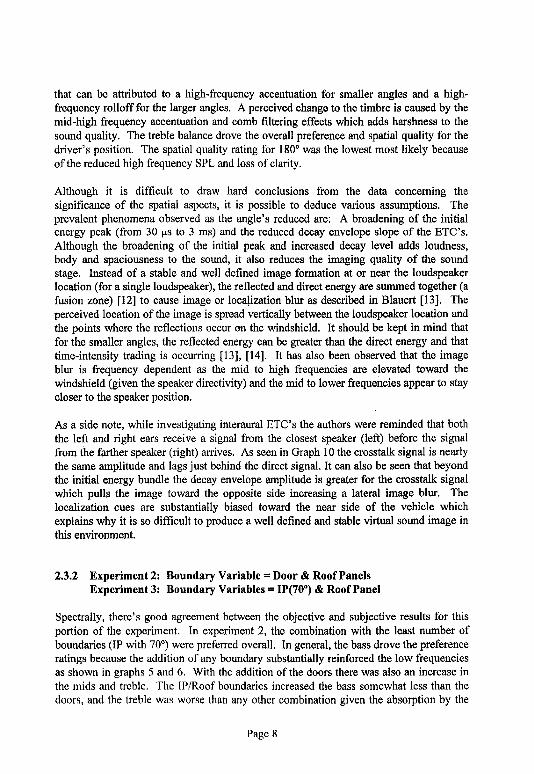
that can be attributed to a high-frequency accentuation for smaller angles and a high-frequency rolloff for the larger angles. A perceived change to the timbre is caused by themid-high frequency accentuation and comb filtering effects which adds harshness to thesound quality. The treble balance drove the overall preference and spatial quality for thedriver's position. The spatial quality rating for 180° was the lowest most likely becauseof the reduced high frequency SPL and loss of clarity.
Although it is difficult to draw hard conclusions from the data concerning thesignificance of the spatial aspects, it is possible to deduce various assumptions. Theprevalent phenomena observed as the angle's reduced are: A broadening of the initialenergy peak (from 30 _s to 3 ms) and the reduced decay envelope slope of the ETC's.Although the broadening of the initial peak and increased decay level adds loudness,body and spaciousness to the sound, it also reduces the imaging quality of the soundstage. Instead of a stable and well defined image formation at or near the loudspeakerlocation (for a single loudspeaker), the reflected and direct energy are summed together (afusion zone) [12] to cause image or localization blur as described in Blauert [13]. Theperceived location of the image is spread vertically between the loudspeaker location andthe points where the reflections occur on the windshield. It should be kept in mind thatfor the smaller angles, the reflected energy can be greater than the direct energy and thattime-intensity trading is occurring [13], [14]. It has also been observed that the imageblur is frequency dependent as the mid to high frequencies are elevated toward thewindshield (given the speaker directivity) and the mid to lower frequencies appear to staycloser to the speaker position.
As a side note, while investigating interaural ETC's the authors were reminded that boththe left and right ears receive a signal from the closest speaker (left) before the signalfrom the farther speaker (right) arrives. As seen in Graph 10 the crosstalk signal is nearlythe same amplitude and lags just behind the direct signal. It can also be seen that beyondthe initial energy bundle the decay envelope amplitude is greater for the crosstalk signalwhich pulls the image toward the opposite side increasing a lateral image blur. Thelocalization cues are substantially biased toward the near side of the vehicle whichexplains why it is so difficult to produce a well defined and stable virtual sound image inthis environment.
2.3.2 Experiment 2: Boundary Variable = Door & Roof PanelsExperiment 3: Boundary Variables = IP(70 °) & Roof Panel
Spectrally, there's good agreement between the objective and subjective results for thisportion of the experiment. In experiment 2, the combination with the least number ofboundaries (IP with 70°) were preferred overall. In general, the bass drove the preferenceratings because the addition of any boundary substantially reinforced the low frequenciesas shown in graphs 5 and 6. With the addition of the doors there was also an increase inthe mids and treble. The [P/Roof boundaries increased the bass somewhat less than the
doors, and the treble was worse than any other combination given the absorption by the
Page 8

roof padding. The IP/Door/Roof boundaries also added a severe bass resonance andhollow characteristic to the sound quality as the vehicle became more enclosed. It shouldbe noted that some amount of masking may take place for the treble frequencies given thesubstantial bass increase. In experiment 3 the upper door location was generallypreferred and not affected by the windshield addition. The bass contribution caused by
the roof was significant in reducing the overall preference rating.
Spatially the combination with the least number of boundaries (windshield only) waspreferred [15]. The presence of the door boundaries caused the most significant drop inthe spatial quality ratings and the roof made it worse. This can be attributed to theincreased reflection density with each boundary addition and also to the bass energyincrease that occurs when the doors or roof are added or the high frequency decreasewhen the roof is added. This increases the masking of the mid- and high-frequenciescausing a loss of clarity which may reduce the ability to localize. It was also noticed thatwith the addition of the doors the image seemed to spread out laterally and become morediffuse (or blurred). With the addition of the roof, the image was elevated and becamemuch larger.
3 EXPERIMENTAL RESULTS: LOUDSPEAKER LOCATION VARIABLE
3.1 Statistical Analysis & Effects of Subjective Results
3.1.1 Experiment 4: Loudspeaker Location Variable -- IP LocationBoundary Variable = Windshield Angle
ANOVA Table 5 and Means Tables 12, 19, 26, and 33 indicate that for the LoudspeakerLocation Variable of IP Back, the windshield angle of 550 was the most preferred, andthat for the Loudspeaker Variable of IP Forward, the windshield angle of 70° was mostpreferred. The same combinations also had the best Treble Balance and neutral ratingsfor Midrange Balance. There was no effect for Bass Balance. For the LoudspeakerLocation Variable of IP Back, the windshield angle of 55° had the highest Spatial Quality(and the highest Quality of all variables for this experiment). For the LoudspeakerVariable of IP Forward, the windshield angles of 55° and 70° both had the highest SpatialQuality.
Music was the most effective in determining Preference. If there was an effect in TimbralBalance, then music and noise was the best in determining it. Voice and Music was themost effective in determining Spatial Quality.
3.1.2 Experiment 5: Loudspeaker Location Variable = Door Location
ANOVA Table 6 and Means Tables 13, 20, 27, and 34 indicate tile High Door location isprel_rred, has the best Treble and Bass Balance, is neutral in Midrange Balance, and has
Page 9

upper door location is slightly closer to the listener's ears than the IP locations. Theinitial energy bundle has spread out over a 2 ms span, then drops about 15 dB and stays ata fairly constant level for the next 40 ms. There are some high level reflections occurringfrom the door locations at 9 ms intervals which correspond to a lateral reflection betweenthe loudspeaker and doors. It can also be seen that the lower door ETC has a lower initialenergy bundle, but after 12 ms the amplitude increases above all other curves due to thelarge number of reflections.
3.3 Objective vs. Subjective Results
The forward IP location was preferred overall for all combinations and the lower doorlocation had the lowest preference The two door IP locations had a similar responsecharacteristic and sounded similar. It can be seen that for the lower door location, thehigh-frequencies above 2 kHz roll offrapidly. This is due to the severe off-axis conditionfrom the loudspeaker to the ear and absorption by the lower portion of the interior. Theright lower door loudspeaker has more high frequency SPL than the reference becausethere's a direct path from the loudspeaker to the door' and reinforcement by theboundaries. Comparing the two subjectively, the lower door location sounds very dulland diffuse. This is more than likely due to the high-frequencies being masked by thelow-frequencies and some compensation by the reduced left channel high-frequency SPL.The diffuse nature is due to the multiple reflections and high energy density.
4 EXPERIMENTAL RESULTS: DRIVER'S POSITION vs. CENTERPOSITION
4.1 Statistical Analysis & Effects of Subjective Results
4.1.1 Experiment lB: Boundary Variable = Windshield Angle (Center Position)
ANOVA Table 8 and Means Tables 15, 22, 29, and 36 indicate that all windshield anglesare equally preferred except for 70°, which is definitely not preferred. The angle of 55 °had the best Treble Balance (all others were equal). All angles were close to beingneutral with the exception of 70° which had the worst Midrange Balance. There was noeffect on the Bass Balance. The 70 ° angle also had the lowest Spatial Quality. The otherangles were all nearly equal in Quality and equal Experiment 1A's 55° angle for thedriver's position.
Voice was the most effective for determining Preference. There was no Program effectfor Timbral Balance. There was almost not effect for Spatial Quality, except that Musicwas the least effective. The Midrange Balance drove the ratings for the center listeningposition.
Measurements show that the frequency response and ETC's for the center position aresimilar to the left position and there was good agreement between the left and center
Page 11

the best Spatial Quality. Music was the most effective for Preference and TimbralBalance. And Noise was the most effective for Spatial Quality.
3.1.3 Experiment 4/5: Loudspeaker Location Variable = IP & Door Locations
Loudspeaker location data from Experiment 4 and 5 with the windshield angle equal to70° were combined to analyze the effect, in general, of the Loudspeaker Location. Thetrials for the listening test were randomized and the preferences were relative to the.reference for each response, so the data could be combined into a unique experiment.
ANOVA Table 7 and Means Tables 14, 21, 28, and 35 indicate that the IP forward (152mm from the windshield and IP joint) location was preferred and that the Door Highlocation was almost equally preferred. The Door High location had the best TrebleBalance, and both of the IP locations were the same in ranking and second behind theDoor High location. Midrange Balance was neutral for IP locations and a little lackingfor the Door High location. The IP Forward location was slightly preferred for Bass. Themost significant effect in the Spatial Quality is that the Door Low location (457 mm fromthe floor) did not have a high Spatial Quality rating.
Music was the most effective in distinguishing Preference. There was no Program effectsfor the Timbral Balances. Noise was the most effective in determining Spatial Quality.
3.2 Objective Measurements
3.2.1 Experiment 4: Loudspeaker Location Variable = IP Location
Boundary Variable = Windshield AngleExperiment 5: Loudspeaker Location Variable = Door LocationExperiment 4/5: Loudspeaker Location Variable = IP & Door Locations
For this portion of the experiment, the loudspeaker locations were moved to determinethe effects on the sound field. The locations include: Forward IP, Back IP, Upper Doorand Lower Door. The windshield (70°), doors and roof were put in place for all of thesemeasurements.
As seen in Graphs 11 and 12 frequencies below 1 kHz, there is a bass and mid-frequencyincrease, for all combinations compared to the reference. The IP locations have 2-3dBmore bass rise than the doors. The upper door location has the flattest frequency response,while the left lower door locations exhibit a high-frequency roll off above 2 kHz. Theright lower door has more high-frequency output than the reference. There's a 2-2.5 kHzpeak caused by a roof reflection that occurs for all locations except the lower door.
The ETC's for this group (Graphs 13 and 14) exhibit similar characteristics to theprevious experiments. All of the initial energy peaks arrive al approximately the sametime with the exception of the lower door location which arrives about 700 [ts later. The
Page 10

listener locations. The ratings for the center were consistently higher than that of thedriver location because of the symmetrical sound field.
5 SUMMARY
It is the authors' opinion that we have met the goal of this study and have gained a betterunderstanding of the automotive vehicle soundfield. To summarize some of the findings:The center seat location is preferred over the left or right side as expected. For IPmounted loudspeakers, smaller windshield angles (< 55°) and a location closer to thewindshield (forward) is preferred for the best overall results but the upper door was a veryclose second. The door and roof boundaries added substantial bass energy to the soundcharacteristic and were judged the worse for spatial preference. Music was the overallpreference as a program source for testing spectral aspects, but noise, and then voiee, waspreferred for testing spatial aspects. In terms of listener performance there was generallygood agreement among the listeners, but their variance was typically the largest of allvariables. Even though the listeners had the largest variation, there was good agreementamong them for preference and quality rating.
It should be noted that the for most of this study single loudspeaker and ear combinationswere investigated. In practice, there may be several low-, mid-, and high-frequencyloudspeakers located in various areas of the vehicle with different firing angles, grilles,panel resonances etc. With these additional variables, it easy to understand why it's sodifficult to produce a well-balanced and natural soundfield in a automotive vehicle.
This general experiment was the authors' first attempt at quantifying the boundary effectsof an automotive vehicle environment beyond what is known intuitively and fromexperience. For the most part, much more was learned about the methods used and whatto test for than finding new discoveries about the environment. The authors plan tocontinue these experiments to increase the statistical data base.
6 REFERENCES
[1] Soren Beth, "Perception of Timbre of Reproduced SOund in Small Rooms: Influenceof Room and Loudspeaker Position", _ Audio Eng. ,Soc., Vol 42 (Dec 1994), pp. 999-1007.
[2] Soren Beth, "The Influence of the Room and of Loudspeaker Position on the Timbreof Reproduced Sound in Domestic Rooms," in Proc. AES 12th Int. Conf. (Copenhagen,Denmark, 1993 June 28-30), pp. 74-94.
[3] F.E. Toole and S.E. ()live, "The Modification of Timbre by Resonances: Perceptionand Measurement." ._ Audio Eng. Soc., Vol 36, (1988 March) pp. 122-142.
Page I2

[4] S.E. Olive and F.E. Toole, "The Detection of Reflections in Typical Rooms," g. AudioEng. Soc., Vol 37, (1989 July/August)pp. 539-553.
[51 S.E. Oli_'e, P.L. Schuck, S.L. Sally, and M.L. Bonneville, "The Effects ofLoudspeaker Placement on Listener Preference Ratings," d. Audio Eng. Soc., Vol 42,(1994 September) pp.651-669
[6] P.L. Schuck, S.E. Olive, J.G. Ryan, F.E. Toole, S.L. Sally, M.E. Bonneville, K.L.Momtahan, and E.S. Verreanlt, "Perception of perceived Sound in Rooms: Some Resultsof the Athena Project," ," in Proc. AES 12th Int. Conf. (Copenhagen, Denmark, 1993June 28-30), pp. 49-73.
[7] Sean Olive, "A Method for Training Listeners and Selecting Program Material forListening Tests," Presented at the 97th Cony. of the AES , San Francisco, (1994November), Preprint 3893.
[8] Soren Beth, "Selection and Training of Subjects for Listening Tests on Sound-Reproducing Equipment," d. Audio Eng. Soc., Vol 40, (1992 July/August) pp. 590-610.
[9] F.E. Toole, "Binaural Record/Reproduction Systems and Their Use in PsychoacousticInvestigations," presented at the 91st Convention of the Audio Engineering Society, J.Audio Eng. Soc. (Abstracts), Vol 39, (1991 Dec.), Preprint 3179 p. 1005.
[10] D.H. Cooper and J.L. Bauck, "Prospects for Transaurai Recordings," g. Audio Eng.Soc., Vol. 37, (1989 Jan./Feb.) pp. 3-19
[11[ H. Wallach, E.B. Newman, and M.R. RosenZWeig, "The Precedence Effect in SoundLocalization,",/.. Audio Eng. Soc., Vol. 21, 0973 Dec)
[12] Glen Ballou, Handbookfor $oundEngineers, (Howard W. Sams & Company, 1987)
[13] Jens Blauert, Spatial Hearing, 0974); transl, by John S. Allen (M.I.T. Press,Cambridge, MA., 1983)
[14] E.C.Carterette, M.P.Friedman, Handbook of Perception, Vol. IV Hearing,(Academic Press Inc., 1978)
[151 William Neal House, "Aspects of the Vehicle Listening Environment," presented atthe 87th Convention of the Audio Engineering Society, New York (1989 Oct.), Preprint2873
Page 13
I_11111111111111111_1_11111_4
.......1_lll_1411.1xl
.
d_llllll41_1
IIIIII/111_
4il_llllJ_llJIJ_lllJJJJ/
JIJIIl_JIJl_lI
I/_
!i_l_llll_lllll_lllll_l.l_l_l
_1411711i1_1I
.4_._l'!,i
kl_lll.lilll.I
1/111111111.I
I/_{_
BIoIIlIlIIlI[III
Illl[/I
__
__ltlllllll
IIIIIIII1-1-1-1_111.
:_,_.il'._i
iI!
_111111111111111111IIIIIIII1.1_1.-I_
I_'ii
/+111-1_1_1_1_1_1_1.111_1.1-1_11
tII....
JI
I-
I_i
It-I-I-I.
I-I.I_!_
i_III+
III_IIIII-IHIII-IH
-III-IHIIIIII-I-
4--I
_4-_
;_111II_llllll'lllllll
I_I_
./
1J1
Page14

IllustraUon 1. Panel Combinations for Boundary Effects Experiments.
I 1524mm go o
T ; ? 70° i'_"ml--*-_I e ,_7..NXl
I""_"'r 1.76.. I i %_t,I 180°
1 I "L (InstrumentI_anelSideView)I Listener--Elev'--afion-1143mm
I_--3o5mm---_
(InstrumentPanel& DoorLoudspeakerPlan View)
Illustration 2. Dimensions of Listening Position & Angle Reflections.
Page 15

ANALYSIS OF VARIANCE
,EXPERIMENT: lA Pref Ratlng Treble Balance Vlldranga Balanct Been Balance Spatial Quality
Sourceof Variation F Si_ of F F Sig of F F Sig of F F Sig of F F ISIgof F
LISTENER 6.93 0.010 8.74 0.00,_ 7.98 0.097 22,58 0.00O 12,84 0.002
BNDVAR, 5.54 0.097 2.91 0.20._ 14.60 0,027 0.24 0.862 10.36 0.043
PROGRAM 2.07 0.283 2.58 0.226 3.26 0,179 3.57 0.162 1.14 0,459
LISTENERBY BNDVAR. 2.39 0.026 2.14 0,044 1.79' 0.095 1.29 0.287 2,61 0,016
LISTENERBY PROGRAM 2.62 0.016 2.27 0.034 1.99 0.062 2.41 0.025 0.81 0.683
BNDVAR. BY PROGRAM 1.05 0.472 3,96 0.026 2,01 0,156 4.22 0.022 1.45 0.294
LISTENERBYBND VAR. BY 2.31 0.001: 1.97 0.004 1.03 0.448 1,53 0.048 1.67 0.022PROGRAM
TABLE 2. ANALYSIS OF VARIANCE. EXPERIMENTIABOUNDARY VARIABLE =WINDSHIELD ANGLE
ANALYSIS OF VARIANCE
EXPERIMENT: 2 Pref Rating Treble Balance Aldrange Balance BaseBalance SpatiaIQuallty !
Sourceof Variation F Si_of F F Sig of F F Si_ of F F Sig of F F Sig of F
LISTENER 48.54 0,00C 11.04 0.005 22.30 0.001 47,96 0.000 8_60 0.010
BNDVAR. 18.51 0.019 8,75 0.054 7,94 0.06t 14.67 0.027 27.45 0.011
PROGRAM 12.07 0.035 0,78 0.580 4.68 0.113 1.98 0_295 6,90 0.073
LISTENERBY BNDVAR. 1.60 0.164 3.45 0.006 3,30 0.099 4.14 0.002 9.98 0.000
LISTENERBY PROGRAM 5.33 0.00G 1.18 0.363 I 96 6.08Z 2.46 0.632 1.27 0.307
ENDVAR. BY PROGRAM 3.42 0,041 1.42 0,305 3.73 0031 8.90 0.007 3.77 0,030
LISTENERBY SNDVAR. BY 0.80 0.788 1.69 0.597 1.05 0,433 1 20 0.257 0.91 0.639PROGRAM
0.80 0.535(Greenhouse-Geisser)
(Huynh'Feldt) 0.80I
TABLE 3. ANALYSIS OF VARIANCE. EXPERIMENT2BOUNDARY VARIABLE = DOOR & ROOF PANELS
Page 16

ANALYSIS OF VARIANCE
EXPERIMENT: 3 Pref Rating Treble Balance Mldrange Balance Balls 13alance Spatial Quality
Source of Vadatlen F Sig of F F Sigof F F SIgof F F SI0of F F SIgof F
LISTENER 39.30 0.001 4.93 0.052 35,8' 0.001 45.13 0.000 1.74 0.279
(Greenhouse-Gelseer) 35.51 0.106(Huynh-Feldt) 35.5'
BND VAR, 81.83 0002 1.46 0.382 1.35 0.406 0.60 0.666 5,24 0.104
PROGRAM 22,50 0,015 2,58 ().228 6.49 0.080 27,43 0,011 3,48 0.167
LISTENERBY BNDVAR. 1.75 0.146 1,16 0.390 2.40 0.050 1,78 0.139 2.90 0.024
LISTENERBY PROGRAM 12.02 0.000 5,08 0.002 3.63 0,009 6.96 0.0OC 3.18 0.016
BNDVAR. BY PROGRAM 2.29 0.116 1.06 0,466 2.16 0,133 3,07 0,065 0.61 0.619
LISTENERBY tiND VAR, BY 1.92 0.016 9.70 0.882 1_12 0.352 1.60 0105_ 0.90 0.632IPROGRAM
TABLE 4. ANALYSIS OF VARIANCE. EXPERIMENT3BOUNDARY VARIABLE = IP (_70 °)& ROOF PANEL
ANALYSIS OF VARIANCE
-'XPERIMENT: 4 Pref Rating Treble Balance _lldrange Balance Balls Balance Spatial Quality
_ource of Variation F Sig of F F Sig of F F Si9 of F I_ Sig of F F Sig of F
LISTENER 29.44 0.003 6.70 0.046 24.60 0.004 100.99 0,O0C 6,56 0.04a
/ARIABLES 16.43 0.091 0.87 0,671 23,18 O.00[ 1.84 0.216 3.86 0.05_
PROGRAM 1.36 0.402 6.06 0.087 11.31 0,03E 17.81 0.020 20.51 0.017
LISTENERBYVARIABLES 1.30 0.248 1.45 0.167 1.19 0.33." 3,35 0,001 0.93 0_E79
LISTENER BYPROGRAM 1.18 0.387 5.28 0.004 6.81 0.001 3.36 0.023 2.60 0.05S
/ARIABLES BYPROGRAM 1.62 0,140 1,16 0.36.t 1,23 0.31_ 0,82 0.670 1.48 0,187
LISTENERBY VARIABLES 1,00 0.4961 1,14 0,27S 2.07 0.001 1,10 0,327 1,03 0,440PROGRAM
TABLE 6. ANALYSIS OF VARIANCE. EXPERIMENT4LOUDSPEAKER LOCATION VARIABLE = IP LOCATION
BOUNDARY VARIABLE -- WINDSHIELD ANGLE
Page 17

ANALYSIS OF VARIANCE
EXPERIMENT: 6 PrefRating TrebleBalfance 61drangeBalance Bl$11Balarlce 8pafiallQuallty
Sourceof Variation F Sio of F F Sig of F F SI;]of F F $1_of F F Si_ of F
LISTENER 16.15 0.001 12.09 0.002 11.88 0.002 35.58 9.O0O 1.49 0.293(Greenhouse-Geisser) 16.16 0.019 12.OS 6.063 11.88 0.067 35.58 0.012 1.49 0.338
(Huynh-Feldt) 16.18 0.001 12.0S 0,037 11.88 0.046 35.58 0.000 1.49 0.293
LDSISKRLOC VAR. 768.68 6.001 2883.0C 6.000 281.54 6.004 48.00 0.020 256.06 6.004
PROGRAM 2.12 0.198 8.58 9.014 9.96 0.019 51.19 0.0OO 2.81 6.130
(Greenhouse~Geisser) 2.13 0.262 8.68 0.081 6.96 0.036 61.19 6.017 2.81 0.224(Huynh-Feld0 2.13 0.168 8.58 0.037 9.96 0.010 51.19 0.011 2.81 0.186
LISTENERBYLDSPKR 10.22 0.003 7.16 0.006 4.67 0.031 4.80 0.029 11.15 0.002LOC.VAR.
(Greenhouse-Geisser) 10.22 0.041 7.18 0.104 4.67 ().137 4.80 0.121 11.15 0.028(Huynh*Feldt) 10.22 0.003 7.18 0.071 4.67 0.067 4.80 0.029 11.16 0.002
LISTENERBYPROGF_M 0.72 0.7Ol_ 1.24 0.315 3.43 0.005 4.06 0.002 1.28 0.292
(Greenhouse-Geisser) 0.73 0.624 t.24 0.382 3.43 0.137 4.06 0.141 1.28 0.373(Huynh-Feldt) 6.73i 0.695 t.24 0.315 3.43 0.005 4.06 0.031 1.26 0.202
LDSPKRLOC VAR. 4.40 0.05u 0.TU 0.647 0.64 0.616 0.88 0.504 2.70 0.139BYPROGRAM
(Greenhouse-Geisser} 4.40 0.117 0.58 0.576 0.64 0.572 0.88 0.449 2.70 0.219(Huynh-Fe[dt) 4.40 0.058 0.58 0.647 0.64 0.616 0.86 0.451 2.70 0.139
LISTENERBYLDSPKR LOC 1.30 0.281 0.56 0.551 2.25 0.043 1.77 0.113 1.14 0.379VAR. BYPROGRAM
(Gmenhouse-Geisser) 1.36 0.37C 6.55 0.604 2.26 0.224 1.77 0.294 1.14 0.405(Huy,qh-Feldt) 1.30 0.32(] 0.56 0.851 2.25 0.043 1.77 0.167 1.14 0.392
TABLE 6. ANALYSIS OF VARIANCE. EXPERIMENT 5LOUDSPEAKER LOCATION VARIABLE = DOOR LOCATION
Page 18

ANALYSIS OF VARIANCE
EXPERIMENT: 418 Pref Rating Treble Balance Mldranga Balance Baaa Balance Spatial Quality
Sourceof Variation F Si_lof F F Si_ of F F Sl_ of F F Si;I of F ! F SI9of F
LISTENER 22.78 0.906 11.71 0.018 7.83 0.036 62.98 0.80( 2.47 0.201
LDSPKR LOC VAR. 219.55 0.001 46,66 0.005 11.74 0.036 8.48 0.066 4.85 0.114
PROGRAM 8,33 0.807 8.33 0.058 11.56 0.037 117.69 0.001 0.77 0.584
LISTENERBY LDSPKR 3,84 0.914 2.72 0.048 3.68 0.016 3.68 0.81( 1.24 0,356.OC. VAR.
LISTENERBY PROGRAM 0.98 0,815 0.80 0.647 5.11 0,004 2,36 0.075 2.33 0.079
LDSPKR LOC VAR. 2.41 0,103 2.37 0.198 1.90 0.176 1.25 0.374 1,67 0.2303Y PROGRAM
LISTENERBY LDSPKR LOC 1.65 0,069 1,28 0.230 1,14 0.345 2.03 0.018 0,80 0.742JAR. BY PROGRAM
TABLE 7. ANALYSIS OF VARIANCE. EXPERIMENT4/5LOUDSPEAKER LOCATION VARIABLE = IP & DOOR LOCATIONS
ANALYSIS OF VARIANCE
EXPERIMENT: IB Pref Rating Treble Balance Mldrarlge Balance Baas Balance Spatial Quality
Eourceof Variation F Si_ bf F F Si_l of F F Sigcf F F Sig of F F Sig of F
LISTENER 9.60 0.007 4.57 0.043 21.91 0.091 23.50 0,001 4.12 0.054
BNDVAR. 7.50 0.066 51.53 0.004 174.16 0.001 1.63 0.349 7.62 0.066
PROGRAM 5.50 0.098 6.62 0.077 4.24 0.133 1.29 0.419 10.76 0.041
LISTENERBY SNDVAR, 1.87 0.097 2,10 0.062 1.97 0.079 1.56 0.177 1.20 0.353
LISTENERBY PROGRAM 2.79 0.016 1 49 0.203 2.18 0.056 1.95 0.092 2.54 0.027
BND VAR BYPROGRAM 0.97 6.516 2.62 0.084 O61 0 765 9 91 0.553 0.90 0.558
LISTENERBY BNDVAR, BY 1 31 0.162 0.90 0.847 1 46 0.084 0,89 0.672 1.01 0.490PROGRAM
(Greenhouse-Geiaser) 1 31 O457(Huynh-Feldt) 1 31
I
TABLE 8. ANALYSIS OF VARIANCE. EXPERIMENTIBBOUNDARY VARIABLE = WINDSHIELD ANGLE (LISTENER@ CENTER POSITION)
Page 19
OVERALL RESULTS
Experiment lA-8
._ -18
_ -15o
T>
..4 -1.8
_ -1.8
m -2.0
-22§5o 7()o 88o 1880
Windshield Angle
Effect. Windshield Angle
Dependent: Preference Ratmg
CHART 1.
OVERALL RESULTS
Experiment lA-§
cm -.6
-1,0
-1.2Q.
_ -1.4-1,6.J
-1.8oO
-2.[1
_ -22
-24
Vome Music Noise Drum Kit
Program
Effect Program
Dependent Preference Rating
CHART 2.
Page 20
ALSr__t:MI:N I AMONG LISTENERS
ExperimenttA
I,_' I ' IIp T Wind Affgle
_o .,,, j, ]3,
_r_ 100 _00 300 460 500 6O9 I 700 / 800 I [] 100°
LISTENEREffect Lis_ner ' Windshield Angle
Dependent: Preference Ratmg
CHART 3,
EFFECTS OF PROGRAM ON LISTENERS
Experiment lA
_1_ _,:_.mlm_"ir'._i_,._I_:._I°_....e,4 '1 I I I I I ._,1 I[.°,-
I I I I I I I I I lO_ -0_ Iq DrumKit
1 06 00o 3 06 4 60 5 oo 6 00 ? 00 000
LISTENEREffect Lismener ' Program
Dependent Preference Radng
CHART 4.
INTERACT ION WITH PROGRAM
Experlmen! lAI i i ii.
'-trw
'_ _Vlnd Angte
_- ';'*:"T_.t{ ' : '--" -'-. ..;., .I., .: .dr..llll. _ lEOo
Vo_cce Music Nui_e Orum YJI
ProgramEffec[ Wllldshleld An6re ' Pio_ranl
Dependent Preference Rabr_g
CHART 6.
Page 21

OVERALL RESULTS
Experiment lA-.4
fil _.8
' T-i .2>
-1.4
i=o -I.6
-1.e
.2.0 ,·
Windshield AngleEffect: Windshield Angre
Dependent: Treble Balance
CHART 6.
OVERALL RESULTS
Experiment lA-.4
_ -.0t
' T TI-..-
· -1.2,...I
'_ -1.4o(g
-1.§
-1.B
Voice Music Noise...... DrumKit
ProgramEffect. Program
Dependent Treble Balance
CHART 7.
Page 22
AGREEMENT AMONG LISTENERS
Experimnnt IA
T, I_ ' '.-"i1'',_.,T W,BdABgl,
'X8
1 00 2 00 3 0O 4 00 6 O0 [T0 ? 0D
o
LISTENEREBecL Listener ' Windshield Angle
OependenL Treble Balance
CHART 8.
EFFECTS OF PROGRAM ON LISTENERS
ExperimentlA
._ I i, Program
I 3P.:'_.=I I [ a,-I I ; I I_! i.'. 1<5.....
!' I .... "1_., Ag......O_ 1 O0 _,00 3,00 4.00 5 00 8 OO 7 O0 800
LISTENEREffect Listener' Pregram
IDependen£ Treble Balance
CHART 9.
INTERACTION WITH PROGRAM
°e 1 ExperimentIA
i _ iii II
. -1 . I.iI?lllml., .,. Wind Angle
_" T_..g.,t :j. "r?' ,_.2,.L..'.;., .g-"-"' . ,_." z.-:,tj' o...g: ' , _ ,oo-3i
8 :: a., _>°govoice Music Noi_e Drum mt
ProgrnmEflecl Windshmld Angle ' Program
Dependent treble Balance
CHART t0.
Page 23
OVERALL RESULTS
Experiment lA1.0
-1'.50 i
0.O
-,5
Windshield AngleEffect: Windshield Angle
Dependent: Mldrange Balance
CHART 11.
OVERALL RESULTS
Experiment lA
Voice Music Noise Drum Kit
ProgramEffect Program
Dependent' M_drangeBalance
CHART 12.
Page 24

AGREEMENT AMONG LISTENERS
oe ExperlmentIA."0
T_...mi, I I'' ' Wind Angle._ .['±_. r ::.. ,_o°lt".+z tfk,.IIT I -o
, -4! 1.00 I 200 I 300 I 400 J 5,00 I 800 I 730 ! [] 180o
LISTENEREffect Listener · Windshield Angle
Dependan_ Mtdrenge Balsnce
CHART 13.
EFFECT OF PROGRAM ON LISTENERS
ue ExperimentIA
,I,_l_ _,1' *ll'i i . ,' Program
=_ | .I;<_ | ' .., {_' ':T i [] v........ , " ,'! _."' l;..._-,! _1 I &l I'"'_1 J'' I'LlTIl_gi I:_-'1"'1 I I I I I"'1_.' I._"....
-3 ! I / I I I I / _ rum i
200 3.00 400 7.0D I N D Kt1.00 g0O 000 3.00
LISTENEREffect Listener * Program
Dependent Midrange Balance
CHART 14.
INTERACTION WITH PROGRAM
es ExperimentIAc:
i
....... T'""'_"T{ w,,dA.g,..,_ ...T '! ["T' - ..... []-o
" i J. '""_' _l: ''=''_,_0.oo .,. J..
Voice Music Nmse Drum Kit
ProgramElfect WlndShle_ Angle ' Program
OeDandenL Mldrange Balance
CHART 16.
Page 25

OVERALL RESULTS
Experlment lA'(.0 "'
ffi ,§
e
_> .4J
_ 0.0 ....
55° 7b° gl ° 1BO°
WIndshield AngleEffect: Windshield Angle
Dependent: Bass Balance
CHART 16.
OVERALL RESULTS
Experiment lA1.0
TTTfill
Tm_ .6 .
o
O ,2
0,0
Voice Music Noise Drum Kit
ProgramEffect' Program
Oependent Ba_s Belaoce
CHART 17.
Page26

AGREEMENT AMONG LISTENERS
Experlm ent 1A_3
_, 2 ,., . ...... 3'
· · · ,t ii- ;, ," ·_a ·
_. o
_ g,,°03 1{)0 2 0o 3 0o 400 500 6 00 7oo 89o
LISTENEREffect Listeners' WindshieldAngle
DependentBassBalance
CHART 18,
EFFECT OF PROGRAM ON LISTENERS
ExperlmentlA
':' a, _'-"' '"':T '<_ '_ '°_" ' ' :i' "'_ "'',_1 Program
: I -_1I "'1 I I+tfl It'"'1I_M.,_'_ , i · ....8-gl I I I I I:.':1 I · I_.o,-1 OD 200 3 00 4 DO 5.00 8.0D 7 0D 80O
._-A I I I I I [ t Io .......!
LISTENER
Effect Listeners'Program
DependentBassBalance
CHART 19.
INTERACTION WITH PROGRAM
ExperimentIA
t,u. I ,'a :,_,.J., ;'
.,,._........... .,.,..,.. o,8o_. .L -" _'°°(..3 .i, 'v 9o°
_._ =_....o) Voice Music Noln Drummt
ProgramEffectListeners' Program
Oependent10assBalance
CHART 20,
Page 27

OVERALL RESULTS
Experlment lA18.2
i 8,0O 5.8
m 5,g
09 5.4
> 5.5'
_ 5.o_48
_ 4.[1m 44
55° 7_]o gdo 1eOo
Windshield AngleEffect Windshield Angle
DependenL Spatial Quality
CHART 21.
OVERALL RESULTS
Experiment lA5.8
:>.,
T§ 6.B T
O
5,4
--(_,5.2 T
> 5.0,..J
_ 4.8
4.B
44
Voice Music No/se Drum Kit
ProgramEffect Program
Dependent Spatial Quality
CHART 22.
Page 28
AGREEMENT AMONG LISTENERS
,_ Experiment la
. o fl
7 jT :., T_ii' Wind Angle
_, · ,.T .;. ,';T , _' ::' T _"°
· !m 2 _ leoo03 I O0 ;_0O 30O 4,00 GeCl 6 [10 700 8130
LISTENER
EffectListeners' Windshield
Dependent$paUalQuall_
CHART 23.
EFFECT OF PROGRAM ON LISTENERS
Experiment la
? i t "' , Pro ra
_ ':' '<_i . ¢ ,-T I ,"T ' ; · _: T .'-.'T D vol_.
*_ J, "' MI. _ Mb-''l l""84 I t I I I"'lJ I,," I_.....4 ,.,0I ooI 00I .... ICl I o I o I :' I=_.......
LISTENER
Etteccbstener$· Program
OependenL$paUIIC_Jahtv
-CHART 24.
INTERACTION WITH PROGRAM
ExperimentlA="
T' w,..̂ ..,.
-L.ili '. ;.: '. .-:.!..j.. -L,.t4.. _ 'Cl°J...... i.. _>.cl.
tO j
O3 Voice Music NoI_ DrumKit
Program
ElfeclWInd_hfeldAngle·Program
DependentSplmustQulh_
CHART 26.
Page 29

OVERALL MEANS TABLE
Pref TBalance MBalance BBalance SpatialQualityEXPlA Mean 95%CL Mean 95%CL Mean 95% CL Mean 95%CL Mean 95% CL
Listener1 -2.14 0.38 -2.23 0.38 -0.38 0,40 0.54 0.30 5.08 0.30Listener2 -1.84 0.26 -0.96 0.26 0.96 0.42 1.28 0.28 4.83 0.26Listener3 -1.69 0.34 -0.94 0.22 0.06 0.30 0.23 0.22 4.92 0.30Listener4 -0.93 0.36 -1.59 0.26 1.56 0.44 0.84 0.22 5.72 0.64Listener5 -0.83 0.38 -1.09 0.14 -0.19 0.24 0,44 0.20 6.50 0.44Listener6 -0.40 0.70 -0.25 0.66 O.63 0.62 -0.44 0.481 5,34 0.60
i
I
Listener7 -2.01 0.44 -0.22 0.24 0.19 0.62 0.97 0.30 4,56 0.35Listener8 -1.31 0.38 -1.75 0.60 -0,94 0.50 0.25 0.60 4.75 0.62
WindshieldAngle55° -1.21 0.34 -0.96 0.32 0,53 0.34 0.51 0.2(] 5.82 0.34WindshieldAngle70o -1.61 0,30 -1,07 0,26 0.43 0.36 0.41 0.24 5.05 0.30WindshieldAngle900 -1,40 0.28 -1.24 0,26 0.20 0.34 0.63 0.24 5.11 0.28WindshieldAn_lle1800 -1.67 0.32 -1.41 0.34 -0.22 0.34 0.59 0.28 4.91 0.34
Voice -1.12 0.34 -1.13 0.26 0.36 0.32 0.50 0.22 5.29 0.32Music -1.44 0.30 -0.85 0.32 0.24 0.36 0.67 0,28 4.97 0.32
Noise -1.50 0.30 -1.34 ' 0.34 0.39 0.36 0.81 0.26 5.36 0.36DrumKit -1.83 0,30 -1.32 0.24 -0.05 0.36 0.37 0.28 6.17 0.28
TABLE 9
Pref TBalance MBalance BBalance SpatialQualityEXP2 Meani 95% CL Mean 95% CL Mean 95% CL Mean 95%CL Mean 95% CL
ListenerI ~2.92 0.34 -2.42 0.3C -0.98 0.32 1.50 0.28 4.73 0.3_Listener2 -2,61 0.38 -1.29 0.24 1.33 0.32 1.38 0.32 4.13 0.2;eListener3 -1,55 0.26 -1.06 0.2C 0.17 0.28 0.90 0.34 4.65 0.3CListener4 -2.28 0.44 -1.81 0.28 1.22 0.50 1.06 0.26 4.09 0.3EListener5 -1.10 0.38 -1.78 0,24 -0.94 0.52 1.38 0.36 4.94 0.52Listener6 -0.49 0.84 -0.88 0.44 -O.16 0.70 -0,88 0.38 5.0(] 0.44Listener7 -2.89 0.34 -0,66 0.38 -0.34 0.58 1.38 0.32 4.34 0,24
IP(70°)w/o Drs& Roof -1.69 0.32 -0,97 0.26 0.60 0.3_ 0.49 0.24 5.01 0.28IP(70°)wi Doors -2.08 0.42 -1,41! 0,28 -0.25 0.38 1.19 0.26 4,34 ' 0.24IP(70°)wi R_oof -2,19 0.36 -1,72 0.2(] 0.06 0.36 0.97 0.30 4.57 0.3(]IP(70°)wi Dm& Roof -2.22 0.40 -1.68 0.22 -0.15 0.42 1.40 0.34 4.25 0,28
Voice -2,29 0.32 -1,47 0.22 0.15 0.46 0.69 0.24 4.53 0.30V[usic -1.47 0.46 -1.40 0.2e 0,04 0.36 1.25 0.38 4.66 0.28
Noise -2.47 0,32 -1.52 0.28 0.31 _ 0,38 1.04 0.26 4,34 0.30DrumKit -1.94 0.34 -1.40 0,24 -0.24 0.34 1.06 0.32 4.65 0.28
TABLE 10
Page 30

OVERALL MEANS TABLE
Pref TBalance MBalance BBalance Spatial QualityEXP 3 Mean 95% CL Mean 95% CL Mean 95% CL Mean 95% CL Mean 95% CL
Listener I -3.47 0.3C -1.15 0,24 -0.77i 0,48 2.23 0.20 3.46 0.28
Listener 2 -3.53 0.28 -1.52 0.16 1.92 0.44 1.92 0.30 3.94 0.18Listener 3 -2.43 0,28 -0,81 0.121 -0.77 0,22 0.35 0.22 4.19 0.22
Listener 4 -2.17 0,48 -2,00 0,201 0.94 0,78 1.97 0.44 4.28 0.80
Listener 5 -1.67 0,32 -1,28 0.161 -1.69i 0.32 1.69 0,36 4.09 O.3eListener 6 -0.04 1 .oc -1.25 0,40' 0.28 0,88 -0.81 0,50 4.88 0.42
Doors w/o IP (70°) & Re( -1.81 0.52 -1.32 0,18 -0.32 0.48 1.13 0.34 4.33 0,32
Doors wi IP (70 °) -2.12 0.44 -1,37 0.20 0.07 . 0,48 1.15 0.38 4.28 0.28Doors w/Roof -2.83 0.44 -1,17 022 0.05 0,58 1.50 0,34 3.93 0.24
Doors w/IP (70 °) & Roof -2.80 0.38 -1.35 0.20 0.25 0,58 1.33 0,42 3.78 0.22
Voice -2.42 0.48 -0.87 0,20 0.42 0.56! 0.92 0.32 3.90 0.25Music -1.90 0.54 -1.58 0.18 -0.87 0.32 1.87 0.50 4.23 0.22
Noise -2.53 0,38 -1.32 0,20 -0.02 0.50 1.23 0.32 4.30 0.38Drum Kit -2.77 0,42 -1.43 0,18 0.52 0.52 1.10 0.30 3.90 0.32
TABLE 'Il
Pref TBalance MBalance BBalance Spatial QualityEXP 4 Mean g5% CL Mean 96% CL Mean 95% CL Mean 95% CL Mean 95% CL
Listener I -4,45 0.18 -2.13 0.24 -0.77 0.24 2.78 0.20 3.80 0.26Listener 2 -3.84 0,18 -1.73 0,12 0,59 0.48 2.33 0.18 4.00 0.04
Listener 3 -2.96 0.28 -1,19 0,10 -0.75 0.18 0.84 0.16 3.92 0.2(]Listener 4 -2.7g 0.20 -2,09 0,14 0.20 0.34 1.11 0.20 4.08 0.30
Listener 5 -1.53 0,14 -1,56 0,14 -1.20 0.t8 1,41 0.14 4.44 0.24
IP Back 55o -2,91 0.38 -1.58 0.18 -0.08 0.40 1.65 0.28 4.30 0.32
IP Back 70° -3,01 0.48 -1.70 0.20 0,00 0.42 1.68 0.34 4.18 0.30IP Back 90° -3.14 0.48 -1,78 0.20 -0.57 0.44 1.73 0.36 4.05 0.30
IP Back 180° -3.3g 0.34 -1.83 0.28 -0.90 0.42 1.78 0.32 3.93 0.32IP Forward 55° -3.05 0.38 -1.78 0.22 0.03 0.48 1.68 0.38 4.18 O.3C
IP Forward 70° -2.71 0.38 -1.65 0.20 0.08 0.40 1.53 0.30 4.18 0.24IP Forward 90° -3.1§ 0.48 -1.70 0.22 -0.57 0.42 1.75 0.32 4.05 0.22
IP Forward 180 (' -3.52! 0.34 -1.95 0.24 -1.05 0.42 1.80 0.34 3.55 0.26
Voice -3.10 0.2_ -1.61 0.14 0.13 0.34 1.30 0.16 4.22 ' 0.18
Music -3.29 0.21_ -1.86 0.16 -1.05 0.22 2.13 0.22 3.81 0.18
Noise -3.02 0.28 -1.89 0.18 -0.29 0.30 1.83 0.28 4.35 0.28Drum Kit -3.04 0.38 -1,60 0.14 -0.33 0.32 1.53 0.20 3.80 0,22
TABLE 12
Page 31

OVERALL MEANS TABLE
___ Pref TBalance MBalance BBalance Spatial QualityEXP 5 Mean 95% CL Mean 95% CL Mean 95% CL Mean 95% CL Mean 95% CL
.lstener 1 -4.64 0.18 -2.25 0.64 -2.64 0.52 2.29 0.28 3.92 0.44
Jstener 2 -3.69 0.26 -1.71 0.3(3 0.88 0.78 3.08 0.52 3.38 0.36-tstener 3 -3,06 0.36 -0.92 0.28 -1.21 0.28 0.75 0.18 3.33 0.3_2,
.[stener 4 -3.11 0.5(3 -3.03 0.38 -0,38 0.68 1.97 0.30 3.66 0.5t
Jstener 5 -1,92 0.28 -1.78 6.4(} -1,97 0.38 1,28 0.30 3.84 0.32
Door High -2.75 0.28 -1.24 0.22 -0,56 0.40 1.74 6.26 4.10 0.24Door Low -3.64 0,30 -2.75 0.28 -1.59 O.4C 1.96 0.28 3.18 0.20'
Voice -3.07 0,46 -1.56 0.42 -0.82 0.781 1.12 0.40 3.65 6.30',4usic -3.43 0.46 -2.32 0.40 -2.00 0.361 2.65 0.42 3.47 9.44_loise -3.08 0.44 -1.88 0,46 -0.50 ().681 2.00 O.28 4.00 9.4¢
]rum Kit -3.19 0.46 -2.21 0.44 -0,98 0,54 1.62 0.26 3.44 0.38
TABLE 13
Pref TBalance MBalance SBalance Spatial QualityEXP 415 Mean 95% CL Mean 95% CL Mean 85% CL Mean 05% CL Mean 95% CL
Listener 1 -4.43 0.24 -2.23 0.40 -1.81 0.50 2.42 0.22 3.88 0.32Listener 2 -3.76 O.14 -1.68 0.20 0.98 0.58 2.75 0.38 3.63 9.24
Listener 3 -2.82 0.3(3 -1.05 0.18 -0,90 0,22 0.75 0,18 3.60 0.28
Listener 4 -2.92 0.38 -2.71 0.28 0.02 0.48 1.83 0.26 3.85 0.42Listener 5 -1.73 0.22 -1.60 0.28 -1,56 0.30 1.33 0.22 4.15 0.3(}
IP Back -3.(31 0.4(3 -1,70 0.20 O.00 0.42 1.68 0.34 4.15 0,3(}IP Forward -2.71 0,38 -1.65 0.20 0.08 0,40 1.63 0.30 4.18 0.24
Door High -2.75 0.28 -I.24 9.22 -0.56 0,46 1.74 0.26 4.10 0.24Door Low -3.64 0.3(3 -2.75 0.28 -1.59 0.40 1.06 0.28 3.18 0.28
Voice -3.06 0.34 -1.54 0.28 -0.37 0,56 1.13 026 3.91 0.24Vlusic -3.17 0.34 -2.19 020 -1.48 0.32 2.44 0.34 3.74 0.34
Noise -3.04 0,34 -1,83 0.30 -0.22 0.48 1.94 026 4.04 0.28Drum Kit -3.00 0.38 -1.94 0.32 -0.58 0.44 1.50 0.22 3,85 0.28
TABLE 14
Page 32

OVERALL MEANS TABLE
Pref TBalance MBalence BBelance Spatial Quality
EXP lB -- Mean 95% CL Mean 95% CL Mean 95% CL Mean 05% CL Mean 95% CL
Listener I -0,67 0.52 .0.71 0.32 -0.64 0.36 1,02 0,2(; 5.85 0.28
Listener 2 -1.54 0.26 -0.08 0.20 1.40 0.38 0,71 0.18! 4.44 0.22Listener 3 -1.78 0.22 -0.13 0.16 0.15 0.22 0.33 0.14 4.23 0.20
Listener 4 -1,14 0.42 -0.50 0.26 1.72 0,74 1.13 0,26, 5.97 0.66Listener 5 -0.76 0.38 -0.31 0.24 -0.31 0,36 0.97 0.14 6.47 0.46
Listener 6 -0.70 0,84 -0.22 0.38 0.78 0,72 -0.78 0.58 5.81 0.50Listener 7 -1.92 0,40 ~0.50 0.24 -0.72 0.50 0.97 0.30 5.00 0.46
Windshield Angle 55° -1.64 0.32 O.OO 0.20 0.38 0.40 0.66 0.24 5.66 0.34
Windshield Angle 70° -1.83 0.32 -0.21 0,18 1.32 0.44 0.54 0.24 4.84 0.34
Windshield Angle 90° -1.13 0.36 -0.43 0.20 0.22 0.36 0.51 0.28 6.22 0.30Windshield Angle 180Q -0.87 0.38 -0.74 0.22 -0.18 0.30 0.81 0.20 5.49 0.36
Voice -0.85 0.34 -0.40 0.16 0.38 0.34 0.78 0.20 5.40 0.34
dusic -1.41 0.42 -0.50 0,22 0.79 0.46 0.54 0,30 4.88 0.38_loise -1.28 0,28 -0.29 0,22 0.32 0.36 0.66 0.22 5.57 0.34
;)rum Kit -1.33 0.36 -0.18 0.20 0.25 0.40 0.54 0.24 6.34 0.28
TABLE 15
Page 33
LISTENER * VARIABLEMEANS TABLE
Pref TBalance MBa[ance BBalance Spatial QualityEXP IA Mean 95% CL Mean 85% CL Mean 95% CL Mean 95% CL Mean 65% CL
Listener t VVlndshleldAngle 55° -1.29 0.48 -1.67 0.52 0.00 0.74 0.58 0.52 5.75 0.58
Windshield Angle 700 -2.09 O.G; -2.25 0.56 -1.00 0.74 0.67 0.68 5.25 0.58Windshield Angle g0° -2.45 0.82 -2.58 0.80 0.17 0.94 0.75 0.68 4,83 0.64Windshield Angle 180° -2.74 0.88 -2.50 o.g0 -0.67 0.68 0.17 0.64 4,50 0.52
Listener2 Windshield Angle 55° -1.73 0,5C -1.00 0.60 1,0O 0.7C 1.50 0,58 5.00 0.56
Windshield Angle 70" -1.85 0.74 -0.67 0.56 1,00 0.9; 0.83 0.74 4.59 0,52VVlndshieldAngle go° -1.62 0.48 -0.92 0.38 0.83 0.gE 1.42 0.48 4.83 0.42Windshield Angle 180° -2.I8 0.38 _1.25 0.50 1,00 0.8; 1.25 0.3E 4.92 0.58
Listener3 Windshield Angle 55° -1.43 0.7; -0.83 0.48 0,00 0.78 0.25 0.44 5.33 0.62Windshield Angle 70° -1.48 0.52 -0.59 0.30 0.58 0.48 -0.08 0.38 5.08 0,68Windshield Angle g0o -1.72 0.88 -1.2S 0.26 -0.08 0.48 0.08 0.38 4.83 0.48Windshield Angle 180° -2.13 0.58 -1.08 0.62 -0.25 0.68 0.67 0.44 4.42 0.62
Listener4 Windshield Angle 55° -o,4o 0,68 -1.og 0.38 1.50 0.38 0.80 0.28 7.00: 1.26Windshield Angle70° -1.79 1.0C -1.75 0,50 1.75 1.3C 0.75 0.58 4.38 0.74
Windshield .Angle90° -0,80 0.4C -1.63 0.52 1.25 1.1; 1.0o 0.66 6.001 1.26Windshield Angle 180° -0.76 0.48 -2.og , 0.38 1.75 0.SC 0.75 0.32 5.58 1,26
Listener5 Windshield Angle 55" -1.27 0.9; -1.25 0,32 -0.50 0.68 0.501 0.38 5,88 1.10Windshield Angle70" -1.44 0.88 -1.13 0.26 0.13 0.48 0.88 0.46 6.08 1.00Windshield Angle90° -0,48 0,3{_ -1.13 0.26 0.00 0,3_ 0.28 0.32 6.78 0.32V_ndshield Angle 180" -0.14 0.48 -0,88 0.26 -0.38 0.38 0.13 0.26 7.38 0.52
Listener6 W1nclshieldAngle55" -0.13 2.18 -0,25 1.96 1.88 1.28 -1.28 t.06 5.78 1.76Windshield Angle70° -0.39 1,213 -0.13 0.60 0.60 1.28 -0.38 0,84 5.5g 1.06
WInclshleldAnglegOo -0.65 0,88 -0.50 1.06 0.50 1.3C -0.28 0.82 5.38 1.O0V_ndshield Angle 180° -0.45 1,38 -0,13 1.54 -0.50 0.68 0,13 1.04 4.75 0.98
Listener7 Wlndsh[eld Angle55° -1.79 1.2_ -0.38 0.52 0.63 1.2¢ ' 0,63 0.84 5.Og 0.92Windshield Angle70° -2.61 1.OC o,00 0.54 1.75 0,74 0,78 0.50 4.38 0.82
VVlndshleldAngle90° -1,84 0.74 -0,13 0.46 -0.63 1.3C 1,25 0,50 4,63 0.64Windshield Angle 180° -1.79 0 48 -0.35 0.36 -1.00 0.6_ 1.28 0.32 4.25 0.74
Listener8 Windshield Angle55° -1.25 0.82 -1.00 1.60 0,90 1.38 0.68 1.36 5.63 1.12
VAndshieldAngle70° -0.94 0.68 -1.88 0,88 -1.60 0.54 -0,28 0.82 5,38 1.42WindshieldAngle 90° -0.84 0.68 -1.38 1.00 -0.63 0.74 0.38 1.28 4.0g 0.66Windshield An_le 189° -2.23 0.48 -2.75 1.12 -2.13 0.48 0.28 1.54 4.08 1.30
TABLE 16
Page 34

LISTENER * VARIABLEMEANS TABLE
Pref TBalance MBa?anco BBalance Spatial Quahty
EXP 2 Mean 85% CL Mean I 95% CL Mean 95% CL Mean 95% CL Mean 95% CL
Listener 1 IP (70°)w/o Drs &Roof -2.69 0.62 -2.25 0.56 -1.00 0.74 0.67 0.66 5.25 0,50
IP (70=)w/Door_s -3.38 0,58; -2,87 0.76 -t.25 0.58 1.75 0.36 4.58 0.76
IP (70=)w/Roof -3.30 0.54i -2.42 0,58 -0,83 O.4a 1.75 0.44 4.55 0.86IP (70°)w/Drs & Roof -2.90 0.761 -2.33 0,44 -0.83 0.7( 1.83 0.48 4.58 0.94
Listener 2 IP (70°)wi* Drs &Roof _1.85 0.741 .0.67 0,56 1.00 0.92 0.83 0,74 4.88 0.52
IP (70°)w/Doors __ -2.69 0.64 -1,33 0.38 1.33 0.55 t.17 0,48 4.08 0.56_P(70°)w/Rcof -2.96 0.54 -1.58 0,30 1.50 0.48 1.75 0,70 4.00 0,56IP (70*)w/Drs & Roof -2.93 0.94 -1.55 0.38 1.50 0.52 1.75 0.60 3.92 0.62
Listener 3 IP (70°)w/o Drs &Roof -1.48 0.5; -0.59 0,30 0.58 0.45 -0.08 0.38 5.08 0.68IP (70'} w/Doors -1.57 0,5_ -1.25 0.36 O.O0 0.65 1.33 0.56 4.50 0.52IP (70°)w/Roof -1,41 0.4( -1.33 0.38 -0.17 0.4( 1.00 0,66 4.58 0.58IP (70°)w/Drs & Roof -1.75 0,54 -1.08 0,46 0.25 O.86 1.33 0.76 4.42 0.62
Listener4 IP (70°)wi* Dm &Roof -1.79 1,0C -1.75 0.50 1.75 1.35 0.75 0,50 4.38 0.74
IP (70")w/Doors -2.21 0.84 -1.63 0.36 1.50 0.38 1.00 0.38 4.00 0.54__ IP (70=)w/ Roof -2.75 __ O,�E -1.75 0,50 1.50 0.38 1.08 0.38 4.00 1.06
IP (70=)w/Drs & Roof -2.35 0.7( -2.13 0,26 0.13 1.2( t.80 0.66 4.00 0.54
Listener 5 IP (70*)wi* Dis &Roof -1.44 0.8_ -1.13 0,26 0.13 0.48 0.88 0.46 6.00 1.00IP (70*)w/Doors -1.01 0.5C -1.88 0,46 -1.00 1.08 1.63 0.36 4.t 3 0.46
IP (70*)w/Roof _0.79 0.6( -1.75 0.32 -0.75 0.74 0.75 0.50 8.88 0.96IP (70*)w/Drs & Roof -1.18 1.0C -2.38 0.36 -2.13 1.18 2.25 0.98 3.75 0,50
Listener 6 IP (70*)wi* Drs &Roof -0.39 1.2C -0.13 0.60 0.63 1.2_ -0.38 0.84 6.60 1,06IP (70°)w/Doors 0.41 1,94 -0.13 0,80 -1.50 0.92 -0.75 0,82 5.08 1.00IP (70°)w/Roof -1.0_ 1,5_ -2.00 0.76 -0.13 1.4( -1.25 0.74 4.75 0.74
IP (70*)w/Dm & Roof -0.96 1,84 -1.25 0,74 0.38 1.5¢ -1.13 0,70 4.75 0.62
Listener 7 IP (70°)wi* Dm &Roof -2.61 1.0C 0.0o 0.54 1.75 0.74 ' 0.75 0.50 4.38 0,82iP (70*)w/Doors -3.41 0.4E -0.50 0,92 -1.25 0.5C 1.88 0.46 4,13 0.26
IP (70°)w/Roof -2.51 O.G( -t .13 0.60 -0.881 1.04 1.00 0.54 4.50 0.54IP {70'I w/Drs & Roof -3.03 0.5( -1.o0 0,66 -1.001 0.78 1.88 0.70 4,38 0.52
TABLE17
Page 35
LISTENER * VARIABLEMEANS TABLE
Pref TBalance MBalance BBalance Spatial QualityEXP 3 Mean 98% CL Mean 95% CL Mean 95% CL Mean 95% CL Mean 85% CL
Listener 1 Doorsw/o IP (70") &RD -3.58 __ 0.38 -1.33 0.38 -0.92 0,52 2.33 0.44 3.33 0.2_Doorsw/IP (70D) -3.31 0.48 -1.17 0.48 -1.00 0,6(3 2.17 0.42 3.50 0.48Doorsw/Roof -3.55 0.70 -1.00 0.86 -0.42 1.18 2.25 0.50 3.25 0.44DoorswllP (70D)& RoD -3.44 0.82 -1.08 0.46 -0,75 0.78 2.17 0.34 3.75: 0.38
Listener2 Doorsw/o IP (70D)&R( -3.38 0.34 -1.50 0.38 1.58 0.90 1.67 0.52 4.08 0.3CDoorsw/IP (70") -3.40 0.36 -1.50 0.38 1.08 0.94 2.17 0.68 4.0C 0.34Doorsw/Roof -3.71 0.40 -1.58 0.30 2.25 0.82 2.00 8.58 3.83 0.42Doorsw/IP (70°) & RoD -3.63 0.52 -1.50 0.30 2.25 0.86 1.83 0.60 3.83 0.42
.istener 3 Doorsw/o IP (70_)& Rc -2.04 0,60 -1.00 0.24 -0.83 0142 0.42 0.38 4.50 0.52Doorsw/IP (70D) -2.37 0.54 -0.83 0.22 -0.83 0,54 0.00 0.34 4.17 0.48Doorsw/Roof -2.82 0.58 -0.58 0.30 -0.83 0.48 0.42 0.46 4.08 0.38Doorsw/IP (70°) & ROD -2.51 0.48 -0.83 0.22 *o.58 0.38 0.58 0.46 4.00 0.42
Jstener 4 Doorsw/o IP (70°)& Rc -1.06 0.84 -1.75 0.32 0.25 1.34 1.63 0.52 4.25 1.64
Doorsw/IP (70°) -1.71 0.50 -2.13 0.46 1.38 1.20 1.63 1,20 5.13 1.10Doorsw/Roof -2.88 0.70 -1.75 0.32 1,25 1.80 2.13 0,70 4.63 0.84
Doorsw/IP (70D)& ROD' -3.05 0.86 -2.38 0.35 0.88 1.80 2.50 1.o0 3.13 0.80
.istener 5 Doorsw/o IP(70D)& Rc .0.98 0.22 -1.25 0.32 -1.63 0,36 1.38 0.36 5.00 0,54Doorsw/IP (70°) -1,03 0,24 -1.25 0.32 -1.63 0.36 1.38 0.36 4.75 0,32Doorsw/Roof -2.31 0.56 -1,25 0.32 -1.63 0.84 2.00 0.92 3.50 0.54DoorswllP (70e)& ROD1 -2.35 0.58 -1.30 0.361 -1.88 0.88 2.00 0.02 3.13 0.26
.Istener6 Doorsw/o IP (70") & Rc 1.94 1.22 -1.13 0.8C -0.75 0.62 -1.13 0,88 8.38 1,00Doorsw/tP (70°) 0.48 1,64 -1.63 0,7,4 1.13 1.16 -0,88 0.80 4.75 0,88Doorsw/Roof -0.89 2.46 -1.00 0.84 -0.75 1.68 0.13 0,g8 4.63 0.74
Doorsw/IP (70_/ & Rool -1.70 1.82 -1.25 0,8,1 1.50 2.04 -1,38 1.26 4,75 0.62
TABLE 18
Page 36
LISTENER * VARIABLEMEANS TABLE
Pref TBalance MBatance BBalance Spatial Quality
EXP4 M_an 95% (_L Mean 95% CL Mean 95% CL Mean 95% CL ....,Mean 85% {L--I"
Listener1 IP Back 55° -4.13 0 64 -2.00 0.30 -0.75 0.32 2.38 0.52 4.25 0.82IP Back 70= -4.29 0.80 -2.13 0.46 -0.63 0.64 2.75 0.55 3.75 0.74
IP Back 90" -4.68 0.32 -2.13 0.80 -0.50 1.0C 3.0(} 0.68 -- 3.75 ().82IP Back 180° -4.69 0.22 ' -2.00 1.20 -1.00 0.54 3.00 0.66 3.88 0.60IP Forward58o -4.31 0.64 -2.00 0.54 -0.88 0.48 2.63 6.52 3.75 0.74
IP Forward70o -3.93 0.74 -2.25 0.50 -0.50 0.84 2.50 0.38 3.88 0.60IP Forward90° -4.75 0.08 -2.00 0.66 -0.50 1.00 3.00 0.68 4.25 0.50IP Forward180° -4.84 0.22 -2.50 0.84 -1.38 0.82 3.00 0.66 2.88 0.70
Listener2 IP Back 55° -3.74 0.48 -1.50 0.38 1.25 1.12 2.50 0.54 3.88 0.26IP Back 70° -3.88 0.28 -1.63 0.36 1.13 1.48 2.25 0.62 4.00 ([.O0IP Back g0° .3.31 0.26 -1.88 0.26 0.25 1.12 2.38 0.36 __ 4.00 0.OOIP Back 180° -3.93 0.14 -2.00 0.00 -0.25 1.4C 2.13 0.60 4.00 O.O0IPForward55° -3.96 O.2C -1.75 0.32 1.63 1.2C 2.75 0.32 4.00 6.OOIP Forward70o -3.84 0.32 -1.62 0.36 1.13 1.28 2.25 0.62 4.00 0.00IP Forward90° -3.73 0.32 -1.50 0.38 -0.13 1.28 2.25 0.50 4.131 0.26IP Forward 160o .3.85 0.34 -2.00 0.00 .0.25 1.48 2.13 0.60 4.001 0.0o
Listener3 IP Back 55° -3.01 0.38 -1.25 0.32 .0.25 0.5c 0.88 0.26 4.38 0.52IP Back 70° -2.95 0.68 -1.28 0.32 -0.38 0.36 1.O0 0.54 4.0(] 0.64IP Back 90° .2.90 0.6C -1.13 0.26 .1.13 0.6{ 0.6(] 0.38 3.88 0.66IP Back 180° -3.36 0.48 -1.13 0.26 .1.13 0.601 1.0D 0.64 3.50 0.54IP Forward58, -3.10 0.62 -1.28] 0.32 -0.50 0.54 1.08] 0.00 3.88 0.46IP Forward70° -1.99 0.34 -1.25 0.32 -0.50 0.38 0.60 9.54 4.0(] 0.64IP Forward90° -3.06 0.56 -1.25 0.32 .0.88 0.48 0.88 0.26 4.13 0.70IP Fondvard150" -3.28 0.64 -1.00 0.o0 -1.25 0.50 1.08] 0.66 3.63 0.62
Listener4 IP Back 55° -2.31 0.64 -1.88] 0.26 0.35 0.84 1.13 0.20 4.75 0.82IP Back 70° -2.48 0.68 -2.13 0.46 0.63 0.36 0.88 0.68 4.13 0.88IP Back 80° -2.80 0.50! -2.25 0.32 -0.25 1.18 . 1.80 0.65 4.00 1.00IP Back 180° -3.06 0.54 .2.00 0.35 -0.25 1.08 ' 1.35 0.38 3.88 1.04IP Forward55° -2.43 0.42 -2.25 0.32 1.13 0.6C 0.38 1.12 4.78 0.98IP Forward70° -2.58 0.30 -2.06 0.38 1.60 0.38 1.00 0.00 4.38 0.64IP Forward90° -3.03 0 78 -2.13 0.46 -0.25 1.12 1.13 0.26 3.75 0.50IP Forward160o -3.58 0.32 -2.13 0.46 -0.75 ' 1.12 1.58] 0.54 3.00 0.OO
FListe(ler5 IP Back 55° -1.35 0.24 -1.25 0.32 -1_00 0.5_ 1.30 0.35 4.25 0.90
JPBack 70o -1.44 0.3c -1.38 0.36 -0.75 0.5C 1.50 0.54 4.85 0.80IP Back g0° -1.39 0.40 -1.56 0.35 -1.25 O.5C 1.25 0.32 4.63 0.52tPBack 180° -1.92 0.5¢ -2.06 0.38 .1.88 0.4( 1.38 0.38 4.38 1.00IP Forward55° -1.45 0.48 -1.56 0.54 -1.25 0.62 1.08 0.38 4.58 0.54IP Forward70o -1.24 0.34 -1.13 0.26 -0.75 0.32 1.30 0.36 _ 4.63 0.52IP Forward90° -1.39 0.34 -1.63 0.36 -1.13 0.28 1.50 0.54 4.00 0.54
IP Forward 1150° -2.06 ·0,_,38 -2.13 0.26 -1.63 0.38 1.38 0.62 4.28 0.62
TABLE 19
Page 37

LISTENER * VARIABLEMEANS TABLE
PPref . TBalance MBalance BBalance Spatial QualityEXP8 Mean 95% CL Mean 95% CL Mean 95% CL Mean 95% CL Mean 95% CL
Listener1 Door High -4.28 0.24 -l.OO 0.66 -2,42 0.72 2.42 0,46 3.78 0.60
Door Low -5.00 0.0O -3.50 0.36 -2,86 0,78 2,17 __ 0.34 4.08 0.88_
Listener2 Door High -3.46 0.28 -1.17 0.34 1.33 1,00 2.75 0,78 3,7§ 0.44Door Low -3.92 0.24 -2.25 0.26 0.42 1.14 3.42 0,68 3,00 0.5C
Listener3 Door High -2.56 0.42 -0,50 0,30 -0.83 0,22 0.75 0,26 3,75 rj -,_Door Low -3.56 0.42 -1.33 0.28 -1.56 0.38 0.75 0.26 2.92 0.3E
Liatener4 Door High ____ -2.13 0.48 -2.19 0.28 0.81 0.74 1.69 0.36 4.94 0.5CDoor Low -4.09 0,59 -3.89 0.26 -1.56 0.68 2,25 0.42 2.38 0.6,_
Listener5 Door High -1.83 0.40 -1.06 0.42 -1.75 0.46 1,25 0.42 4.0_ O.4EDoor Low -2.0!, 0.42 -2.50 0.44 -2.19 0.56 1.31 0,44 3.63 0.44
TABLE 20
"Pref TBalance MBalance BSalance Spatial QualityEXP4/8 Mean 95% CL Mean 95%CL Mean 96% CL Mean 85% CL Mean 95% CL
.istener1 IP Back -4.29 0.66 -2.13 0,4E -0.63 0.64 2.75 0.50 3.7fi 0.74
-- 0.60IP Forward -3.93 9.74 -2.25 0.5C -0.50 0.84 2.80 0.38 3.88Door High -4,25 0.24 -1.00 0.TE -2.42 0.72 2.42 0.46 3.75 0 80Door Low -5.00 0.00 -3.50 0.32 -2.86 0.76 2.17 0.34 4.01_ 8.681
Listener2 tP Back -3.98 0.20 -1.63 O36 1.13 1.48 2.25 0.62 4.00 0.6CIP Fo_ard -3,94 0.32 -1.63 0,36 1.13 1.28 2.25 0.62 4.00 6.62
Door High -3.46 0.28 -1 17 0.34 1.33 1.00 2.75 __ 0.78 3 76 9.44-- Door Low -- -3._ 0.24 -2.25 0.26 0.42 ---1.14 3.42 0.68 3.00 0,52
.istener3 IP Sack -2.95 0,68 -1,25 0,32 -0.38 0.36 1.00 0.54 4,00 0.54IP Forward -1.99 0.34 -1.25 0.32 -0.50 0.38 0.50 0.84 4.00 0.54
Door High -2.56 0.42 -0.50 0.3_ -0.83 0.22 0.75 0.26 3.75 0.361DoorLow -3.58 0.42 -1.33 0.22 -1.58 0,38 0.75 0.26 2.92 0.38!
stoner 4 IP Back -2.48 0.66 -2.13 0.42 0.63 0.36 0.88 0.60 4.13 0.88IP Forward -2.58 0.36 -2.00 0.32 1.00 0.38 1.00 O.O0 4.38 0.64
DoorHigh -2.13 0.48 -2.19 0.22 0.81 0.74 1.69 0.36 4.94 0,50DoorLow -4.09 0.58 -3.88 0.2E -1.66 0.68 2,25 0,42 2.38 0.52
.istener5 IP Back -1.44 0.30 -1.38 0.32 -0.76 0.50 1.50 0.64 4,88 0.80
IP Forward -1.24 0.34 -1.13 0,261 -0.76 0.32 1.38 __ 0.36 4.63 0.52Door High -l 83 0 40 -1.06 0 421 -1,75 0.46 1.25 0.42 4 06 0.46Door Low -2,01 0.42 -2.50 0.44 -2.19 0,56 1.31 0.44 3.63 0.44
TABLE 21
Page 38

LISTENER * VARIABLEMEANS TABLE
Pref TSalance MBalance BBalance SpatialQuality5XP1B Mean 95% CL Mean 95% CL Mean 65% CL Mean 95% CL Mean 05% CL
.Istener 1 WindshieldAngle 55o -0,14 0.90 -0.08 0,72 0.09 0.50 1,08 0.30 6.00 0.56WindshieldAngle 70o ~1.68 0.64 -0.25 O.�E 0.92 0.86 0.75 0.44 5.50 0.68WindshieldAngle 89° -0.01 1.16 -1.08 0,45 -0.50 0.58 1,08 0.38 5,92 0.52
WlndshleldAngle 180° _ -0.44 1.12 -1.42 0.5_ -0.58 0.62 1.17 0.48 6.00 0.50
.istener 2 WindshieldAngle 55° -1.46 0.46 0 08 0.4_ 1.67 0.72 0,67 0.44 4.58 0.52VVIndshie_dAngle 70° -1,60 0,36 0.00 0,42 2.09 0.66 0.58 0.30 4.33 0.38_ndshierd Angle 900 -1,42 0.60 -0.25 0.35 0.75 0,78 0.92 0.38 4,67 0.44Windshield Angle 180' -1 68 9,62 -0 17 0.42 1,17 0,82 0.67 0.28 4.17 0.42
.Istener 3 Windshield Angle 55° -2.19 0.40 -0.17 0.34 -0.25 0.44 0,25 0.26 4.42 0.38Windshield Angle 70° -1.58 0.46 -0.17 0.4._ 0.25 0.36 0.33 0.38 4.00 0.34Windshield Angle 99° -1.89 0.46 0.09 0.24 0.33 0,44 0.42 0,30 4.28 0,36
Windshield Angle 180° -1.55 0.44 -0.17 0.34 0,25 0,50 0,33 0.28 4.25 0.44
_istener4 Windshield Angle 65° -0.40 0.58 0.00 0,3_ 1,25 1.30 0.88 0.88 6,88 0,06Windshield Angle 70° -2.41 0.92 -0,38 0,52 4,00 1,00 1,13 0,46 4,88 1.34Windshield Angle 90° -0.98 0.66 -0,75 0,5C 1,88 0.96 1.13 0.26 5,38 1,12
Windshield Anl_le180° -0.76 0.48 -0,88 0,6C -0,29 0,74 1.38 0.36 6.75 1.46
.istener 5 Windshield Angle 55° -0.88 0,88 0,38 0.3_ 0,13 0,80 1.13 0,26 6,25 1.06Windshield Angle 70° -1,56 0,74 -0,50 0,3_ 0,13 0,80 1.00 0,38 6.60 1.20Windshield Angle 90° -0.44 0.62 -0,25 0.32 -0,88 0,60 0.08 0,26 6.50 0.84Windshield Angle 180o -0.18 0.38 -0.88 0.4e .0,63 0,36 0,88 0.26 6.63 0.74
.istener6 Windshield Angle 95° -0.48 1.26 0.25 0,5C 1.13 1.80 -0.13 1.44 6,88 1,16
Windshield An_lle70° -1,80 1.94 0.13 0.0c 2.38 0.84 -1,13 1,04 4.75 0.90Wlndsh[eld Angle 90° -1.25 1,32 -0,25 0,98 0.50 1,26 -1.08 0,96 8.38 0,84
Wlndshreld Anl_le180° 0,73 1,76 -1,09 0,7_ -0.88 0.88 0.00 0.66 6.25 0.50
JBtener 7 Windshield Angle 55° -1.54 0.76 -0,38 0,52 -1,38 0.64 0.75 0.50 5.80 0,66Windshield Angle 70° -2.48 0,98 -0.38 0.52 0.00 1.36 ' 1.13 0,60 4.25 0.82Windshield Angle 90° -1.99 0.88 -0.38 0.36 -0.50 1.06 0.63 0,52 4.88 0.96
W_ndshleldAngle 180° -1.66 0.60 -0.88 0.46 -1.09 0.66 1.38 0,64 5,38 1.06
. TABLE22
Page 39
LISTENER * PROGRAMMEANS TABLE
Pref TBalance MBalance BBalance Spatial Quality--XP tA Mean 95% CL Mean 95% CL Mean 95% CL Mean 95% CL Mean 98% CL
.istener 1 Voice -1.95 0.52 -2.17 0.46 -0,08 0,52 0,92 0.52 5.25 0.50
Music -1,87 0.46 -1,75 0.56 0,50 0,84 0,42 0,46 5.00 0.50Noise -1.93 0.94 -2.67 1,06 -1.00 0.74 1,25 0,56 5,06 0.78Drum Kit -2.63 0,94 -2.33 0,62 -0.92 0.84 -0,42 0.52 5,08 0.68
.istener 2 Voice -1,49 0,48 -0.83 0.46 0,83 0.92 1.08 0,68 4.56 0.46Music -2.47 0.48 -0.92 0.52 1,00 1,10 t.92 0,52 4.33 0.62
Noise -1.63 0.44 -1,00 0.66 1,67 0,52 0.83 0,42 5,251 0.26Drum Kit -1.78 0.54 -1.08 0.52 0.33 0.56 1.17 0.42 5.171 0.48
.istener 3 Voice .1.58 0,62 -0.92 0.46 0,25 0,60 -0,08 0,38 4.83 0.42
Music -1,56 0,52 -0.92 0,36 0,08 0.52 0.42 0.3(_ 4.42 0.52Noise -1,63 0,66 -0.93 0.62 0,33 0,44 0.08 0,52 5.56 0.80
Drum Kit -1,98 0.94 -1.00 0.42 -0.42 0,80 0.50 0,46 4,92 0.58
Jstener 4 Voice -0,68 1,10 -1,38 0.36 2.00 0.66 1.13 0.46 5,63 0.84
Music -0.60 0,36 -1.38 0.36 1,00 1,36 0.88 0,26 6,50 1.20Noise -0.91 0,70 -1.75 0.74 1,75 0.62 0.88 0.46 6.50 1,70Drum Kit -1.33 0,54 -1.88 0,46 1,50 0.66 0,50 0,54 5,25 1.34
.istener 5 Voice 0.11 0.36 -1,00 0.06 0.35 0.36 0.13 0,26 7,63 0.52Music -1.50 0,74 -1.38 0.36 -0.38 0.36 0,75 0,56 5,56 1,00
Noise -0,46 0,22 -0.88 0,26 -0.25 0.50 0.13 0.26 6,88 0.26Drum Kit -1.48 0,90 -1.13 0.26 -0.50 0.54 0,75 0.32 6,0(3 0,76
_istener 6 Voice -0,04 2,04 O,00 O.0C 0.38 0,74 O.OO 0.00 5.38 1,36Music 0.53 1.32 1.75 1.24 0,50 1.26 -0,75 1,18 5,63 1.20Noise -0.74 0,82 -1,75 t .24 0.50 1.70 .0.38 t .38 5,00 1.36
Drum Kit -1.36 0,92 -1.00 0.84 1.13 1,34 '0.63 0,92 5,38 1.t2
.istener 7 Voice -1.14 0.74 0.00 0.38 0,50 1.14 1.00 0.38 4.50 0.66Music -1.63 0.52 -0,13 0.46 -0.13 1,34 0.75 0,74 4,13 0.88Noise -3.31 0 74 -0.13 0.26 1.00 1.26 0.88 0,86 4.50 0.54Drum Kit -1.95 0.82 -0.63 0.64 -0.63 1.12 1,25 0.32 5.13 0.70
.Istener 8 Voice -1.19 0.84 -2.50 1.14 -1.38 0,74 -0,38 0,84 5.13 1.04Music -1.69 0,92 -1.88 1.04 -1.13 0,96 0.63 0.84 4.88 1.58
Noise -1.01 0.68 -1,38 1.66 -0.75 0,50 1,00 1,36 4.38 1.30Drum Kit -1.36 0,62 -1.25 1.06 -0.50 1,52 -0,25 1.64 4.63 1.12
TABLE 23
Page 40

LISTENER * PROGRAM
MEANS TABLE
Pref TBalence M Belen"r,e' -- BBalance Spatial Quality
EXP 2 = Mean I ,95% CL . Mean 95% CL Mean 95% CL Mean 95% CL Mean 95% CL/
Listener 1 Voice __-3.3I 0.74 -2,25 0.44 -1.17 0.64 t.33 0.52 4.58 . 0.6._.,__4
---- Music -2.72 0.42 __ -2.75 0.36 __ -1.00 0.42 __ 1.67 0,66 4.83 0.48Noise -3.10 0.80 ._ -2,67 _ . 0.80 -0,33 0.52 1,92 0.38 4.50 0.88
Drum Kit -2.54 0 68 ,-2.00 0,60 -1.42 0.6[_ 1.08 0,56 5,06 0,92
Lislener 2 Voice -2.70 0.74 -1,33 0.38 1,92 0,68 0.75 0.66 3.75 0.4,1Music -2.67 0,82 -1.17 0.54 1.08 0.84 1.83 0.68 4.25 0,56Noise -3,01 0.54 -1.25 0.36 1,87 0.28 1.25 0.56 3.75 0.66
Drum Kit -2.06 0.80 -1.42 0.58 0.67 0.38 1.67 0,62 4,75 0.44
L.isterler 3 Voice -1,31 0,56 -1,25 0,44 0.50 0,75 0.42 0,38 4.75 . .0.60Music -1.58 0.50 -1,25 0.44 0.17 0,42 1.33 0.72 4.25 0.68Noise -1.39 0.40 -0,76 0.26 0.08 0.52 0.33 0,44 4.92 0.52Drum Kit -1.92 0.54 -1.00 0,42 -0.06 0.52 1,50 0.84 4.87 0.62
Listener 4 Voice -2.t6 0.92 .2.00 0.38 i 1,88 0,70 1.00 0.38 4.75 0.74Music -1.55 0,88 -1,50 0.38 I 0.50 1.52 1,25 0.62 4,25 O,S0
__ Noise __ . -3.35 0,58 -2,13 0.46 1.38 0.84 0.83 0.36 3,38 0.74Drum Kit -2.04 0.92 -1.63 ' 0.36 1.13 0.70 1.38 0,52 4.00 0.66
.istener 5 Voice -1,66 0.92 -1.75 0.59 -1.08 1.52 0.75 0.5( 5.63 1.30Music -0.69 0.941 -2.00 0.54 -1.13 0.70 2.00 1,08 4.88 0.80Noise -0.79 0.38: -1.88 0.46 -0.13 0.60 1.50 0,6E 4.75 1,06
Drum Kit -1.27 0.62 -1.50 0,38 -1,50 1.00 1,25 0.5(: 4.5(3 0.92
.istener 6 Voice -2.03 1.021 -1.13 0.88 -0.38 1.56 -0.50 0,85 4.25 0.74
Music 2.32 1.181 -0.50 0.76 0,75 0.82 -t.38 1,08 6.00 0.84
Noise -2,09 0.8_, -0.88 1.16 -0.50 1.96 -0.38 0.52 4.88 0.60__ Drum Kit __ -0.19 1.3,_ -1.00 0.84 -0.50 0.92 . -1.25 0.74 4.88 0.88
_istener7 Voice __ -2 64 0.74 -0.38 0,.52 -1.13 _ 1.04 0.88 0.68 4.25 0.32Music -2.16 0.68 -0.13 0.46 -0.13 1.22 1.50 0,76 4.50 0,54
Noise __ -3,55 __ 0 5e -1.00 0.66 -0.25 1.50 __ 1,88 0.70 4,13 0.60Drum KJl -3,21 0,5E -1,13 1.04 0,13 0,70 1.25 0,32 4,50 0.38
TABLE 24
Page 41

LISTENER * PROGRAMMEANS TABLE
Pref TBslance MBalance BBalance Spatial QualityEXP 3 Mean 95% CL Mean 95% CL Mean 95% CL -- Mean 95% CL Mean 95% CL
Listener 1 Voice -2.73 0 72 -0,50 0.46 -1.33 0.38 2.25 0.26 3.02 0.3CMusic -3.15 __ 0.32 -1,83 0.34 -0.83 0.34 2.67 0.44 4.00 0.2.4Noise -3.60 0.50 -1.08 0.52 -1,92 0.30 2.50 __ 0.30 3.08 0.16Drum Kit -4.40 0.34 -1.17 0.34 1.00 0.78 __ 1.50 -- 0,30 2.83 0.34
Listener 2 Vomce -3.73 0.36 -0.83 0.22 3,17 0.64 1.33 0.28 3,58 0.3CMusic -3,18 0.42 -2.00 0,00 0.05 0,08 3.33 0.44 4.00 0.0¢
Noise -3.53 __ 0.40 -1.25 0.26 2,33 0.38 1.50 0.30 4,68 0.36Drum Kil -3.69 0.42 -2.00 0.O0 2,08 0.62 1.50 0.30 3,58 0.3(
Listener 3 Voice -2.53 0,62 -0.58 0,30 -0.33 0.56 -0.98 0.16 4,17 0,42Music -2.59 0.54 -1.00 0.00 -1.08 0.38 0.83 0.48 4.00 0,42Noise -2.48 0.40 -0,75 0.26 -1.08 0.38 0.33 0.44 4,60 0.4E
Drum Kit -2.12 0.64 I-. -0.92 0.30 -0.58 0.36 0.33 0.38 4.08 0.5._
Listener 4 Voice -2.43 0.94 -2,00 0.54 0.75 1.6C 1.13 0,60 3.00 0.92
Music -2.55 1.O0 -2.00 0.38 -1.25 1.46 2.25 1,34 4.38 0.74Noise -1.73 0,72 -1.88 ' 0.46 2.00 0,66 2.00 0,66 4.63 1.3£Drum Kit -2.00 1,02 -2,13 0.26 2.25 0.82 2,50 0,54 5.13 1.38
Listener 5 Voice -1.78 0,64 -1 ,O0 0.00 -1.75 0.50 1.25 0.32 4.35 0.74Music -1.05 0,36 -2,00 O.00 -2,00 0.08 3.00 0.76 3.88 0.60Noise -2.03 0.70 -1,13 0.26 -0,50 0.38 1.50 0.38 4.38 0.84
Drum Kit -1,81 0,68 -1.00 0.00 -2,50 0.38 1,00 0,00 3.75 0.62
Listener 6 Voice .0.44 2.34 -0.63 0.52 1.88 1.38 -0,75 1,18 4.39 1.06Music 2,71 0,76 -0.63 0.52 -0,50 1.14 -1,50 0,84 6,50 0.54Noise -0,84 1,46 -2.25 0,74 -0.63 1.5c -0.75 0.62 5.00 0.54
Drum Kit -1.61 1,86 .... -1.50 0.76 0.38 1.84 '0.25 1,18 4.63 0.78
TABLE 25
Page 42

LISTENER * PROGRAM
MEANS TABLE
Pref TBalance MBalance BBalance Spatial Quality'XP 4 Mean 95% CL Mean 65% CL Mean 95% CL Mean 95% CL Mean 98% CL
.istener I Voice -4.47 0.30 -1.81 0.32 -O.9z 0.2_ 2.25 0.22 4.25 0.42Music -4.21 0.40 -2.06 0.5C -1.06 0.3_ 3.13 0.24 3,69 0,36Noise -4.29 0.50 -2.69 0.56 -1.31 0.24 3.44 0.48 4,38 0,44
Drum Kit -4.83 0.06 -1.94 0.34 0.25 0.6C 2.31 0.24 2.88 0,44
.istener 2 Voice -3.91 0.26 -1.4z 0.26 2.31 0.3C 1.50 0,26 4.00 0,O0Music -3.64 0.20 -1.94 0.12 -1.00 0.54 3.09 0,00 3.94 0.12
Noise -3.79 0.18 -2.00 O.0C -0.06 1.04 2.75 0.22 4.00 0.00Drum Kit -3.83 0.20 -1.56 0.25 1.13 0.7E 2.00 0,32 4.06 0.12
.istener 3 Voice -2.85 0.36 -1.19 0.20 -0.44 0.4C 0.56 0.32 4.31 0.44Music -3.54 0.40 -1.13 0.18 -0.75 0.38 1.13 0.30 3.50 0.32Noise -2.73 0.36 -1.31 0.24 -0.75 0.34 0.69 0.24 4.00 0.36Drum Kit -2.71, 0.40 -1.13 0.15 -1.0[ 0.34 1.00 0.32 3.88 0.36
.Istener 4 Voice -2.74 0.34 -2.13 0.18 0.88 0.44 0.94 0.22 3.94 0.50Music -3.07 0.48 -2.06 0.28 -0.75 0.6e 1.19 0.38 3.94 0.54
Noise -2.72 0.38 -2.13 0.24 1.19 0,28 1.o0 0.44 4.44 0.68Drum Kit -2,64 0.46 -2.06 ' 0.34 -0.50 0.68 1.31 0.56 4.00 0.88
Listener 5 Voice -1.53 0.22 -1,50 0.25 -1.19 0.28 1.19 0.20 4.63 0.48Music -1.78 0.36 -2.13 0.26 -1.69 O.3C 2.19 0.20 4.00 0.88
Noise -1,6C 0,22 -1.31 0.24 -0.50 0.32 1_25 0.22 4.94 0.34Drum Kit -1,21 0,28 -1,31 0.24 -1.44 0.25 1,00 0.00 4.19 0.42
TABLE 26
Page 43

LISTENER * PROGRAMMEANS TABLE
Pref TBalance MBalance BBalence Spatial QualityEXP 8 Mean 95% CL Mean 95% CL Mean 95% CL Mean 95% CL Mean 95% CL
Listener I Voice -4.65 0.38 -1.33 1.34 -3.00 1,04 2,00 0.52 4,33 0,84Music -4,73 0.28 -2.67 0,98 -3.00 1,16 2.67 0,42 4,00 0.00
Noise -4.73 0.30 -2.17 1.55 -2,33 0.42 2.83 0,34 4.17 0.9(Drum Kit -4.45 0.56 -2.83 1.06 -2,22 1.44 1.67 0.42 3.17 0.8(
Listener 2 Voice -3.83 0,42 -1.33 0,66 2,50 1,00 2.67 0,84 3.17 0,6,IMusic -3.75 0.42 -2.17 0.62 -1,67 0,66 4.67 0,42 2.83 0,6._
Noise -3.42 0.40 -1,50 0.44 1.67 0.68 2,83 0,62 4.33 0,4,_Drum Kit -3.75 0.42 -1,83 0.62 1.00 1.04 2,17 0,96 3.17 0.6,1
Listener 3 Voice -2.65 0.60 -0.83 0.62 -1.33 0.42 0,00 O.O0 3.50 0.44
Music -3.50 0.76 -1.0ti 0.52 -1.50 0.44 1.00 0.0O 2.83 0.62Noise -2.92 0.80 -0,83 0.62 -0,83 0.62 1.00 0,0O 3.80 0.44
Drum Kit -3.17 0,68 -1,08 0.52 -1,17 0,62 1.00 0.0O 3,50 0.86
Listener 4 Voice -3.05 1.10 -2,88 0.60 -0.13 1.34 1.00 0.38 3.83 0.7.4
Music -3.65 0.7( -3.00 0.66 -1.83 0.64 2.75 0,50 3.25 1.46Noise -2.65 1.0._ -3.00 ' 0.84 1.00 1.36 2.00 0.00 4.38 t.2(]Drum Kit -3.10 1.1E -3.25 0.82 -0.75 1.18 2.13 0.46 3.38 1.28
Listener 5 Voice -1.66 0,2( -1.t3 0.70 -2.00 1.00 0.25 0.32 3.63 0,52Music -1.94 0,4,4 -2,50 0.84 -2,25 0.62 2.25 0.32 4.25 9.50
Noise -2.15 0,821 -1.63 0.64 -2.00 0.84 1.50 0.38 3.63 0.92Drum Kit -1.94 0,7( -1.88 0.80 -t.63 0.36 1.13 0.26 3.88 0.60
TABLE 27
Pref TBalance MBalance BBalance Spatial QualityEXP 415 Mean 95% CL Mean 95% CL Mean 95% CL Mean 95% CL Mean 95% CL
Listener I Voice -4,35 0.44 -1,60 0,06 -2.20' 0.94 2.00 0.30 4.40 0,62
Music -4.38 0.54 -2,60 0.62 -2.08 1.08 2.90 0.36 3,90 0.56Noise -4.36 O,6C -2.10 0.92 -1.80 0.50 2.90 0.20 4,00 0.66Drum Kit -4.62 0.38 -2.60 0,74 -1.23 1,32 1.90 0.36 3.20 0.58
.,istener 2 Voice -4.01 0.38 -1.20 0,40 2.60 ! 0.62 2.00 0.74 3.50 0.44Music -3.67 0.28 -2.10 0,36 -1.58 0.44 4.00 0.60 3,30 0.52
Noise -3.67 0.32 -1.70 0.30 1.801 0.40 2.90 0.36 4.20 0.26Drum Kit -3.67 0.38 -1.70 0.42 1.08 1.04 2.10 0.56 3,50 0.44
Listener 3 Voice -2.69 0.58 -1,00 0.42 -0.80 0.50 0.30 0.42 3.80 0,50Music -3.30 0.58 -1.10 0.36 -1,00 0,52 1.20 0.26 3.t0 0.46Noise -2.64 O.5E -1.00 0,42 -0.80 ' 0.40 0.80 0.26 3.80 0,40
Orum Kit -2,66 0.58 -1.10 0,36 -1.00 0,42 0.70 0.30 3.70 0.60
,istener 4 Voice -2.93 0.74 -2.55 0.46 0.25 0.92 1.00 0.24 3.75 0.50
Music -3,16 0.78 -2.75 0,50 -1,00 0,70 2.00 0.78 3.75 1,14Noise -2,78 O.78 -2.83 0.60 1,00 0.88 1,75 0.26 4.17 0,84
Drum Kit -2,79 0.84 -2.67 0.76 -0.17 0.94 1.75 0.44 3.75 0.92
Listener 5 Voice ......... -1_65 ...... O.2C -1.17 0,48 -1,59 0.76 0 50 0.30 4,08 0,62Music -1,67 0.38 -2.25 0,50 -1.92 0.52 2.25 0.26 4.50 O.58Noise -2,00 0.5(3 -1.42 0,46 -1,33 0.80 1.50 0.30 4.00 0,70
Drum Kit -1.59 0,54 -1,58 0,58 -1.42 0,30 1.08 0,16 4.00 0.42
TABLE 28
Page 44
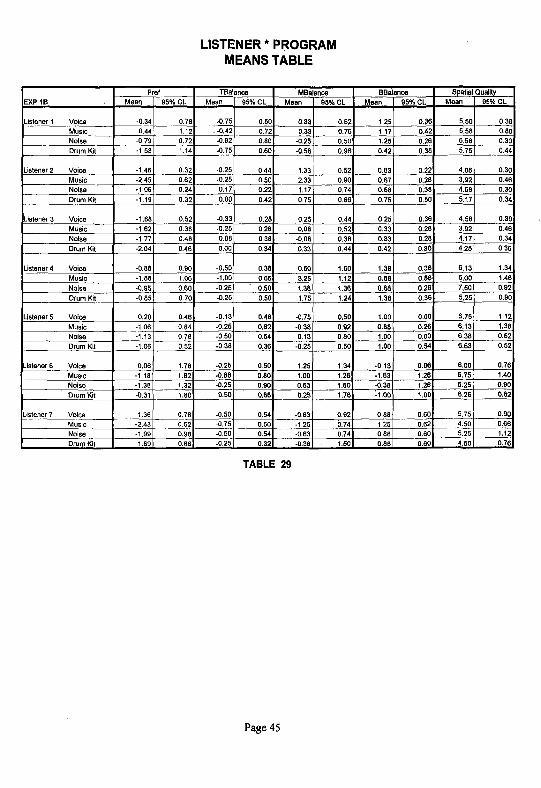
LISTENER* PROGRAMMEANS TABLE
Pref TBalance MBalance BBalance Spatial Quall_'XP tB Mean 95% CL Mean 95% CL Mean 95% CL Mean 95% CL Mean 95% CL
.istener 1 Voice -0.3_ 0.78 -0.75 0.50 0.33 0.52 1,25 0.36 5.50 0.38Music 0.44 1.12 . ,0,42 0.72 0.33 0.76 1.17 0,42 8.58 0.80Noise -0.79 0,72 .0,92 0.88 -0,25 0.50 1.25 0.26 6,58 0.30
Drum Ki[ -1.55 1.14 .0,75 O.6C -0,58 0.96 0.42 0.38 5,75 0.44
.istener 2 Voice -1.46 0.32 -0,25 0.44 1.33 0.52 0.83 0.22 4,08 0.30
Music -2,45 0.62 -0,25 0.58 2.33 0.90 0.87 0.28 3,92 0.46Noise -1.06 0.24 0.17 0,22 t.17 0,74 0.56 0.08 4.58 0.30
Drum Kit -1.19 0.32 0.00 0.4,_ 0.75 0.66 0.75 0.50 5.17 0.34
.Istener 3 Voice -1.68 0.52 -0,33 0,28 0.25 0.44 0,25 0.36 4,58 0.30Music -1.62 0.38 -0.26 0.2e 0,08 0.52 0.33 0.28 3,92 0,46
Noise -1.77 0.48 0.08 0.38 -0.08 0.38 0.33 0.28 4,17 0,34
Drum Kit -2.04 O.46 O.O0 0.34 0.33 0.44 0.42 0.30 4,25 0,36
Listener 4 Voice -0.88 0.90 -0.50 0.38 0.50 1,60 t.38 0.36 6,13 1.3,t
Music -1.88 1,06 -1.00 0.68 3.26 1,12 0.88 0.88 5,00 1.4_Noise -6.951 0.60 -0,25 0,50 1,30 1.351 0,881 0,26 7,50 0,92
Drum Kit -0.85 0.70 -0,25 0.58 1,76 1.24 1.38 0.36 5,25 0.98
Listener 5 Voice 0,20 0.46 -0.13 0.48 -0,75 0.50 1.013 O.00 6,75 1,12Music -1.06 0.84 -0.25 0.62 -0,38 0.92 0.88 0.26 6,13 1.38
Noise -1.13 0,78 -0,50 0.54 0,13 0.8(: 1.00 0.00 6,38 0.52Drum Kit -1.06 0.52 -0.38 0,36 -0.25 0.58 1.00 0.54 6,63 0.52
Listener 6 Voice 0,06 1.78 .0.25 6.50 t.25 1,3,4 -0.13 0.96 6,00 0.76Music -1.18 1,82 .0.88 0.80 1.00 1,28 -1,03 1.26 5,75 1,40Noise -1.38 1.32 -0.25 0.90 0.63 1.60 , -0,38 1,26 5,25 O.60
Drum Kit -0.31 1,80 0.50 0,66 0.25 1.7E '1.00 1.00 6,25 0,62
Listener 7 Voi_ -1.36 0.76 -0.50 0.54 -0.63 0.92 0,88 0,60 8.75 0.90Music -2.43 0.52 -0.76 0.50 -1.26 5.74 1.25 0.62 4.50 0.66
Noise -1,99 0.98 -0.50 0.54 -0,63 0.74 0.88 0.60 8.25 1.12
Drum Kit -1.89 0.88 -0,25 0.32 -0.38 1.58 0.88 0.60 4.50 0.76
TABLE 29
Page 4 5

VARIABLE * PROGRAMMEANS TABLE
Pref TBalance MBalance BBarence Spatial Qual_EXPIA ..Mean 65% CL Mean 95% Cb Mean 95%,CL Mean 95% CL Mean 95% CL
_/IndehleldAngle 55° Voice -0.34, 0.90 -1.32 0.5C 0.26 0.56 0.58 0,36 5.68 0.70WindshieldAngle 55° Mualc -1.57 0.46 -0.79 0.8C 0,26 0,52 1,00 0,62 5.32 0.54WindshieldAngle 55° Noise -1.35 0,66 -0.42 0.5( 1,16 0.68 -0.16 0,68 6.95 0.82WindshieldAngle 55° Dram Kit -1.56 0,46 -1.32 0.38 042 0.92 0,63 0,54 5.42 0.68
VVIndshlerdAngle 7___ Voice -1.45 0.52 -1,2t 0.58 0.37 0.68 0.32 __ 0.44 5,21 0.5.4VVlndshieldAngle 70= Music -1.84 0.76 -0,89 0.58 0.79 0.76 0.63 0.42 4.86 0.74_NlndshlelclAngre70_ Noise -1.44 0.55 -1,11 0.42 0.65 0.72 0.63 0,44 5,11 0.64_/IndshieldAngle 70= DrumKit -I.91 O.SB -1.05 0.52 -0.11 0.72 0.05 0.62 5,60 0.40
WindshieldAngle 90= Voice -1.13 0.44 -0.84 0,31_ 0.63 0.58 0.53 0.60 5,32 0.46WindshieldAn_]le90° Music -1,16 0,44 -0.84 0,4_ -0.05 0.86 0.66 0.56 4,79 0.62V'VIndshleldAnglo 90= Noise __ -136 0,52 -1,79 0.84 0,21 0.72 0.95 0.42 5.16 0.58vl,qndshleldAnglo 90= DrumKg _ -1,94 0.78 -1,47 0,54 0,00 0.58 0.47 0.36 5.16 0.66
_ndshield Anglo 180' Voice -1.57 0.62 -1.16 0.52 0.16 0.70 0,58 0,36 4.95 0.76_/_ndsh_ AP_It_'_90_ Music -1.42 0.64 -1.00 0.72 -0.05 0.74 0,41 0,50 4.47 0,70
V_/IndshleldAngle 180= Noise -1.81 0.66 -2.05 0.7( ,0.47 0.56 1,00 0.46 6.11 0,76_ndsh[eld Angle 180= Drum Kit -1,9OI 0.60 -1.42 0.52 -0,53 0.64 0.32 0.66 5.11 0,54
TABLE 30
pref TBalance MBalance BBarance Spatial Q_al_/EXP2 M_an 65% CL-- Mean 65% CL Mean 95%GL Mean 95% CL Mean 65% CL
:P(70=)wig DIS&Roof Voice -1.50 0,5( -1.06 0.58 6,59 0.68 0.35 0.48 5.0_ 0.56IP(70=)w/o Drs &Roof Mus[o -1.50 0,8_ -0.88 0.62 0,68 0.84 0.71 0.44 4.59 0.66IP(70=)wigDrs &Roof Noise -1.5_ 0.6: -0.95 0.40 0.68 0.74 0.6_ 0.48 5.3_ 0.80IP(70'=)wigDm & Roof Drum Kit -1,89 0.64 -1,00 0.52 0,06 0.76 0.24 0.58 5.06 0.44
IP(70=)w/Doors Voice .2.48 0,64 -1.36 0.42 0.96 0.92 0.941 0.36 4.0_ 0.38
i
IP(70°) wi Doors Music -1.08 0,98 -1.41 0.62 -0,35 0,56 1,f 2 0.72 4.881 0.38IP(70=}wi Doors Noise -2.77 0,60 -1.41 0.70 -0.41 0.70 1,29 0,42 3.76 0.40IP(70=)WiDoors DrumKg _ -1.99 0.94 -1.47 0,60 -0.29 0.80 1.41 0.54 4.71 0,56
IP(70")w/Roof Voice -2,28 0.66 -1.76 0.38 -0.41 0,82 0,88 0.30 4,68 6.72iP(70=)wi Roof Music -1.74 0.80 -1.56 0,42 0.12 0,70 1,29 0.84 4.79 0.58IP(70=)w! Roof Noise -2,95 0.60 ._2-2.00 0,42 0.76 0.66 0,_ 0.56 4.19 0.60IP(70=)wi Roof DrumKit -1.75 0.64 -1,53 0.42 -0,24 0,52 t ,0_ 0.66 4.53 0.52
,P(70=)wi Drs & Roof Voice -2.88 0.62I: -1.71 0.38 0.35 1.22 0,591 0,64 4.18 0.54IP(7(_)w/Dis & Roof Music -1,28 1,_' -1.71 0,84 -0,47 0.60 t ,68 0.62 4,41 0,46IP(70=)wi Dm& Roof Noise -- -2.61 0,64 -1.71 0,51: 0.00 0.82 1,59 0.54 4,12 0.52IP (70=I WIDIS&Roof Drum Kit -2.12 0.56 -1.59 0.34 -0,47 0,62 1,53 0.60 4,29 0.62
TABLE 31
Page 46
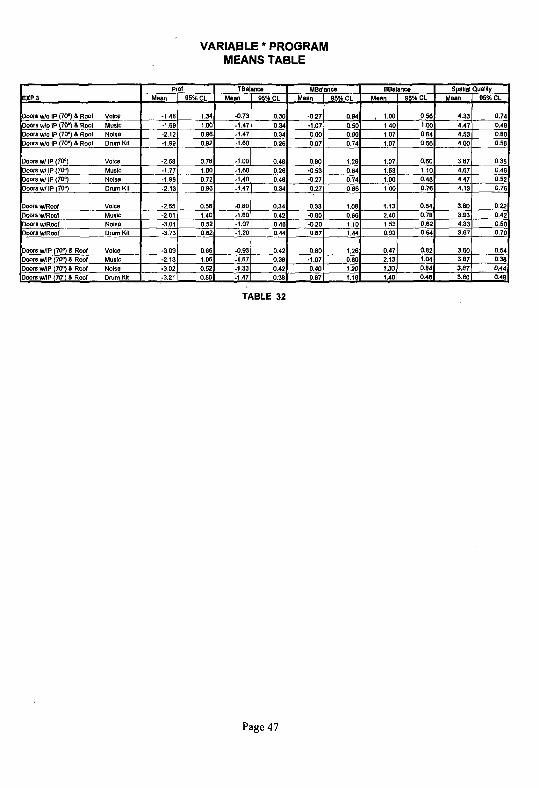
VARIABLE * PROGRAMMEANS TABLE
Pref TBerance .MBelanCe BBarance "S(]atlalQualityEXP3 Moan 95%CL Mean 05o_CL Mean 05%CL Mean I 85%Cf;, Mean 85%CL
_oorsw/oIP (70°)& Roof Voice -1,48 1.34 -0.73 0,30 -8,27 0,94 . 1.00 0,56 4.33 0.74DoorswlotP (70_)& Roof Music -1.69 1.0C .t ,47 0,34 -1.07 0.50 1,40 1.O0 4.47 0,48
Doorswlo I/:)(70°)& Rooff Noise -2.12 0.9_ .1.47 0,34 0.0_ 9.90 1.07 0,64 4.53 089Doorsw/oIP (70°)& Rool Drunl Kit -1.89 0.9_ -1.60 0.26 0.07 0.74 1.07 0.58 4,00 0.58
3oorsw/IP (?0=) Voice -2.58 0.70 -t .00 0,48 0,80 1.26, 1.07 0,60 3.87 0,38Doorswi IP(_70 °) Music -1.77 __ 1.0C .1,80 0.28 -0.53 0,84 1.53 1.10 4.67 0.463oorsw/JP(70 °) -- Noise -1.88 0,7_' -1,40 8.48 -9,27 0,74 1,00 0.48 4.47 0.52
Doorsw/IP (?0°) Drum KII -2.13 __ o.g( .t.47 0.34 _0.27 0.66 1,o_ 0.76 4,13 0.763oorsw/Roof Voice -2.55 0.5E -0.80 0,34 0.33 1,081 1.13 0.54 3.80 0.223oofsWlR(_f Music -2,01 1,4C 4.60 0.42 -0_] 0.66 2.40 0.78 3.93 0.42Doorsw/Roof Noise -3.01 0.52 -1.07 . 048 -O2O 1.10 1,50 . 0:62 4,33 0,50DoorsW/Roof Drum K8 -3.73 0.6._ -1.20 0.44 0.87 1._44 0.93 0.54 3,67 0.70
3oorsW/IP 70°)_ Voice -3.09 0.6E -0.93 0.42 0.8C 1,26 0.47 0.82 3.6C 0.54DoorsWlJP(70D)& Roof Music -2,13 1.80 :t.67 0.38 . -1.07 0,_ 2.13 1,_ 3.87 0.383oorswlIP (70°} & Roof Norse -3,02 0.52 .1.33 0.42 0,40 1.2£ 1.33 0.541 3.87 0.443oorsw/IP (7_) & Roof DramKit ,,, -3.21 0.50 -1.47 0.38 ,, 0.87 f.16 1,48 0.48 3.88 I 0.48
TABLE 32
Page 47

VARIABLE * PROGRAMMEANS TABLE
' '" pref TBalance MBalance BBalance SpatialQuatitl/EXP4 Mean 95% CL Moan 95% CL Mean 95% CL Mean 85%CL Mean 05%CL
IP Back55° Vol___ -2.77 0.76 .1.40 0,3_ 0,40 0.90 1,20 0,4C 4.70 0.52IP Back55° Mu.lo -2.9C 0.76 -1.90 0.3E -0.60 0.82 2.00 0.66 4.40 0.62IP Back55° Noise -3.1C 0.80 -1.70 O.3C 0.30 0.60 1.90 0.66 4.30 0.60IP Back55_ DrumKit -2,86 0,84 -1,30 0.3_ -0,40 0.96 t,50 0.44 3.80 0.72
IP Back70° Voice -3.42 0.74 -1.70 0.4_ 0,60 0.90 1.30 0.30 4.30 0.52IP Back70° Musl_ -2.81 0.80 -2.00 0,3C -0.80 0,50 2,10 0.92 4.20 0.84IP Back70° Noise -3.08 0.72 .1,80 0.5C 0.30 0.74 1.90 0.7C 4.10 0,66IP Back70o DrumKit -2.71 0.96 -1.00 0.3C -0.10 0.92 1.40 0.54 4.00 0,60
IP Back_ Voice -0.02 0.92 -1_.70 0.3C 0,20 0,78 1.20 0,66 4.20 0,50IP Back90° Music -3,34 0.58 -1.80 0.3lB -1,40 0.44 2.10 0.62 3.50 0.34
IP Back90° Noise -3,121 0.82 -1.90 0,BE -0.80 0,88 t,800 0.94 4.70 0.74IP Back90° Dram?it -3.06 0.88 -1,60 0,44 -0.30 1.04 1.00 0.5_ 3,80 0.58
rPBack 180° Voice -3.39 0,62 -1.80 0.26 -0.40 0.86 t ,40 0.62 3.90 0.46
IP Back 180° Musl_ .. -3._ -- 0.42 -1.60 0,BE -1.40 0.62 2,30 0.42 3.60 0.34IPBack 180° Noise -2.99 0.84 -2.10 0,7E .0,90 0.96 1.90 0.86 4.9(I 0,82IPBack 180O Drum Kit -3.46 0.8( -1.80 0.4(_ -0,90 0.92 t.50 0.44 3.40 0.44
Ip Forward55_ Voice -3.OS 0,74 -1,80 0.5C 0.50 1,20 t .50 0,44 4.40 0.62
Ip Forward65= Music -3.35 0.72l -1._0 0.46 -0.50 0,90 2.10 0.70 3.70 0:42IPForward55" Noise -2,78 0.70 .1.70 0.42 0.30 0.80 t.70 1.00I 4.40 0.32IPForward55° Drum Kit -3,0t 0,98 -1.60 0.32 -0.20 0,88 t,30 0.90 I 4.20 0.84
IPForward70° Voice -2,69 0,72 -t.30 0,3(_ 0.20 0,98 1.00 0.42 4,40 0.54IPForward70" MusK: -2,67 0.78 -t.80 0.46 -0.40 0,44 2.10 0.66 4.20 0.50
IPForward70o Noise -2.85 0.74 -t_70 0.3__ 0,20 0,78 1.80 0.72 4.10 0.___IP Forward70° DramKit -2.65 0.94 -t,70 0,5_ 0.30 1.00 1.20 0.50 4.00 0.52
IPForward90O Voice -3.100 0.90 .t.50 0.44 -0,10 0,96 1,50 0.44 4.20 0,68_IPForward90O MusIo -3,59 0,7,_ -1.70 0.30 -1,40 0.44 ' 2.10 0.62 3.70 0.30
Ip Forward9(___ Noise -3.09 O.BE -2..10 0.45 -0,70 0,80 1.80 __ 0.94 4.30 0.42IPForward90O Drum Kit -2.98 0.9E -1.80 0.44 -0.10 0,82 1.60 0.44 4,00 0.42
IPForward180° Voice -3.39 0.64 -t ,70 0.36 -0.40 0.96 1.30 0,52 3.70 0.42IPFomvard1800 Music -3.89 0.58 -2,00 0.62 -1.90 0.36 2.20 0.68 3.30 0.30IPForward180° Norse -3,21 0.80 -2,10 0.76 -1.00 0.84 1.80 0,94 4.00 0.52IPForward180e Drum Kit -3.62 0,66 .2,00 0,42 -0.90 0.82 1.90 0.46 3.20 0.72
TABLE33
Page 48

VARIABLE * PROGRAMMEANS TABLE
Pref TBalance MBalance BBalance spatialQuality
EXP8 Mean · 95% CL Mean 96% CL Mean 95% CL Mean 05%CL Mean 05% CL
3oorHigh Voice -2.68 0,64 -0.76 0.50 -0.24 1.18 0.94 0.50 4,06 0.343eotHigh Music -2,86 0.52 -1.65 0.34 -1.53 0.48 2.59 0.60 4,12 0.443oorHigh Noise -2,95 0.5C -1.12 0.48 -0,0e 0.94 1.64 0.36 4,35 0.643eotHigh Drum Kit -2,52 0,58 -1.41 0.38 -0,41 0.76 1.47 0,30 3,94 0.46
3oorLow Voice -3.46 0.6C -2.35 0,42 -1.41 0,94 1.29 0.62 3,28 0,443oorLow Music -4.01 0,5C -3.00 0.54 -2.47 0.42 2.71 0.62! 2,82 0,84:)oorLow Noise -3.22 .0.7_ ' -2.65 0.56 -0.94 0.94 2.06 0.44 3,68 0.463oorLow Drum Kit -3.86 0,54 .3.00 0,56 -1.55 0.70 1.76 0.44, 2,94 0,50
TABLE34
Pref TBalance MBalance BBalance Spatial Quality-'-XP4/5 Mean 95% CL Mean 05%CL Mean 05%CL Mean 05% CL Mean 65% CL
PBack Voice -3.42 0.74 -1.70 0.42 0.60 0.90 1.30 0.3C 4.30 0.52p Back Music -2,81 0,80 -2.00 0.30 -O.80 0,50 2,10 0,9,_ 4.20 0,8,_PBack Noise -3.08 0.72 -1.80 0.50 0.30 0,74 1.90 0.7c 4.10 0.6(PBack Drum Kit -2.71 0,96 -1.30 0.30 -0.10 0,92 1,40 0.54 4.00 0.6C
PForward Voice -2,68 0.72 -1,30 0.30 0.20 0.98 1,00 0,4._ 4.40 0.54PForward Music -2,67 0.78 -1.go 0.46 -0,40 0.44 2,10 0.5_ 4.20 0.r_PFolward Noise -2.85 0.74 -1.70 0.30 0,20 0.7_ 1.80 0,72 4.10 0.3_
lip Forward Drum Kit -2.65 0,94 -1,70 0.52 0,30 1.6( 1,20 0,6C 4.00 0.52
)oor Hl_lh Voice -2,68 0,64 -0.76 0.50 -0,24 1.1E 0.94 0,6C 4.00 0.34}oor High Music -2.85 0,52 -t,65 0.34 -1.53 0.4_ , 2.69 0.6C 4.12 0.44
DoorHigh Noise -2.95 0.50 -1.12 0.48 -0.06 0.94 ' 1.94 0.38 4.35 0.64DoorHigh Drum Kit -2,52 0,58 -1.41 0.38 -0.41 O.7E 1.47 0.30 3.94 0.46
DoorLow Voice -3.46 0.60 -2.35 0.42 -1.41 0.94 1,29 0.62 3.29 0.44DoorLow Music -4.01 0.50 -3.00 0.54 -2.47 0.42 2.71 0.62 2.82 0.64
DoorLow Noise -3.22 0,76 -2.65 0,56 -0.94 0.94 2.06 0.44 3.65 0.46
DoorLow Drum Kit -3_86 0.54 -3.00 0,56 -1.55 0.7C 1.76 0.44 2.94 0,5(3
TABLE 35
Page 49

VARIABLE * PROGRAMMEANS TABLE
Pref TBalance MBalance BBalance Spatial QualityMean 65% CL Mean 95% CL Mean 05% CL Mean 95%CL Mean 95% CL
WindshieldAn[lie 55° Voice -0.96 0.72 -0,28 0,28 0,35 0.88 0.76 0.45 5.69 0.72WindshlerclAngle 55° Music -1.24 0.54 0,00 0.38 0,65 0.62 0.41 0.78 5.47 0.76WindshieldAngle 55* Noise -1.38 0.44 0.06 0,58 0.76 0.70 0.71 0,28 5.65 0.66WindshieldAngle 55° Drum Kit -0.58 0.52 0,24 6.2._ -0.24 0.72 0.76 0.48 6.88 0.66
W]ndshleldAngle700 Voice -0.99 0.66 -0.41 0,3,4 0.94 0.76 0.65 0.34 5.00 0.62WindshieldAngle 700 Music -2,55 0.62 -0,24 0.38 1.88 1.02 0,59 0.48 4.06 0,60
Wi_ndahleldAngle 70° Noise -1.85 0.62 0.12 0,24 1.00 0.84 0.47 0.66 5.24 0.84WindshieldAngle 70a Drum Kit -1.92 0.48 -0,29 0.48 1,47 0.82 0.47 0.46 6.06 0.52
WindshieldAngle 900 Voice -0.65 0,70 -0.28 0.28 0.29 0.54 0.65 0.42 5.35 0.54WindshieldAn[lie 90_ Music -1.19 0.88 .0.85 0.42 0.47 0.92 0.47 0.68 4.65 0.72WindshieldAngle 900 Noise -0.83 0.40 -0.47 0.34 -0.16 0.46 0.76 0.40 8.71 0.56
WindshldldAngle 90° Drum Kit -t.86 0.68 -0.06 O.4C 0.29 0.80 0.18 0.64 5.18 0.46
WindshieldAngle 1800 Voice -0.78 0.72 -0.59 0.42 ,-0.06 0.50 1.06 0,36 5.65 0.74WindshieldAngle 1800 Music -0.61S 1.00 -0.88 0.48 0.18 0.76 0.71 0.48 5.35 0.86
WindshieldAn[lie 1800 Noise -1.0_ 0.66 -0.88 0.48 -0.29 0,58 0.71 0,28 5.71 0.74WindshieldAngle 1800 Drum Kit -0.98 0.62 -0.59 0.34 -0.53 0.58 0.76 0.40 5.24 0.62
TABLE 36
Page 50

-3O
40
40
I0 IOO lO00 lO000 _OO000
Page 51

o
ExperimentI - Anglesa Left Ear & Speaker
'_ 5_dq
Time (msec)
007 337 643 973 1503
0
Experiment I - Angles
k _ Right Ear & Speaker 'Graph 4
/'
65de;
.20
==
/i Time {ma_}
00* ,,7 a43 973 13o3
Page 52

tO _o _ooo 1oooo 1ooOOO
Page $3

Experiment 2 - Boundary VariablesRightEa_'& Speaker
Graph7
t 7o¢e_e_ofzo
-3o
-4o
,50o32 362 6,;t2 [[(22 1'3.5_ 16_2 2o,_2 23,42 26?_ _o02
o Experiment 2 - Boundary VariablesLeftEar& Speaker
rod_Mr
Graph8
-2o " //
o 3_ 3 e_ 8 e2 m 22 _ e2 1__; 2__2 2_.'_2 2_72 _002
Page 54

IO
Left&Right Speaker, 65 msec70 deg, O0ofs, Roof, Left EaT
Graph 9a
.i
'llme (maec)
_O0.co 4.9'_ 9.;10 14.65 18.80 24.75 29.70 34.65 3g_ 44.155 49.50 54,45 69,40 6435
10
Left&Right Speaker, 65 msec70 d_, Doom, Roof, R_ht Ear
o Graph 9b
.3O
'4O
-5O
-70
I
Time (mlec) ]
'tl°o_ 4N 900 1405 1980 5475 2970 346_ 3960 44s5 49_ 5445 5940 543;
Page 55

Oross[alK ' - -
45 deg, Roof, Doors
Graph 10
_o
m
.3o
RightEar,Le_$pk //
Le_Ear,Lefl $pk
RJghtEar, R_ht$pk
LeE Ear, R_ht Spk
Time (nusec)
009 3.56 _*77 10.24 13.70
I0
Experiment 415 - Locations
Right Ear & Speaker
BackIP Graph 11o
FrontIP UppexOoor
.Io
.ao
-3o
4o
Time (mi,R}
*so --
0 32 3 62 e o2 1022 1357 1682 2012 2342 2672 3002
Page 56
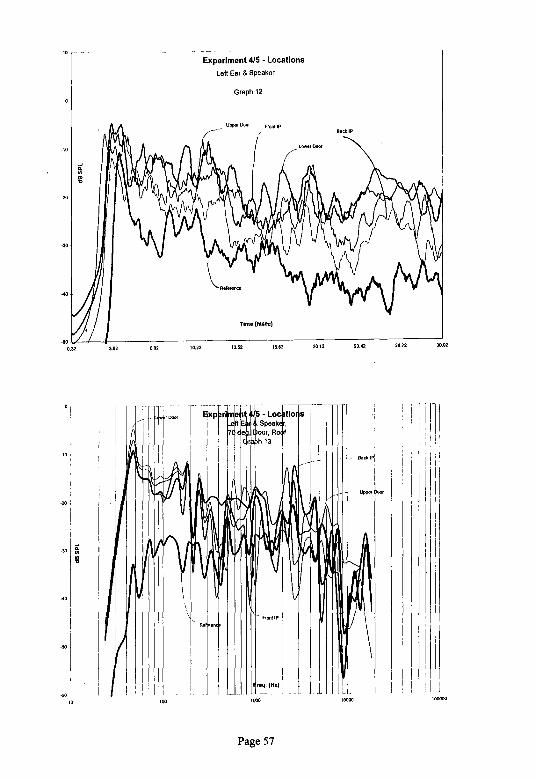
lo .... -
Experiment415- LocationsLeft Ear & Speaker
Graph 12o
Up_orO_r Fron[iP, _, / aaCkIP
._o _' LowerOcor '
_nca
.2o.3O
'nme (msec)
0.32 362 6 92 10.22 13.52 1662 2012 23.42 2_.72 30.02
il
i
i Upper r-2o
m
-4o
I
Page 57
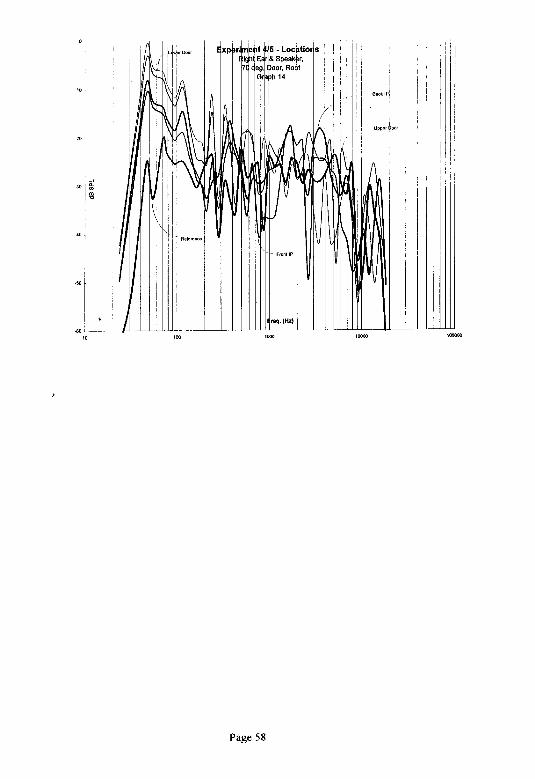
o
lu e._ ip
upper _oor
2O
m
-6O ..
1o tr_ looo 1oo00 _c_¢¢_
Page 58