Presented at 15 Annual Crop Production Clinic March 6...
33
Presented at 15 th Annual Crop Production Clinic March 6, 2014; Goodwell, OK Saleh Taghvaeian (405) 744-8395 [email protected]
Transcript of Presented at 15 Annual Crop Production Clinic March 6...

Presented at 15th Annual Crop Production Clinic
March 6, 2014; Goodwell, OK
Saleh Taghvaeian
(405) 744-8395 [email protected]

Presentation Outline
i. Introduction
ii. Main irrigation scheduling methods
1) Evaporometers
2) Mesonet
3) Soil moisture
4) Canopy temperature
iii. Question

Introduction
• Irrigation scheduling is the science (and art) of
determining when and how much water to apply to
maximize water use efficiency and crop production.
• Why irrigation scheduling?

1) Evaporometers
• Measure evaporation of water from a container
• Evaporated water is directly related to crop water use
i. Easy pan
ii. Atmometer
1-i) Easy pan
• Can be home-made with cheap available material
• It accounts for irrigation (sprinkler) and rainfall events
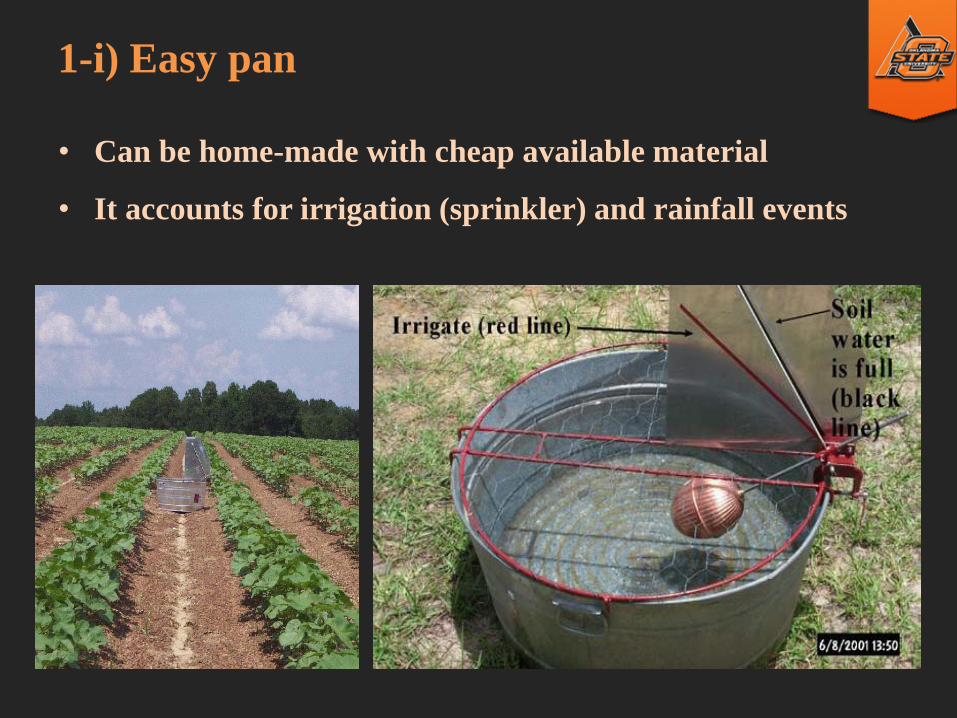
1-ii) Atmometer
• Main Components:
• Green fabric
• Porous ceramic cup
• Water reservoir
• Suction tube
• The green fabric simulates
crop canopy
• Refill with distilled water
• A widely used model: ETgage
http://www.etgage.com/
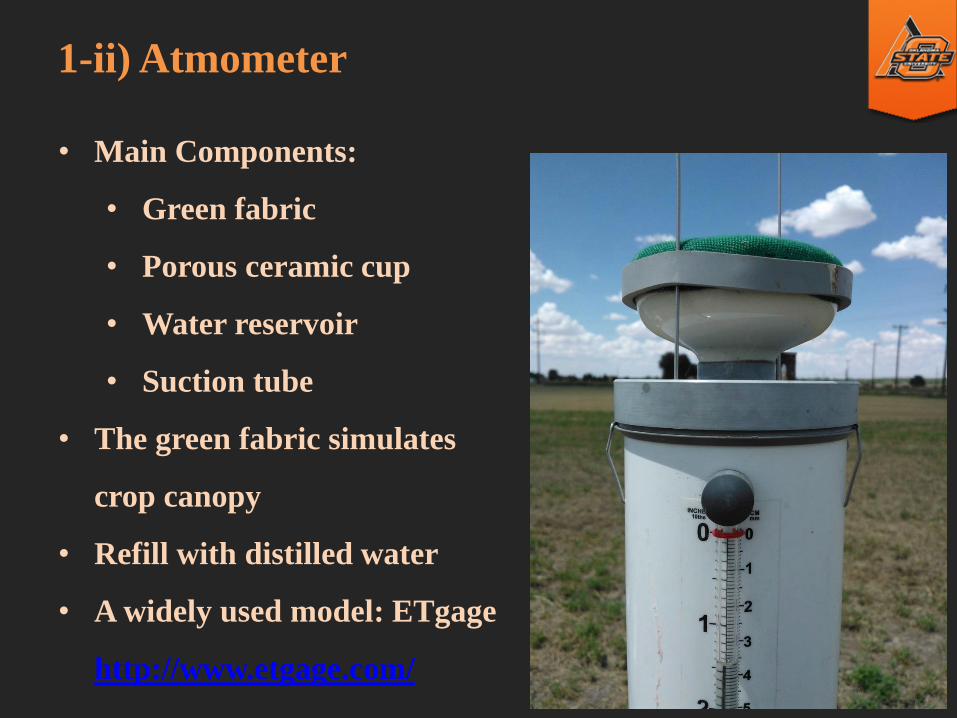
1-ii) Atmometer
2) Mesonet
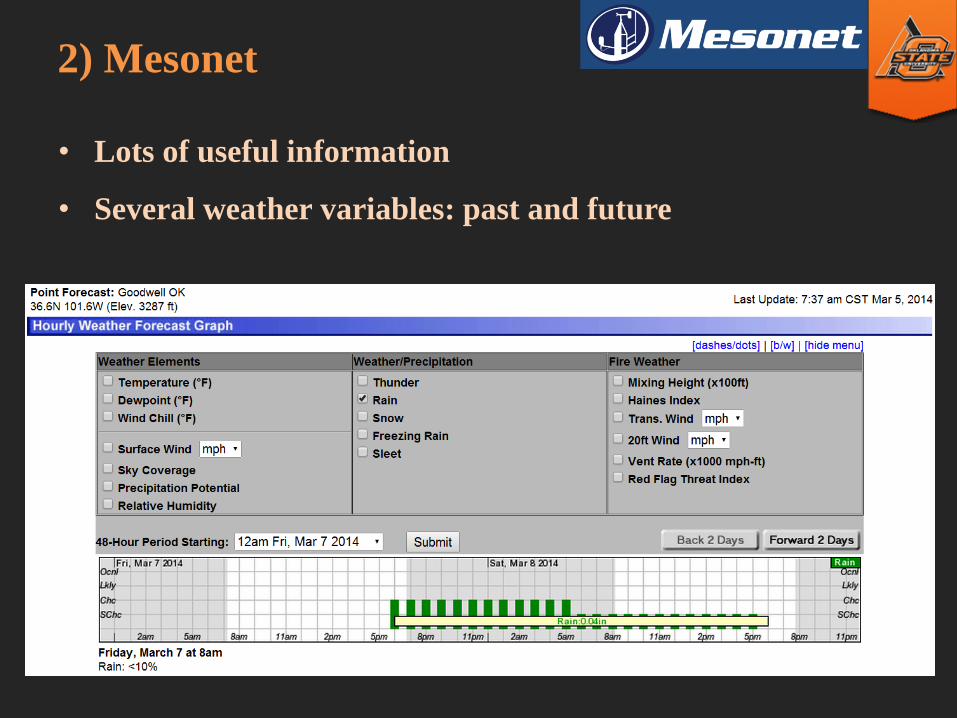
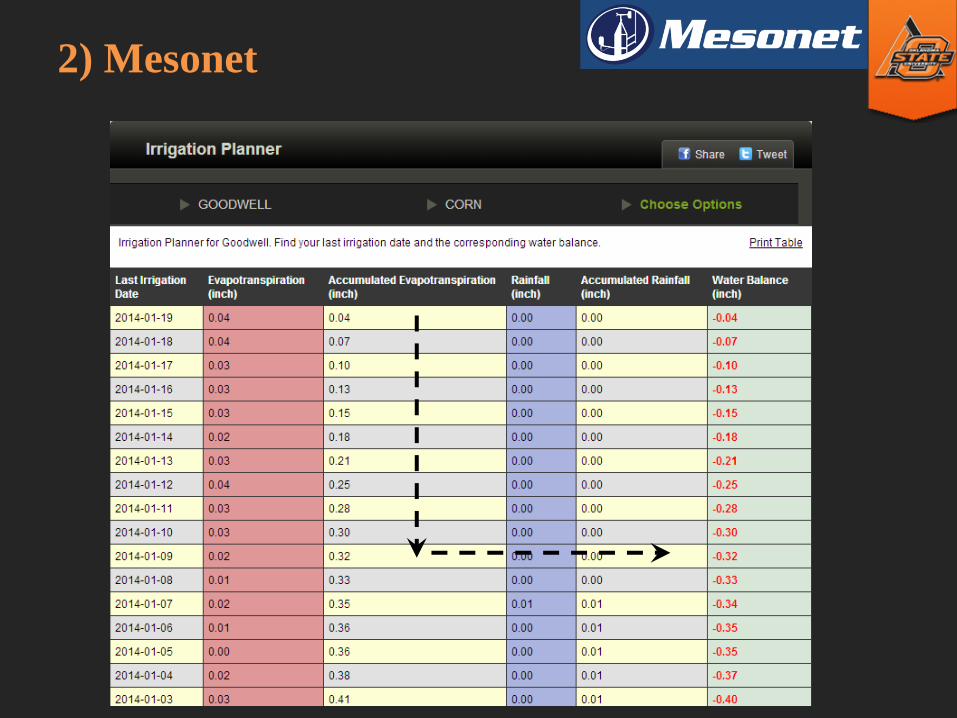
• Lots of useful information
• Several weather variables: past and future
2) Mesonet

3) Soil moisture
• Soil moisture limits

3) Soil moisture
Solid particles
Voids

3) Soil moisture
Solid particles
All voids are filled with
water: Saturation

3) Soil moisture
Solid particles
Gravitational water is
drained: Field Capacity

3) Soil moisture
Solid particles
Additional water is extracted
by crops, stress starts: MAD
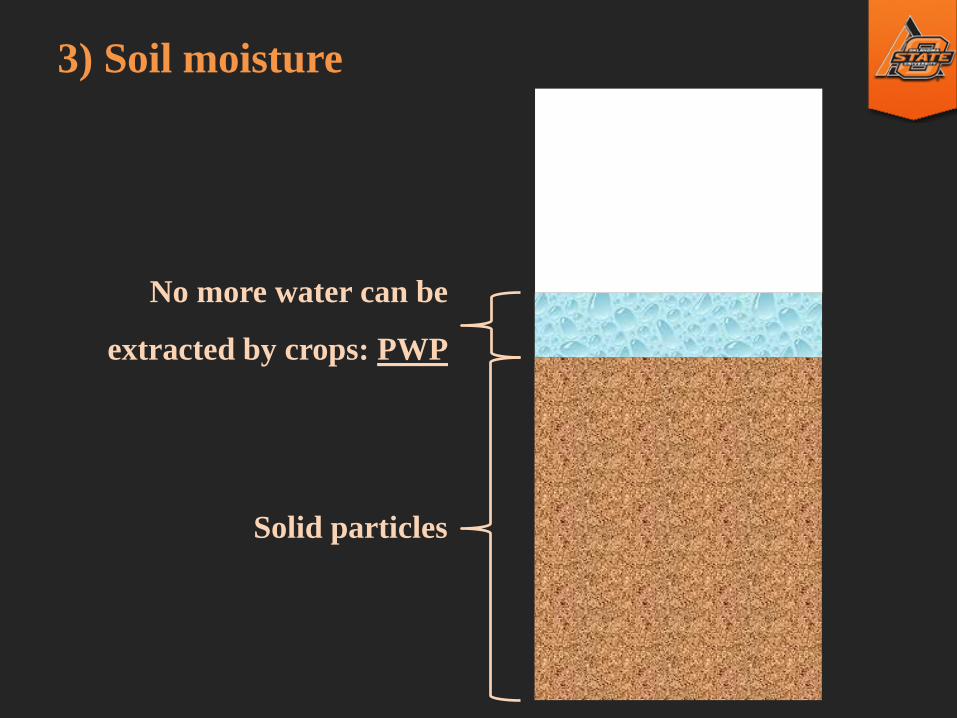
3) Soil moisture
Solid particles
No more water can be
extracted by crops: PWP

3) Soil moisture
Solid particles
Field Capacity
Maximum Allowable Depletion
Permanent Wilting Point

3) Soil moisture
Clay loam
Corn
FC = 33%
MAD = 25%
PWP = 18%
Saturation = 42%
Estimating irrigation depth:
• FC – MAD = 8%
• Root depth = 3 ft
• Irrigation depth:
0.08 × 3 = 0.24 ft
= 2.9 inches
A
C
C
U
R
A
C
Y
7%

3) Soil moisture
Soil moisture sensors
• Tensiometers
• Electrical resistance
• Heat dissipation
• EM-based:
Capacitance
Travel Time

3) Soil moisture: Tensiometers

3) Soil moisture: Tensiometers
• Have limited range (perform better near FC)
• Work better in heavy soil
• Have slow response time
• Require maintenance Lauren Settles,
Henderson County extension intern, Kentucky

3) Soil moisture: Electrical Resistance
• Also known as gypsum blocks
• The drier the soil, the larger the R
• Can be connected to a data-logger or a hand-held device
• Have limited range (perform better near FC)

3) Soil moisture: Heat Dissipation
• Porous ceramic body
• Heating element
• Thermocouple
• Have a larger range
• Pores may clog
• Affordable

3) Soil moisture: Capacitance
• Send an EM field into the soil
• Soil becomes the dielectric of a capacitor in an oscillating
electric field
• The oscillation frequency decreases as water increases
• But it is also sensitive to temperature, clay content,
salinity, and bound water
• Non-uniform EM field: attracted to more conductive
parts of the soil

3) Soil moisture: Capacitance

3) Soil moisture: Travel Time
• Measure the time it takes a pulse to travel along a rod
• The travel time increases as water increases
• Significantly less sensitive to salinity and temperature

4) Canopy temperature
• Water transpiration requires energy
• The higher the water use rate, the cooler the canopy

4) Canopy temperature
• Hand-held infra-red thermometers
• Less than $150

4) Canopy temperature
• Comparison to a reference
temperature

-15
-10
-5
0
5
10
210 220 230 240 250 260
Ca
no
py T
em
p -
Op
tim
um
Pla
nt
Te
mp
(F
)
Day of Year (2010)
Full Irrigation Treatment
-15
-10
-5
0
5
10
210 220 230 240 250 260
Can
op
y T
em
p -
Op
tim
um
Pla
nt
Tem
p (
F)
Day of Year (2010)
Deficit Irrigation Treatment
4) Canopy temperature
• Comparison to a constant temperature
• Optimum plant temperature for corn < 82 F
4) Canopy temperature
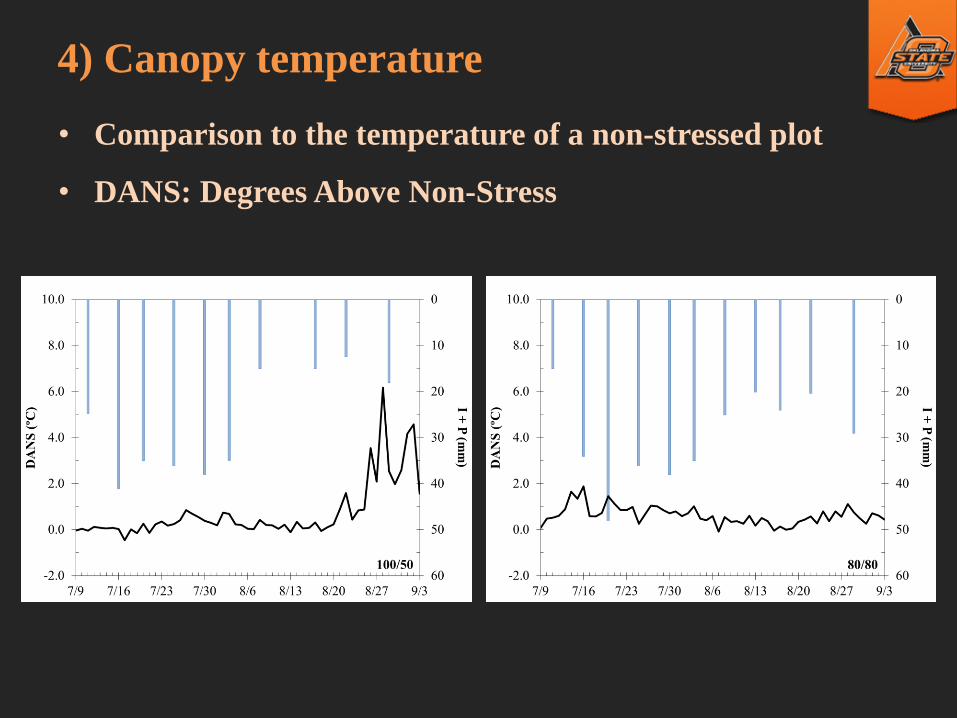
• Comparison to the temperature of a non-stressed plot
• DANS: Degrees Above Non-Stress

4) Canopy temperature
• Comparison to the temperature of a non-stressed plot
• DANS: Degrees Above Non-Stress

4) Canopy temperature: 77 – 113 ˚F
07/1
9/1
2
08
/09
/12
77 77
77 77
113 113
113 113
07
/26
/12
0
9/0
5/1
2