Presentation1 eco
18
ECOLOGICAL PYRAMIDS
-
Upload
manju-madhav -
Category
Documents
-
view
36 -
download
0
Transcript of Presentation1 eco
ECOLOGICAL PYRAMIDS

Graphic representation of the trophic structure and function of an ecosystem with special reference to the number of individual organisms, biomass and energy level
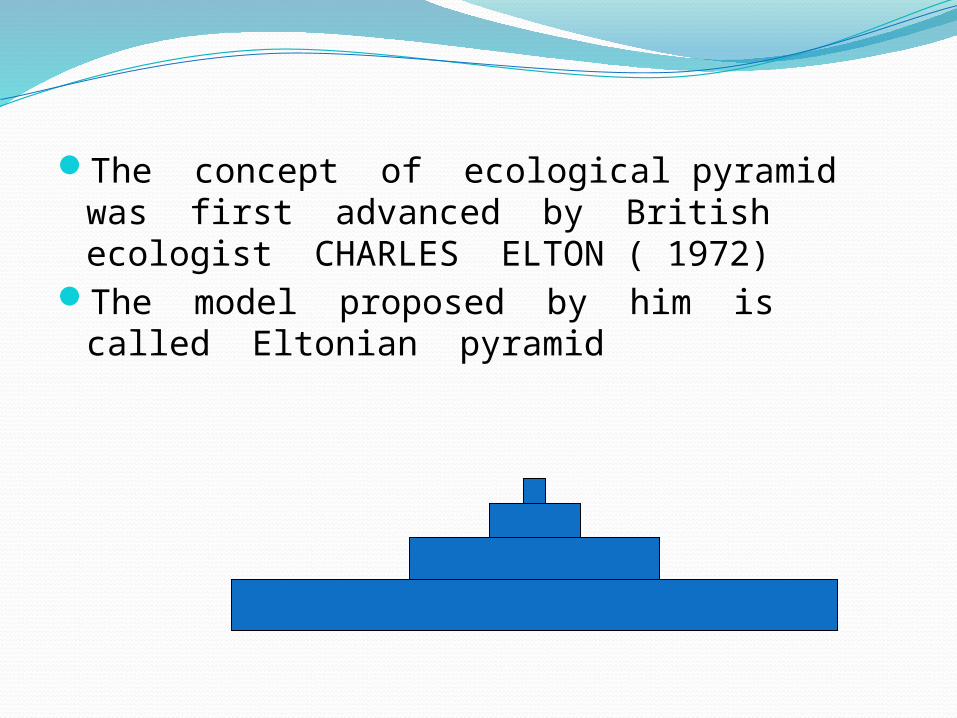
The concept of ecological pyramid was first advanced by British ecologist CHARLES ELTON ( 1972)
The model proposed by him is called Eltonian pyramid
Three types of ecological pyramids
Pyramid of Energy
Pyramid of Biomass
Pyramid of Numbers
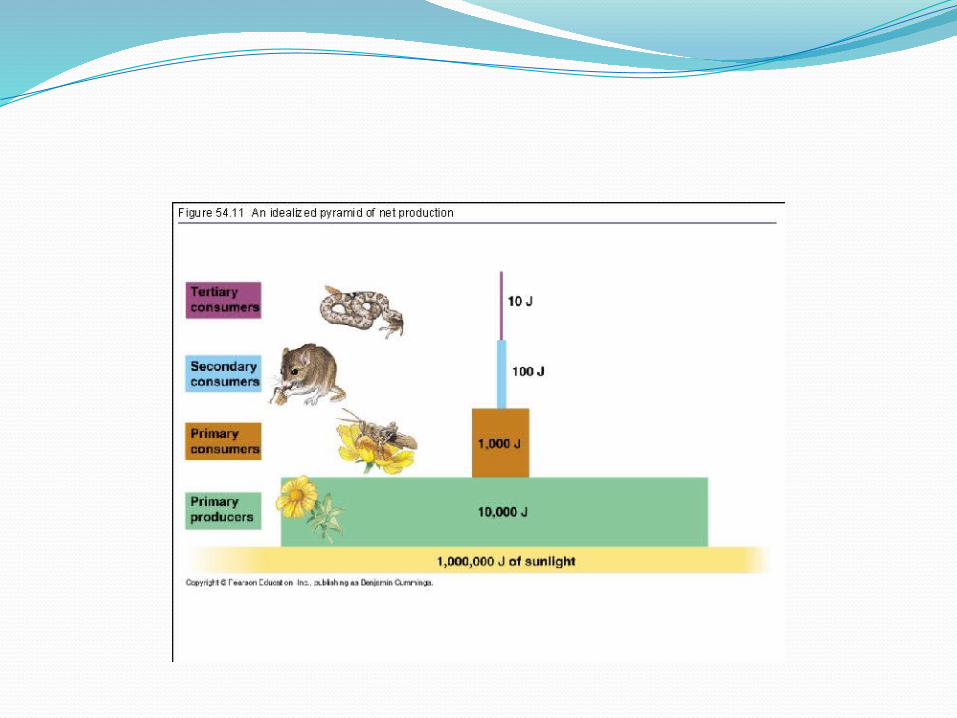
Pyramid of Energy Graphic representation of the energy level
& energy flow in the different trophic levels of ecosystem
Gives general picture of functional state of communities , energy content of each trophic level & loss of energy from each trophic level
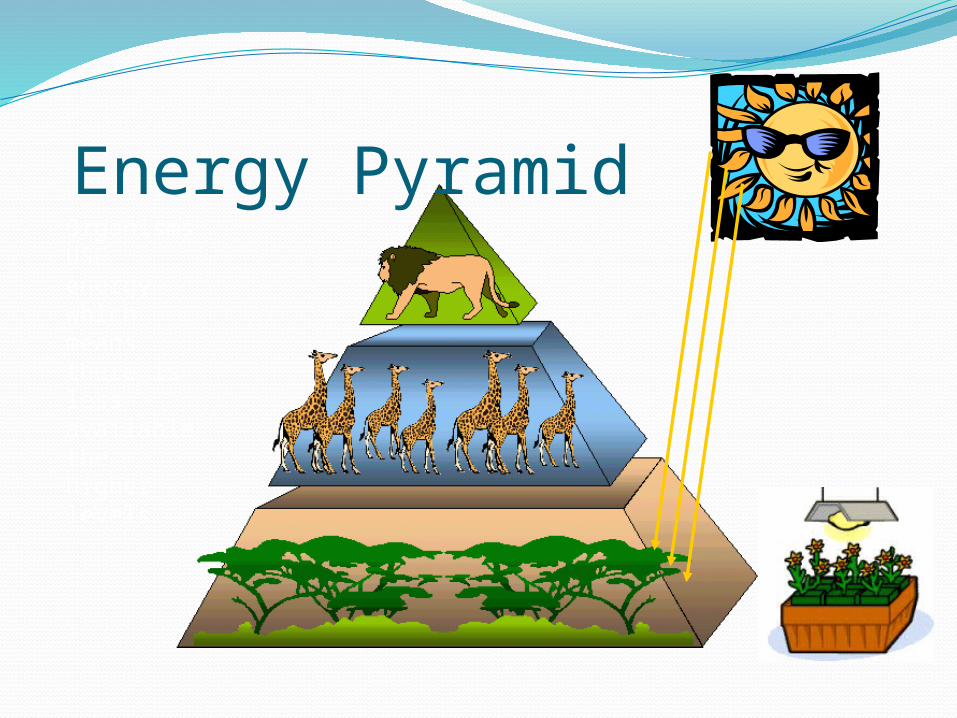
Energy PyramidOrganisms USE energy which means there is less available the higher levels
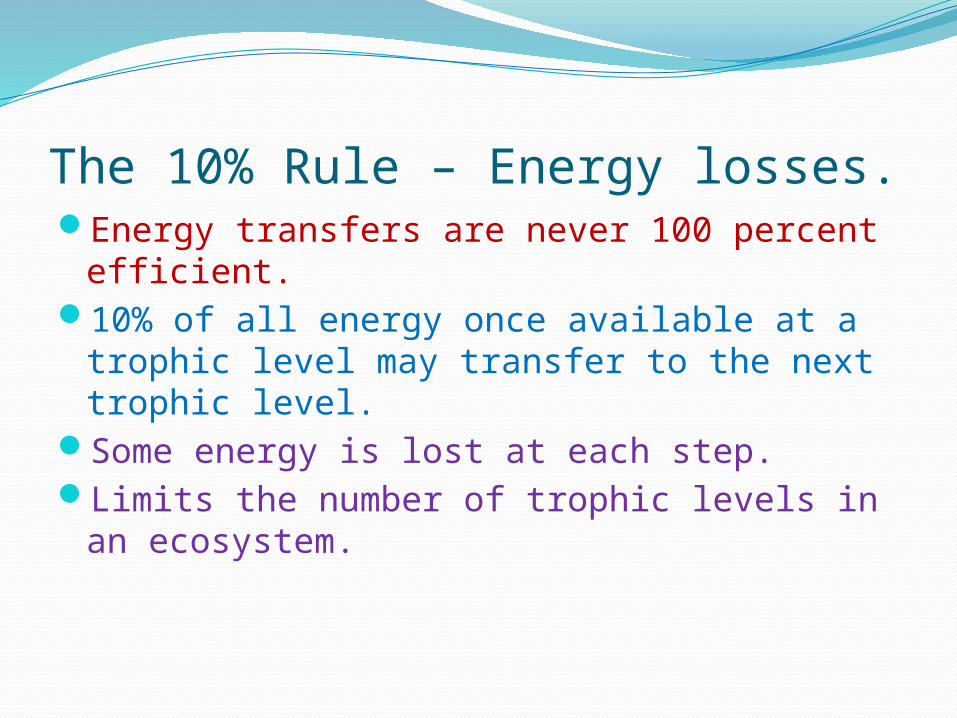
The 10% Rule – Energy losses.Energy transfers are never 100 percent
efficient.10% of all energy once available at a trophic
level may transfer to the next trophic level.Some energy is lost at each step.Limits the number of trophic levels in an
ecosystem.
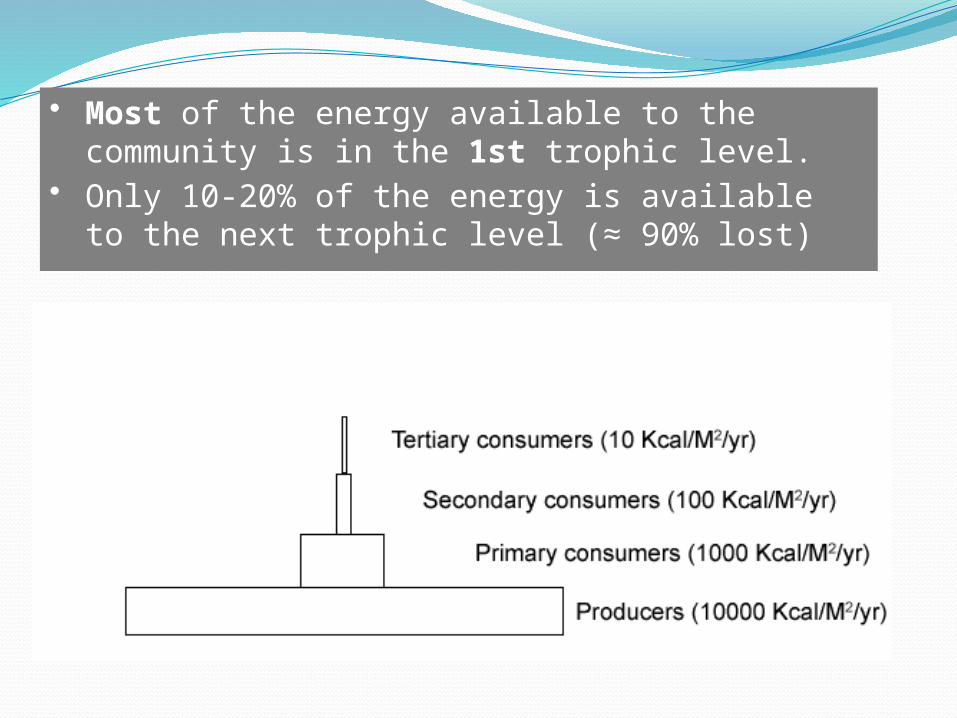
• Most of the energy available to the community is in the 1st trophic level.
• Only 10-20% of the energy is available to the next trophic level (≈ 90% lost)
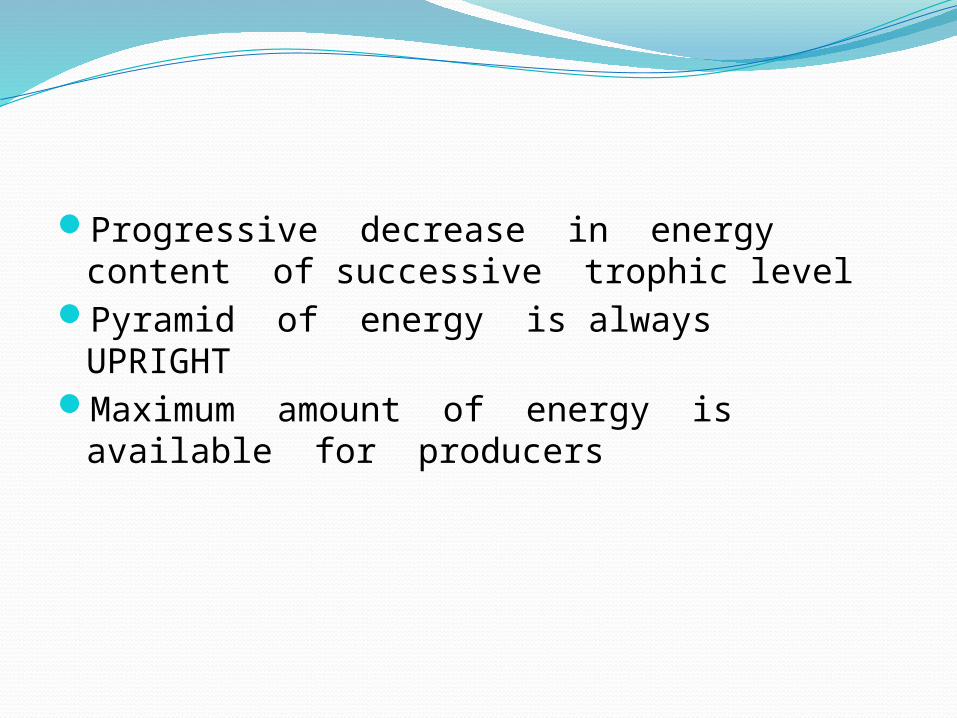
Progressive decrease in energy content of successive trophic level
Pyramid of energy is always UPRIGHTMaximum amount of energy is available
for producers
Pyramid of Number
Graphic illustration of the numerical relationship between different trophic levels of a food chain.
It indicates the total number of individual organisms in the trophic levels of an ecosystem
Number pyramid diagrams may be: upright pyramids inverted pyramids
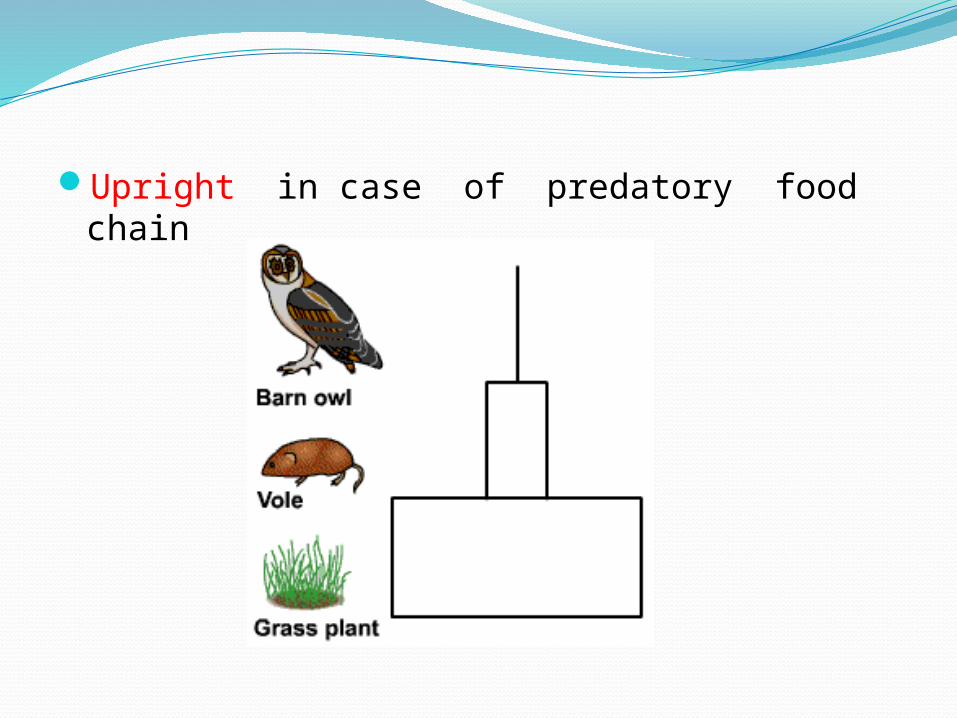
Upright in case of predatory food chain
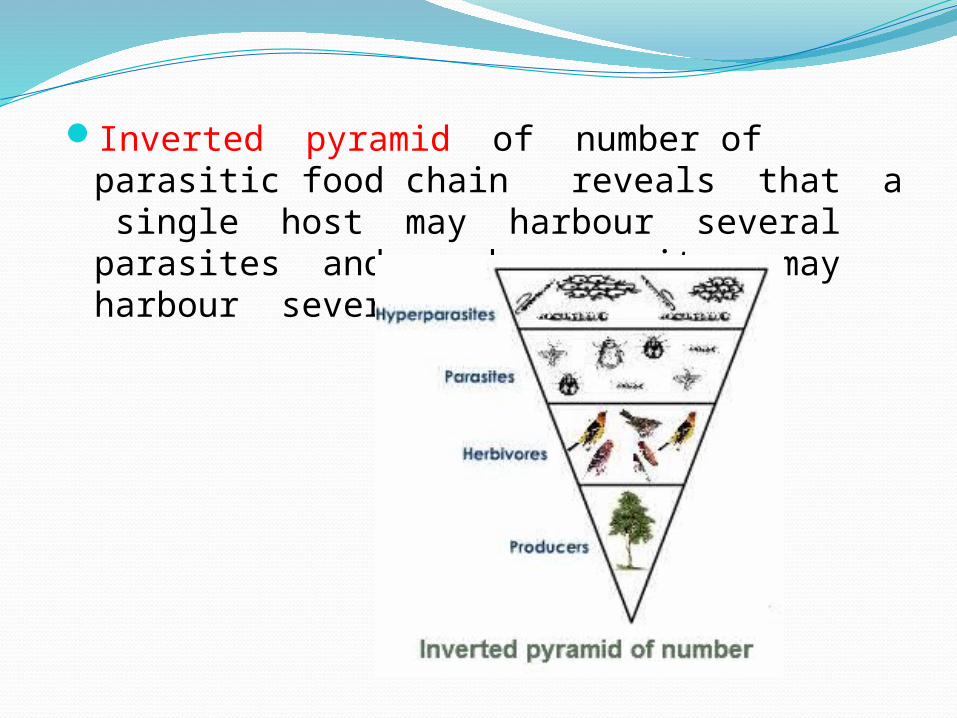
Inverted pyramid of number of parasitic food chain reveals that a single host may harbour several parasites and each parasite may harbour several hyperparasites

Pyramid of BiomassBiomass represent the total dry weight of
individual organisms.These show the total biomass of organisms at
different trophic levels, which depends on:the energy available at each trophic levelthe standing crop at each trophic level
Biomass pyramid diagrams may be: upright pyramids inverted pyramids

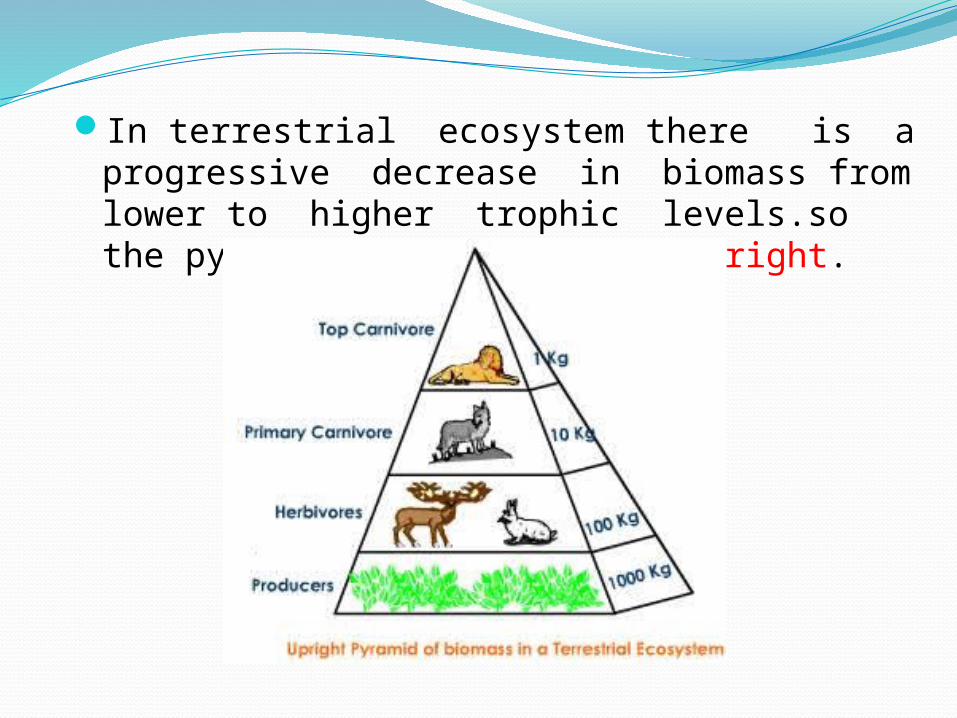
In terrestrial ecosystem there is a progressive decrease in biomass from lower to higher trophic levels.so the pyramid of biomass is upright.
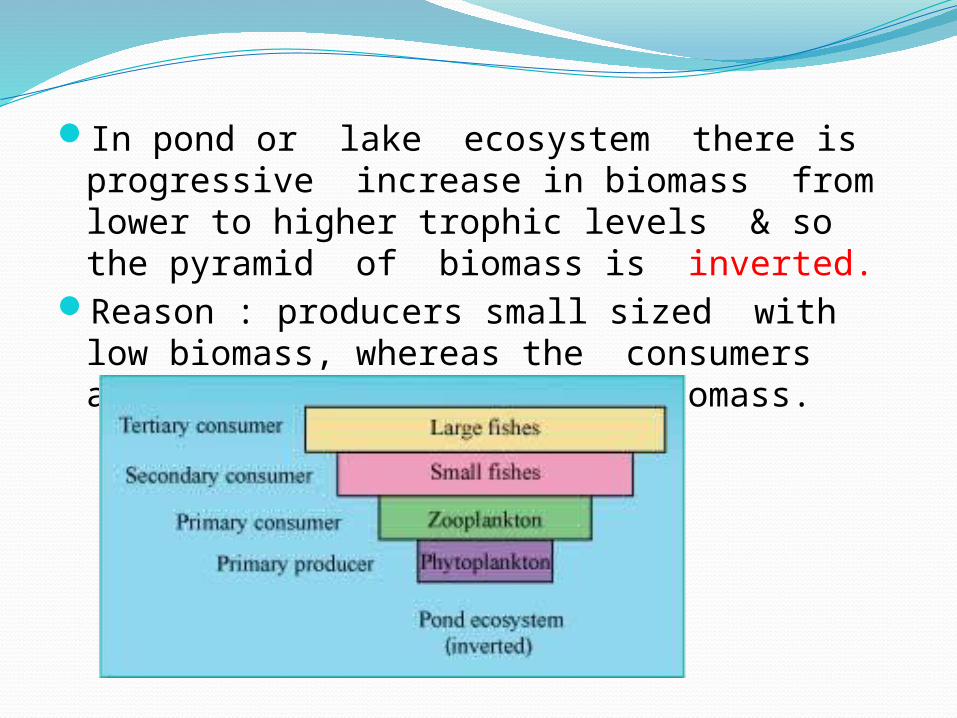
In pond or lake ecosystem there is progressive increase in biomass from lower to higher trophic levels & so the pyramid of biomass is inverted.
Reason : producers small sized with low biomass, whereas the consumers are large sized with high biomass.
Short comings of ecological pyramids
Do not provide any clue regarding seasonal and daily variations in the number of individuals, biomass and energy level
Omnivores feed on members of different trophic levels , thus belongs to different trophic levels cannot be properly represented in ecological pyramids


![Eco presentation1[2]](https://static.fdocuments.us/doc/165x107/55a07c321a28abfc578b45ee/eco-presentation12.jpg)

![Presentation1.ppt [โหมดความเข้ากันได้] · Title: Microsoft PowerPoint - Presentation1.ppt [โหมดความเข้ากันได้]](https://static.fdocuments.us/doc/165x107/5ec776d210d7bd5f6f00774b/aaaaaaaaaaaaaaaaaa-title-microsoft-powerpoint.jpg)