Presentation Vimala Nairwaterinstitute.ufl.edu/research/projects/downloads/...vimala_nair.pdf · A...
24
A E Bh Bw A E Bh Bw Phosphorus storage and release characteristics pertinent to watertable management and BMP implementation for Okeechobee Basin soils Vimala Nair Soil and Water Science Department University of Florida June 04, 2008
Transcript of Presentation Vimala Nairwaterinstitute.ufl.edu/research/projects/downloads/...vimala_nair.pdf · A...

A
E
Bh
Bw
A
E
Bh
Bw
Phosphorus storage and release characteristics pertinent to watertable management and BMP
implementation for Okeechobee Basin soils
Vimala NairSoil and Water Science Department
University of Florida
June 04, 2008
22
A
E
Bh
Bw
A
E
Bh
BwOutline
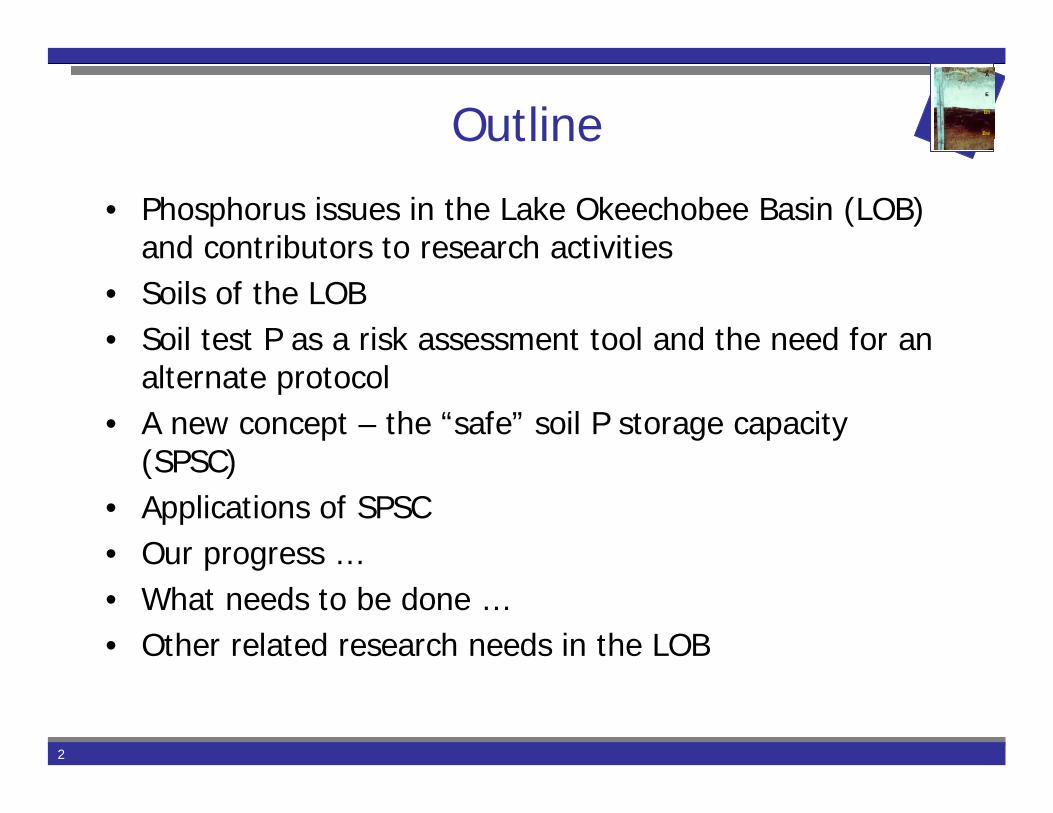
• Phosphorus issues in the Lake Okeechobee Basin (LOB) and contributors to research activities
• Soils of the LOB• Soil test P as a risk assessment tool and the need for an
alternate protocol• A new concept – the “safe” soil P storage capacity
(SPSC)• Applications of SPSC• Our progress …• What needs to be done …• Other related research needs in the LOB

33
A
E
Bh
Bw
A
E
Bh
BwPhosphorus Transfer
Wetlands & Streams
[sink/source]
LakeOkeechobee
Lake [sink]
Uplands[sink/source]
Fertilizers, Animal wastesBiosolids, Wastewaters
Credit: K. R. Reddy and P. Inglett

44
A
E
Bh
Bw
A
E
Bh
BwSoils of the Lake Okeechobee County
Histosols2%
Alfisols3% Mollisols
4%Inceptisols4%
Others 11%
Entisols12%
Spodosols64%
Source: Vickie Hoge

55
A
E
Bh
Bw
A
E
Bh
BwSoils of Florida Watersheds
Sand grain coatings,
their presence or absence,
makes a bigdifference in
P retention capacity
A
E
Bh
Bw
Entisol
SpodosolCredit: Willie Harris

66
A
E
Bh
Bw
A
E
Bh
BwThe Need for a New Protocol
• Low value of soil test P (STP) is not necessarily an indicator of low environmental risk if P is added to a soil
• Some sandy soils, such as the Spodosols of the LOB could have 99% quartz sand in the upper horizons and negligible P retention
• STP does not convey the amount of P that can be safely added to a soil in an absolute sense
Nair, V.D., and W.G. Harris. 2004. New Zealand J. Agric. Res. 47:491-497.

77
A
E
Bh
Bw
A
E
Bh
BwDevelopment of a New Protocol
• Based on extractable P of soil• Also on P retention capacity of soil (related to Fe+Al)• New tool: “Safe” Soil P Storage Capacity (SPSC)• Calculations based on oxalate-extractable P, Fe and Al• Calculations can also be based on P, Fe and Al in
Mehlich 1 or Mehlich 3 solutions
USDA-IFAFS

88
A
E
Bh
Bw
A
E
Bh
BwP Saturation Ratio (PSR)
• Ex-P/ [ExFe + ExAl] (Ex = Extractable)
• Change point ~ 0.10• Confidence intervals: 0.05
– 0.15• Threshold PSR: 0.15
Nair, V.D., K.M. Portier, D.A. Graetz, andM.L. Walker. 2004. J. Environ. Qual. 33:107-113.
FDEP
0
5
10
15
20
25
0 .125 .025 .375 0.5 .625 .75 .875
Wat
er S
olub
le P
(mg
kg-1
)
Surface HorizonSubsurface Horizon
PSR M1
Change point = 0.1
0
5
10
15
20
25
0 0.125 0.25 0.375 0.5PSROX
Wat
er S
olub
le P
(mg
kg-1
)
Surface HorizonSubsurface Horizon
Change point = 0.1
99
A
E
Bh
Bw
A
E
Bh
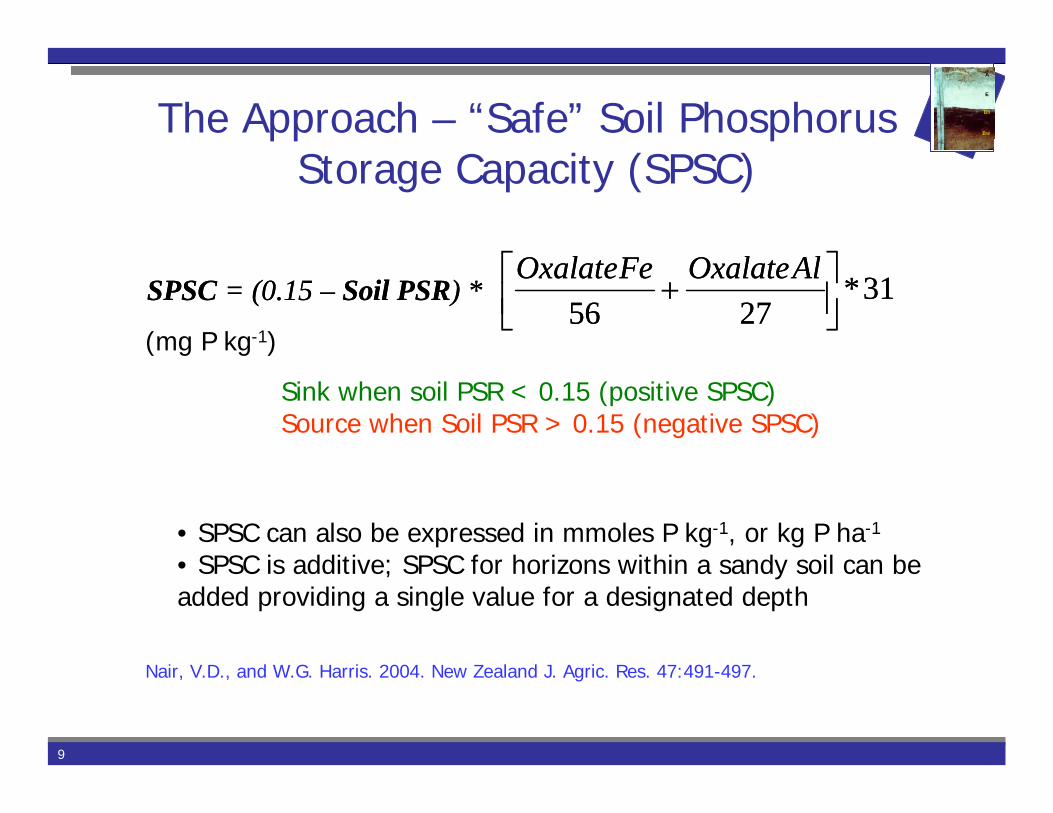
BwThe Approach – “Safe” Soil Phosphorus Storage Capacity (SPSC)
31*2756 ⎥⎦
⎤⎢⎣⎡ +
AlOxalateFeOxalateSPSC = (0.15 – Soil PSR) * 31*
2756 ⎥⎦⎤
⎢⎣⎡ +
AlOxalateFeOxalateSPSC = (0.15 – Soil PSR) *
Nair, V.D., and W.G. Harris. 2004. New Zealand J. Agric. Res. 47:491-497.
• SPSC can also be expressed in mmoles P kg-1, or kg P ha-1
• SPSC is additive; SPSC for horizons within a sandy soil can be added providing a single value for a designated depth
(mg P kg-1)
Sink when soil PSR < 0.15 (positive SPSC)Source when Soil PSR > 0.15 (negative SPSC)

1010
A
E
Bh
Bw
A
E
Bh
Bw
SPSC Calculations using Soil Test Parameters
Why do we need conversion factors for SPSC calculations using STP?
(mg P kg-1)
(mg P kg-1)
31*2756 ⎥⎦
⎤⎢⎣⎡ + AlOxalateFeOxalate
SPSC = (0.15 – Soil PSR) * 31*2756 ⎥⎦
⎤⎢⎣⎡ + AlOxalateFeOxalate
SPSC = (0.15 – Soil PSR) *
56⎢⎣⎡
+Mehlich 1
SPSC = (0.15 – Soil PSR) * 56⎢⎣
⎡ Fe SPSC = (0.15 – Soil PSR) *
27AlMehlich 1 31*⎥⎦⎤⎥⎦⎤
* ?

1111
A
E
Bh
Bw
A
E
Bh
BwConversion Factors for A & E Horizons
y = 2.24x - 2.92R² = 0.84n = 760
-1000
-800
-600
-400
-200
0
200
400
-300 -200 -100 0 100 200
SPSC-M1 (mg kg-1)
SPSC
-Ox
(mg
kg-1
)
Okeechobee A & E horizons

1212
A
E
Bh
Bw
A
E
Bh
BwSPSC and Water Soluble P (WSP)
• Soil is a P sink when SPSC is positive and a source when SPSC is negative
• Similar observation under field conditions
• 95% of samples with positive SPSC (soil is a P sink) indicate less than 0.1 mg L-1 P in solution
Chrysostome, M, V.D. Nair, W.G. Harris, and R.D. Rhue. 2007. Soil Sci. Soc. Am. J. 71:1564–1569.
Column Study Set-up
y = -65.89x - 25.41R2= 0.88
-600
-500
-400
-300
-200
-100
0
100
200
300
0 1 2 3 4 5 6
Average leachate P concentration (mg L -1)
Initi
al S
PSC
(mg
P kg
-1)
Lab
P source
P sink
y = -11.6x –0.9R2 = 0.84n = 147
-600
-500
-400
-300
-200
-100
0
100
200
300
400
0 10 20 30 40 50 60
WSP (mg kg-1)
SPSC
(mg
kg-1
)
n = 604
y = -11.6x –0.9R2 = 0.84n = 147
600
500
400
300
200
100
0
100
200
300
400
0 10 20 30 40 50 60
WSP (mg kg-
y = -11.6x –0.9R2 = 0.84n = 147
-
-
-
-
-
- 0 10 20 30 40 50 60
-1 )
SPSC
(mg
kg-1
) n = 604
Field
P source
P sink

1313
A
E
Bh
Bw
A
E
Bh
BwApplication: Soils of LOB
A
E
Bh
Bw
Spodosol Profile
SFWMD; FDACS
SPSC (kg haSPSC (kg ha 1- )0 1000 2000 3000 4000 5000 6000
Dep
th (c
m)
AE
Bh
Bw2
Bw1
B ’h
a
0
20
40
60
80
100
-400 -200 0 200 400 600 800 1000
E1
BhBw
E2
0
20
40
60
80
b
0 1000 2000 3000 4000 5000 60000 1000 2000 3000 4000 5000 6000A
EBhBh
Bw2
Bw1Bw1
B ’hB ’h
a
AAE
E1
BhBw
E2
0
20
40
60
80
b
AAE
0
20
40
60
80
100
-400 -200 0 200 400 600 800 1000
Dep
th (c
m) E1
BhBw
E2
0
20
40
60
80
b
AAAE
0
100
-400 -200 0 200 400 600 800 1000
E1
Bh
Bw
E2
0
20
40
60
80
b
Minimally impacted
Impacted
0
20
40
60
80
100
P sink
P source

1414
A
E
Bh
Bw
A
E
Bh
BwApplications
0102030405060708090
100
0 200 400 600 800 1000 1200 1400
Dep
th, c
m0
102030405060708090
100
- 200 0 200 400 600 800 1000 1200 1400D
epth
, cm
0102030405060708090
100
- 200
Soil P Storage Capacity, kg P ha-1
Dep
th, c
m0
102030405060708090
100
Dep
th, c
m
Tree-based vs tree-less pasture
Nair, V.D. P.K.R. Nair, R.S. Kalmbacher, and I.V. Ezenwa. 2007. Ecol. Eng. 29:192-199. Michel, G.-A., V.D. Nair, P.K.R. Nair. 2007. Plant Soil. 297:267-276.
USDA/IFAFS, through the Center for Subtropical Agroforestry
SPSC=1495 kg P ha-1
SPSC=370 kg P ha-1
SPSC increased by ~ 60 kg P ha-1 yr-1 in presence of trees

1515
A
E
Bh
Bw
A
E
Bh
BwUse of SPSC for Watertable Monitoring
FDACS
E1
Bh
Bw
E
2
0
20
40
60
80
b
A
AE
0
20
40
60
80
100
-400 -200 0 200 400 600 800 1000
Dep
th (c
m)
E1
Bh
Bw
E
2
0
20
40
60
80
b
AA
AE
0-400 -200 0 200 400 600 800 1000
E1
Bh
Bw
E2
0
Water table
SPSC (kg haSPSC (kg ha 1- )
P sink
P source
1616
A
E
Bh
Bw
A
E
Bh
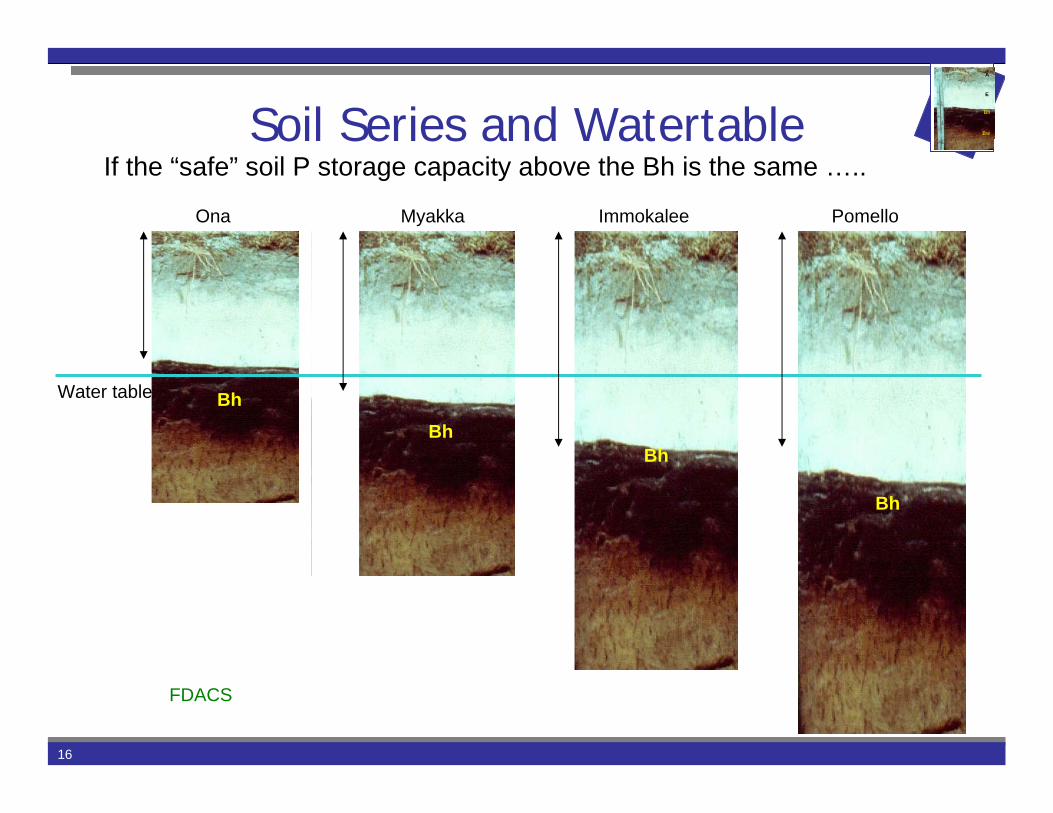
BwSoil Series and Watertable
Water table BhBh
Bh
Bh
Ona Myakka Immokalee Pomello
If the “safe” soil P storage capacity above the Bh is the same …..
FDACS

1717
A
E
Bh
Bw
A
E
Bh
BwBh Horizons and the “Change point”
y = 104.71x - 1.16R2 = 0.64
n = 37
y = 65.541x - 0.9138R 2 = 0.2956, n = 78
0
20
40
60
80
100
120
140
0.0 0.1 0.2 0.3 0.4 0.5 0.6 0.7 0.8 0.9 1.0 1.1
PSR -Ox
WSP
(mg
kg-1
)
Change point = 0.10
0
20
40
60
80
100
120
140
0.0 0.1 0.2 0.3 0.4 0.5 0.6 0.7 0.8 0.9 1.0 1.1 1.2 1.3 1.4 1.5
PSR ‐M1
WSP
(mg kg
‐1)
Change point = 0.10
y = 26.2 + 0.08; R2 = 0.53
y = 79.8 + 1.47; R2 = 0.71
• Change point is 0.1using either oxalate orMehlich 1- P, Fe and Al• The value is the same as that for A & E horizons
FDACS

1818
A
E
Bh
Bw
A
E
Bh
BwOur progress …
• Protocol for SPSC calculation established (using oxalate P, Fe and Al) for A, E, and Bh horizons
• Need to establish protocol for SPSC calculation using easily determined parameters in soil test solutions (Mehlich 1 and Mehlich 3)
• Conversion factor for SPSC calculation That factor is ~2.25 for A and E horizons using Mehlich 1 parametersConversion factor for Bh horizons is on-going (using Mehlich 1)Need to obtain conversion factors for both A & E, and Bhhorizons using Mehlich 3

1919
A
E
Bh
Bw
A
E
Bh
BwThe End Product …..
• Protocol for determining SPSC will be available using Mehlich 1 and Mehlich 3 solutions obtainable in soil testing laboratories in Florida
• The SPSC concept, and alternate procedures for its calculation will be available as an EDIS publication, and also available in our soil testing lab
• Able to calculate SPSC to any desired soil depth (Note: SPSC is additive)
• Able to determine if a given soil volume (or mass) is an environmental risk (positive SPSC: P sink; negative SPSC: P source)

2020
A
E
Bh
Bw
A
E
Bh
BwUses of SPSC for Okeechobee Soils
• Predict P release from a soil within the LOB that can be used to project consequences of water-table manipulations for P control
• Evaluate amount of P that can be safely applied to a soil if manure application is based on N requirements of a crop instead of P requirements
• Calculate the amount of an iron or aluminum- based amendment to be added to a soil as a BMP
31*2756 ⎥⎦
⎤⎢⎣⎡ +
AlOxalateFeOxalateSPSC = (0.15 – Soil PSR) * 31*
2756 ⎥⎦⎤
⎢⎣⎡ +
AlOxalateFeOxalateSPSC = (0.15 – Soil PSR) *
(mg P kg-1)

2121
A
E
Bh
Bw
A
E
Bh
BwUses of SPSC cont.
• Predict reduction in SPSC with time if the P loading to a soil is known
• Identify suitable areas for location of animal-based agriculture by selecting soils with greater SPSC
• Verify suitability of potential locations for the construction of stormwater treatment areas.

2222
A
E
Bh
Bw
A
E
Bh
BwPlanned Activities
• Set up lab experiment to evaluate:P release rates from Bh horizons as a function of P loading as measured by i) Mehlich extractable P and ii) SPSC determine if a relationship exists between SPSC and the amount of releasable P in Bh materials.
• Iron-oxide strips as a measure of releasable Pphytoremediationwatertable management
(to control P loss in drainage water from upland soils).

2323
A
E
Bh
Bw
A
E
Bh
BwResearch Areas not Addressed so Far• Use SPSC as a quantitative
approach for concurrently determining crop P requirement while minimizing environmental risks associated with offsite P movement
• Calculate the amount of aluminum or iron based amendment to be added to a soil to maintain near “zero”SPSC to allow unnecessary additions of the material
• SPSC for organic and calcareous soils
y = -11.6x –0.9R2 = 0.84n = 147
-600
-500
-400
-300
-200
-100
0
100
200
300
400
0 10 20 30 40 50 60
WSP (mg kg-1)
SPSC
(mg
kg-1
)
n = 604
y = -11.6x –0.9R2 = 0.84n = 147
600
500
400
300
200
100
0
100
200
300
400
0 10 20 30 40 50 60
WSP (mg kg-
y = -11.6x –0.9R2 = 0.84n = 147
-
-
-
-
-
- 0 10 20 30 40 50 60
-1 )
SPSC
(mg
kg-1
)
n = 604
5%0%
2%
61%
32%
24%
3%
2%
37%
34%Labile-P
Fe/Al-P
Organic-P
Ca/Mg-P
Residual P
Dairy manure Beef manure
TP = ~6000mg/kgTP = ~8000mg/kg
Nair, V.D., D.A. Graetz, and D.O. Dooley. 2003. J. Food Agric. Environ. 1: 217-223
• SPSC and P source effects
P sink
P source

2424
A
E
Bh
Bw
A
E
Bh
Bw
Thank you!