Presentation to the Portfolio Committee on Public Enterprises: Progress on Job Creation and Skills...
35
Presentation to the Portfolio Committee on Public Enterprises: Progress on Job Creation and Skills Development Second Term: 28 June 2011 1
-
Upload
emma-marsh -
Category
Documents
-
view
216 -
download
4
Transcript of Presentation to the Portfolio Committee on Public Enterprises: Progress on Job Creation and Skills...
Presentation to the Portfolio Committee on Public Enterprises:
Progress on Job Creation and Skills Development Second Term: 28 June 2011
1
PROGRESS ON JOB CREATION AND SKILLS DEVELOPMENT
The purpose of this presentation is to report on the Transnet progress
against targets as per the initiatives as indicated below:
•Job Creation;
•Skills Delivery;
•Skills Development; and
•Employment Equity
2

THE SKILLS STRATEGY
1. Build and maintain feeder pipelines to grow internal and national skills base;
2. Implement high quality, business aligned training for priority and critical skills;
3. Fill vacancies quickly and with the right people;
4. Align skills planning to attraction and retention of key skills
5. Strengthen supervisory, management and leadership capability;
6. Develop and maintain succession and talent pools aligned to transformational objectives; and
7. Build strong and competent HR business partners.
A Competent Workforce
•Increase on the delivery of artisans;•Pursue funding opportunities to upgrade training facilities;•Sponsor HET initiatives to ensure continuous development of Engineers;•Allocate full-time bursaries to Engineering Students •Support Engineering Technicians by providing vocational work opportunities;•Afford opportunities for gaining workplace experience through various Graduate-in-Training programs; •International partnerships to develop and deliver on sector-specific skills; and •Alignment with quality assurance bodies for vocational disciplines at national level.
•Increase on the delivery of artisans;•Pursue funding opportunities to upgrade training facilities;•Sponsor HET initiatives to ensure continuous development of Engineers;•Allocate full-time bursaries to Engineering Students •Support Engineering Technicians by providing vocational work opportunities;•Afford opportunities for gaining workplace experience through various Graduate-in-Training programs; •International partnerships to develop and deliver on sector-specific skills; and •Alignment with quality assurance bodies for vocational disciplines at national level.
• Ensure succession plans for key positions in management categories;
• Ensure business continuity through retention strategy; and • Conduct talent forums to create talent pools.
• Ensure succession plans for key positions in management categories;
• Ensure business continuity through retention strategy; and • Conduct talent forums to create talent pools.
• Deliver on customised leadership development programs from executive leaders to emergent leaders; and
• Build capacity on FLM/Coordination levels through the introduction of appropriate development programs.
• Deliver on customised leadership development programs from executive leaders to emergent leaders; and
• Build capacity on FLM/Coordination levels through the introduction of appropriate development programs.
Capacity Building
Talent Management
Leadership Development
through
3

JOB CREATION
4
JOB CREATION INITIATIVES: DIRECT JOBS
Direct job creation initiatives are focused on:
•Creation of new positions as per OD requirements;
•Establishment of operator pools to assist in the terminal
operations;
•Filling of vacancies through a robust recruitment plan per
Operating Division;
•Establishment of skills pools to address co-ordination and
supervisory skills;
•Appointment of critical skills; and
•Appointments through trainee programs.
5
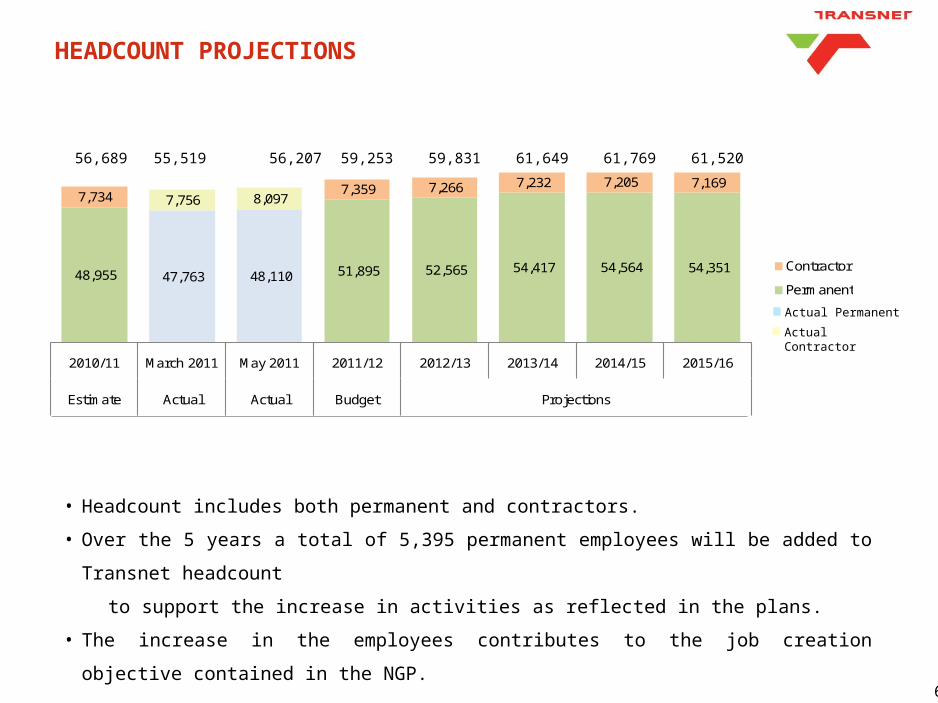
48,955 47,763 48,110 51,895 52,565 54,417 54,564 54,351
7,734 7,756 8,097 7,359 7,266 7,232 7,205 7,169
2010/11 March 2011 May 2011 2011/12 2012/13 2013/14 2014/15 2015/16
Estimate Actual Actual Budget Projections
Contractor 8 619
Permanent 46 593
56,689 55,519 56,207
59,253
59,831
61,649
61,769
61,520
• Headcount includes both permanent and contractors.
• Over the 5 years a total of 5,395 permanent employees will be added to Transnet
headcount
to support the increase in activities as reflected in the plans.
• The increase in the employees contributes to the job creation objective contained in
the NGP.
Actual Permanent
Actual Contractor
HEADCOUNT PROJECTIONS
6

NEW APPOINTMENTS: APRIL – MAY 2011
EMPLOYEE GROUP TOTAL
Management 23
Engineering 31
Artisan 91
Train Driver / TCO 19
Trainee 301
Other 332
Total 797
• Trainees - 37.8% of total new employees
predominantly in TFR and TRE
• Artisans - 11.4% of total new employees
• TRE recruited 56 Trainees from the SANDF
• The objective is to employ + 200
• Although 797 were appointed, the real
growth in permanent employees is
adversely impacted by employee
turnover
The table below depicts a summary of the appointments per Operating Division for the past two months. This resulted in an increase of total workforce to 56 208 in May 2011.
The majority of the appointments were from the Trainee and Artisan categories:
In order to support Transnet and NGP growth for 2011/12, Transnet plans to increase
permanent jobs from actual March 2011 47,763 to 51,894 projection for 2011/12.7
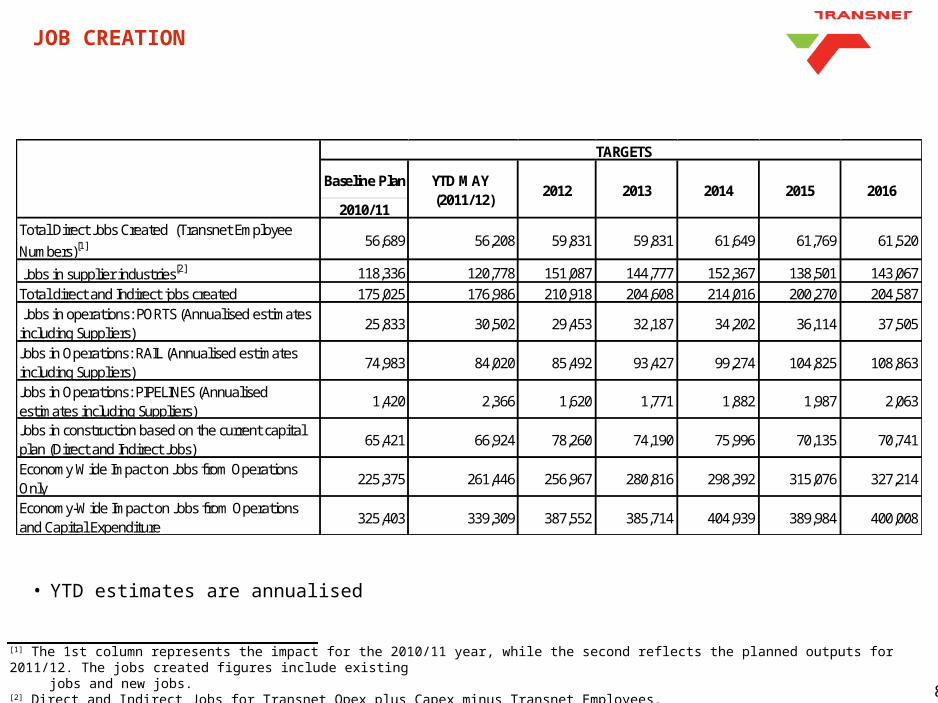
[1] The 1st column represents the impact for the 2010/11 year, while the second reflects the planned outputs for 2011/12. The jobs created figures include existing jobs and new jobs.[2] Direct and Indirect Jobs for Transnet Opex plus Capex minus Transnet Employees.
JOB CREATION
Baseline Plan
2010/11Total Direct Jobs Created (Transnet Employee Numbers)[1] 56,689 56,208 59,831 59,831 61,649 61,769 61,520
Jobs in supplier industries[2] 118,336 120,778 151,087 144,777 152,367 138,501 143,067 Total direct and Indirect jobs created 175,025 176,986 210,918 204,608 214,016 200,270 204,587 Jobs in operations: PORTS (Annualised estimates including Suppliers)
25,833 30,502 29,453 32,187 34,202 36,114 37,505
Jobs in Operations: RAIL (Annualised estimates including Suppliers)
74,983 84,020 85,492 93,427 99,274 104,825 108,863
Jobs in construction based on the current capital plan (Direct and Indirect Jobs)
65,421 66,924 78,260 74,190 75,996 70,135 70,741
Economy Wide Impact on Jobs from Operations Only
225,375 261,446 256,967 280,816 298,392 315,076 327,214
Economy-Wide Impact on Jobs from Operations and Capital Expenditure
325,403 339,309 387,552 385,714 404,939 389,984 400,008
2,063 2,366 Jobs in Operations: PIPELINES (Annualised estimates including Suppliers)
1,420 1,620 1,771 1,882 1,987
TARGETS
YTD MAY (2011/12)
2012 2013 2014 2015 2016
• YTD estimates are annualised
8

DELIVERY OF SKILLS
9

Technical and functional skills training accounts for 76% of all training undertaken by Transnet
75.9%
5.6%0.9%2.2%1.5%
1.2%
1.5%
1.9%
9.3%
Technical and functional
Health and safety
Leadership and management
Supervisory
Administrative
Customer service andcommunication
IT
ABET
Other
10

SKILLS DELIVERY: TRAINING CENTRE THROUGHPUT
• Current functional training and planned intakes of the various schools are as follows:
• School of Port Terminals currently have no dedicated training facilities, with the majority of training
being delivered in the workplace, but anticipate increasing delivery by 48% over the next 5 years.
* School of Rail Engineering excludes Apprentice training that will maintain an average of 2,600 learners
in the system, and will accelerate outputs by the year 2014 when the first group of additional 1,000
learners complete their qualification.
School Learner types 2011 Baseline
2012 2013 2014 2015 2016
Port Terminals
Artisans, Lifting equipment, Planners, Cargo Co-ordinators
3,628
3,737
3,849
3,964
4,083
4,205
Ports Marine, commercial, support services
2,275
2,343
2,413
2,485
2,560
2,637
Rail Range of Train Movement, operations and professional support staff
5,849
6,024
6,205
6,391
6,583
6,780
Rail Engineering
Artisans and Technical 6,500*
6,695
6,896
7,103
7,316
7,535
TCP Perway, Safety, Track Master 2,014
2,074
2,136
2,200
2,266
2,334
11

DELIVERY OF SKILLS IN TRANSNET
Transnet currently has six training schools delivering technical and operational training as follows:
The current average utilisation of the training schools is 66%
School of Rail
TFR
• 8 Campuses Nationally spread
• Rail operations training e.g:
• Train Drivers
• Train Control
• Yard operations
School of Port Terminals
TPT
• 1 Campus in Durban
• Port operations training e.g:
• Operators of Lifting Equipment
• Cargo Coordination
• Drivers
School of Ports
TNPA
• 1 Campus in Durban
• Port authority training e.g:
• Marine Pilot• Tug-master• Vessel Traffic
services• Marine
Global Best Practice
School of Pipelines
TPL
• 1 Campus in Durban
• Pipeline operations training e.g:
• Pipeline Controllers, Coordinators and Planners
School of Engineering
TRE
• 19 Campuses Nationally Spread
• Custodian for Artisan training for Transnet
• Technical rail engineering training e.g:
• Artisans• Trade Hands• Process
Workers
School of Leadership
Development
• Virtual school operating from Transnet Corporate Centre
• Co-ordination and governance of first line, supervisory and leadership development
12

SKILLS DELIVERY – REQUIREMENT TO UPGRADE TRAINING FACILITIES
• Training facilities need to be upgraded to improve the quality of training delivery and
increase the intake of learners. The total requirement amounts to R 424m and is distributed
per Operating Division as follows:
• Port Terminals – R 50m;
• Ports – R 38m;
• Rail – R 197m; and
• Rail Engineering – R 139m.
• The funding will be utilised as follows:
• Creation of a pool of operators that is continuously available to terminals to increase
productivity, and in turn increase of port traffic in South African and the resultant
increase in jobs;
• An increase of 1,000 apprentices in 2012 and maintaining an average capacity of 2,600
learners in the system; and
• Accelerate the delivery of training of staff in train movement, yards, train control,
operational and professional support.
13
SKILLS DEVELOPMENT
14

SKILLS DEVELOPMENT TARGETS
Actual March 2011
ActualYTD May 2011
Target11/12
Target2012
Target2013
Target2014
Target2015
All Apprentices in system 1029 1869 1412 1412 1412 1412 1412
Apprentices new intake 840 500 500 500 500 500
All Technicians learners 356 289
Technicians learners new intake 152 180 180 180 180 180
All Engineer bursars 375 398
Engineer bursars new intake 60 60 60 60 60 60
Number of Sector Specific Critical* New entries
1,305 768 1,500 1,500 1,500 1,500 1,500
Percentage of total workforce undergoing all training
36% 28% 36% 39% 39% 39% 39%
Percentage of training spent 3.0% 2.2% 3.5% 3.5% 3.5% 3.5% 3.5%
Total Direct Jobs Created[1]
(Transnet Employee Numbers)55,519 56,208 59,254 59,831 61,649 61,769 61,520
* Sector Specific refer to core skills in Rail, Marine and Port•2011 baseline targets have been set as stretch targets, hence no difference in 2011 figures for stretch targets•Total training spent is based on total labour costs •Funding to upgrade facilities/resources could increase Artisan intake to 1000-2000 annually•Average spent per employee is R7,745 annually
15
PARTNERSHIP WITH OTHER STATE OWNED ENTERPRISES
• Transnet participates in the DPE Skills Development Forum. This forum
engages on skills development matters related to all SOEs such as:
– coordination and participation of SOEs in the Technical Skills
Business Partnership;
– participation in the Human Resource Development Technical Working
Group;
– coordination of sourcing funding from the National Skills Fund;
– sharing of training facilities in future; and
– sharing of relevant information.
• Transnet has conducted benchmarking exercises with SASOL, ESKOM
and TELKOM in relation to commonalities regarding bursary schemes,
study aids, tuition, allowances, student ratios and good practice.
16
EMPLOYMENT EQUITY
17

EMPLOYMENT EQUITY – UPDATE
Black Employees
Female Employees
Employees with Disabilities
Target 201375%
Target 201325%
Target 20131.3%
The Transnet Employment Equity progress against targets are depicted below:
18

EMPLOYMENT EQUITY – PEOPLE WITH DISABILITIES
The Transnet target of 1.3% was set to ensure that a significant shift is made from the current actual achievement of 0,8%.
To enable this shift, the following interventions are in process: • Employee and Line Management engagement strategies to develop
understanding of the meaning of Disability and create an environment that supports People with Disabilities;
• Employees are encouraged to disclose their disabilities and where necessary provide reasonable accommodation to employees who require it;
• Identifying positions within the organization that can be allocated to employees with disabilities; and
• Accessibility audits to make the physical environment more accessible and accommodate disabilities.
19

OVERVIEW: WORKFORCE PROFILE PER AGE AND RACE
0200400600800
10001200140016001800
17 19 21 23 25 27 29 31 33 35 37 39 41 43 45 47 49 51 53 55 57 59 61 63 65
White
Indian
Coloured
African
Transnet Workforce Profile by age and race category
• Average age of Transnet employee is 43 years• Approximately 6500 employees are above 55 years of age. The majority
of these employees are semi skilled and general workers (approximately 75%)
• Focused employment equity initiatives has resulted in a change in the workforce profile with young employees and new recruits being more African 19
MITIGATING RISKS GOING FORWARD
21
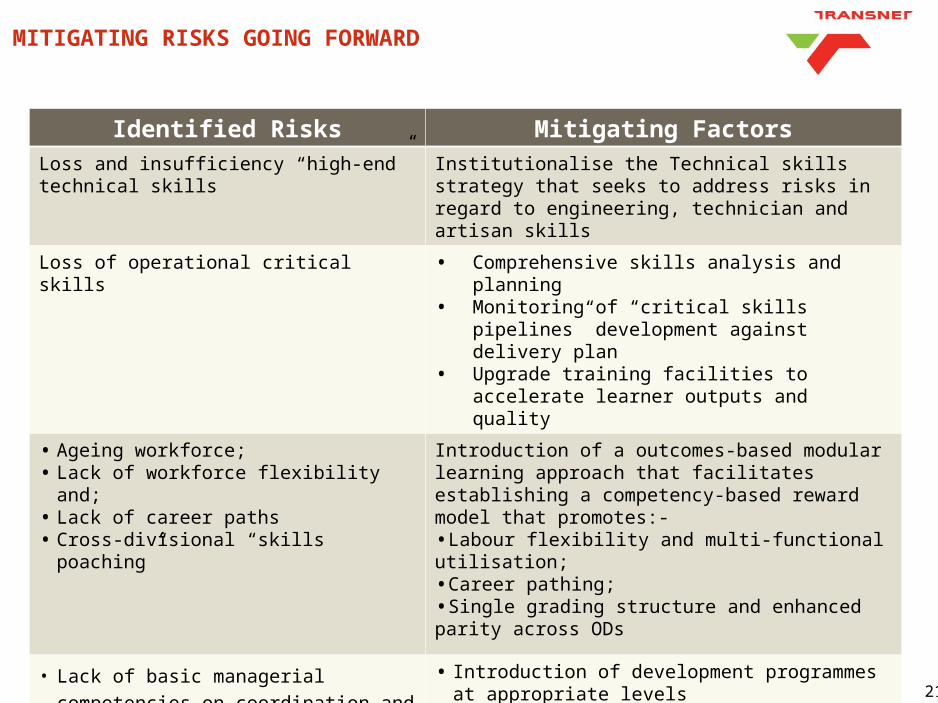
Identified Risks Mitigating FactorsLoss and insufficiency “high-end” technical skills
Institutionalise the Technical skills strategy that seeks to address risks in regard to engineering, technician and artisan skills
Loss of operational critical skills • Comprehensive skills analysis and planning• Monitoring of “critical skills pipelines”
development against delivery plan• Upgrade training facilities to accelerate
learner outputs and quality
• Ageing workforce;• Lack of workforce flexibility and;• Lack of career paths• Cross-divisional “skills poaching”
Introduction of a outcomes-based modular learning approach that facilitates establishing a competency-based reward model that promotes:-•Labour flexibility and multi-functional utilisation;•Career pathing;•Single grading structure and enhanced parity across ODs
• Lack of basic managerial competencies on coordination and first line management levels
• Introduction of development programmes at appropriate levels

THANK YOU
22

23
BACK – UP SLIDES

CURRENT WORKFORCE PROFILE PER GRADE LEVEL
• The low number of co-ordination and specialist skills (G and H levels) and high number of lower end skills (J, K and L) result in poor spans of control and poor discipline
• High demand on limited specialist skills contribute to high overtime spend and poor safety
L
K
J
I
H
G
F
E
D
C
B
A
Transnet workforce profile by grade and level
Grade Level
No of Employe
es
A 13
B 99
C 117
D 408
E 1,107
F 2,971
G 3,649
H 3,141
I 11,371
J 12,616
K 6,357
L 6,201
23
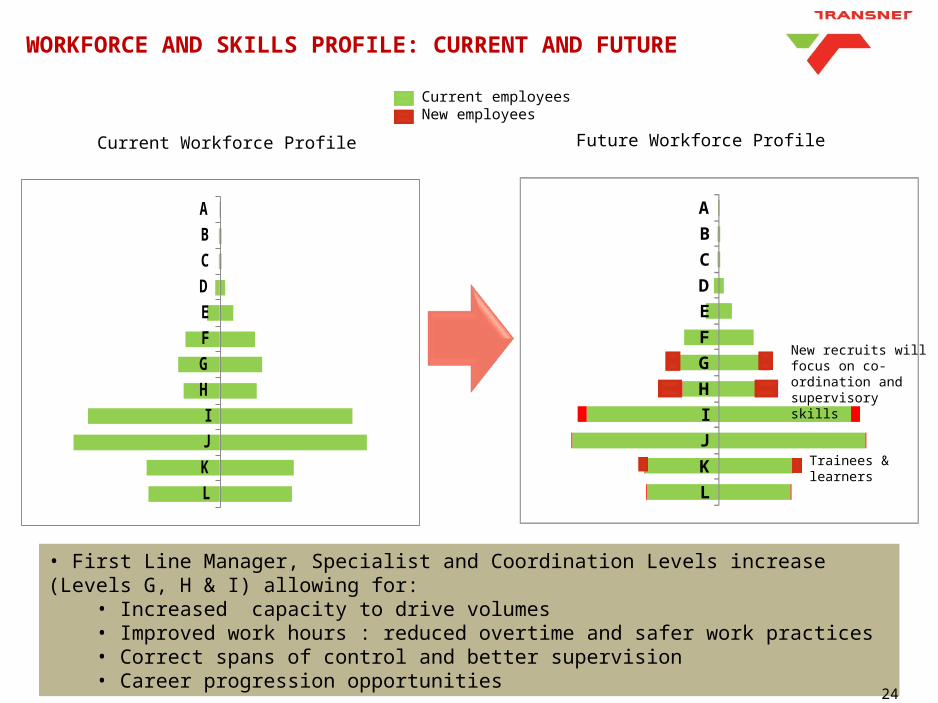
• First Line Manager, Specialist and Coordination Levels increase (Levels G, H & I) allowing for:
• Increased capacity to drive volumes• Improved work hours : reduced overtime and safer work practices• Correct spans of control and better supervision• Career progression opportunities
Future Workforce ProfileCurrent Workforce Profile
LKJI
HGFEDCBA
Current employeesNew employees
LKJI
HGFEDCBA
WORKFORCE AND SKILLS PROFILE: CURRENT AND FUTURE
New recruits will focus on co-ordination and supervisory skills
Trainees & learners
24

ENGINEERING BURSAR PIPELINES
Engineering Disciplines
1st Year 2nd Year 3rd Year 4th Year Total
Civil 13 26 44 44 127
Chemical 1 2 1 4
Electrical 18 21 23 21 83
Electronics 3 9 14 25 51
Industrial 3 4 12 11 30
Mechanical 14 18 14 6 52
Metallurgy 1 1 1 1 4
Mechatronics 0 0 2 3 5
Total 48 77 118 132 375
The table below depicts the current actual Engineering Bursar pipeline in Transnet.
* Refers to Academic Year
Academic success rate assumptions are:
• 86% of students progress to next academic level annually
• 10% of students redo academic year
• 4% drop out per annum
• Academic throughput of 70% over a 5 year period is in line with national benchmark
• New Intakes across academic years
* Refers to Academic Year
Academic success rate assumptions are:
• 86% of students progress to next academic level annually
• 10% of students redo academic year
• 4% drop out per annum
• Academic throughput of 70% over a 5 year period is in line with national benchmark
• New Intakes across academic years 25

ALLOCATION OF ENGINEERING PIPELINE PER OPERATING DIVISION
27
OD Civil %
Chemical %
Electrical %
Electronics/
Mechatronic %
Industrial %
Mechanical %
Metallurgy%
TFR 61 51 61 73 32 100
TRE 11 11 27 37
TNPA 19 25 5 3
TPT 1 6 11 20
TPL 75 3 4
TCP 19 24 17 4
• Allocation % dependent on business requirements per Organizational Division (OD) • Actual as on 31 March 2011

Partnerships with External Institutions
Field Progra
m
Type Provider Numbe
r
Custodian
Engineering Degrees
9 Fields
Full-time
Bursary
Universities with Engineering Faculties:
Cape Town, Johannesburg, Kwazulu Natal;
North West, Pretoria, Stellenbosch,
Witwatersrand
398 Group
People
Developmen
t
Engineering
Technician
Diplomas
9 Fields
Learnershi
p
Universities of Technology: Central, Durban,
Johannesburg, Mangosuthu, Nelson Mandela,
Cape Peninsula, Tswane, Vaal, Walter Sisulu
289 Group
People
Developmen
t
Artisan
Training
14
Artisan
Trades
Trade
Certificate
s
Midlands College Uitenhage, PE College (Port
Elizabeth), East London FET College,
Mangosuthu FET College (Durban), Coastal
FET College (Durban), Swindon FET College
(Durban), Catomanor FET (Durban), Pretoria
West, Tshwane South FET College, Centurion
FET College, Central Johannesburg College,
Ekurhuleni West College (Germiston), Good
Wood FET College, West Lake College, West
Coast FET College Saldanha, Motheo FET
College (Bloemfontein), Northern Cape FET
College (Kimberley)
331 Transnet
School of
Rail
Engineering
27

Partnerships with External Institutions
Field Program Type Provider Number Duration
Custodian
Leadership
Executive Leadership development
Contracts
Gordon Institute of Business StudiesINSEAD
6 12 weeks Group People Development
Innovative Leadership Competence for Rail Industry
No contract
International Railway Strategic Management Institute, Paris
Snr Mgt16
6 weeks in total on an annual
TFR
Navigator:Strategic OperationalEmergent
Contract Connemara Consulting Services 956 12 mnths until March 2012
Group People Development
28

Partnerships with External Institutions: Sector - Specific
Sector
Program Type Provider Number Custodian
Cargo Port Worker Development Worker Short Courses
License Fees
International Labour organization (ILO)
100 TPT
Mentorship & Operator Training
Contract Port management Container Services –Sri Lanka
37 TPT
Planner Training: Bulk & Break Bulk
Contract Hamburg Port Training Institution (HPTI)
30 TPT
Capital Projects
Contract Training
Contract Engineering Contract Strategies (ECS)
600 over period of 4 years
TCP
Trackmen & Track Master
Contract TSD Consulting Services (Pty) Ltd
45 TCP
Construction Industry Development Board (CIDB) Training
Contract Soderland and Schutter (Pty) Ltd
300 over period of 4 years
TCP
Driver Risk Assessment & Training: Transnet Vehicles
Contract Loribiz (Pty) Ltd t/a Enigma Training
350 TCP
29

Partnerships with External Institutions: Sector Specific
Sector Program Type Provider Number Custodian
Rail Engineering
Locomotive Systems Performance Maintenance
Contract University of Pretoria 60141 completed
TRE
ABET Contract Corporate College International
267 TRE
Soft Skills Training
Contract Bathopele Human Capital
1842 (operational levels)
TRE
Range of computer end user training &Education & Training Practitioner Development (ETDP)
Contract Mogale Solutions 1660 (operational levels)
TRE
30

Partnerships with External Institutions: Sector Specific
Sector Program Type Provider Number Custodian
Properties Property and facilities Mgt Training
Contract
Wits Enterprise (SAPOA- Property Education Training)
340 TProp
Procurement
Transnet Procurement Academy
Contract
Chartered Institute of Purchasing and Supply (CIPS)
70 Group Supply Chain Management
Marine Cadet Contracts
• Unicorn• SAMTRA• Marine Crew Services
33733
TNPA
31

Partnerships with External Institutions: Sector Specific
Sector Program Type Provider Number Custodian
Rail Operations
Logistics Contract University of Johannesburg 870 TFR
Railway Operations Qualifications Programme
Confinement of contract
Glasgow University & University of Johannesburg with Institute of Railway Operators
Initial 150 TFR
Business Simulation
Contract Business Today 30 TFR
32

Partnerships with External Institutions: Sponsorships
Field Program Type Provider Number Custodian
Engineering
Systems Engineering
Sponsorship University of Witwatersrand 1 Group People Management
Railway Engineering
Sponsorship University of Pretoria 1 TFR
Port and Coastal Engineering
Sponsorship Stellenbosch University 1 TNPA
Port management
Sponsorship of Seminars
Antwerp Flanders Port Training Centre (APEC)
76 TPT
33

Transnet has a nationwide training centre network
Richards Bay
Cape TownPort Elizabeth
Durban
Saldanha
East London
Johannesburg
Kimberley
Nelspruit
Polokwane
Bellville
Bayhead
EmpangeniPinetown
Mossel Bay
Pretoria
Koedoespoort
Uitenhage
Bloemfontein
Salt River
TRANSNET TRAINING CENTRES
Port Academy
TRE TC
TFR CentresMigrated to TRE
TFR TC ( Incl TFR Esselen Park)
Esselenpark TC
7 technical training centres
12 Traction, 7 wagons, Saldanha technical
4 Functional, 9 TPD, 6 EL&P, 1 OHTE, Saldanha functional
6 centres: Rail operations, OHTE & substations, Mechanical, Perways , Cross
Functional, Signals
TC 7 technical training centres
12 Traction, 7 wagons, Saldanha technical
4 Functional, 9 TPD, 6 EL&P, 1 OHTE, Saldanha functional
6 centres: Rail operations, OHTE & substations, Mechanical, Perways , Cross
34