Presentation to Investors - DSM · Presentation to Investors H1 2019 results. Page 1 Quote from the...
22
NUTRITION HEALTH SUSTAINABLE LIVING ROYAL DSM Presentation to Investors H1 2019 results
Transcript of Presentation to Investors - DSM · Presentation to Investors H1 2019 results. Page 1 Quote from the...

NUTRITION HEALTH SUSTAINABLE LIVINGROYAL DSM
Presentation to InvestorsH1 2019 results
Page 1
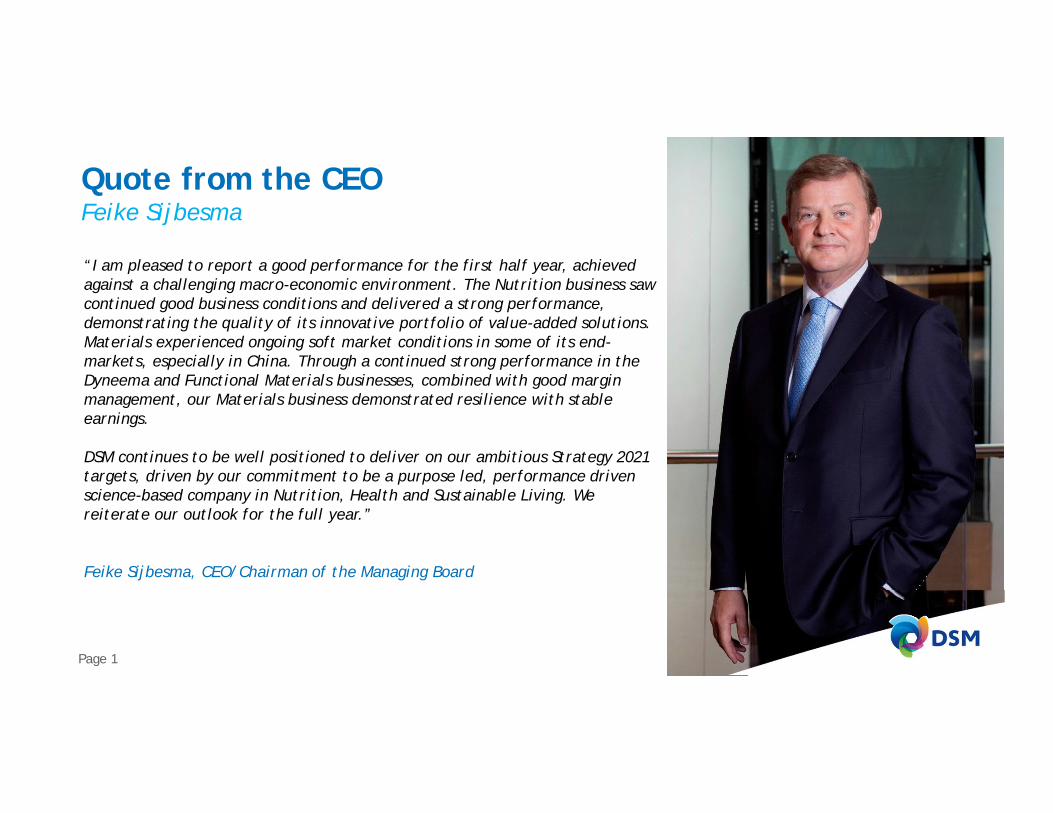
Quote from the CEOFeike Sijbesma
“I am pleased to report a good performance for the first half year, achievedagainst a challenging macro-economic environment. The Nutrition business sawcontinued good business conditions and delivered a strong performance,demonstrating the quality of its innovative portfolio of value-added solutions.Materials experienced ongoing soft market conditions in some of its end-markets, especially in China. Through a continued strong performance in theDyneema and Functional Materials businesses, combined with good marginmanagement, our Materials business demonstrated resilience with stableearnings.
DSM continues to be well positioned to deliver on our ambitious Strategy 2021targets, driven by our commitment to be a purpose led, performance drivenscience-based company in Nutrition, Health and Sustainable Living. Wereiterate our outlook for the full year.”
Feike Sijbesma, CEO/Chairman of the Managing Board

Page 2
H1 2019Highlights
§ DSM reports a good H1§ Results compared to the Underlying business in H1 2018:
ü Group sales +3%, Adjusted EBITDA up 12% (including 3% from IFRS 16)ü Nutrition: organic sales +4%, Adjusted EBITDA up 13% (including 2% from IFRS 16)ü Materials: organic sales -6%, Adjusted EBITDA flat (including 1% from IFRS 16)
§ Adjusted Net Operating Free Cash Flow €257m, up 14% versus H1 2018§ Total Net profit €401m, up versus H1 2018 of €633m when correcting for the temporary vitamin
effect of €275m EBITDA following an exceptional supply disruption in the industry§ Interim dividend of €0.77 per ordinary share§ Full year outlook maintained

Page 3
Q2 2019Highlights
§ DSM reports another good quarter§ Results compared to the Underlying business in Q2 2018:
ü Group sales +3%, Adjusted EBITDA up 10% (including 3% from IFRS 16)ü Nutrition: organic sales +4%, Adjusted EBITDA up 13% (including 3% from IFRS 16)ü Materials: organic sales -7%, Adjusted EBITDA flat (including 1% from IFRS 16)
Page 4
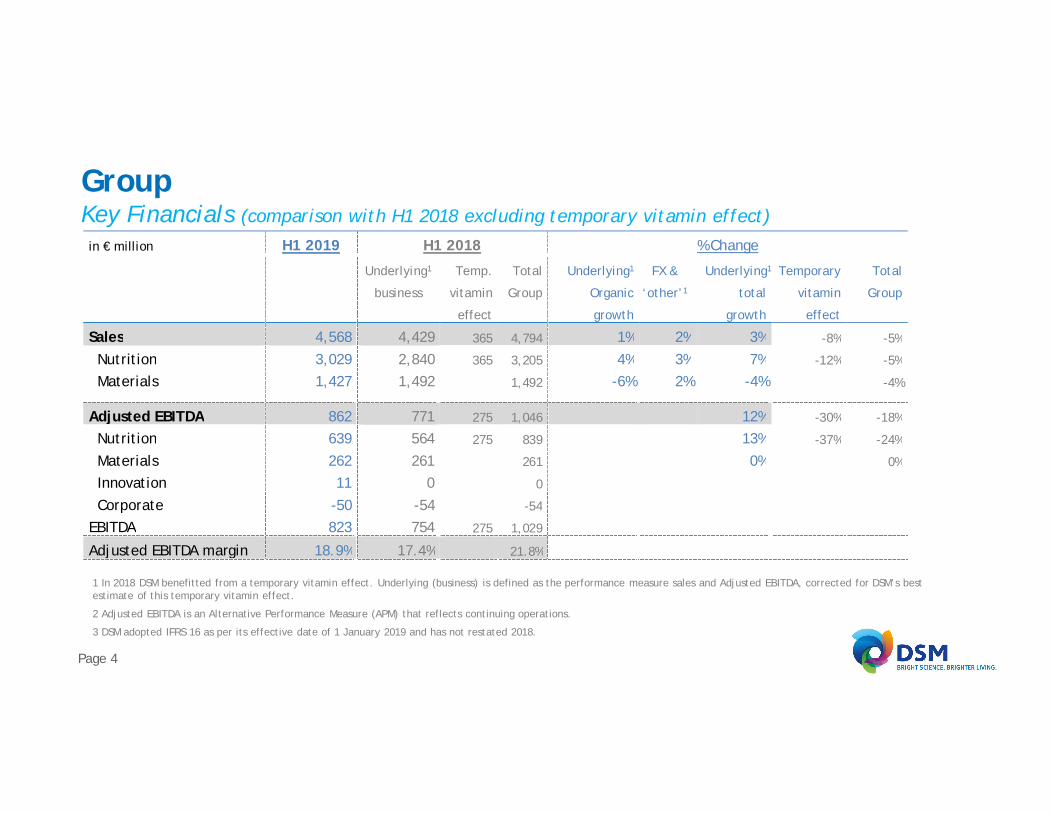
1 In 2018 DSM benefitted from a temporary vitamin effect. Underlying (business) is defined as the performance measure sales and Adjusted EBITDA, corrected for DSM’s bestestimate of this temporary vitamin effect.
2 Adjusted EBITDA is an Alternative Performance Measure (APM) that reflects continuing operations.
3 DSM adopted IFRS 16 as per its effective date of 1 January 2019 and has not restated 2018.
GroupKey Financials (comparison with H1 2018 excluding temporary vitamin effect)
in € million H1 2019 H1 2018 % Change
Underlying1
business
Temp.
vitamin
effect
Total
Group
Underlying1
Organic
growth
FX &
‘other’1
Underlying1
total
growth
Temporary
vitamin
effect
Total
Group
Sales 4,568 4,429 365 4,794 1% 2% 3% -8% -5%
Nutrition 3,029 2,840 365 3,205 4% 3% 7% -12% -5%
Materials 1,427 1,492 1,492 -6% 2% -4% -4%
Adjusted EBITDA 862 771 275 1,046 12% -30% -18%
Nutrition 639 564 275 839 13% -37% -24%
Materials 262 261 261 0% 0%
Innovation 11 0 0
Corporate -50 -54 -54
EBITDA 823 754 275 1,029
Adjusted EBITDA margin 18.9% 17.4% 21.8%

Page 5
GroupKey Financials (comparison with Q2 2018 excluding temporary vitamin effect)in € million Q2 2019 Q2 2018 % Change
Underlying1
business
Temp.
vitamin
effect
Total
Group
Underlying1
Organic
growth
FX &
‘other’1
Underlying1
total
growth
Temporary
vitamin
effect
Total
Group
Sales 2,276 2,214 145 2,359 1% 2% 3% -7% -4%
Nutrition 1,512 1,410 145 1,555 4% 3% 7% -10% -3%
Materials 710 754 754 -7% 1% -6% -6%
Adjusted EBITDA 438 398 110 508 10% -24% -14%
Nutrition 323 287 110 397 13% -32% -19%
Materials 135 135 135 0% 0%
Innovation 5 1 1
Corporate -25 -25 -25
EBITDA 407 393 110 503
Adjusted EBITDA margin 19.2% 18.0% 21.5%
1 In 2018 DSM benefitted from a temporary vitamin effect. Underlying (business) is defined as the performance measure sales and Adjusted EBITDA, corrected for DSM’s bestestimate of this temporary vitamin effect.
2 Adjusted EBITDA is an Alternative Performance Measure (APM) that reflects continuing operations.
3 DSM adopted IFRS 16 as per its effective date of 1 January 2019 and has not restated 2018.

Page 6
GroupKey Financials (comparison with H1 2018 including temporary vitamin effect)
1 Over Adjusted taxable result2 Including result attributed to non-controlling interest
H1 2019 H1 2018 % Change Q2 2019 Q2 2018 % Change
Sales 4,568 4,794 -5% 2,276 2,359 -4%
Adjusted EBITDA 862 1,046 -18% 438 508 -14%
Adjusted EBITDA margin 18.9% 21.8% 19.2% 21.5%
ROCE (%) 13.1% 20.8%
Effective tax rate1 18.0% 18.0%
Adjusted net profit2 415 643 -35% 215 306 -30%
Net profit - Total DSM2 401 633 -37% 205 302 -32%
Adjusted net EPS 2.32 3.64 -36% 1.20 1.73 -31%
Net EPS - Total DSM 2.24 3.58 1.14 1.70
Operating cash flow 507 503 1% 306 193 59%
Adjusted Net Operating Free Cash Flow 257 226 14% 197 72 174%cc
YTDin € million, including IFRS 16 impact,where applicable
Page 7
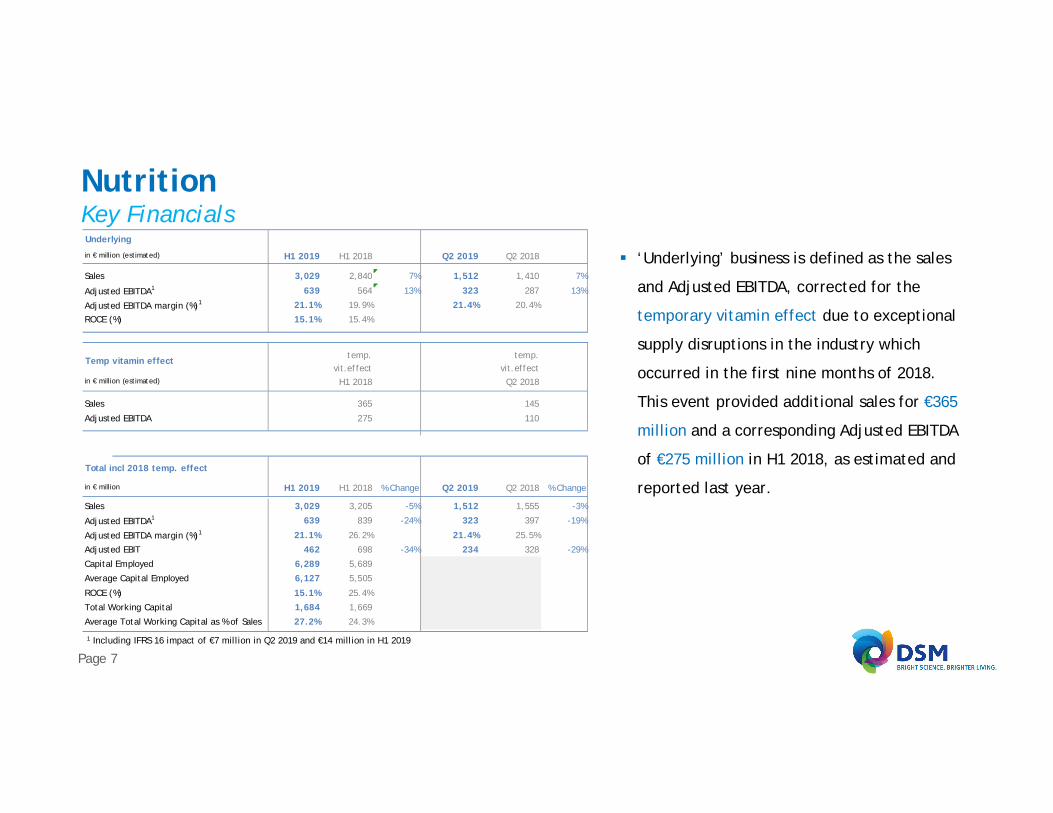
NutritionKey Financials
§ ‘Underlying’ business is defined as the sales
and Adjusted EBITDA, corrected for the
temporary vitamin effect due to exceptional
supply disruptions in the industry which
occurred in the first nine months of 2018.
This event provided additional sales for €365
million and a corresponding Adjusted EBITDA
of €275 million in H1 2018, as estimated and
reported last year.
1 Including IFRS 16 impact of €7 million in Q2 2019 and €14 million in H1 2019
Underlying
in € million (estimated) H1 2019 H1 2018 Q2 2019 Q2 2018
Sales 3,029 2,840 7% 1,512 1,410 7%
Adjusted EBITDA1 639 564 13% 323 287 13%
Adjusted EBITDA margin (%)1 21.1% 19.9% 21.4% 20.4%
ROCE (%) 15.1% 15.4%
Temp vitamin effecttemp.
vit.effecttemp.
vit.effectin € million (estimated) H1 2018 Q2 2018
Sales 365 145
Adjusted EBITDA 275 110
Total incl 2018 temp. effect
in € million H1 2019 H1 2018 % Change Q2 2019 Q2 2018 % Change
Sales 3,029 3,205 -5% 1,512 1,555 -3%
Adjusted EBITDA1 639 839 -24% 323 397 -19%
Adjusted EBITDA margin (%)1 21.1% 26.2% 21.4% 25.5%
Adjusted EBIT 462 698 -34% 234 328 -29%
Capital Employed 6,289 5,689
Average Capital Employed 6,127 5,505
ROCE (%) 15.1% 25.4%
Total Working Capital 1,684 1,669
Average Total Working Capital as % of Sales 27.2% 24.3%
Page 8
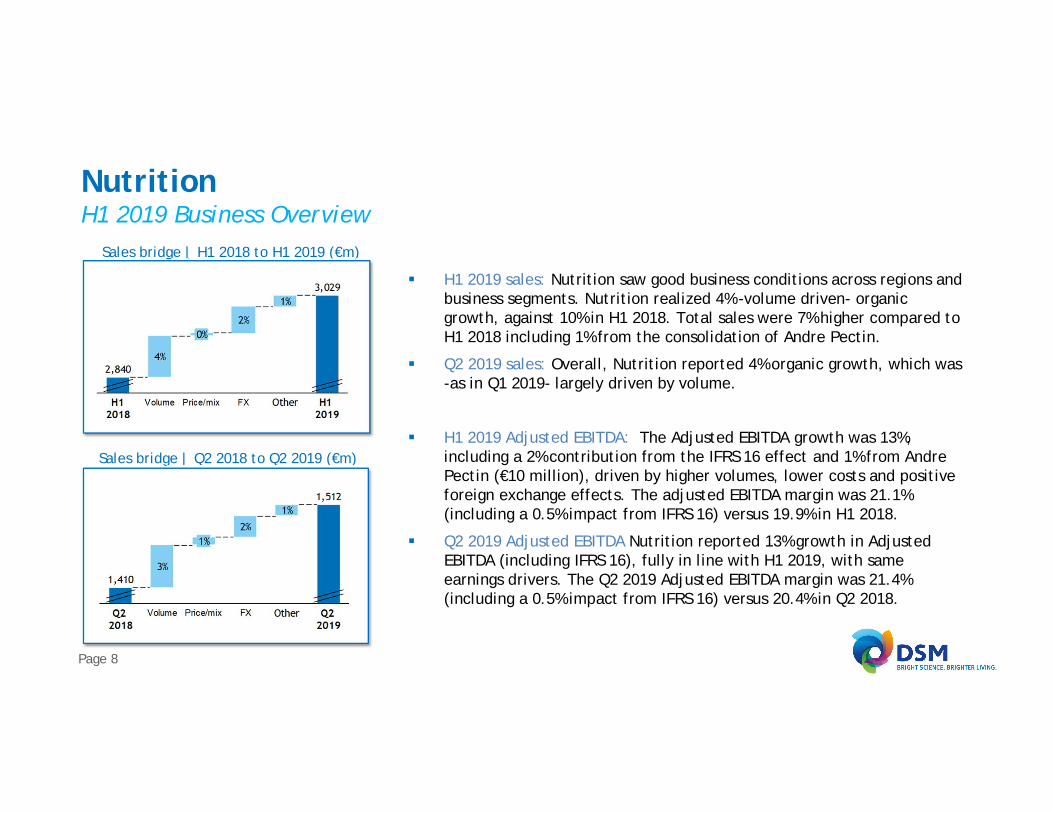
NutritionH1 2019 Business Overview
§ H1 2019 sales: Nutrition saw good business conditions across regions andbusiness segments. Nutrition realized 4% -volume driven- organicgrowth, against 10% in H1 2018. Total sales were 7% higher compared toH1 2018 including 1% from the consolidation of Andre Pectin.
§ Q2 2019 sales: Overall, Nutrition reported 4% organic growth, which was-as in Q1 2019- largely driven by volume.
§ H1 2019 Adjusted EBITDA: The Adjusted EBITDA growth was 13%,including a 2% contribution from the IFRS 16 effect and 1% from AndrePectin (€10 million), driven by higher volumes, lower costs and positiveforeign exchange effects. The adjusted EBITDA margin was 21.1%(including a 0.5% impact from IFRS 16) versus 19.9% in H1 2018.
§ Q2 2019 Adjusted EBITDA Nutrition reported 13% growth in AdjustedEBITDA (including IFRS 16), fully in line with H1 2019, with sameearnings drivers. The Q2 2019 Adjusted EBITDA margin was 21.4%(including a 0.5% impact from IFRS 16) versus 20.4% in Q2 2018.
Sales bridge | H1 2018 to H1 2019 (€m)
Sales bridge | Q2 2018 to Q2 2019 (€m)

Page 9
Animal Nutrition & HealthSales Overview
§ H1 2019 organic sales: The first six months saw continued good businessconditions across all regions and species, except for China and South EastAsia, where the African swine fever intensified. The impact for DSMcontinued to be largely compensated by higher poultry production in theregion and higher pork production in other regions, demonstrating thevalue of DSM’s global footprint and broad species coverage.
§ Animal Nutrition reported 4% organic growth, driven by volumes, against8% volume growth last year. Prices in the first six months were slightly up.Product mix effects caused the reported price swings over the first twoquarters.
§ Q2 2019 organic sales: The second quarter saw strong organic growth of10%. Volumes were up by 6%. Prices were up 4% reflecting a favorableproduct mix, supported by price increase actions to offset higher inputcosts. Additionally, prices continued to benefit from the effects of theenvironmental and safety enhancement policies implemented in China.
Sales bridge | H1 2018 to H1 2019 (€m)
Sales bridge | Q2 2018 to Q2 2019 (€m)
Page 10
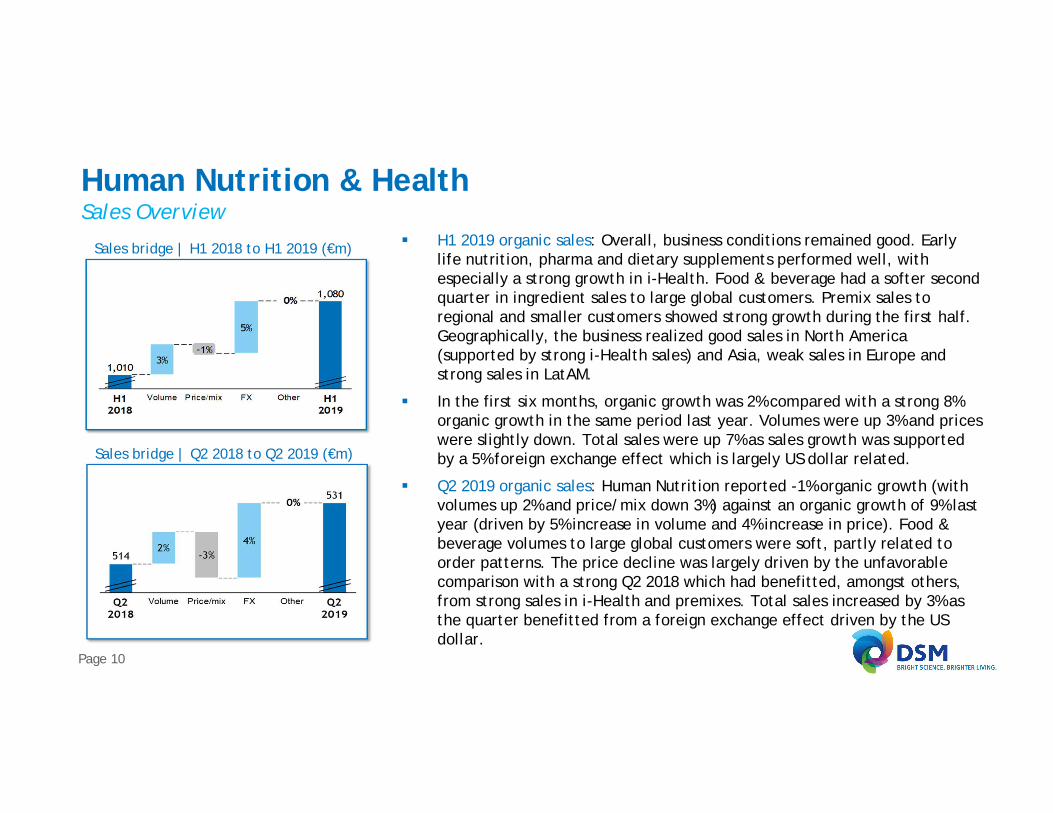
Human Nutrition & HealthSales Overview
§ H1 2019 organic sales: Overall, business conditions remained good. Earlylife nutrition, pharma and dietary supplements performed well, withespecially a strong growth in i-Health. Food & beverage had a softer secondquarter in ingredient sales to large global customers. Premix sales toregional and smaller customers showed strong growth during the first half.Geographically, the business realized good sales in North America(supported by strong i-Health sales) and Asia, weak sales in Europe andstrong sales in LatAM.
§ In the first six months, organic growth was 2% compared with a strong 8%organic growth in the same period last year. Volumes were up 3% and priceswere slightly down. Total sales were up 7% as sales growth was supportedby a 5% foreign exchange effect which is largely US dollar related.
§ Q2 2019 organic sales: Human Nutrition reported -1% organic growth (withvolumes up 2% and price/mix down 3%) against an organic growth of 9% lastyear (driven by 5% increase in volume and 4% increase in price). Food &beverage volumes to large global customers were soft, partly related toorder patterns. The price decline was largely driven by the unfavorablecomparison with a strong Q2 2018 which had benefitted, amongst others,from strong sales in i-Health and premixes. Total sales increased by 3% asthe quarter benefitted from a foreign exchange effect driven by the USdollar.
Sales bridge | H1 2018 to H1 2019 (€m)
Sales bridge | Q2 2018 to Q2 2019 (€m)

Page 11
Other NutritionFood Specialties – Personal Care – Andre Pectin
§ DSM’s other Nutrition activities which include Food Specialties, Personal Care, Aroma Ingredients and Hydrocolloids,continued to deliver a good performance in Q2 2019 with 8% organic sales growth in H1 2019. Personal Care showed avery strong growth in sun and skin care. Food Specialties enjoyed good growth in enzymes and cultures in the dairy andbaking segments. The established Avansya joint venture between DSM and Cargill for fermentative Stevia hassuccessfully produced testing materials in the first half of 2019.
§ Andre Pectin was re-consolidated as of Q1 2019 after DSM acquired an additional 46% of the shares in the company,bringing DSM’s total shareholding in Andre Pectin to 75%. Andre Pectin realized an EBITDA of €10 million in H1 2019
Page 12
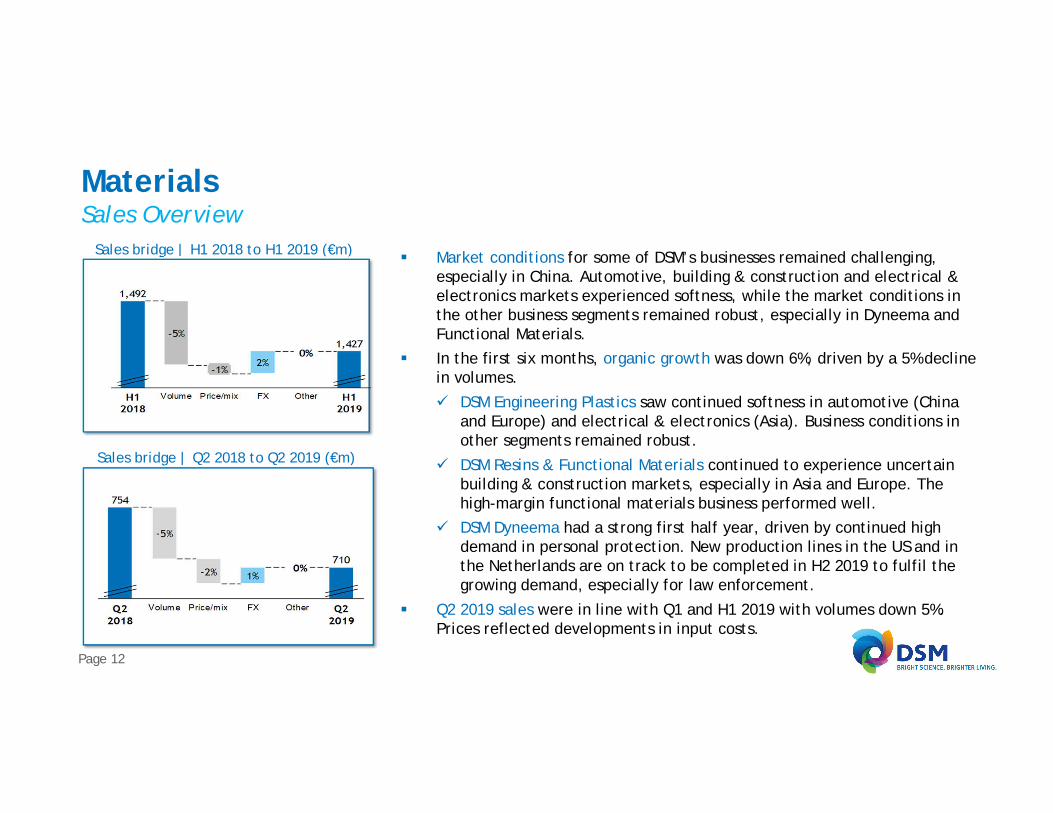
MaterialsSales Overview
§ Market conditions for some of DSM’s businesses remained challenging,especially in China. Automotive, building & construction and electrical &electronics markets experienced softness, while the market conditions inthe other business segments remained robust, especially in Dyneema andFunctional Materials.
§ In the first six months, organic growth was down 6%, driven by a 5% declinein volumes.ü DSM Engineering Plastics saw continued softness in automotive (China
and Europe) and electrical & electronics (Asia). Business conditions inother segments remained robust.
ü DSM Resins & Functional Materials continued to experience uncertainbuilding & construction markets, especially in Asia and Europe. Thehigh-margin functional materials business performed well.
ü DSM Dyneema had a strong first half year, driven by continued highdemand in personal protection. New production lines in the US and inthe Netherlands are on track to be completed in H2 2019 to fulfil thegrowing demand, especially for law enforcement.
§ Q2 2019 sales were in line with Q1 and H1 2019 with volumes down 5%.Prices reflected developments in input costs.
Sales bridge | H1 2018 to H1 2019 (€m)
Sales bridge | Q2 2018 to Q2 2019 (€m)
Page 13
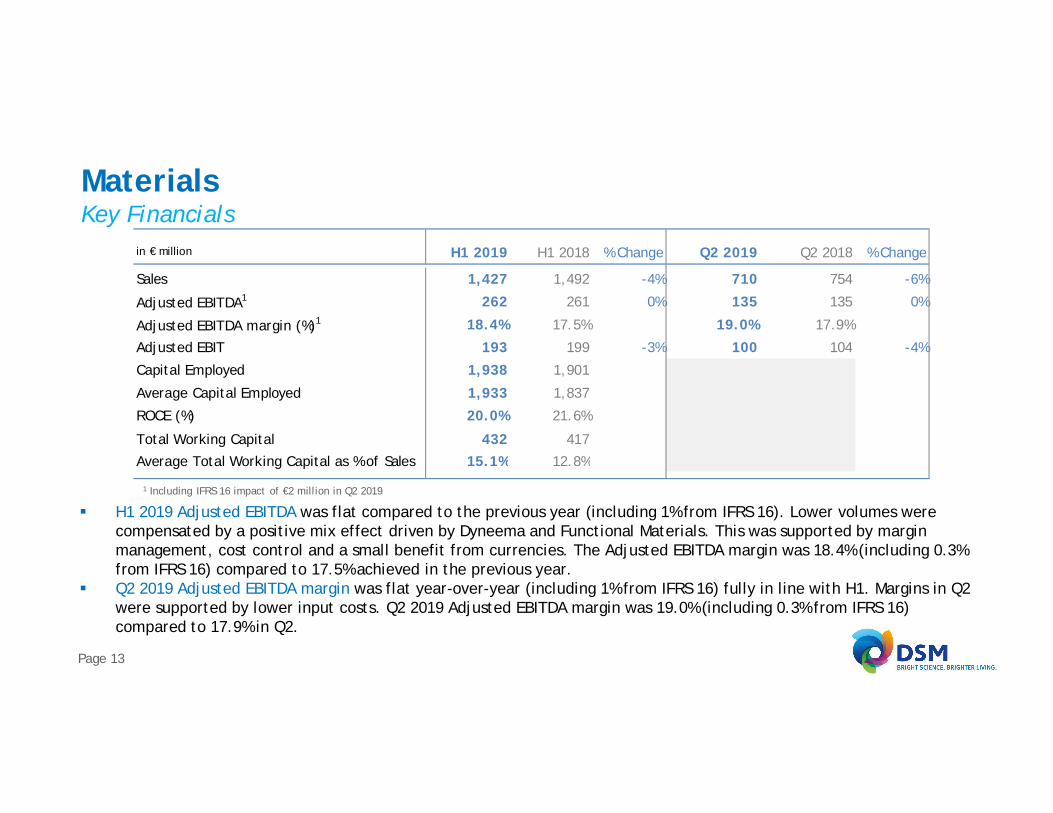
MaterialsKey Financials
§ H1 2019 Adjusted EBITDA was flat compared to the previous year (including 1% from IFRS 16). Lower volumes werecompensated by a positive mix effect driven by Dyneema and Functional Materials. This was supported by marginmanagement, cost control and a small benefit from currencies. The Adjusted EBITDA margin was 18.4% (including 0.3%from IFRS 16) compared to 17.5% achieved in the previous year.
§ Q2 2019 Adjusted EBITDA margin was flat year-over-year (including 1% from IFRS 16) fully in line with H1. Margins in Q2were supported by lower input costs. Q2 2019 Adjusted EBITDA margin was 19.0% (including 0.3% from IFRS 16)compared to 17.9% in Q2.
1 Including IFRS 16 impact of €2 million in Q2 2019
in € million H1 2019 H1 2018 % Change Q2 2019 Q2 2018 % Change
Sales 1,427 1,492 -4% 710 754 -6%
Adjusted EBITDA1 262 261 0% 135 135 0%
Adjusted EBITDA margin (%)1 18.4% 17.5% 19.0% 17.9%
Adjusted EBIT 193 199 -3% 100 104 -4%
Capital Employed 1,938 1,901
Average Capital Employed 1,933 1,837
ROCE (%) 20.0% 21.6%
Total Working Capital 432 417Average Total Working Capital as % of Sales 15.1% 12.8%

Page 14
Innovation CenterKey Financials
§ Biomedical delivered solid top and bottom-line growth. Bio-based Products & Services also contributed strongly to theresults partly based on new and recurring license income for yeast technologies used for bio-based fuels. Solar showedcontinued softness due to the subdued Chinese market. The Adjusted EBITDA increased to €11 million in H1 2019.
1 Including IFRS 16 impact of €0 million in Q2 2019 and €1 million in H1 2019
in € million H1 2019 H1 2018 % Change Q2 2019 Q2 2018 % Change
Sales 90 75 20% 43 39 10%
Adjusted EBITDA1 11 0 5 1
Adjusted EBIT -6 -12 -5 -6
Capital Employed 606 589

Page 15
Cash Flow and (operating) Working CapitalOverview
§ Adjusted Net Operating Free Cash Flow amounted to €257 million in H1 2019, up 14% compared to €226 million in H12018 which included the impact from the temporary vitamin effect of €275 million EBITDA.
§ Operating Working Capital and Total Working Capital end of June 2019 stayed in line with end of H1 2018. although aspercentage of sales increased versus H1 2018 due to exchange rates, the re-consolidation of Andre Pectin and theabsence of the temporary vitamin effect in 2019. The cash impact from working capital was -€239 million in H1 2019versus -€504 million in the comparable period last year.
Condensed Cash Flow and (Operating) Working Capital End of period Total Working Capital %
in € million H1 2019 H1 2018 Q2 2019 Q2 2018Cash provided by Operating Activities 507 503 306 193
- Cash from APM adjustments 23 41 12 22
- Cash from capital expenditures* -269 -301 -119 -129
- Cash from drawing rights -4 -17 -2 -14
Adjusted Net Operating Free Cash Flow 257 226 197 72
Operating Working Capital 2,361 2,347Average Operating Working Capital as % of Sales 25.8% 23.2%
Operating Working Capital as % of Sales - end of period 25.9% 24.9%
Total Working Capital 1,823 1,807
Average Total Working Capital as % of Sales 20.7% 18.3%
Total Working Capital as % of Sales - end of period 20.0% 19.2%
19.2
26.8
13.8
20.0
27.8
15.2
-
10.0
20.0
30.0
Total DSM Nutrition Materials
H1 2018 H1 2019

Page 16
Net Debt and ROCEOverview
§ Net debt was €589 million, up from €113 million at the end of 2018, due to the inclusion of IFRS16 and the acquisitionof Andre Pectin.
§ ROCE of underlying business is down 70bps to 13.1% versus H1 2018, mainly driven by higher capital employed in H12019 (due to IFRS16, FX effect, M&A and higher working capital) and higher H1 2019 D&A. Excl. IFRS16, H1 2019 ROCEis 13.4%.
Net debt (€ million) ROCE% (underlying business) – incl IFRS16
13.8 15.4
21.6
13.115.1
20.0
-
15.0
30.0
Total DSM Nutrition Materials
H1 2018 H1 2019
113
589
0
400
800
End of Year 2018 End of H1 2019

Page 17
Continued step up in SustainabilityH1 2019 highlights
Planet – DSM further improved the environmental impact of its own operations:§ Well on track to meet this year’s targets regarding greenhouse gas, energy efficiency and purchased renewable electricity§ Increase in sales from Brighter Living Solutions (i.e. products and services with a better environmental (ECO+) and/or
social (People+) benefit than the mainstream solutions)§ DSM now has the highest rankings in both MSCI and Sustainalytics
People – DSM continues its inclusion & diversity journey:§ 43% of DSM’s Executive committee is female, following the appointment of the new Chief Innovation Officer§ 63% of DSM’s Executives are from under-represented nationalities
Page 18
Outlook 2019
§ DSM maintains its full year outlook as provided at Q1 2019: DSM expects to deliver a full year 2019high single digit increase in Adjusted EBITDA compared to prior year Underlying Adjusted EBITDA(pre-temporary vitamin effect), together with an improvement in Underlying Adjusted NetOperating Free Cash Flow in line with its Strategy 2021 targets.
§ This outlook excludes the impact of IFRS 16.
Page 19
Share Buy-Back program update
§ On 1 April 2019, DSM commenced its ordinary share repurchase program of an aggregate marketvalue of €1 billion, with the intention to reduce its issued capital, as first announced on 14 February2019. This program is in addition to the regular repurchase programs to cover commitments undershare-based compensation plans and the stock dividend. As per 30 June DSM has repurchased 2.6million shares for a total consideration of €265 million; 2 million shares relate to the regularrepurchase programs and 0.6 million shares relate to the €1 billion share buy-back program.
Page 20
This presentation may contain forward-looking statements with respect to DSM’s future performance and position. Such statementsare based on current expectations, estimates and projections of DSM and information currently available to the company. DSMcautions readers that such statements involve certain risks and uncertainties that are difficult to predict and therefore it should beunderstood that many factors can cause actual performance and position to differ materially from these statements. DSM has noobligation to update the statements contained in this presentation, unless required by law.
More details on DSM’s H1 2019 performance can be found in the H1 2019 results press release, published together with thispresentation. A more comprehensive discussion of the risk factors affecting DSM’s business can be found in the company’s latestAnnual Report, which can be found on the company's corporate website, www.dsm.com
Safe Harbor Statement


![DSM STRATEGY 2018 Driving Profitable Growth...Version 0; 21 September 2015 Presentation Geraldine Matchett, CFO [classification: secret] 4 November 2015 Feike Sijbesma - CEO [Draft](https://static.fdocuments.us/doc/165x107/5ec63a70c4135647de3cb69c/dsm-strategy-2018-driving-profitable-growth-version-0-21-september-2015-presentation.jpg)